HF Radar (UAF)#
hfradar
See the full dataset page for more information: HF Radar (UAF)
Map of HF Radar Data Areas#
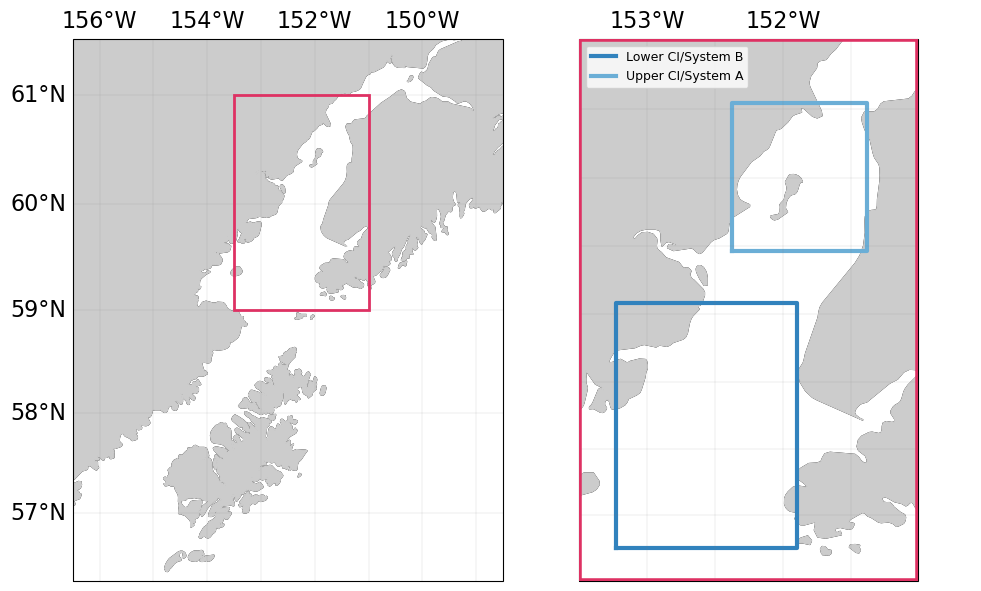
Fig. 56 Map of HF Radar areas#
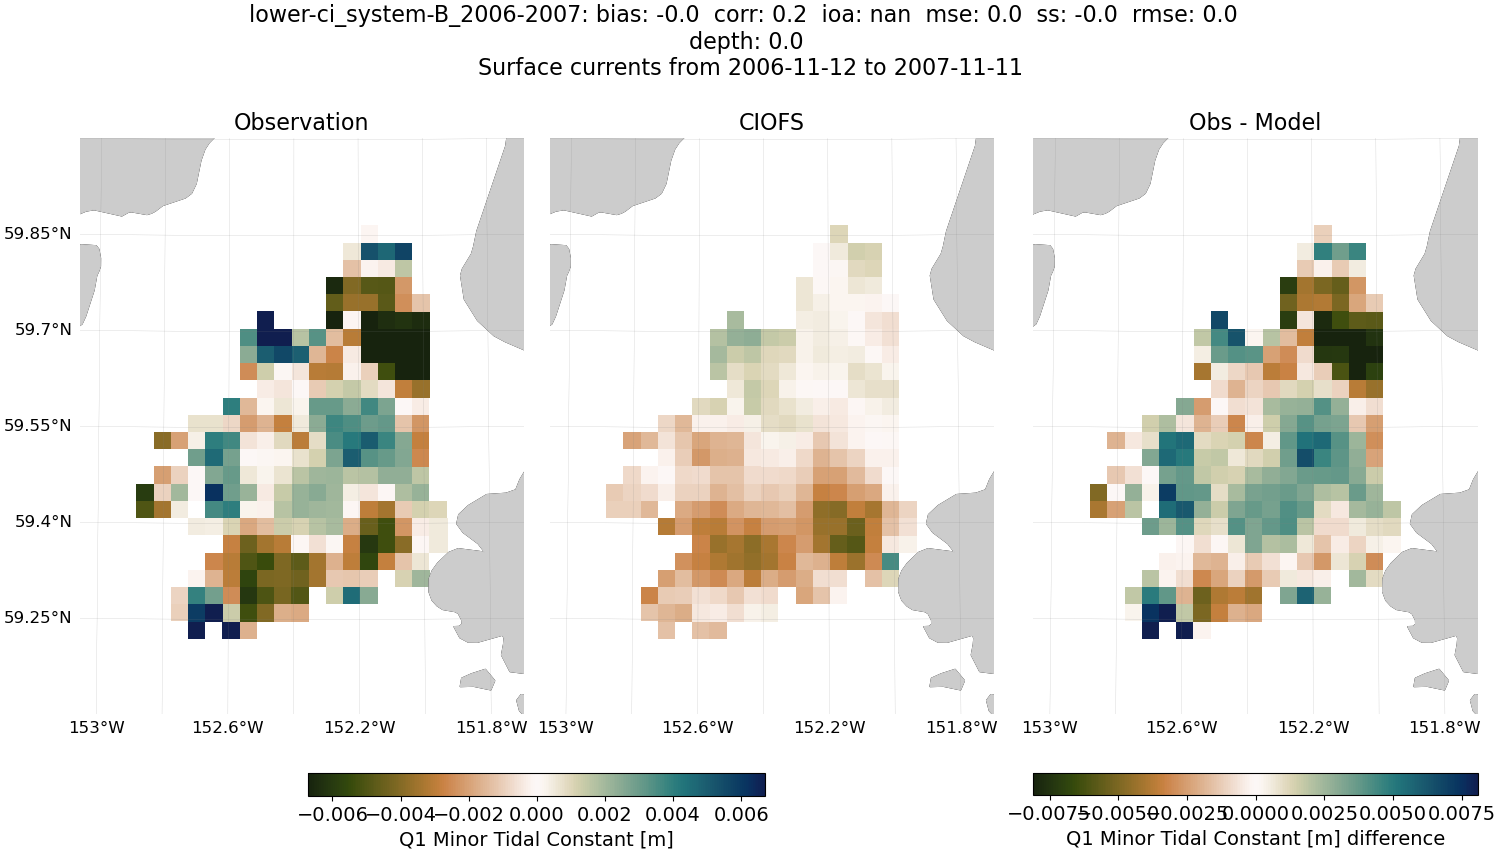
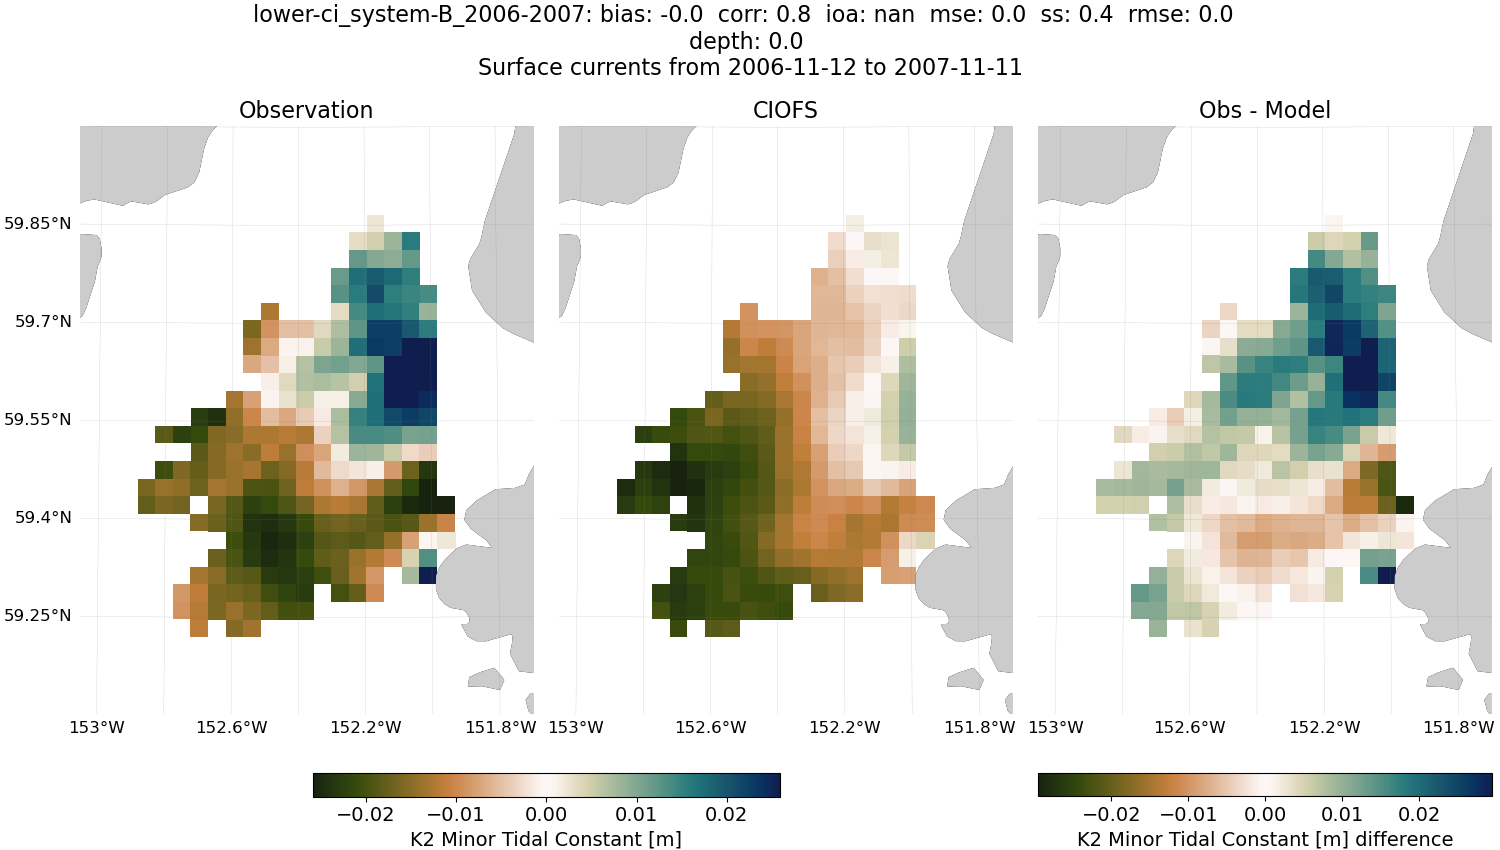
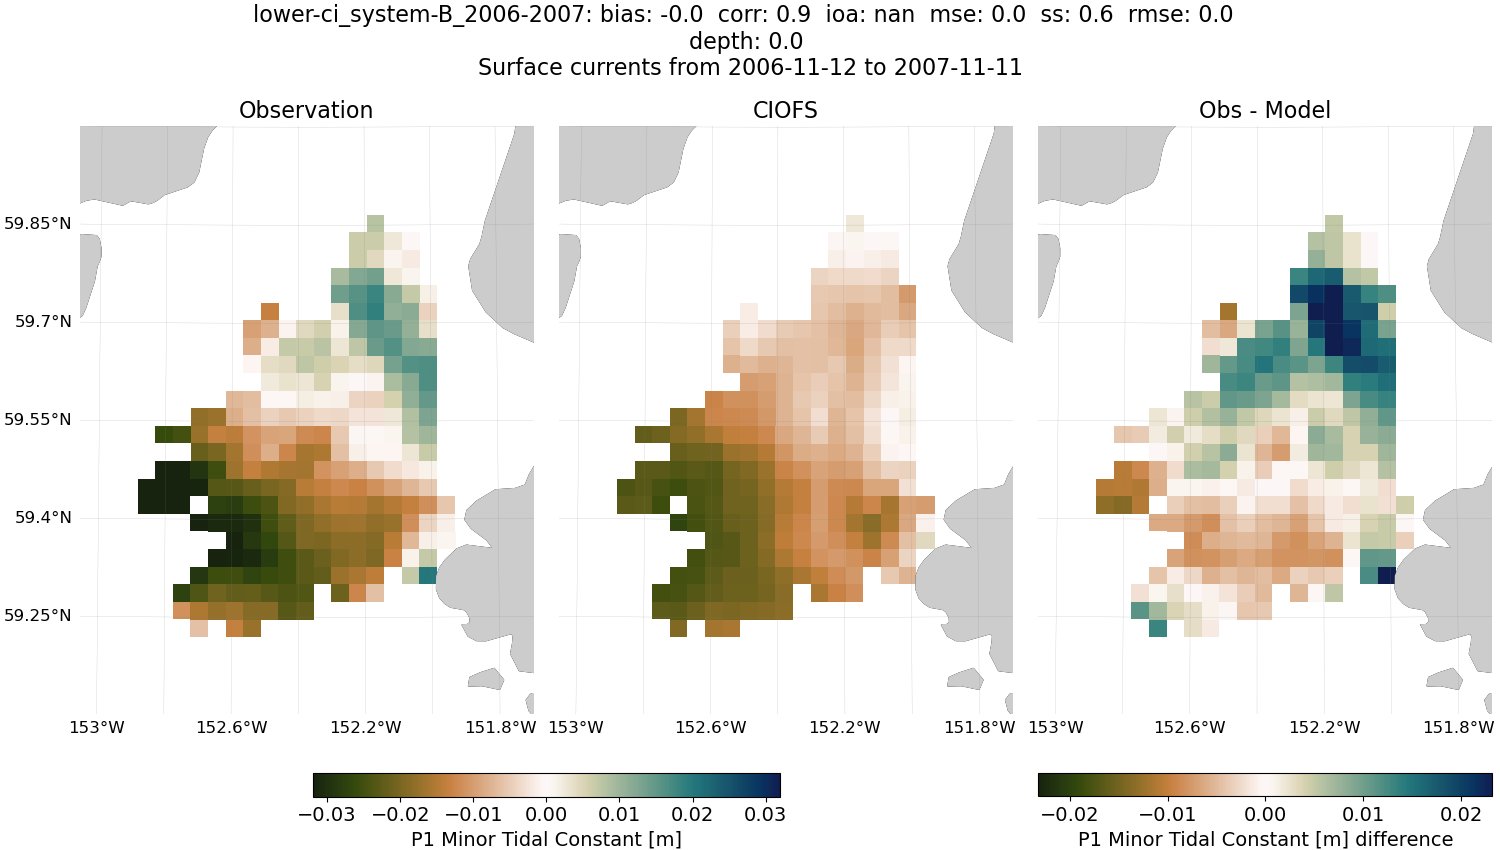
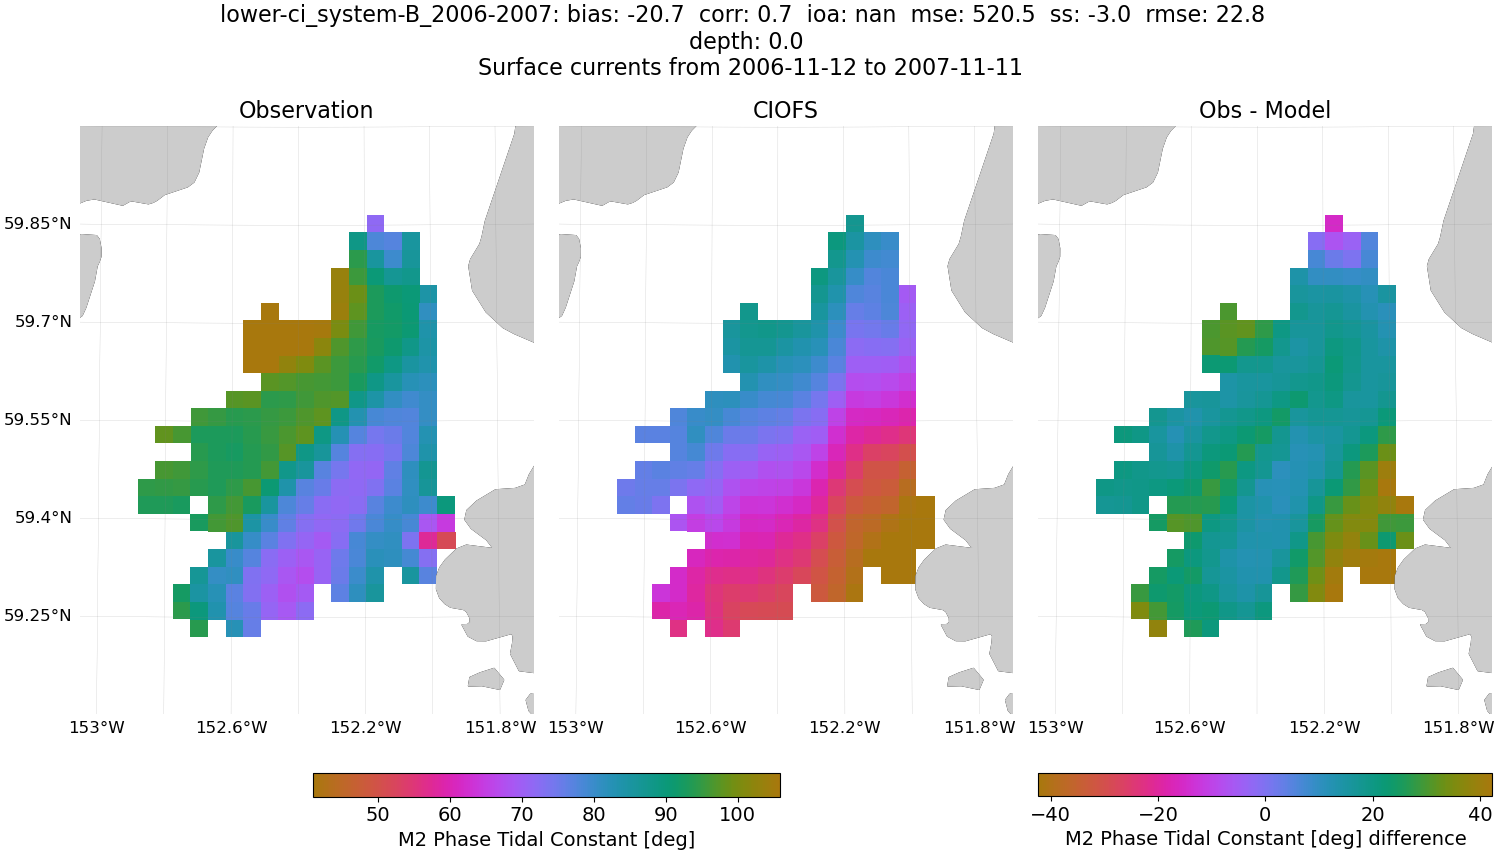
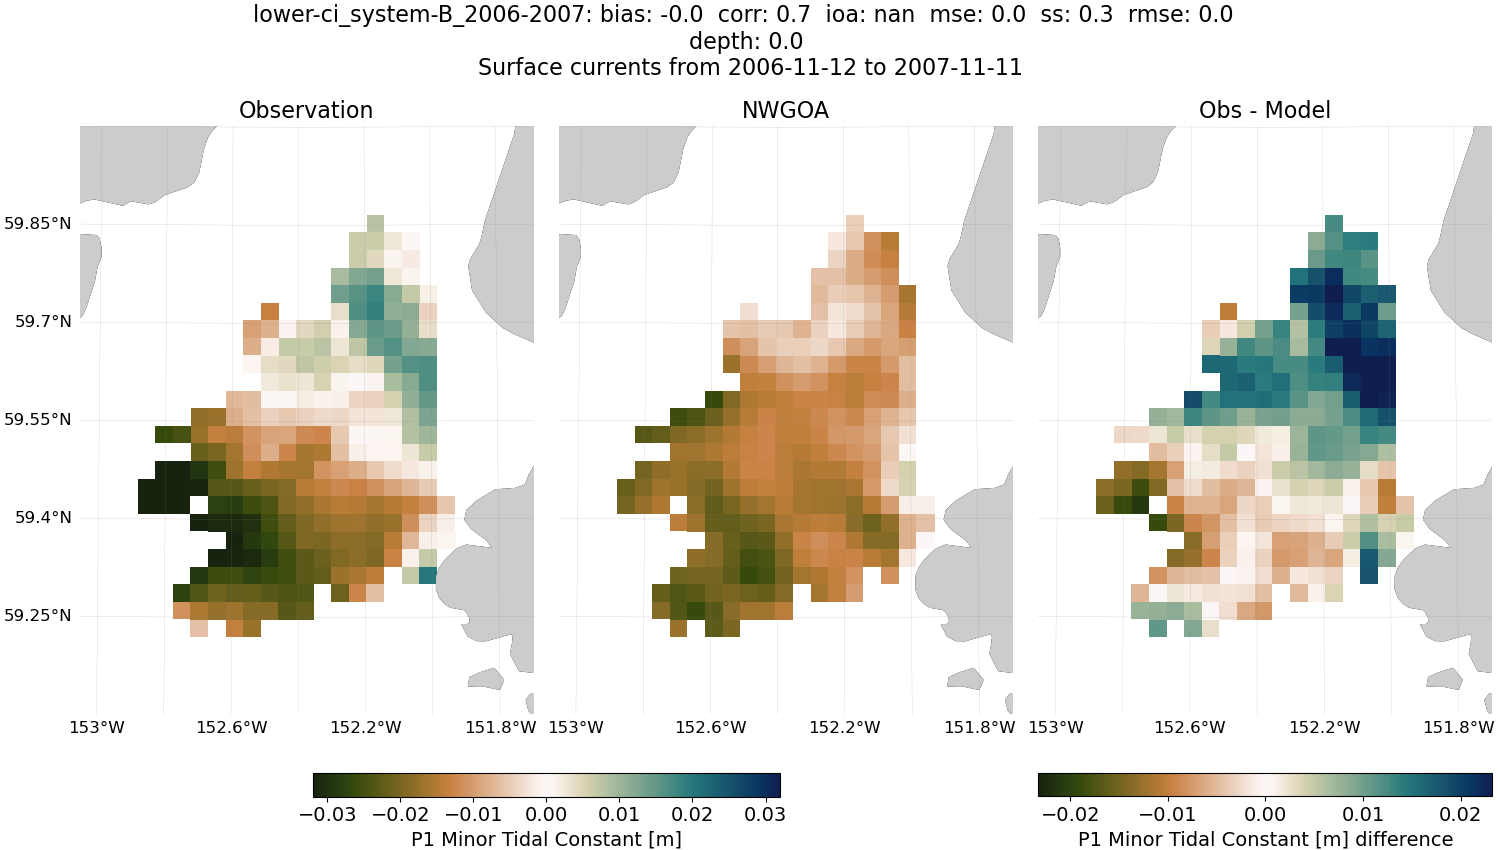
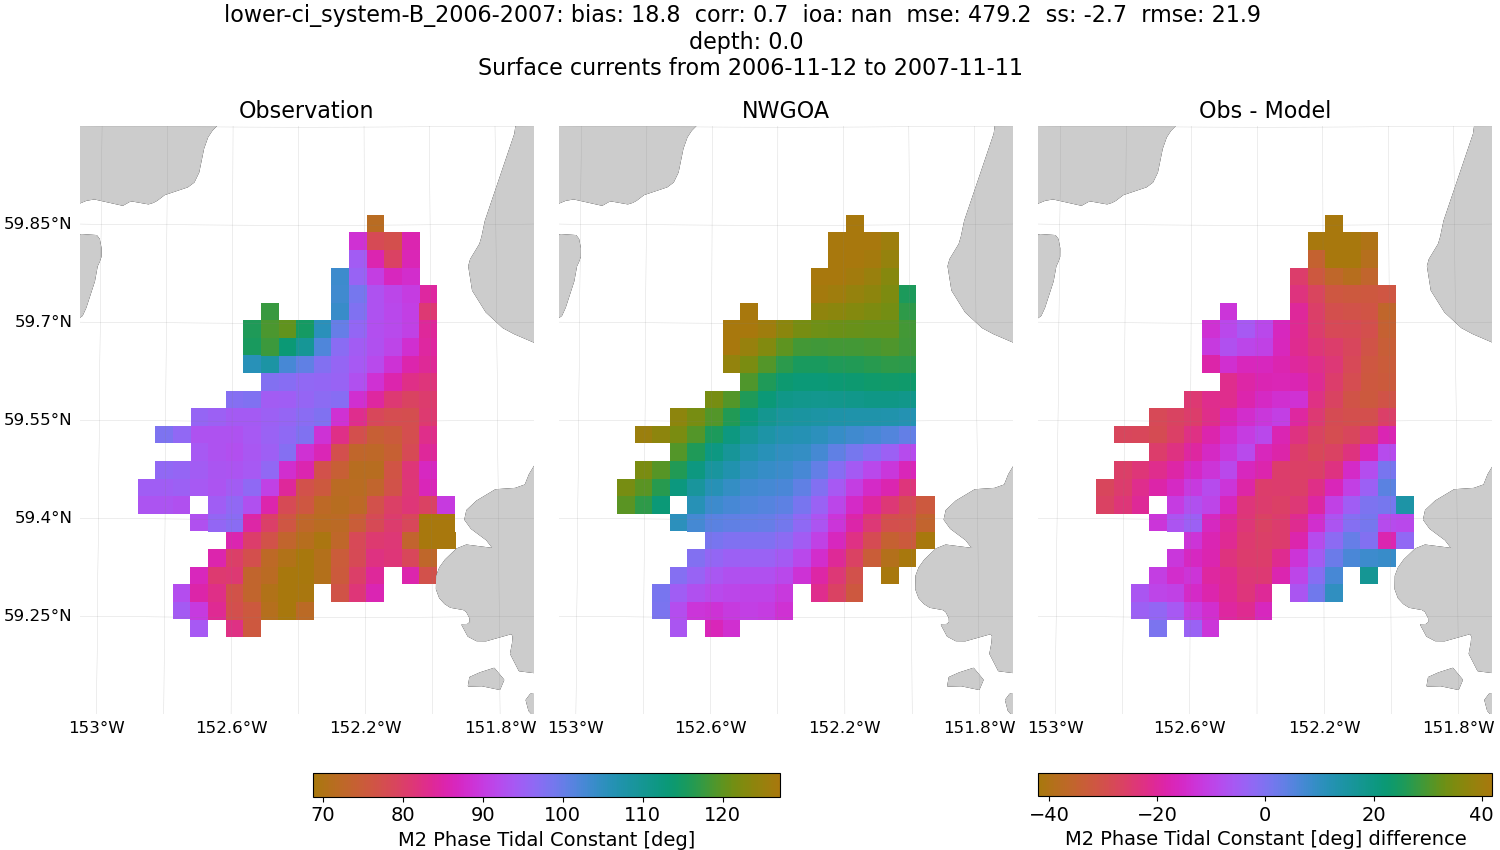
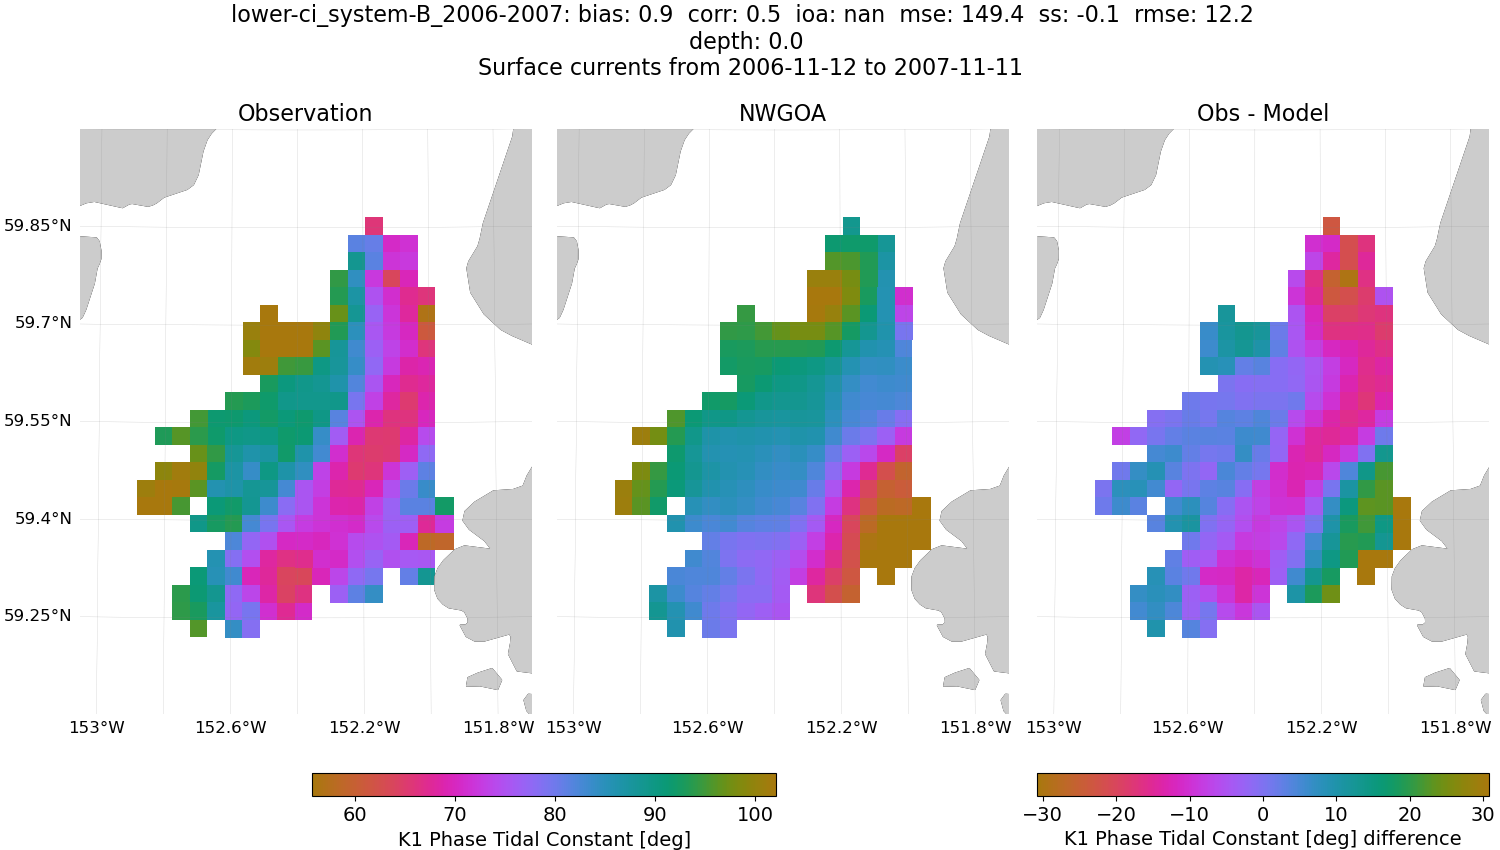
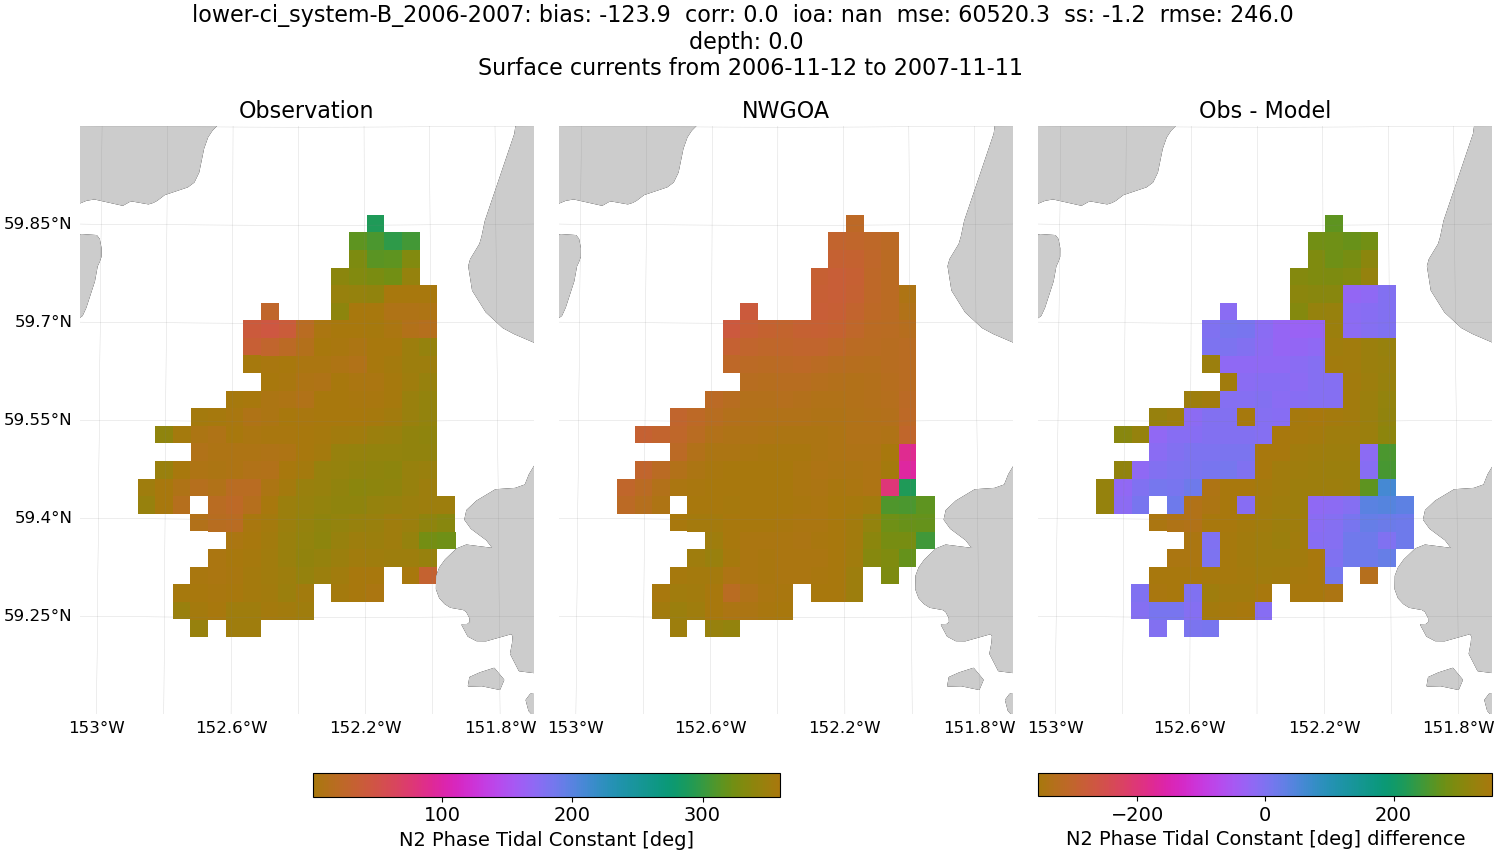
lower-ci_system-B_2006-2007#
M2 Tidal Ellipses#
CIOFS#
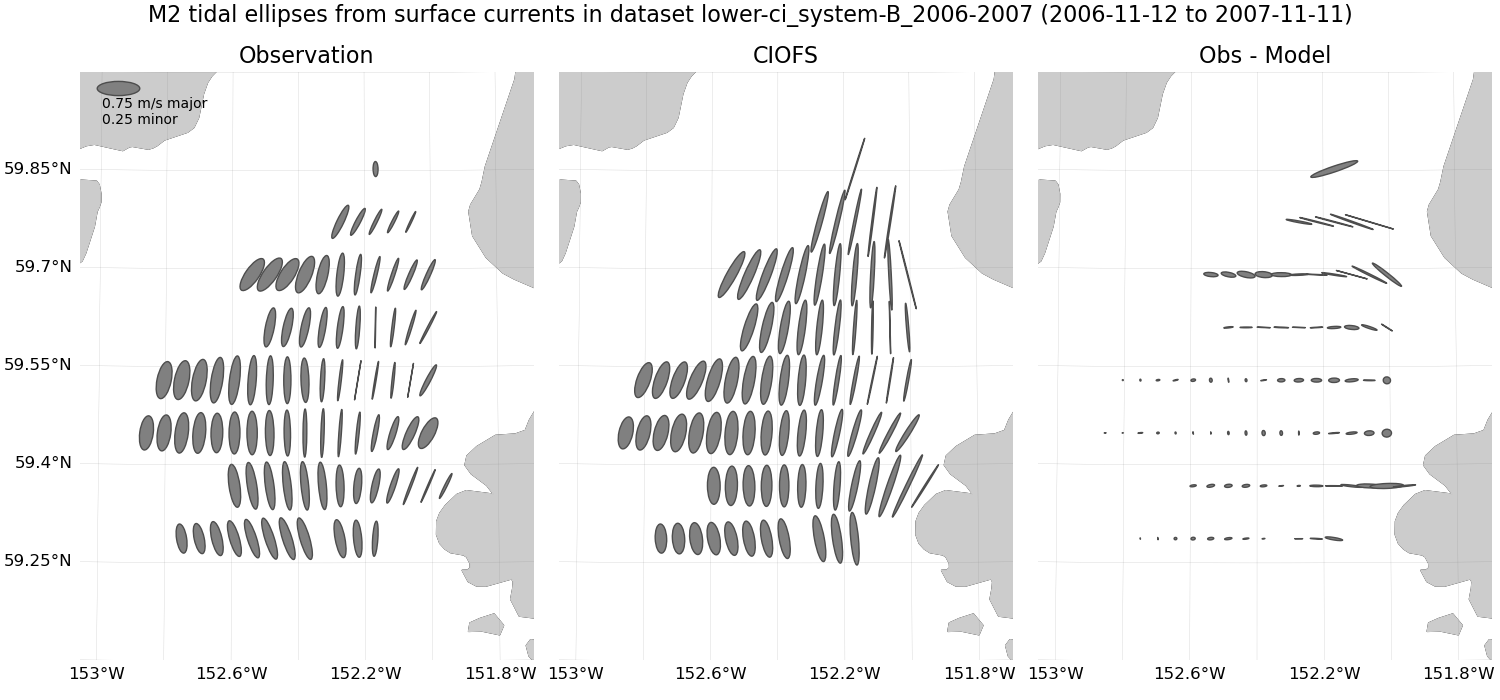
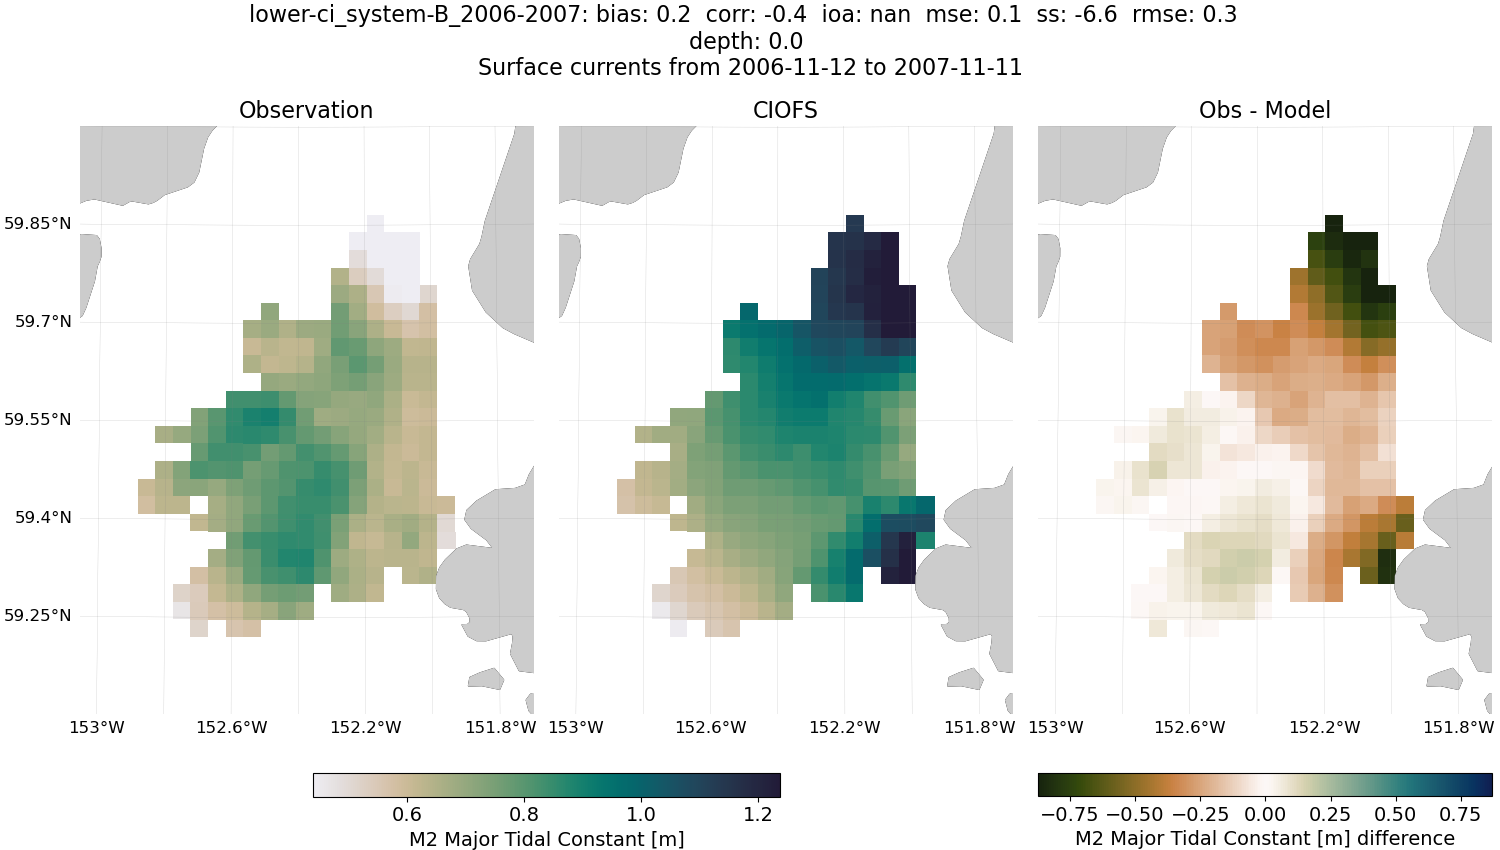
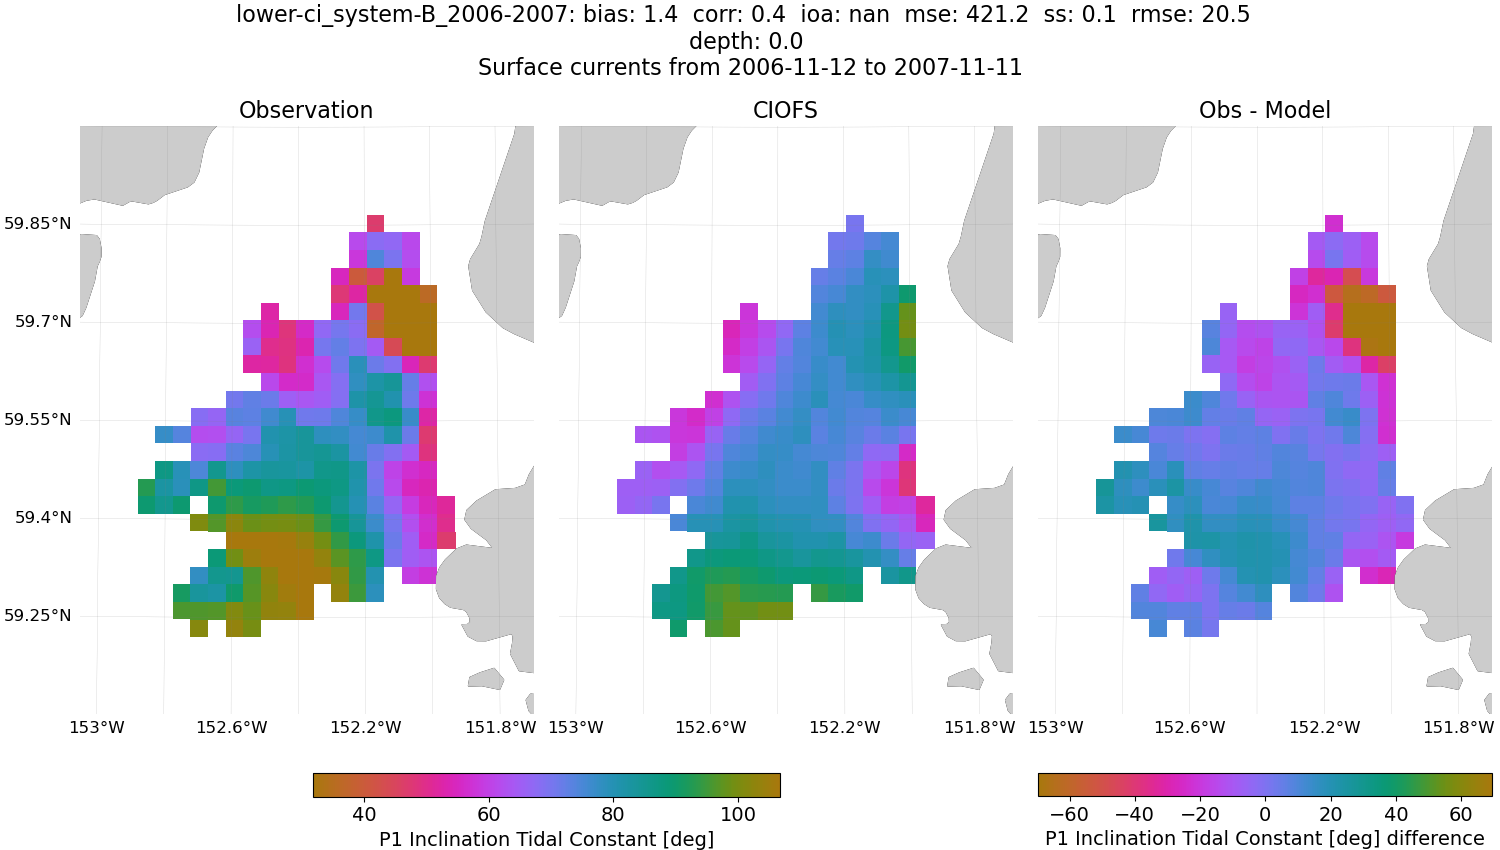
Fig. 57 M2 tidal ellipses from surface currents for CIOFS and dataset lower-ci_system-B_2006-2007#
NWGOA#
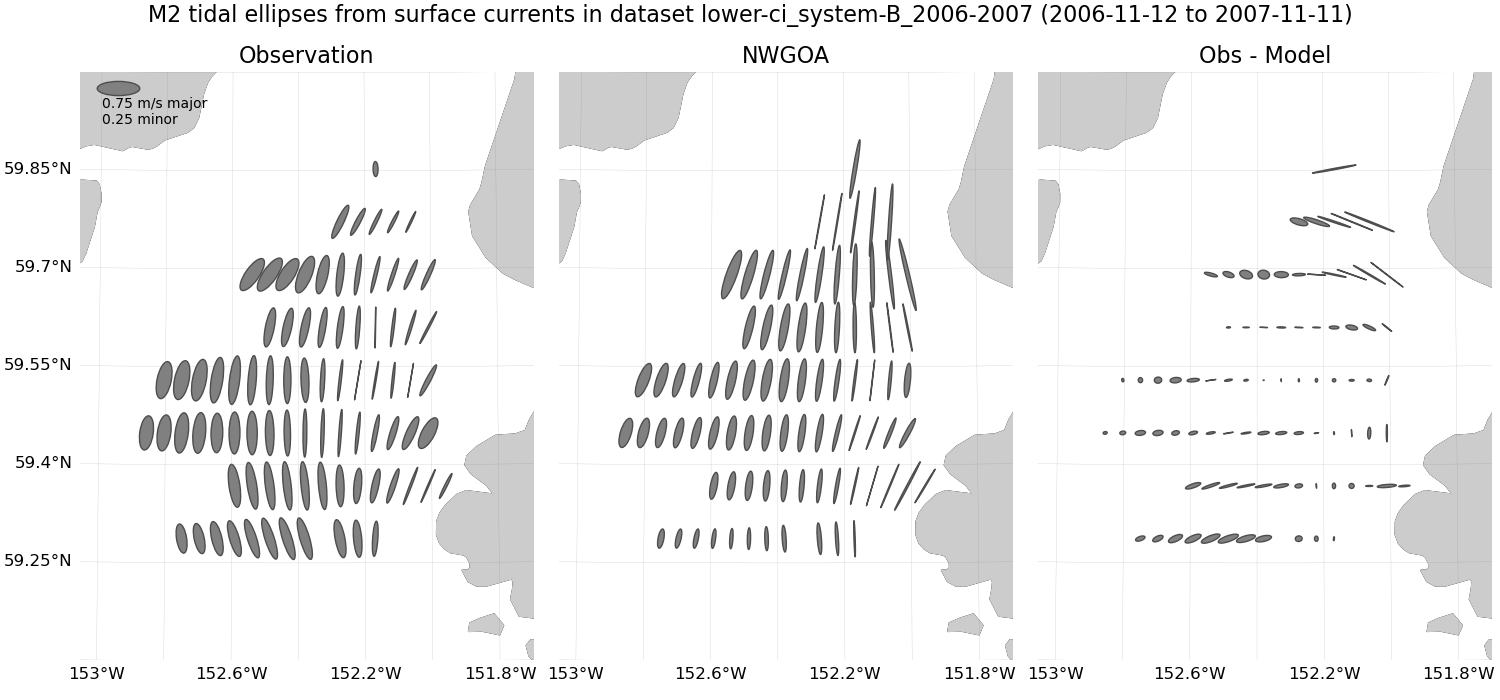
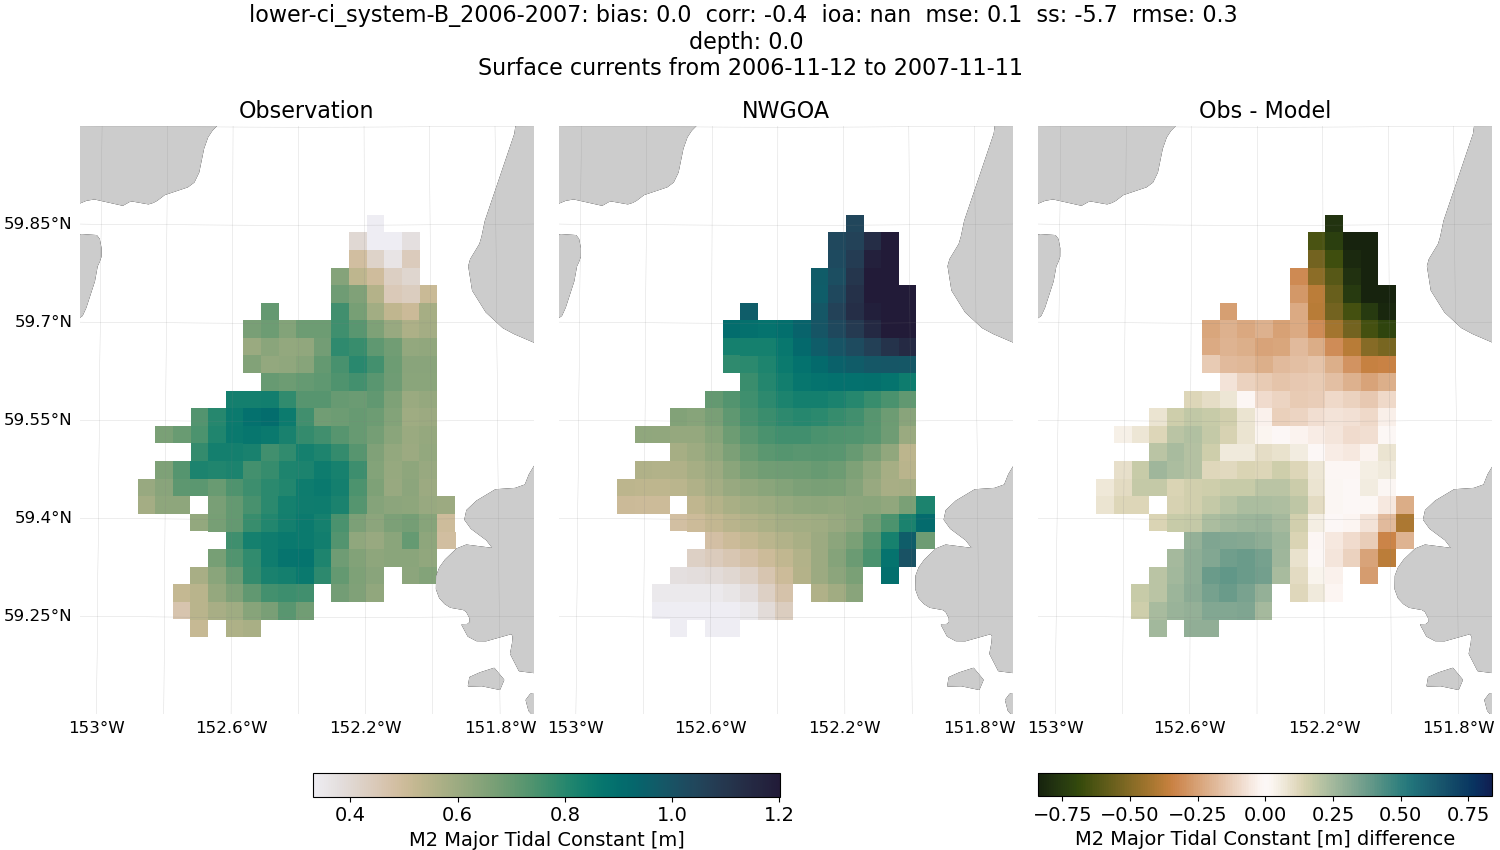
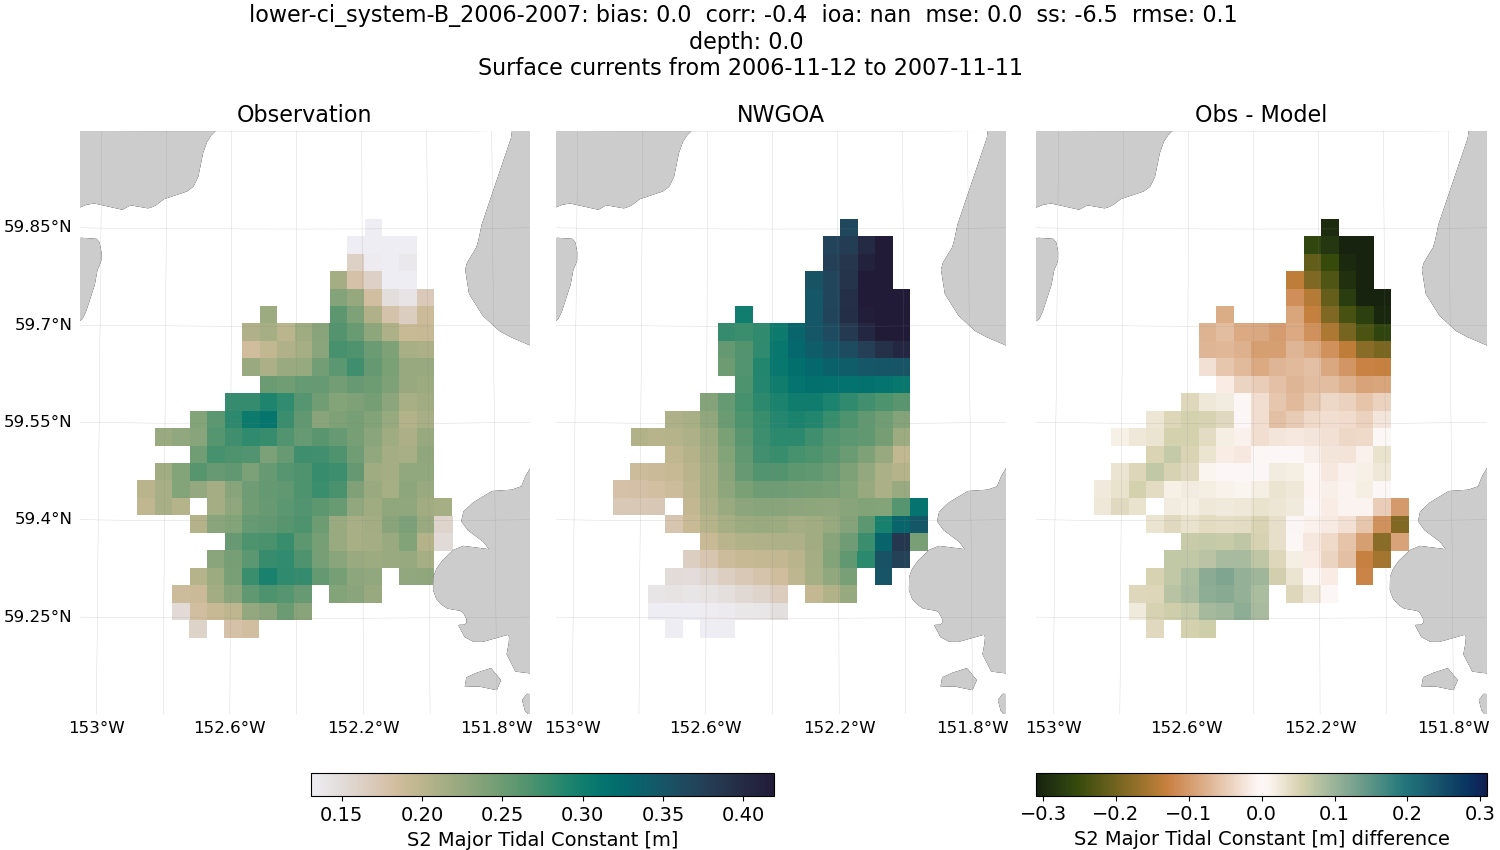
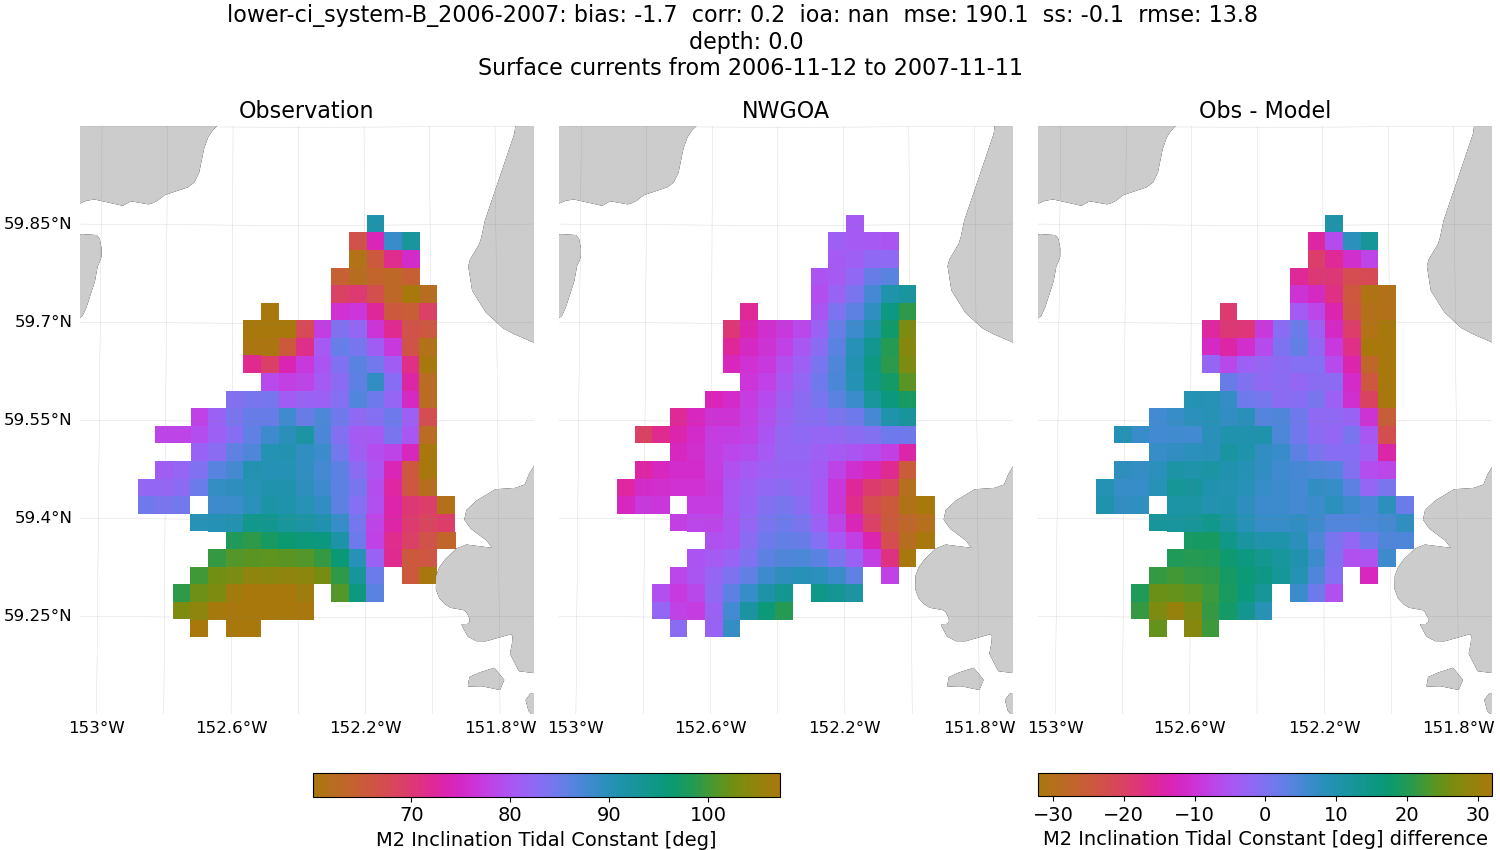
Fig. 58 M2 tidal ellipses from surface currents for NWGOA and dataset lower-ci_system-B_2006-2007#
K1 Tidal Ellipses#
CIOFS#
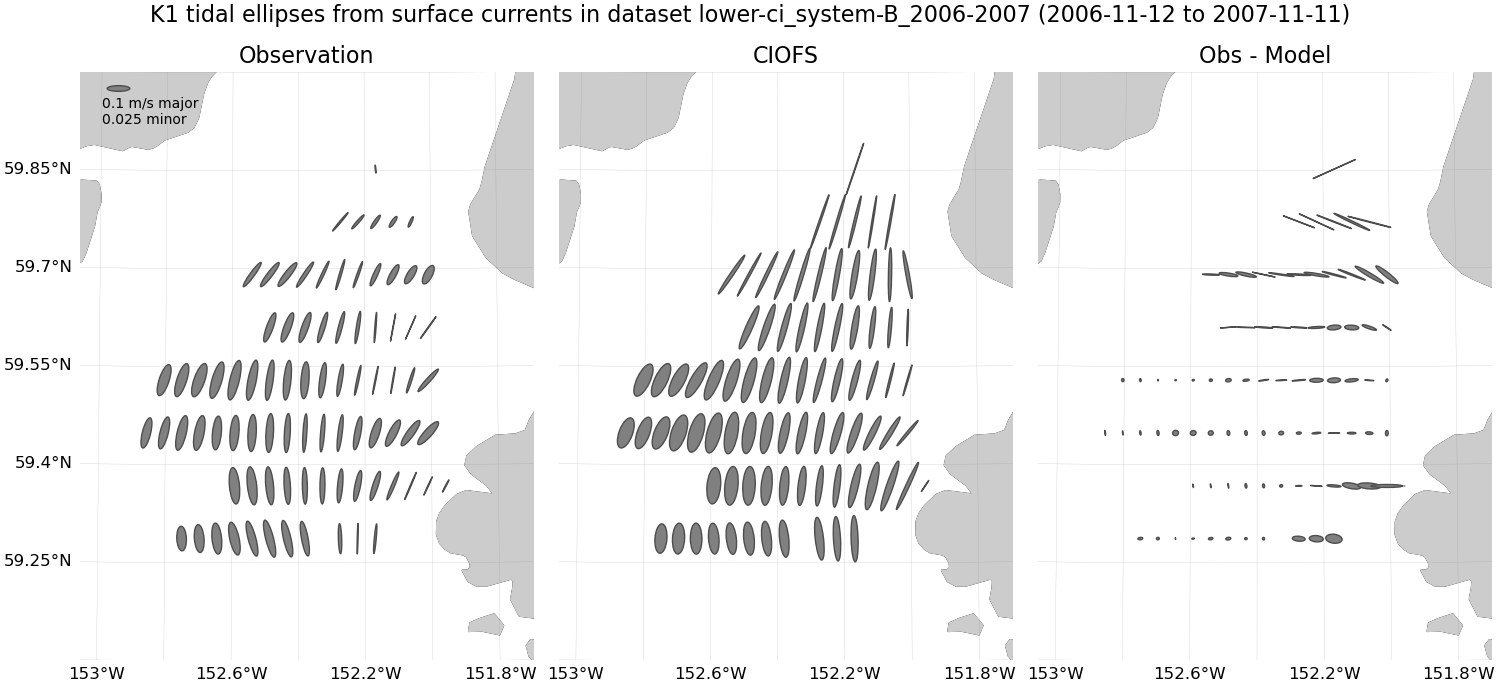
Fig. 59 K1 tidal ellipses from surface currents for CIOFS and dataset lower-ci_system-B_2006-2007#
NWGOA#
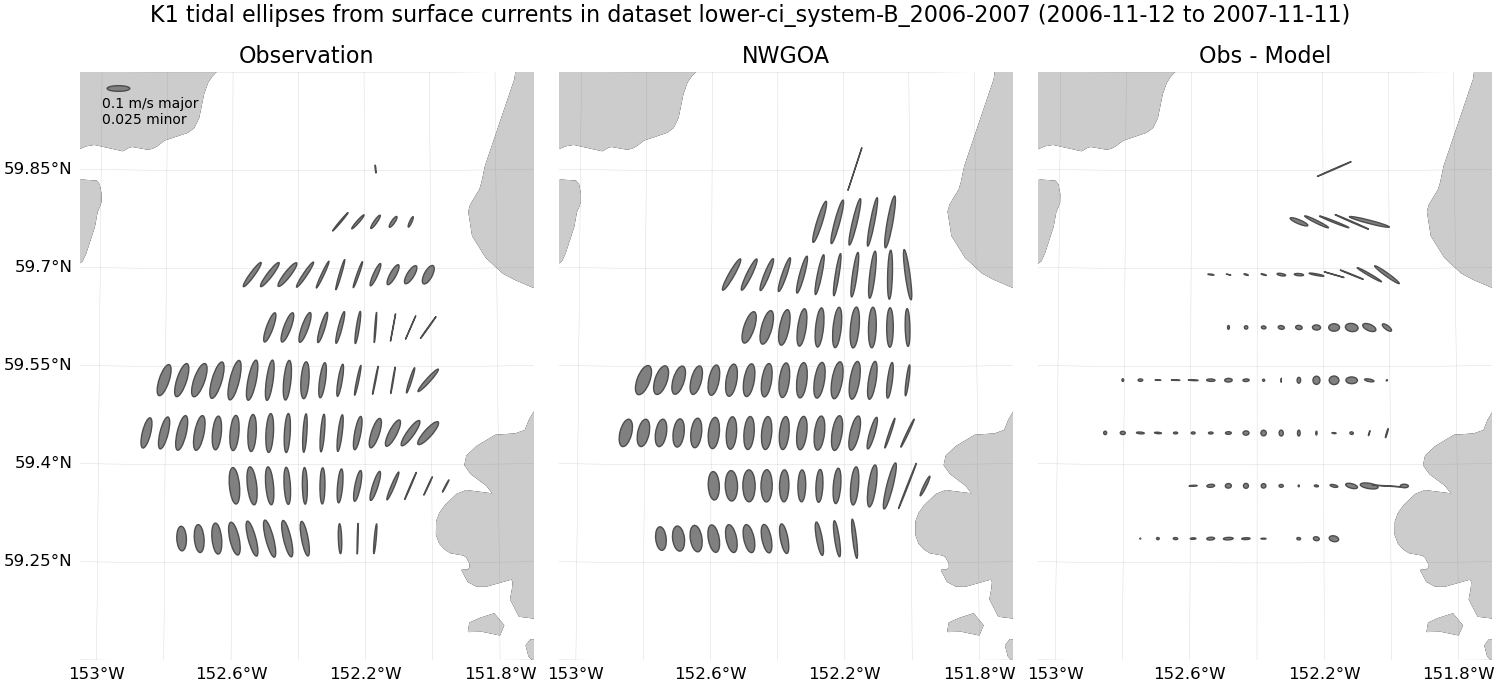
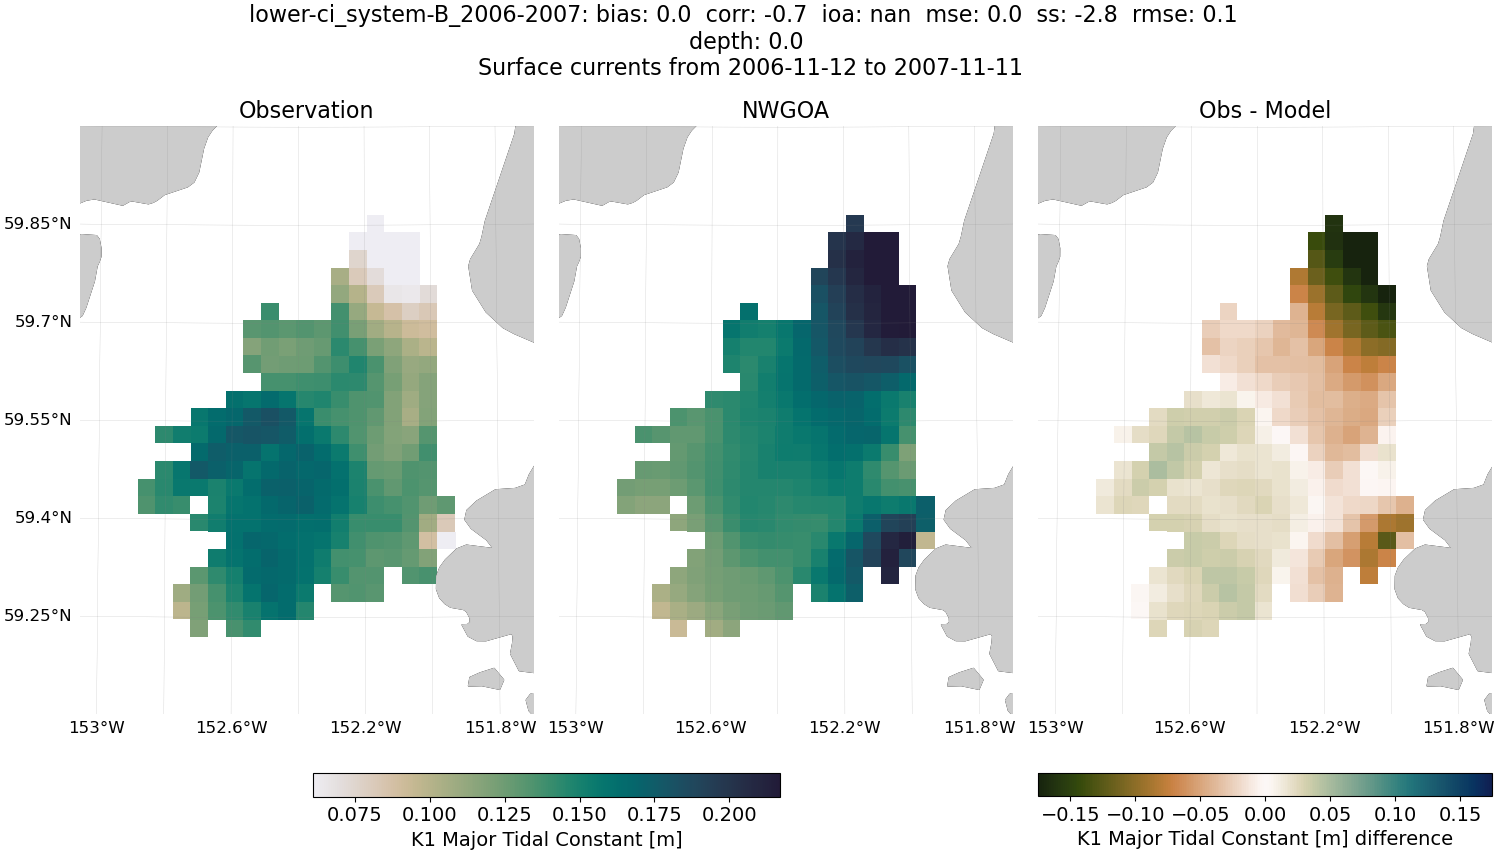
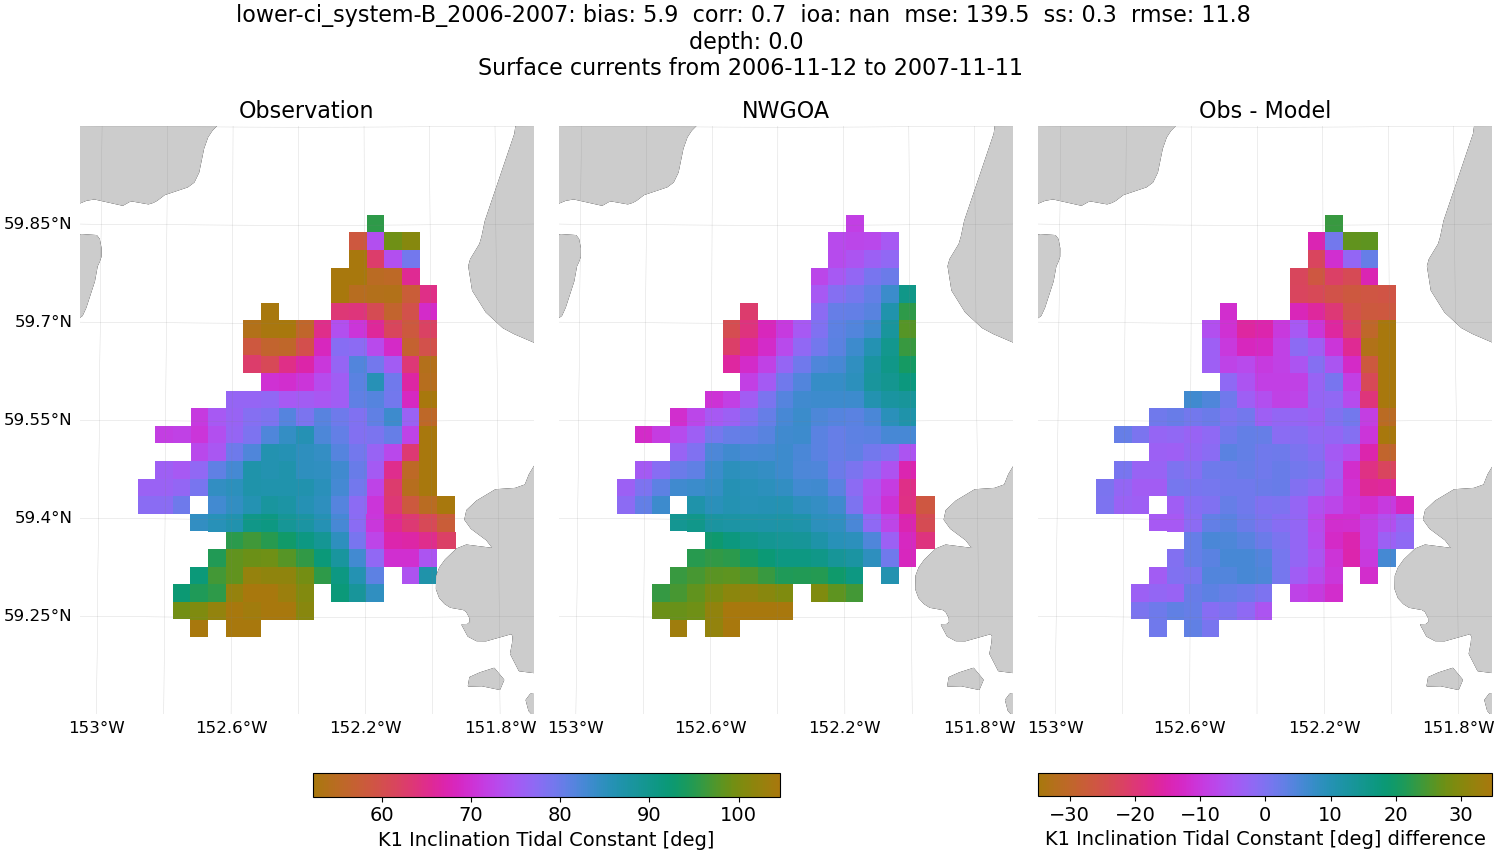
Fig. 60 K1 tidal ellipses from surface currents for NWGOA and dataset lower-ci_system-B_2006-2007#
Subtidal Mean#
CIOFS#
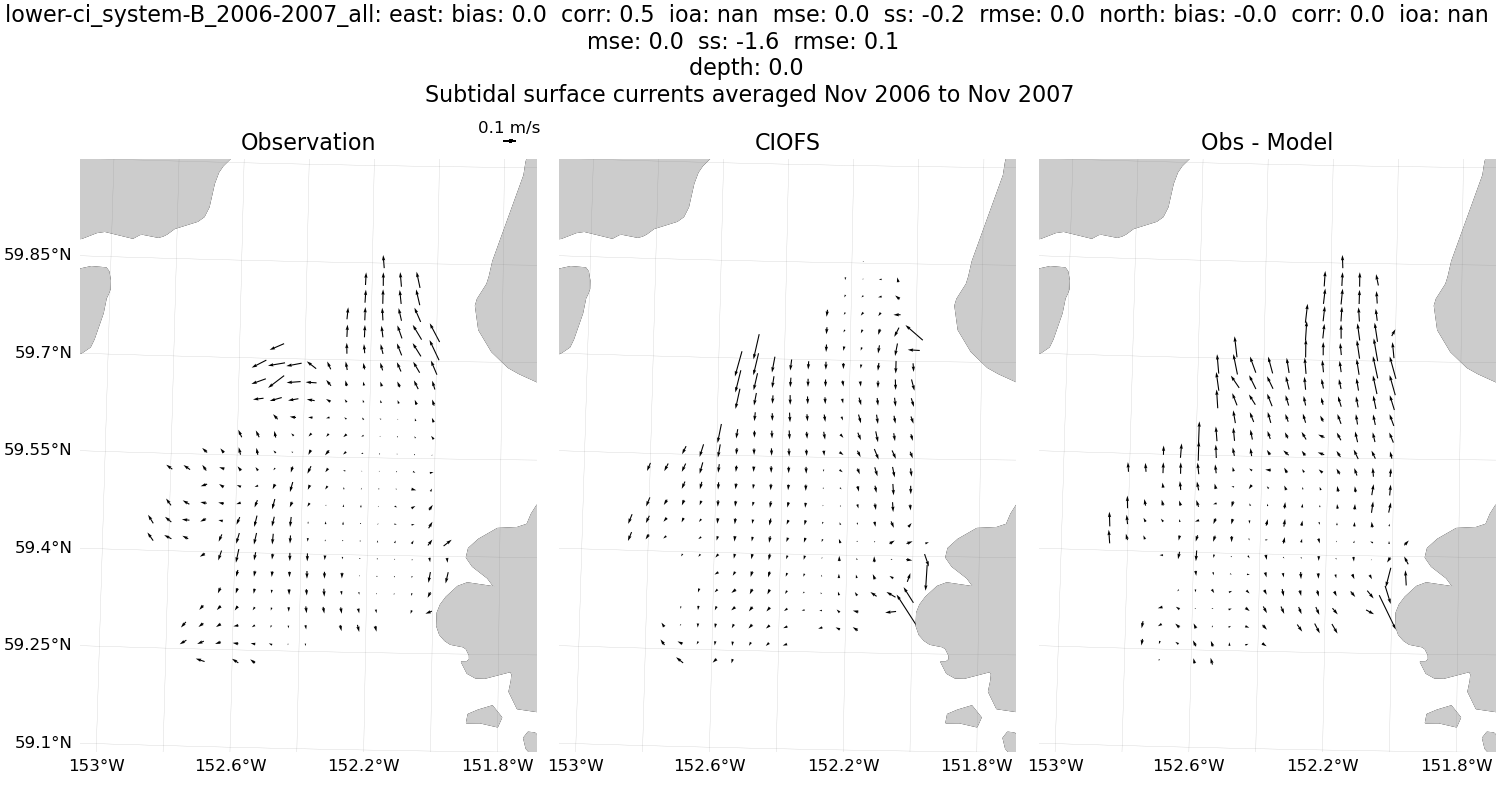
Fig. 61 Subtidal mean from surface currents for CIOFS and dataset lower-ci_system-B_2006-2007#
NWGOA#
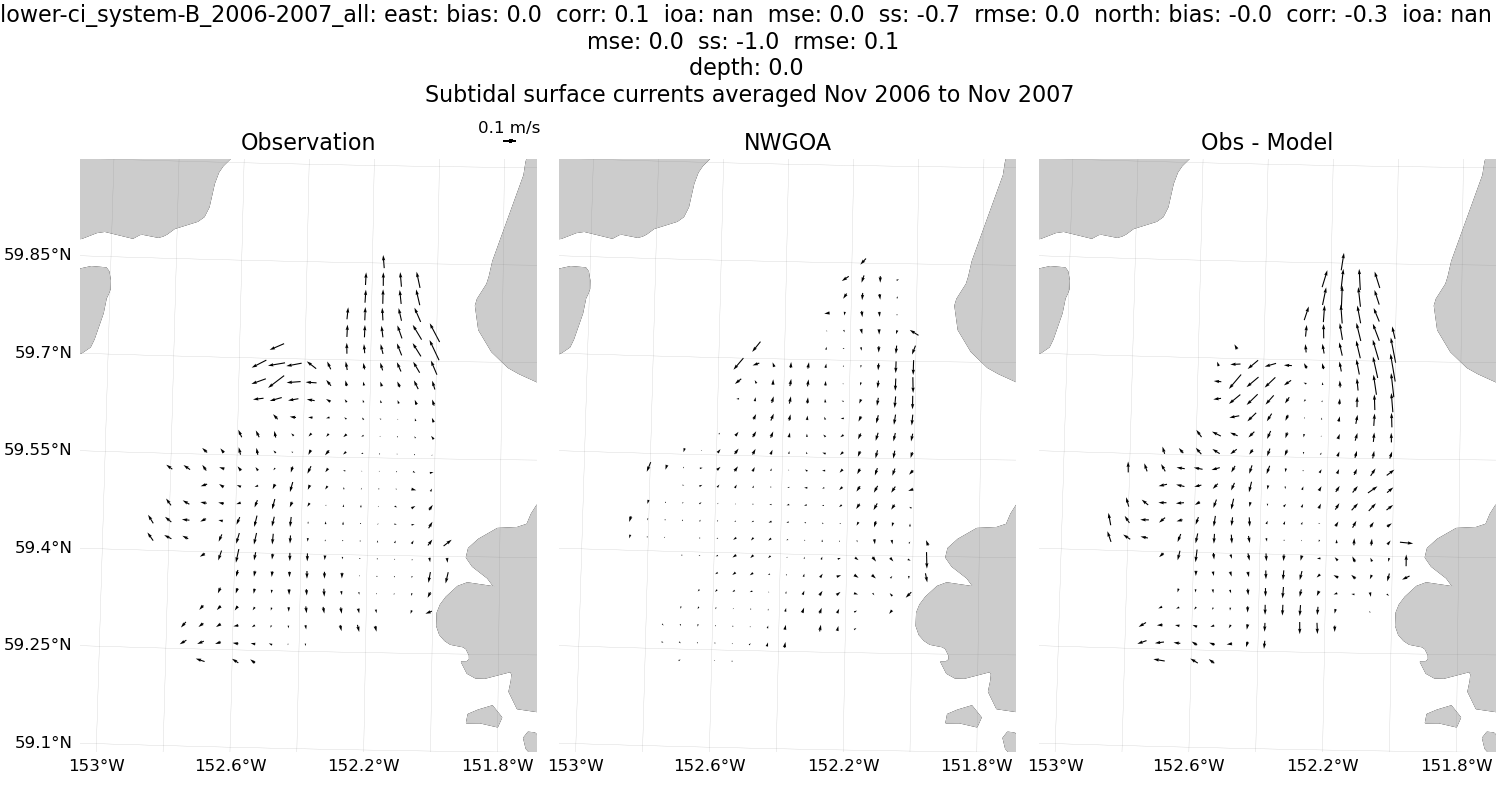
Fig. 62 Subtidal mean from surface currents for NWGOA and dataset lower-ci_system-B_2006-2007#
Hourly#
CIOFS#
Fig. 63 Hourly from surface currents for CIOFS and dataset lower-ci_system-B_2006-2007#
NWGOA#
Fig. 64 Hourly from surface currents for NWGOA and dataset lower-ci_system-B_2006-2007#
Subtidal, 6-Hourly#
CIOFS#
Fig. 65 Subtidal, 6-hourly from surface currents for CIOFS and dataset lower-ci_system-B_2006-2007#
NWGOA#
Fig. 66 Subtidal, 6-hourly from surface currents for NWGOA and dataset lower-ci_system-B_2006-2007#
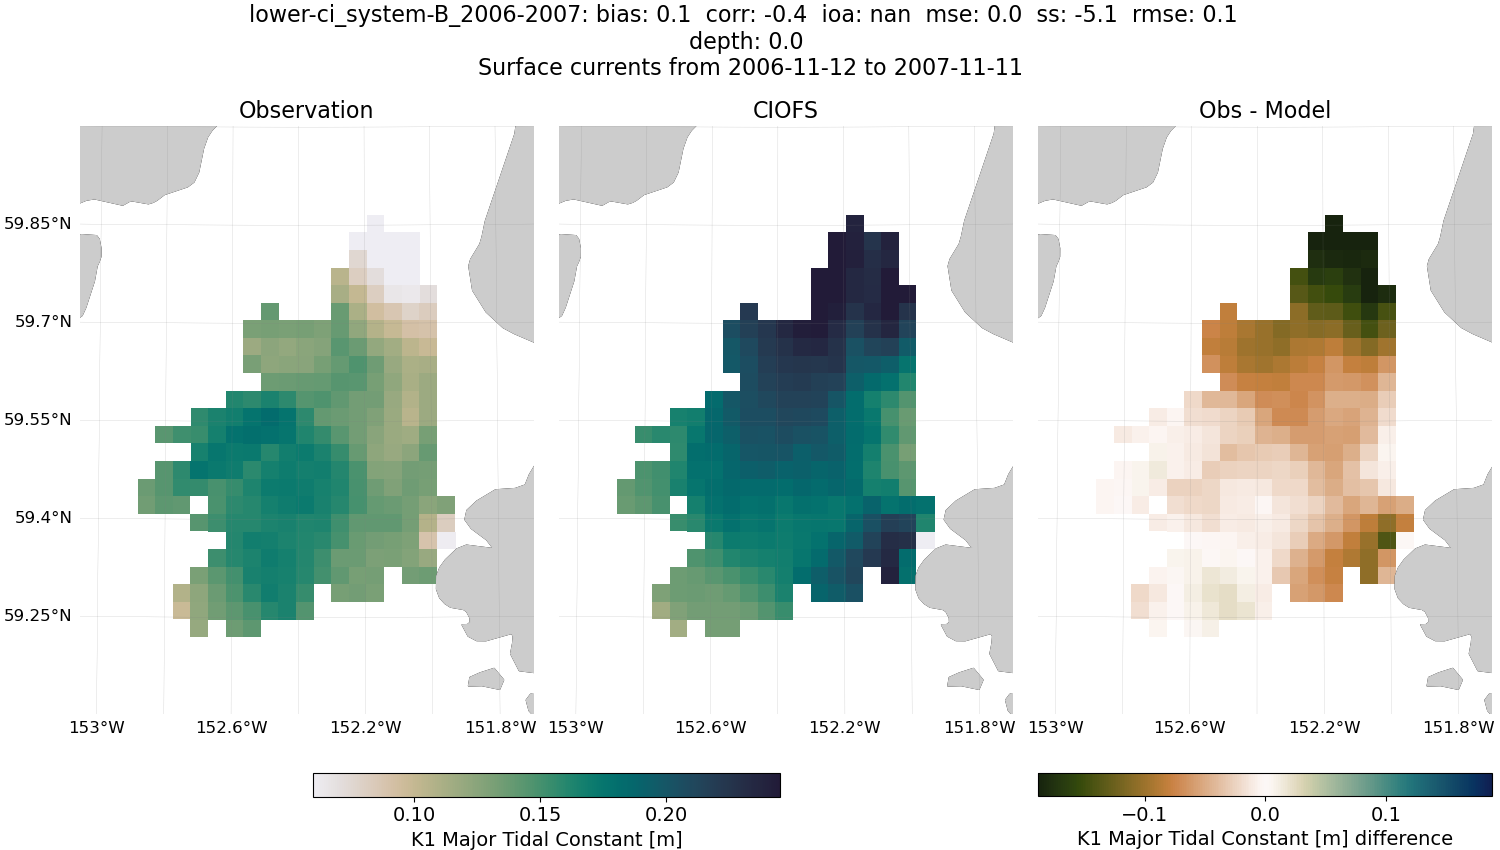
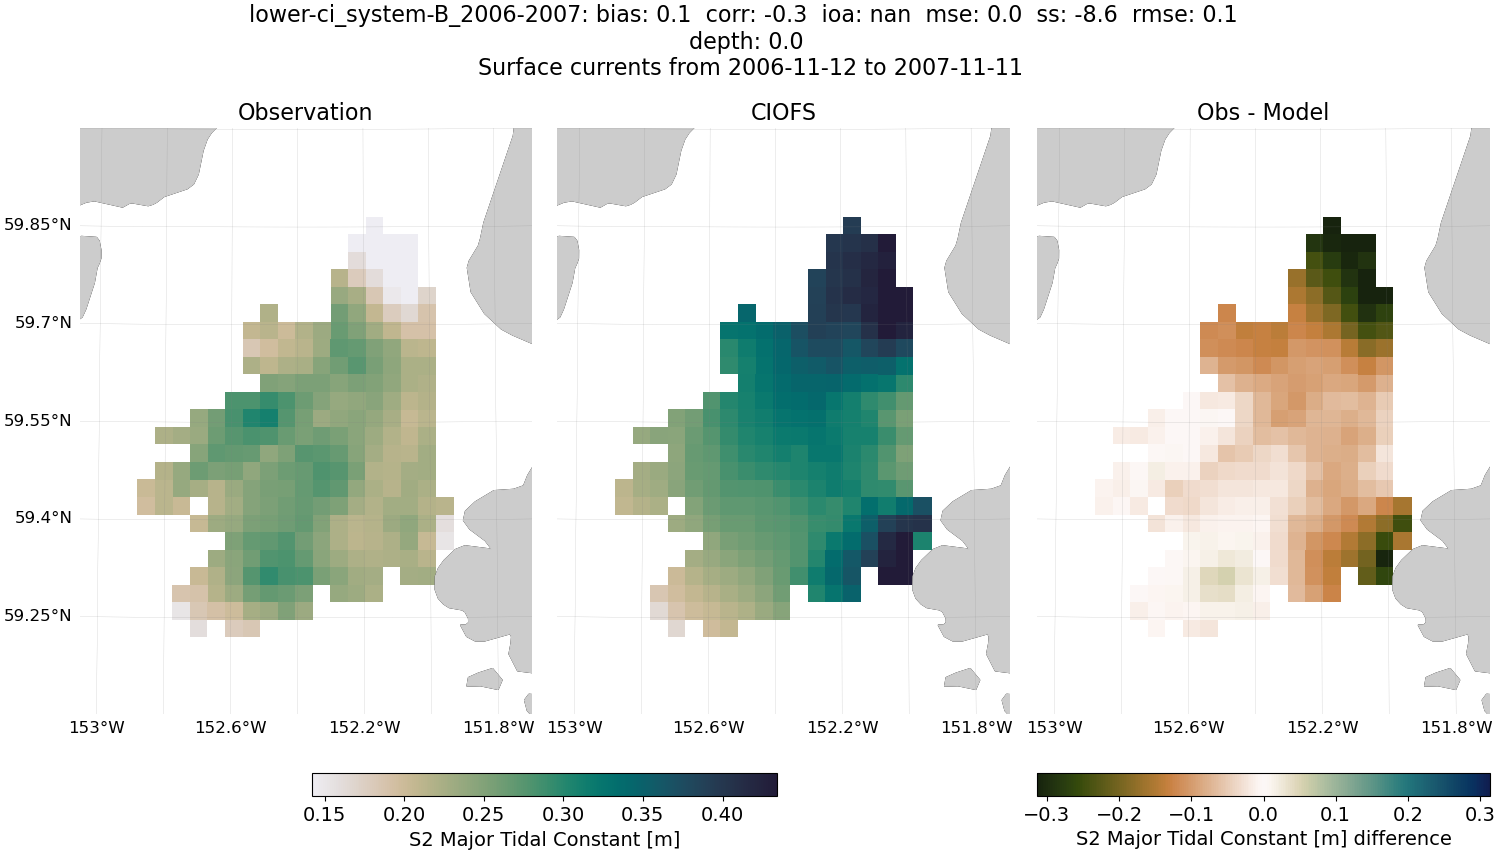
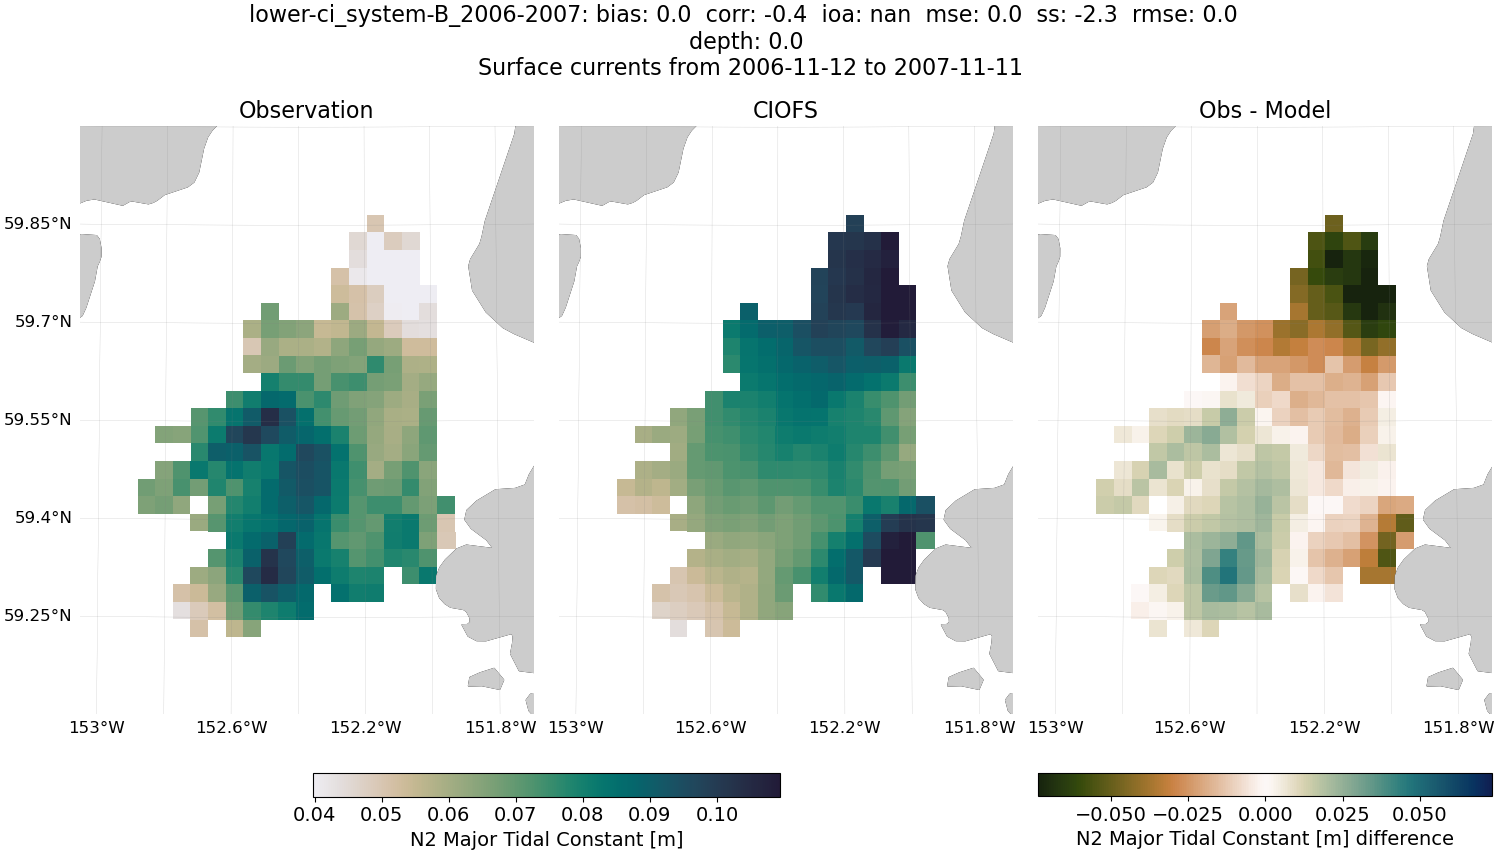
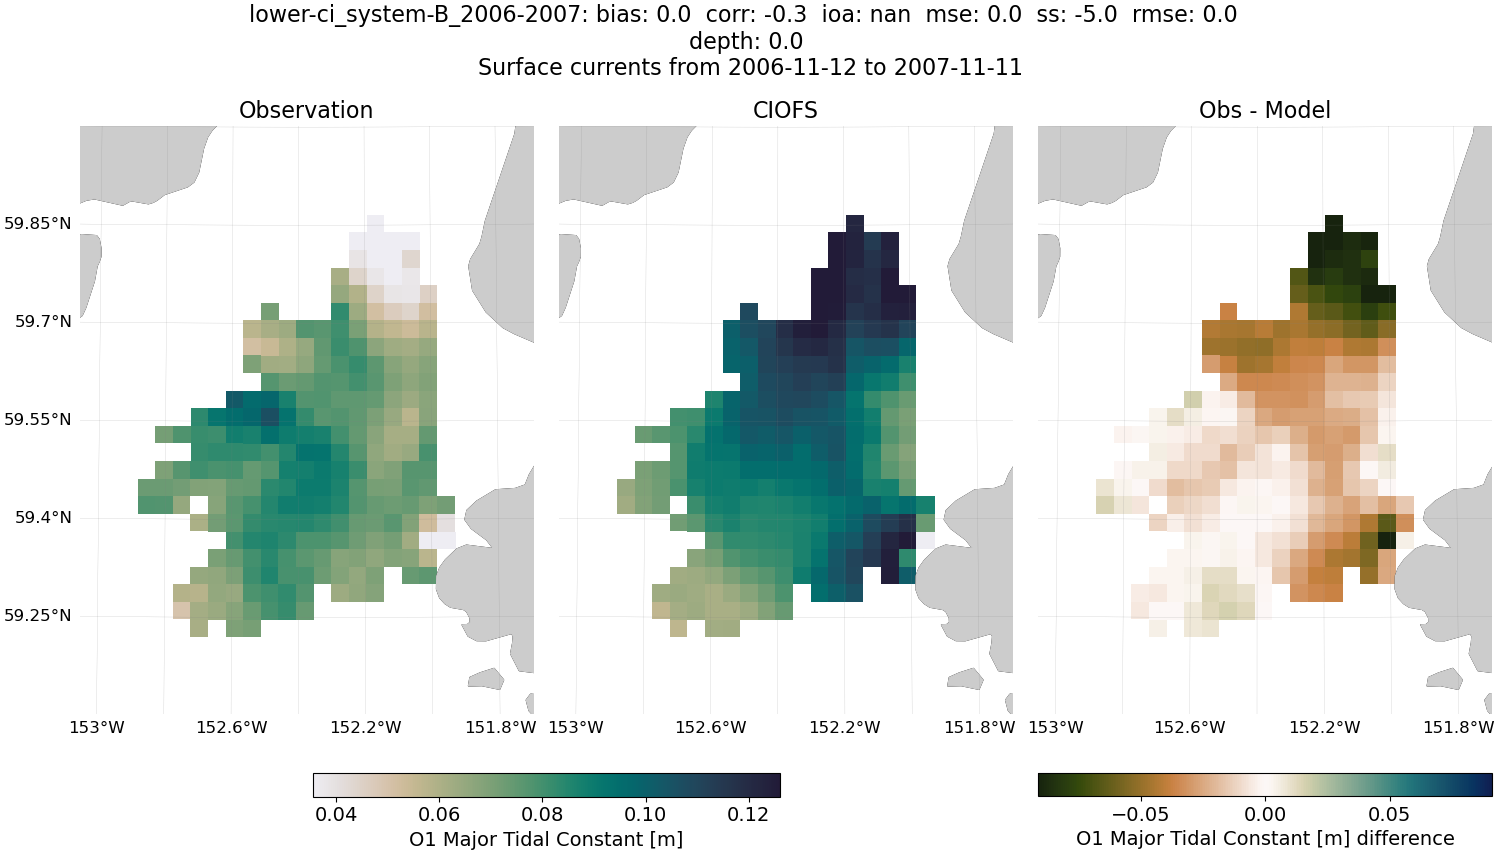
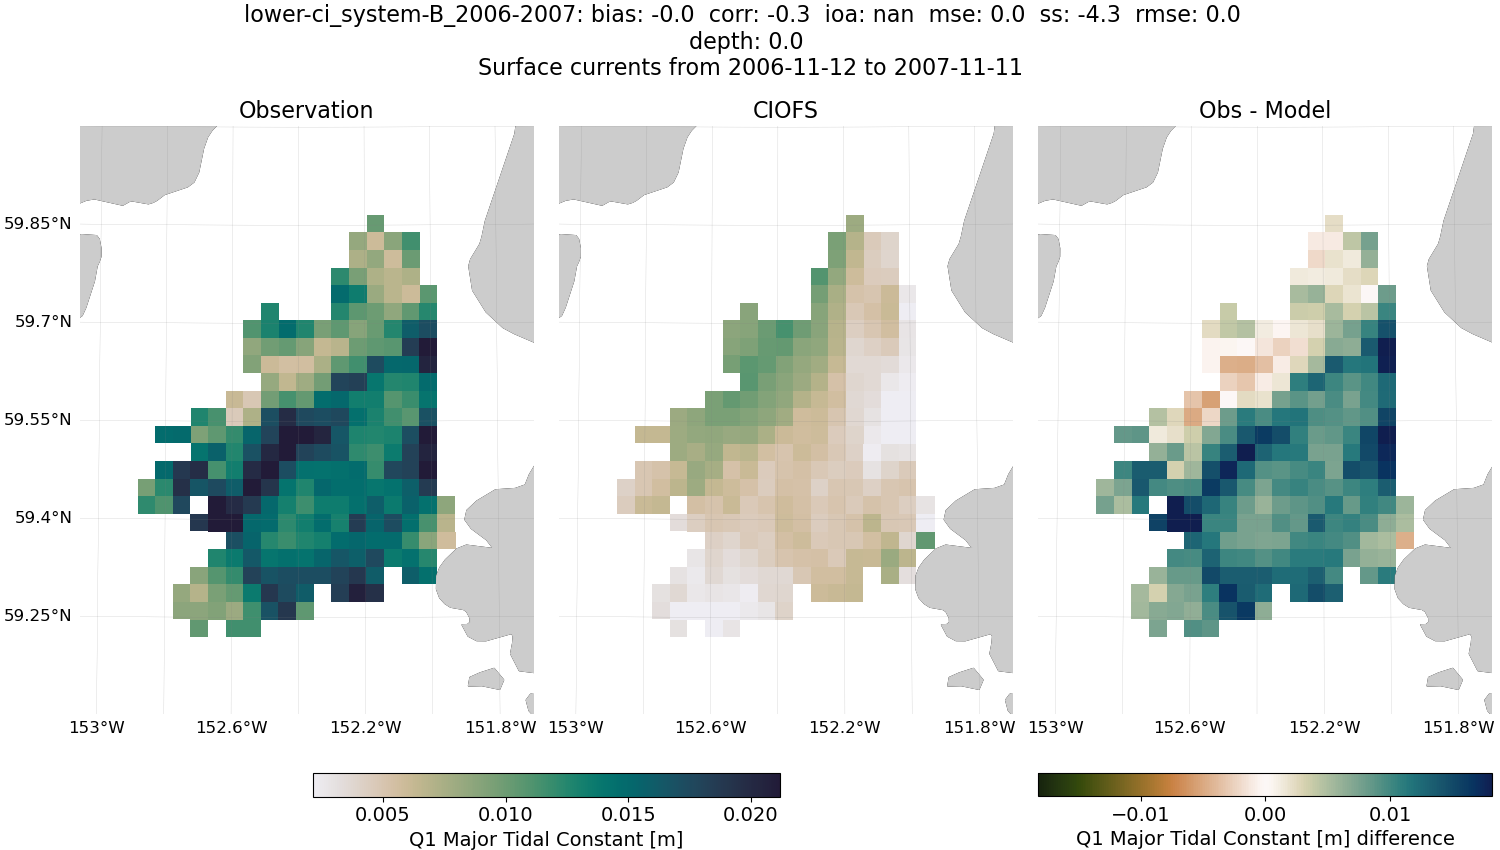
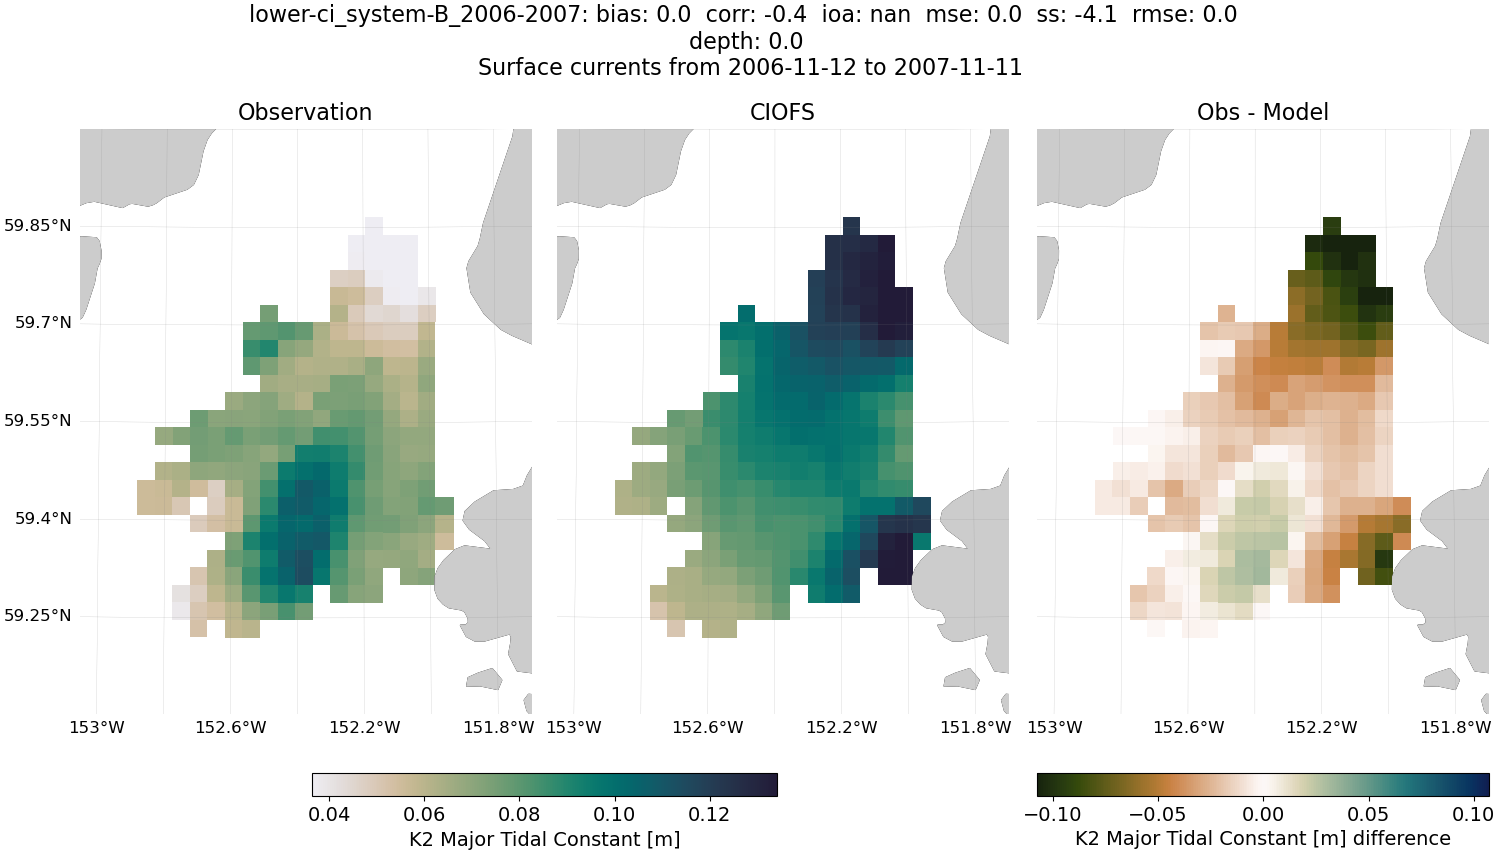
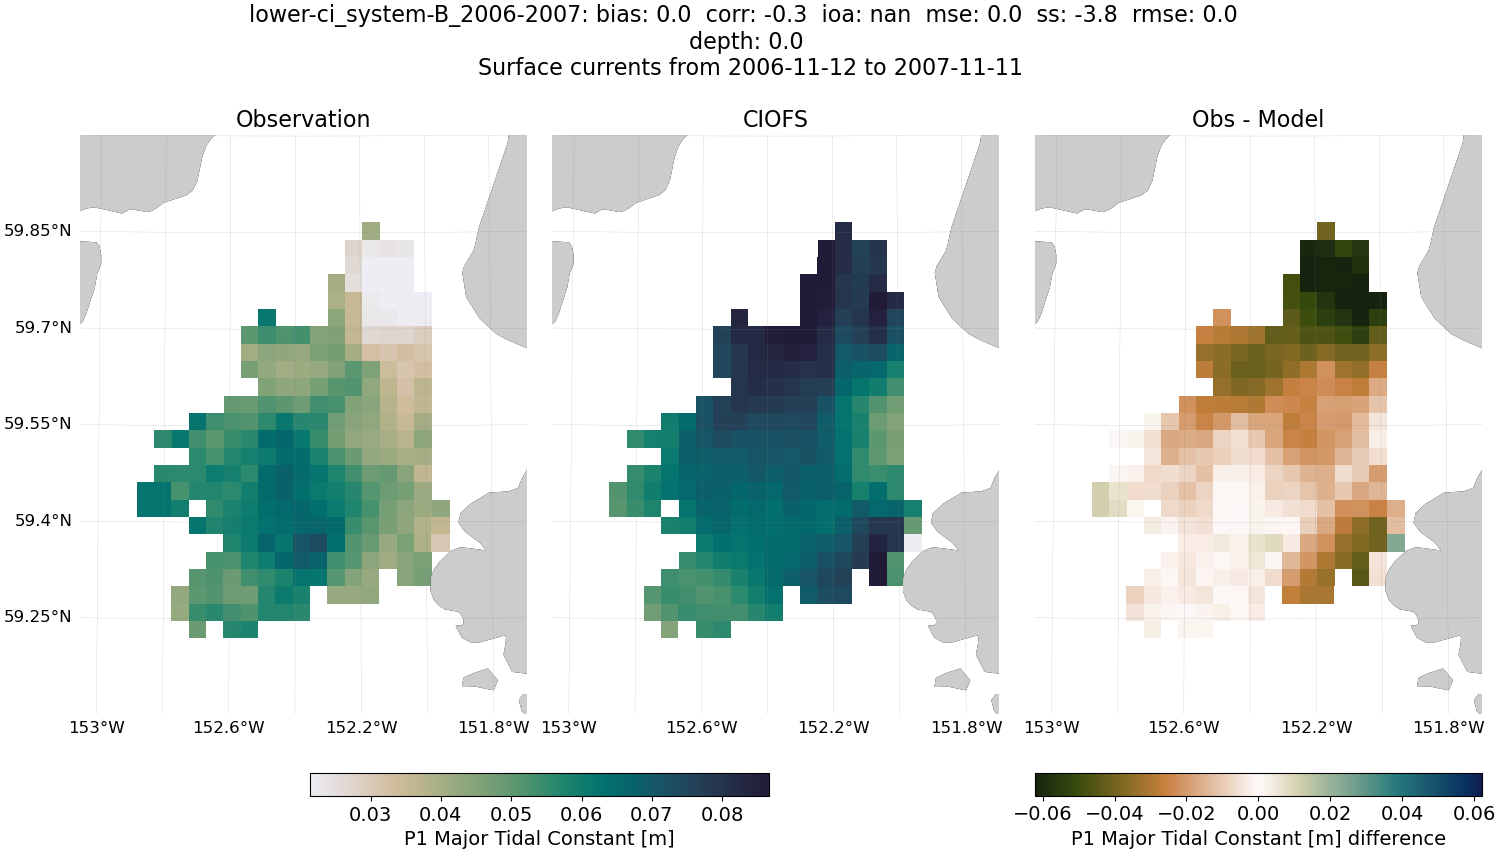
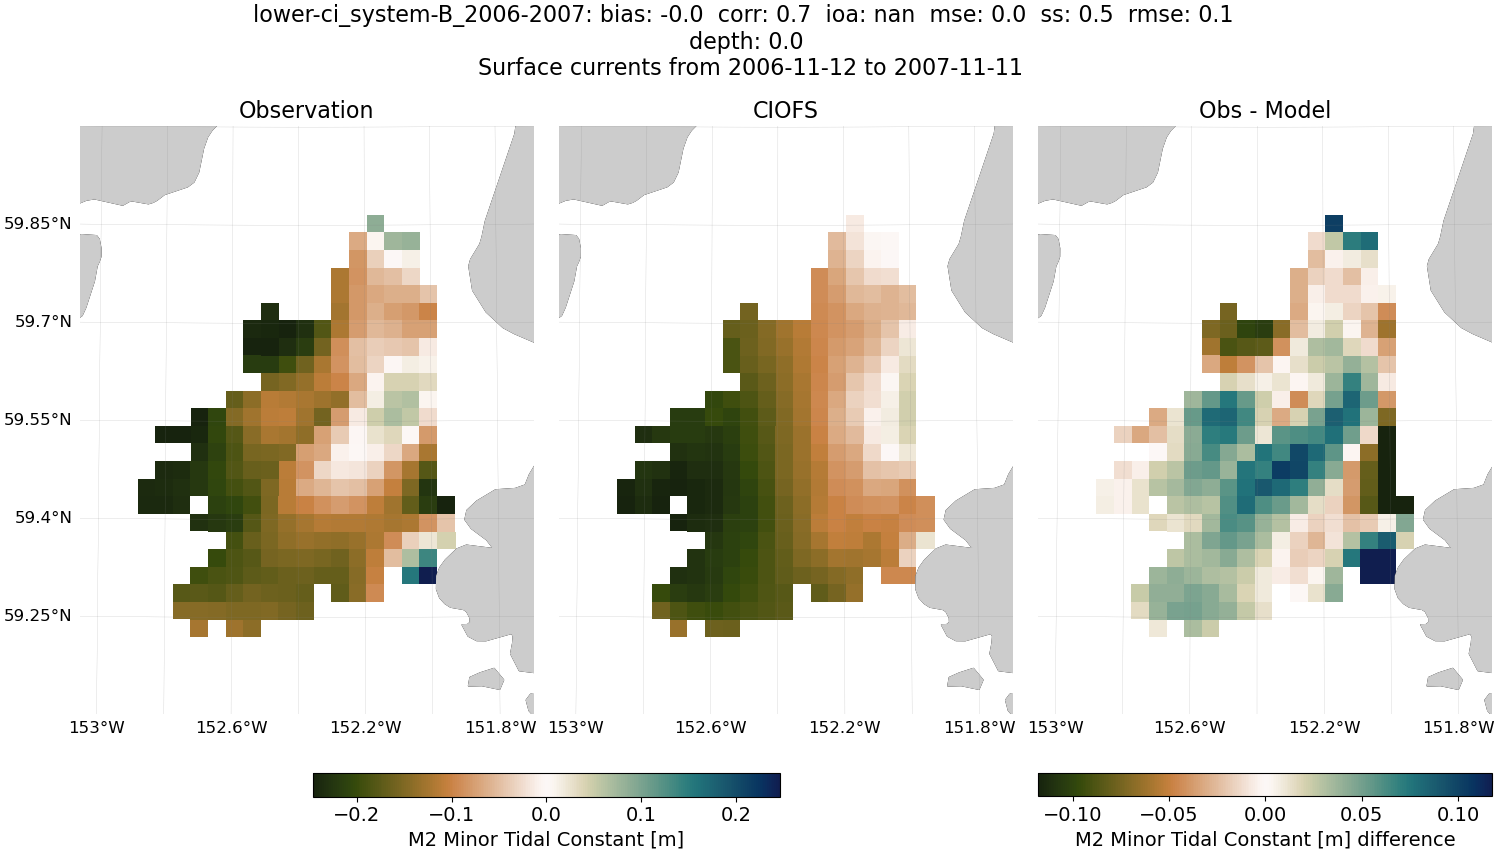
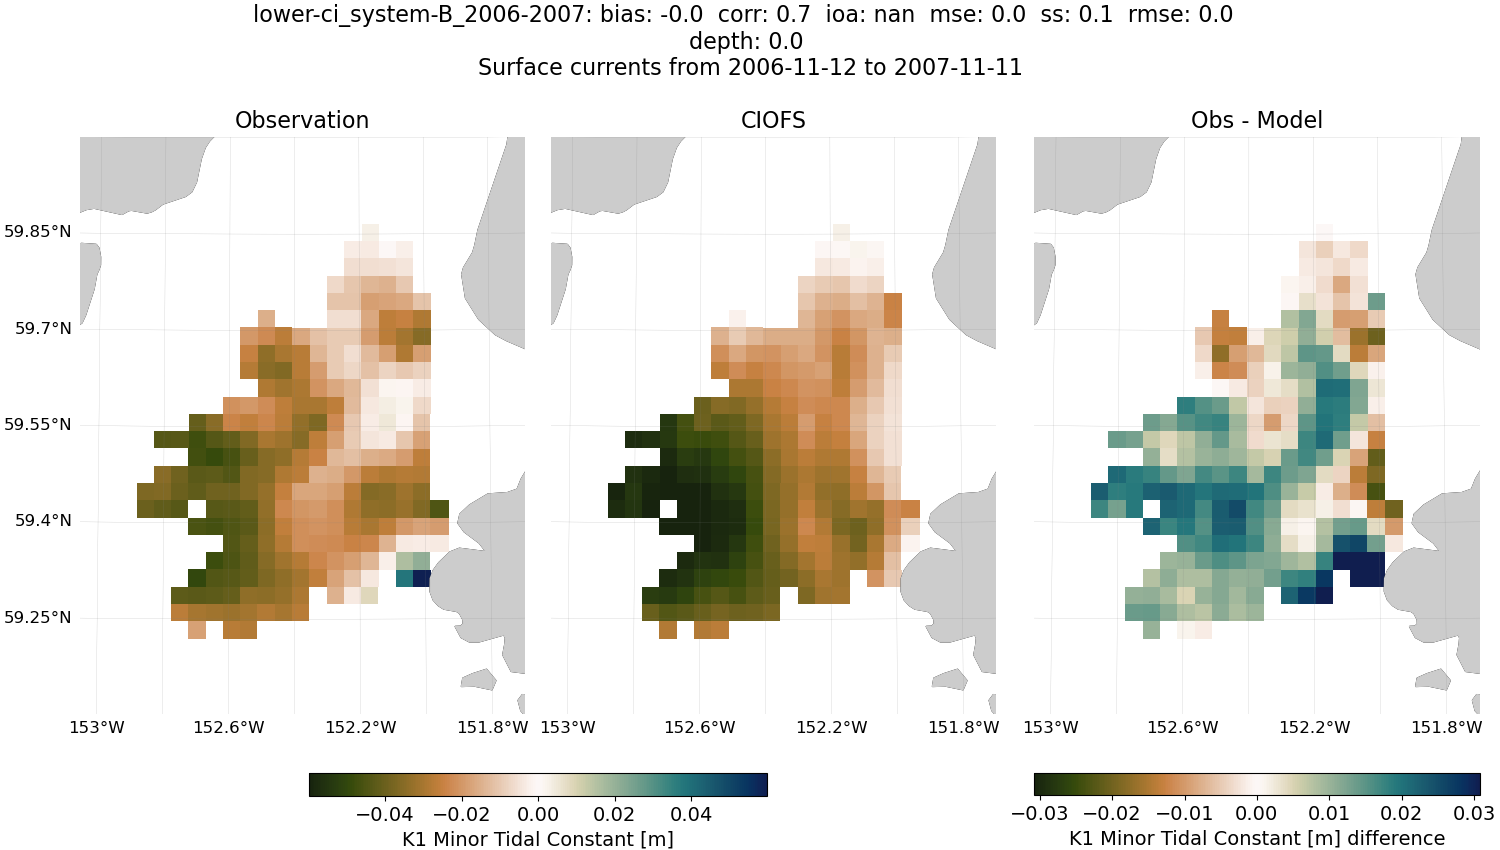
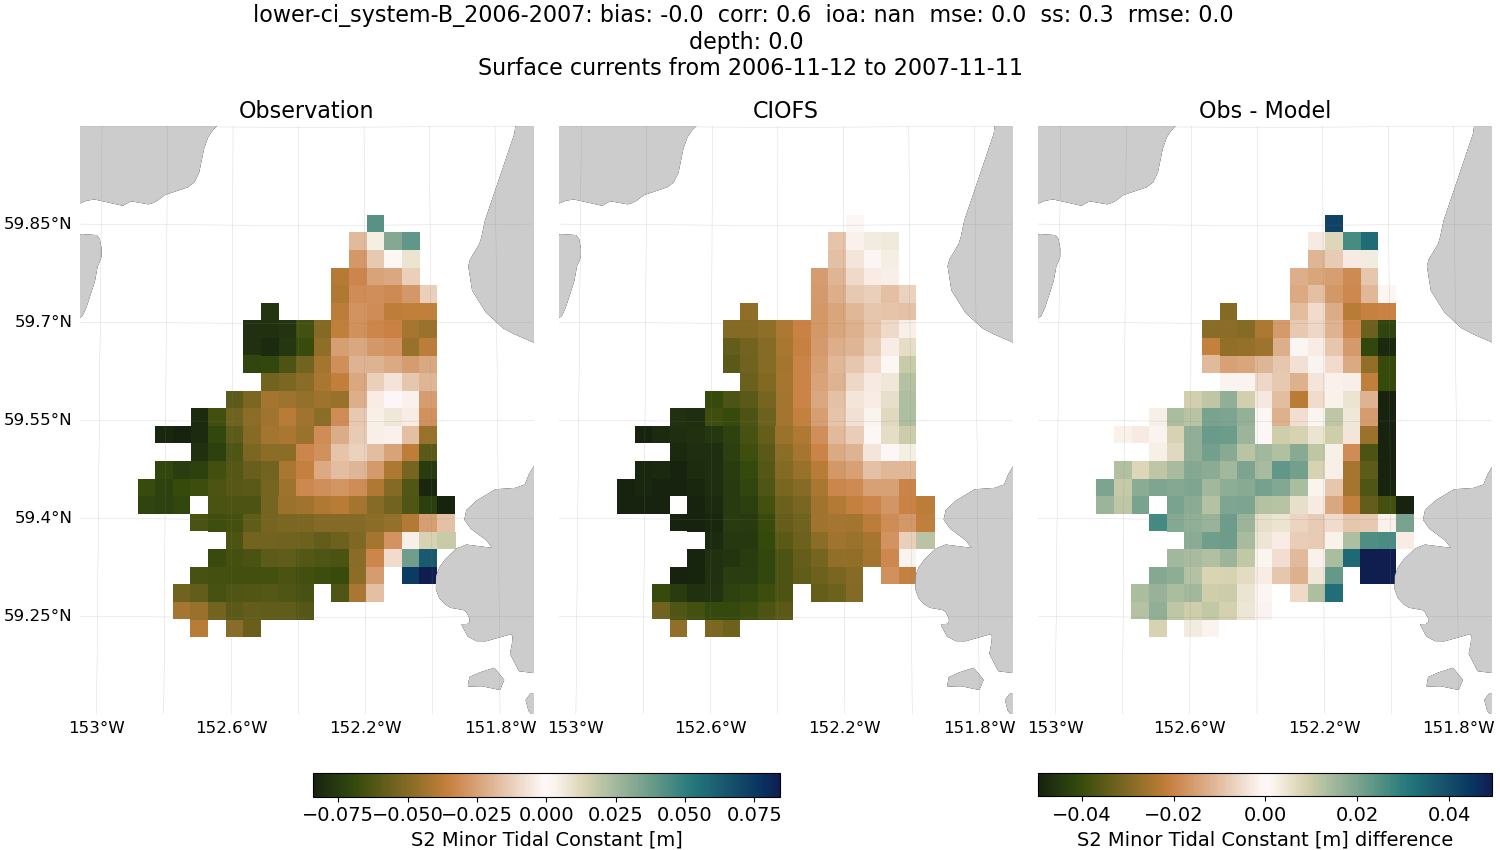
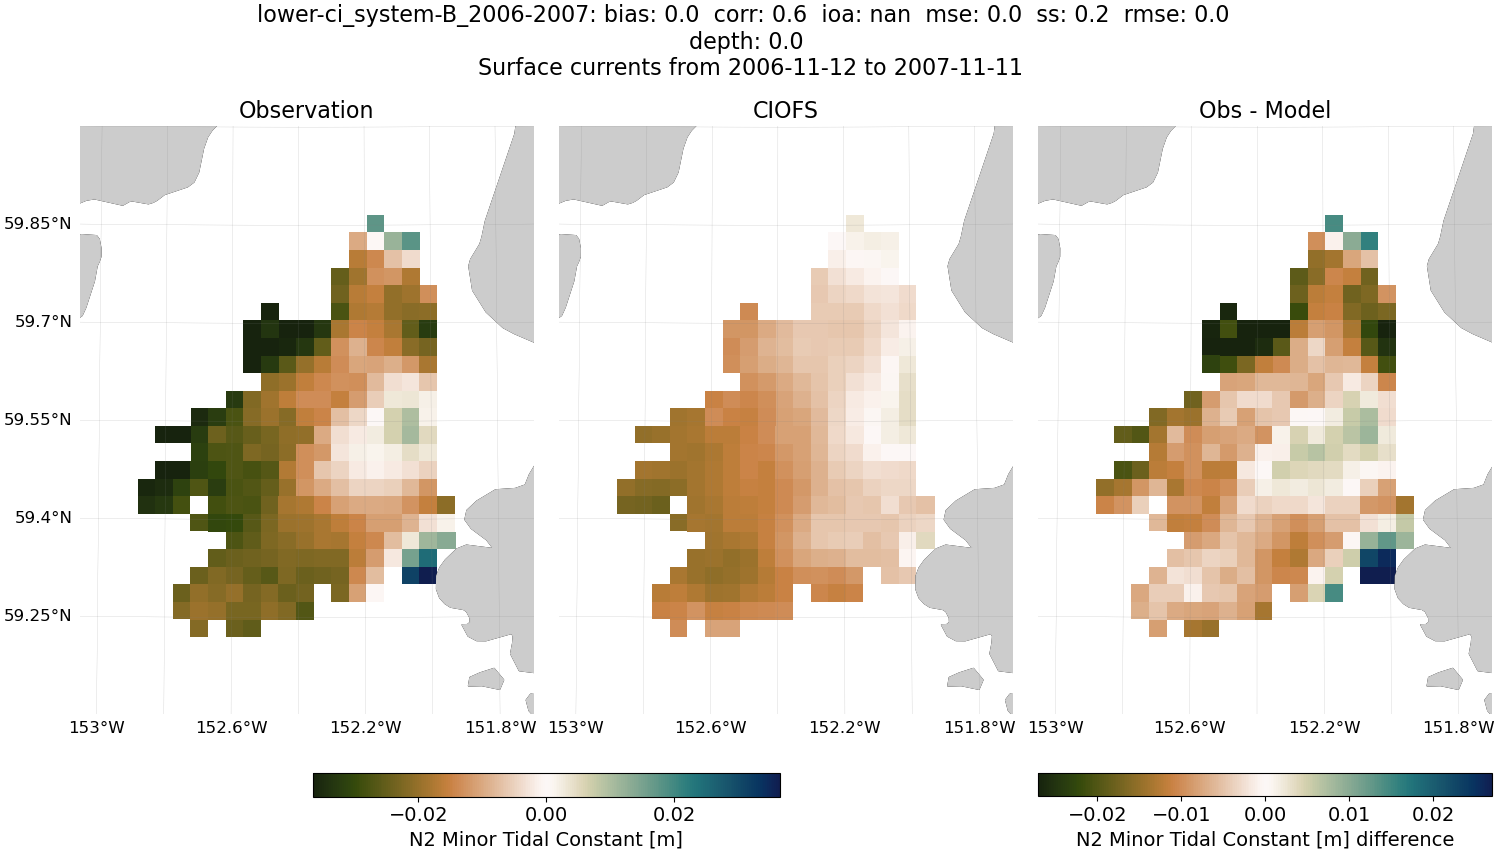
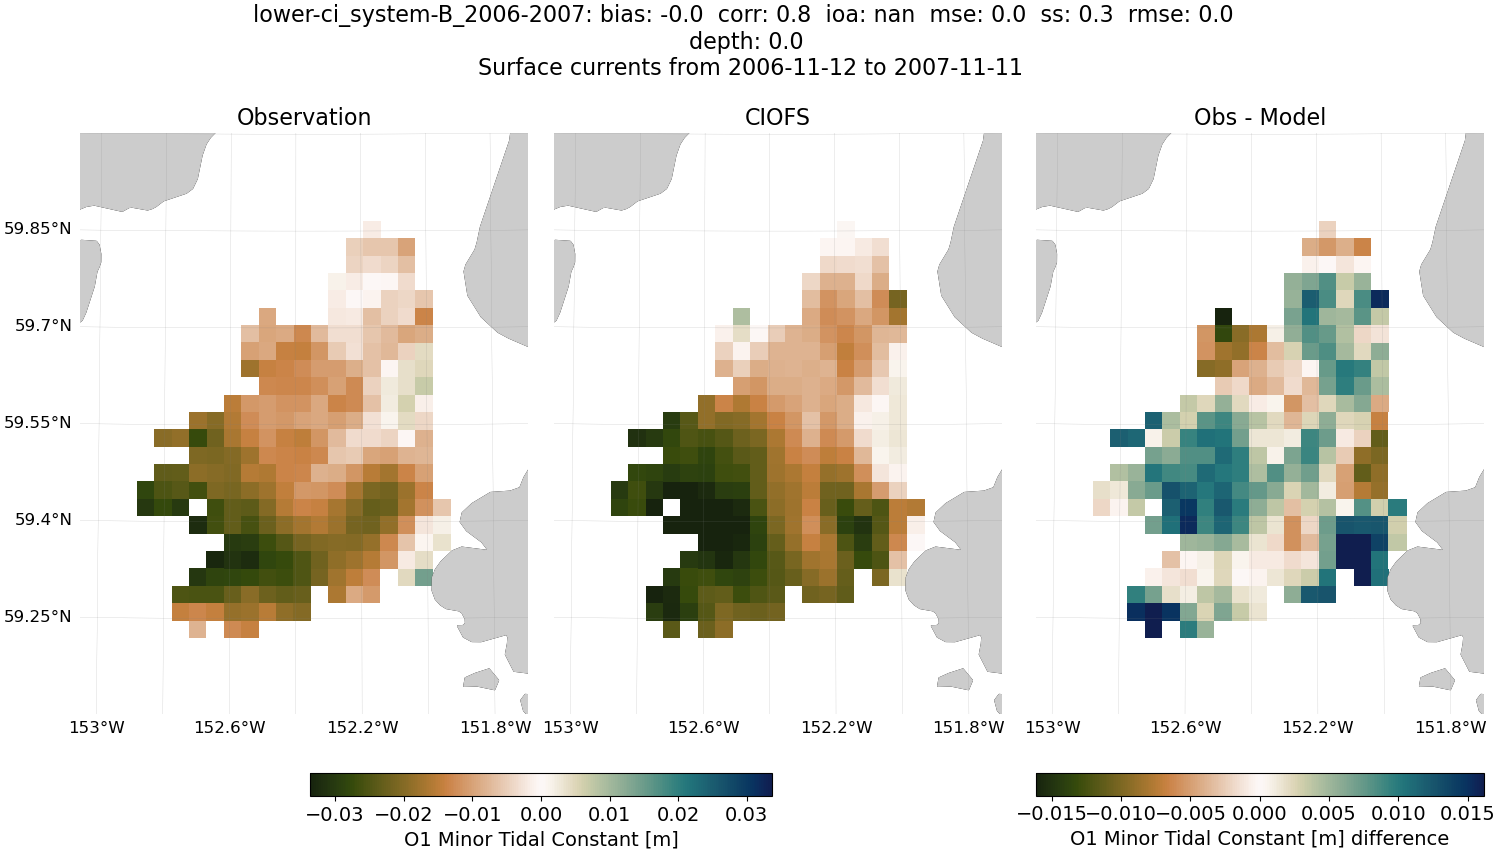
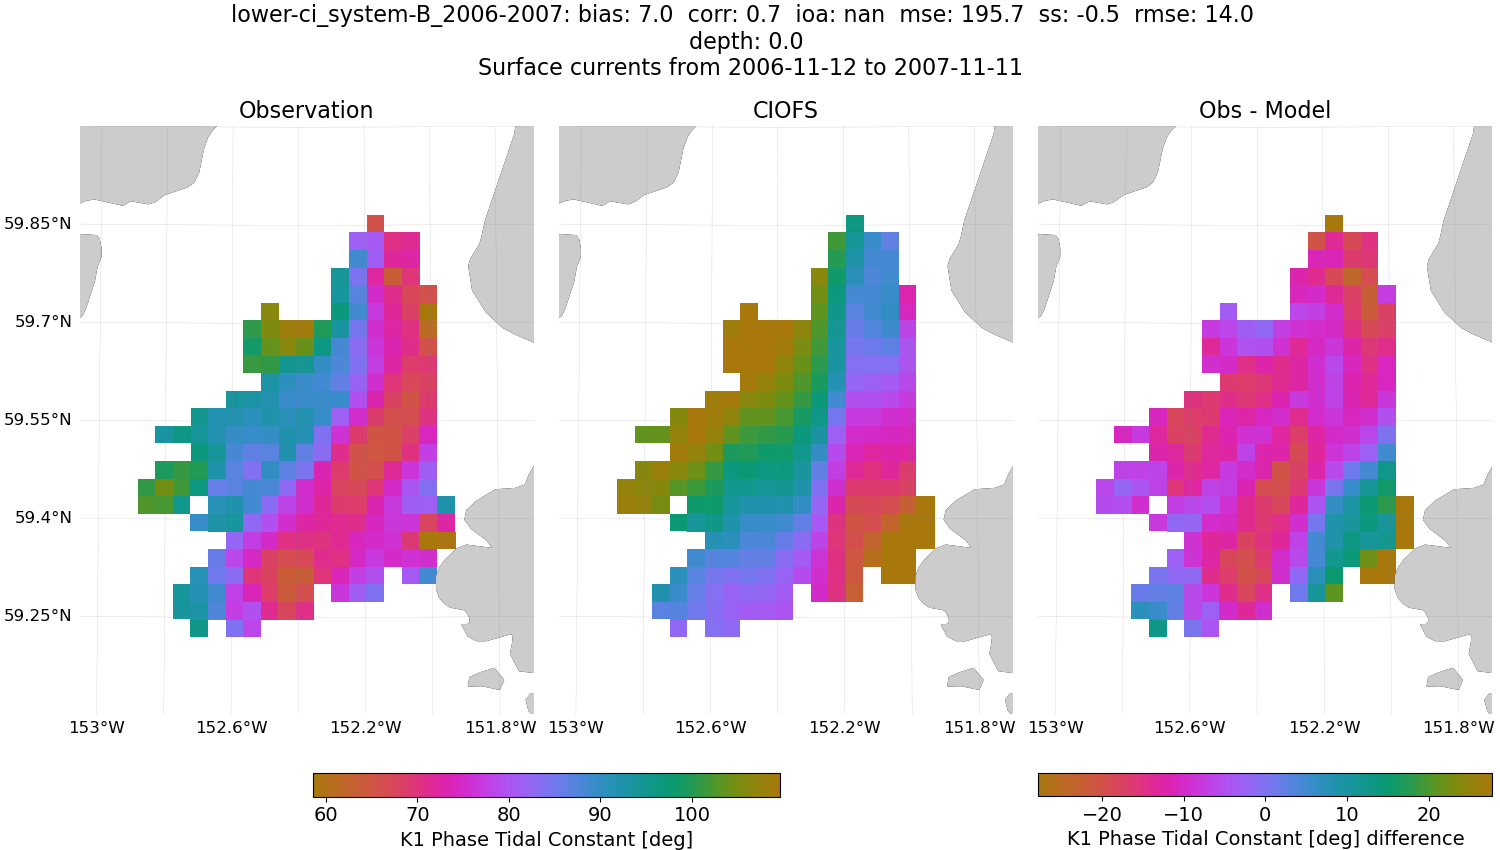
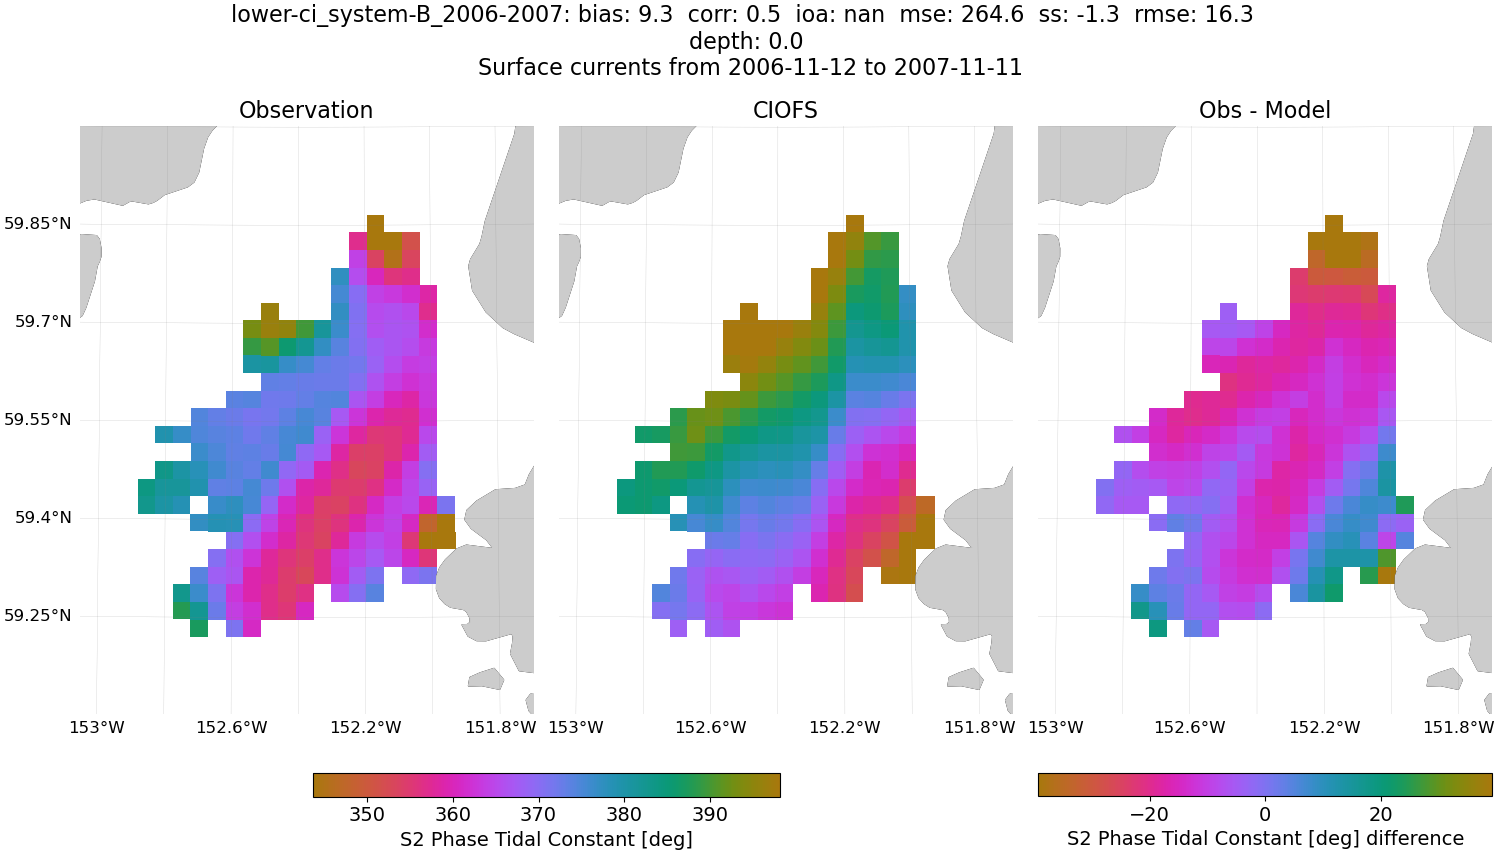
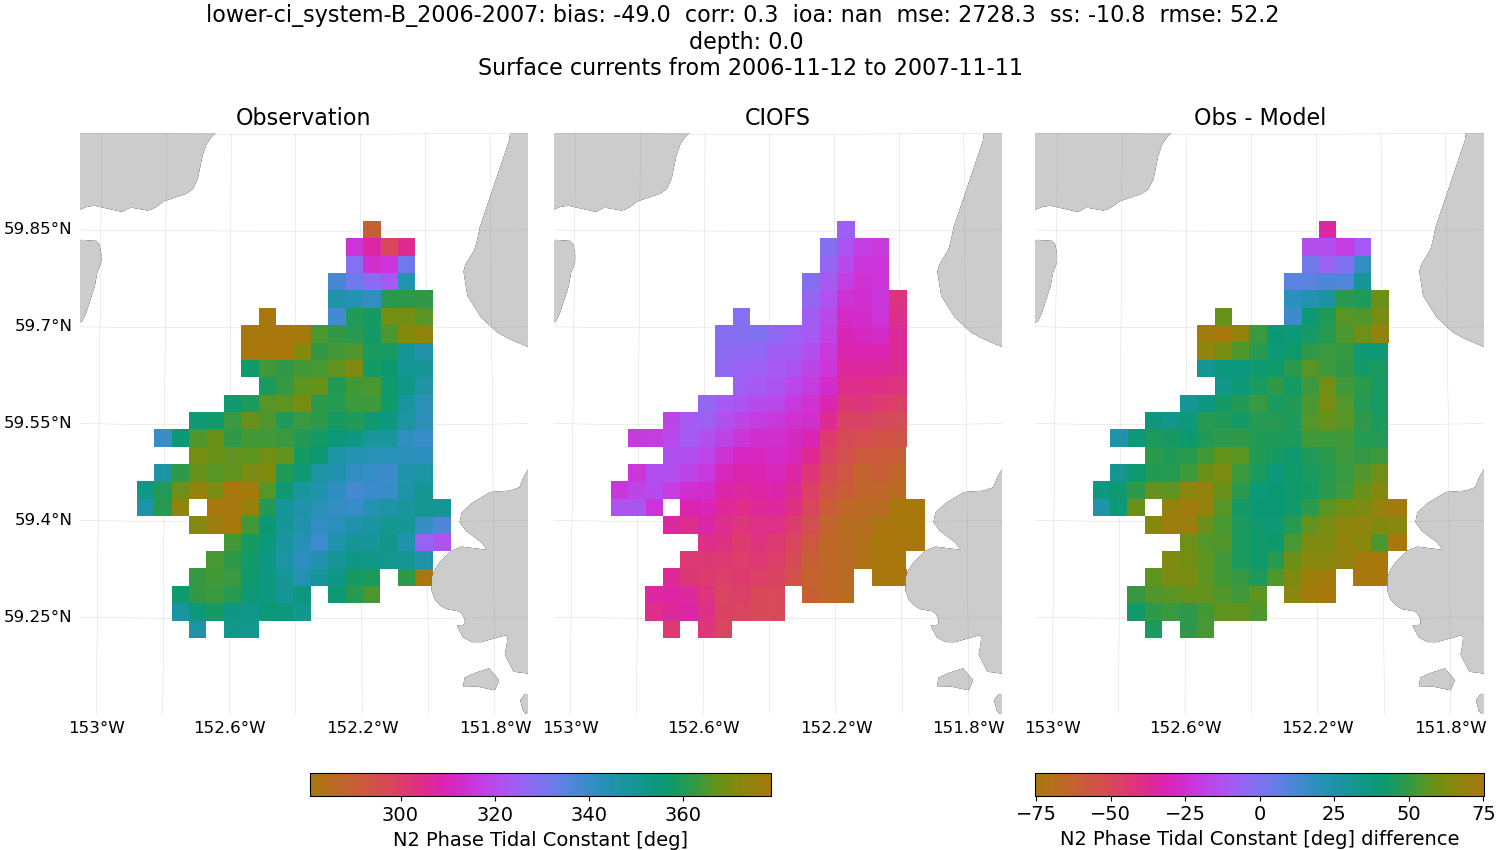
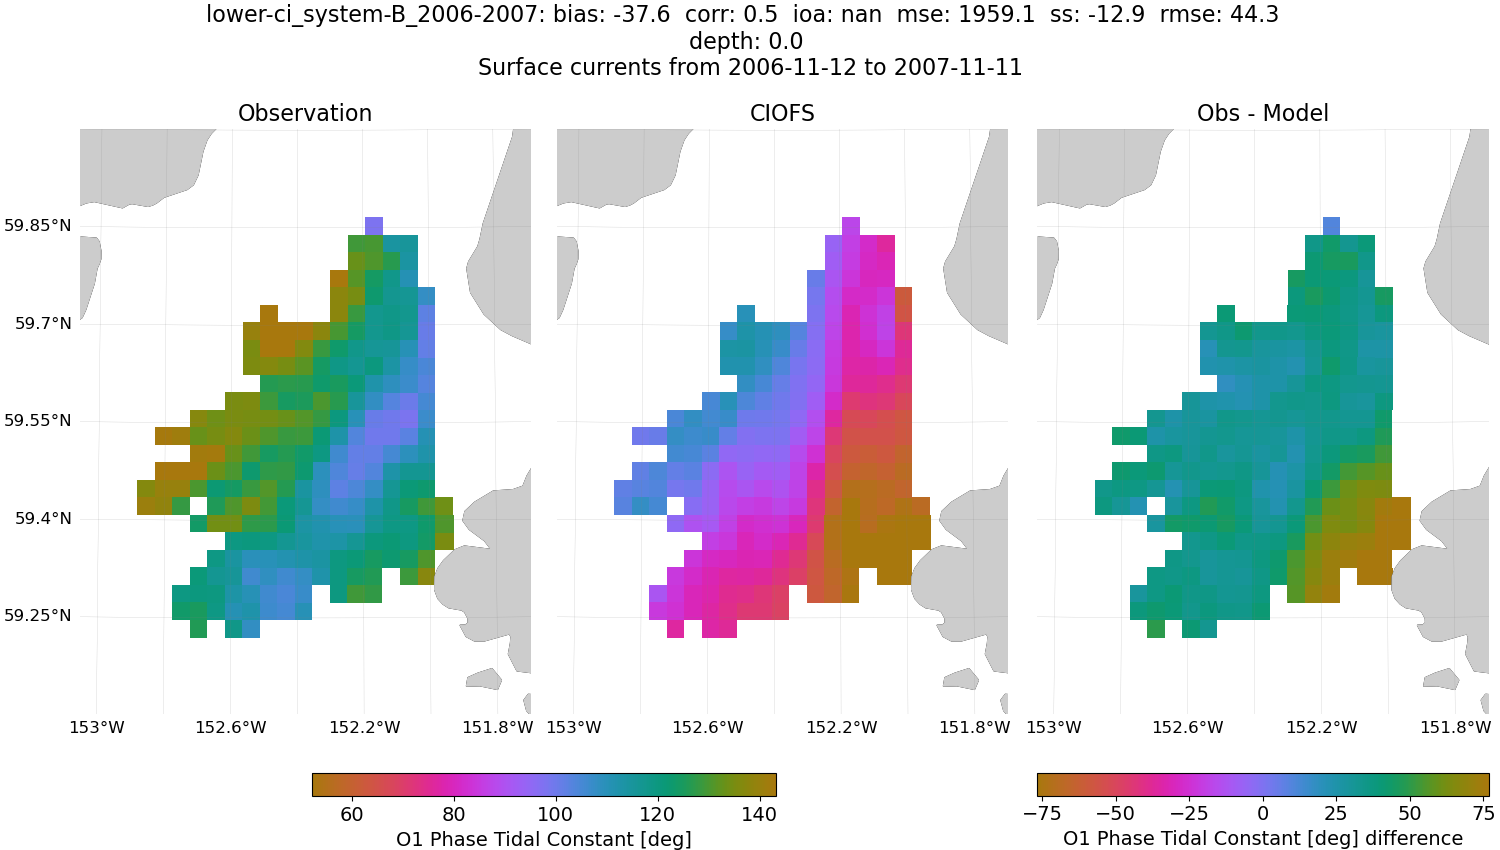
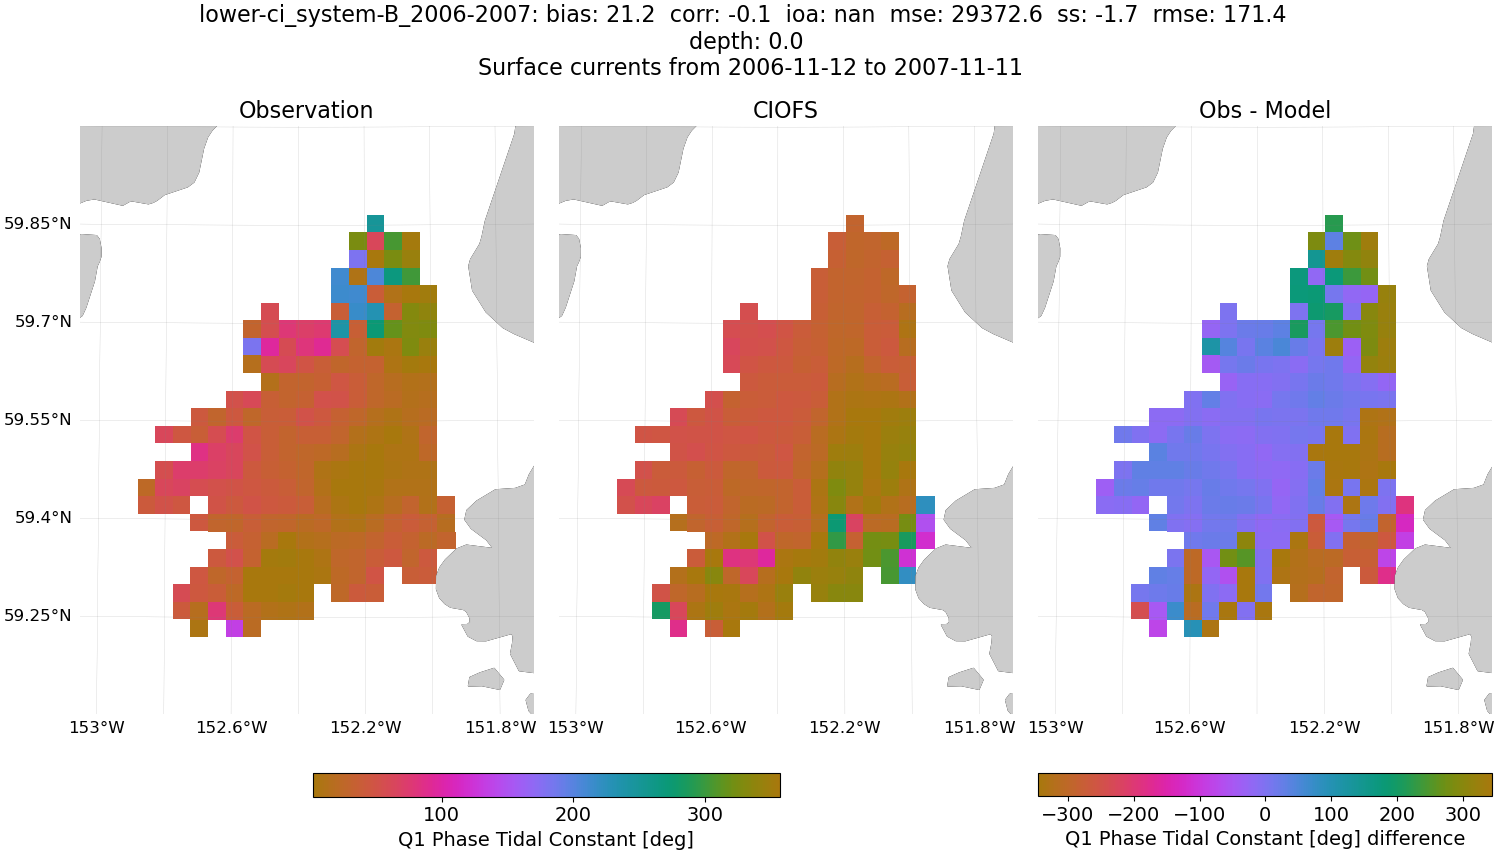
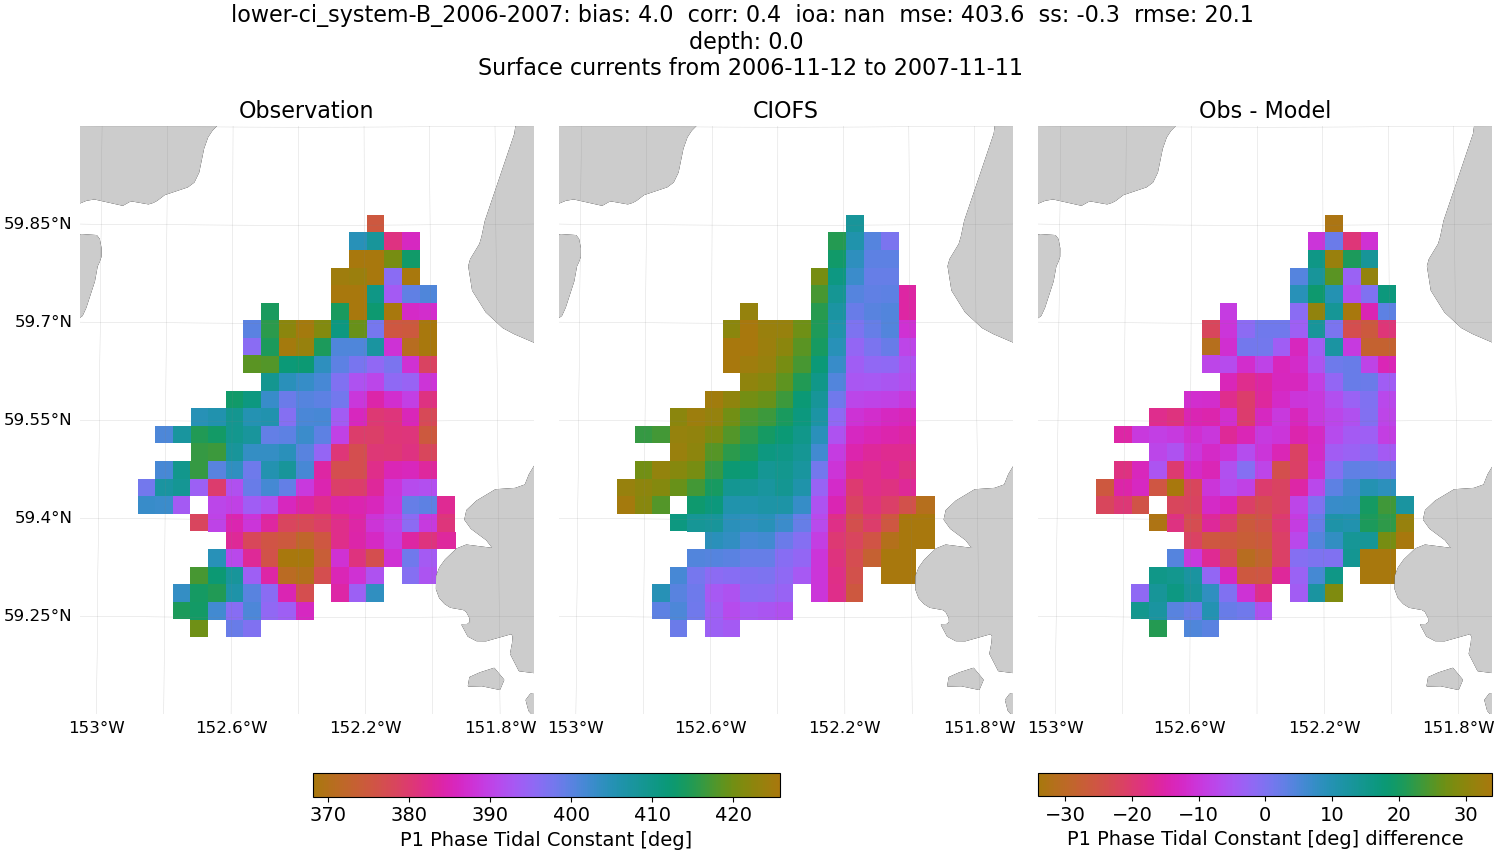
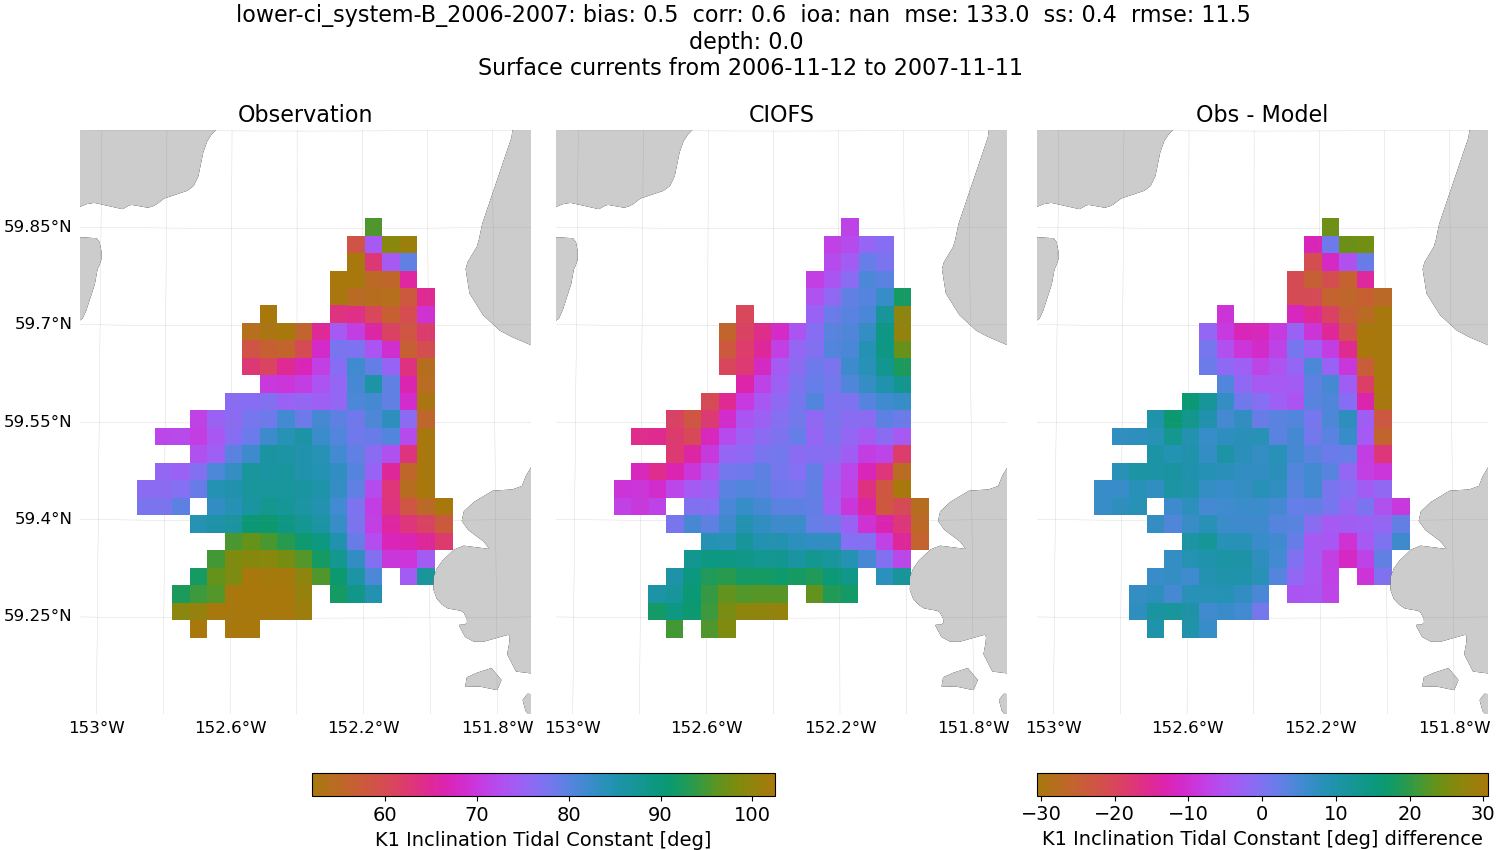
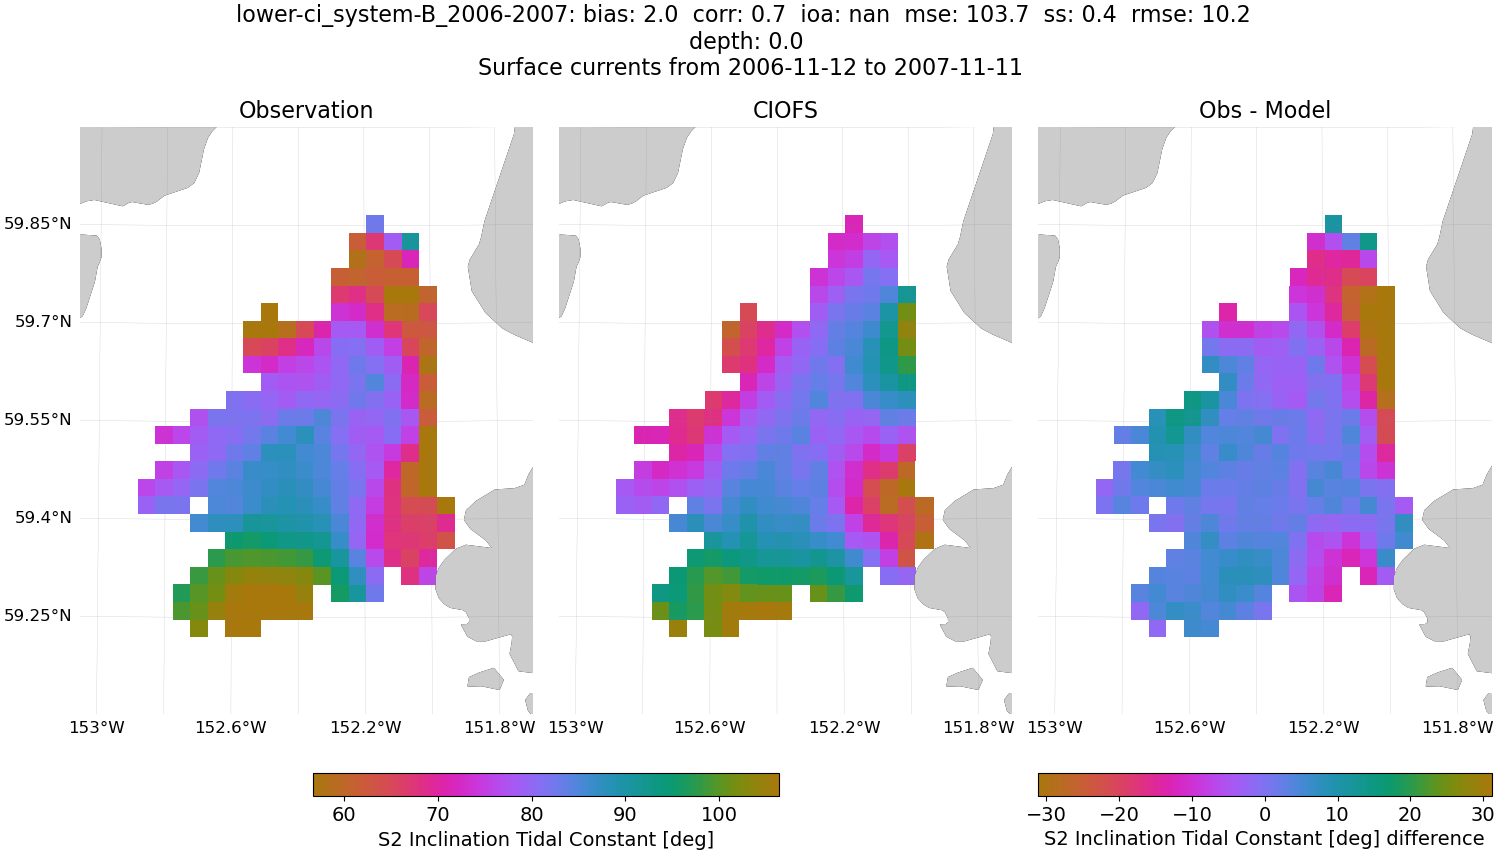
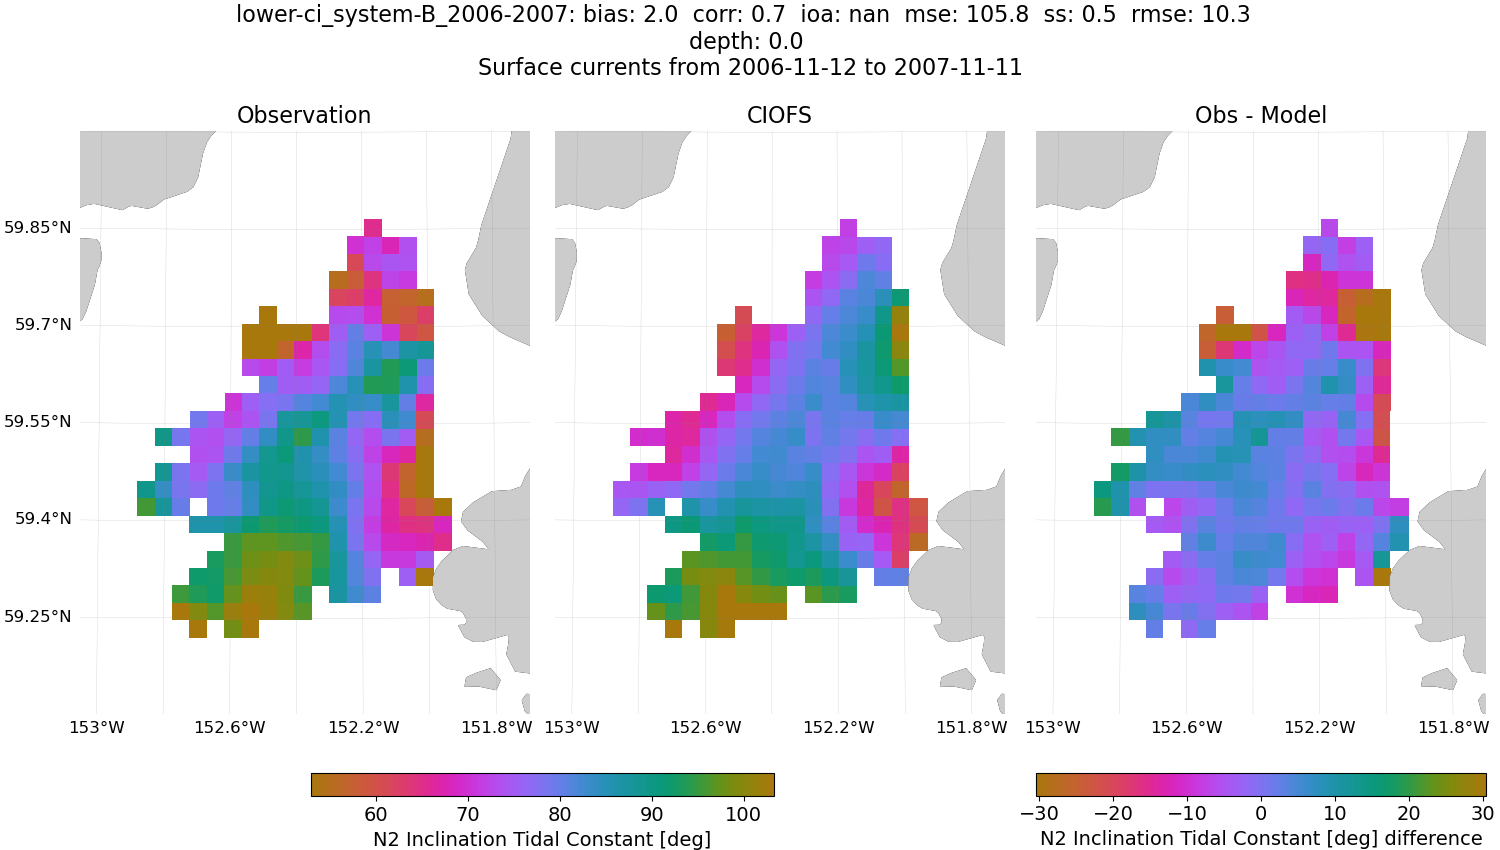
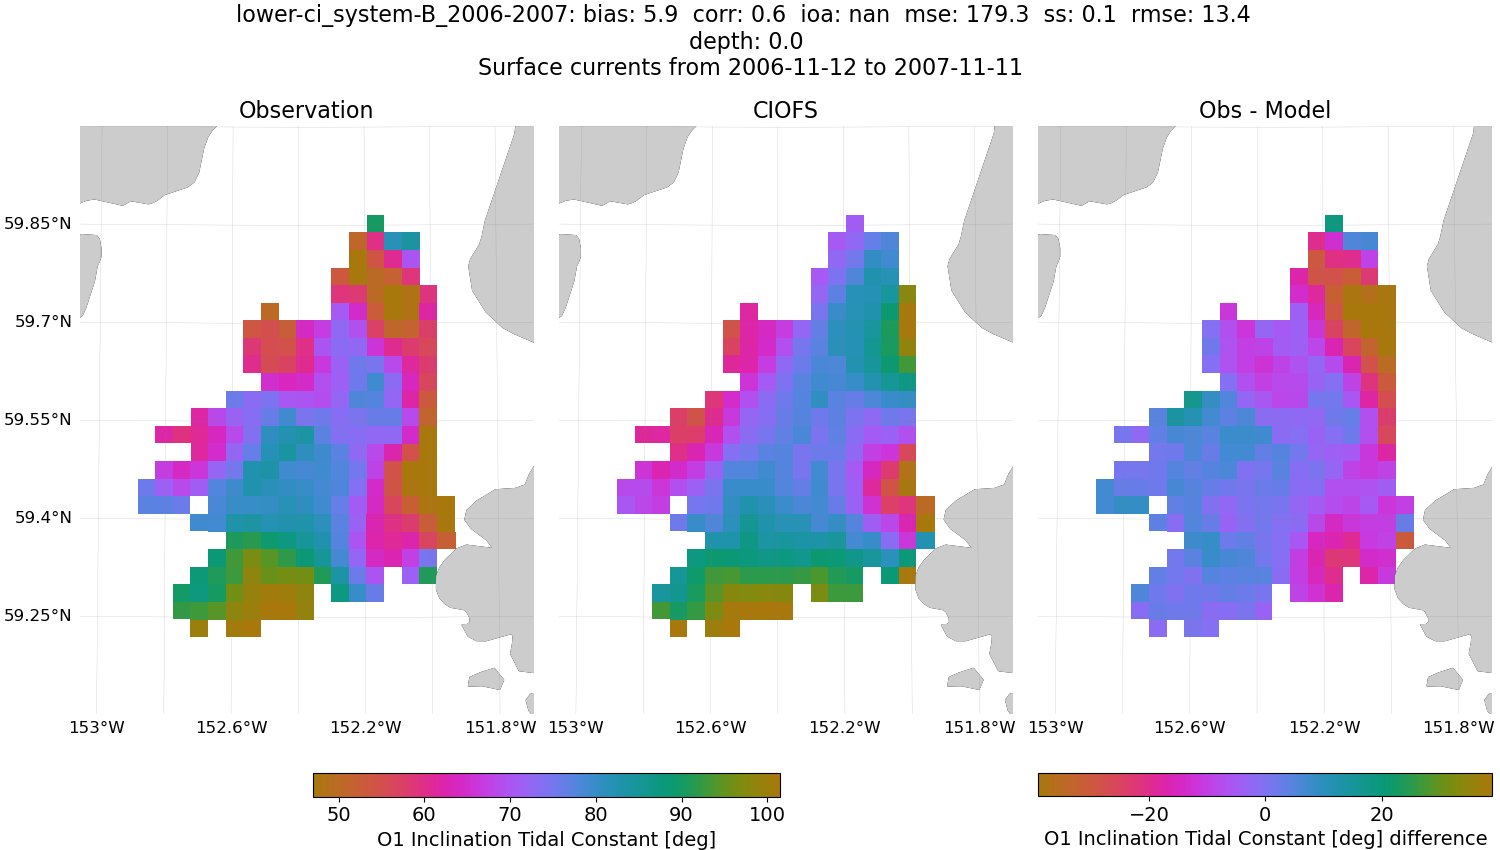
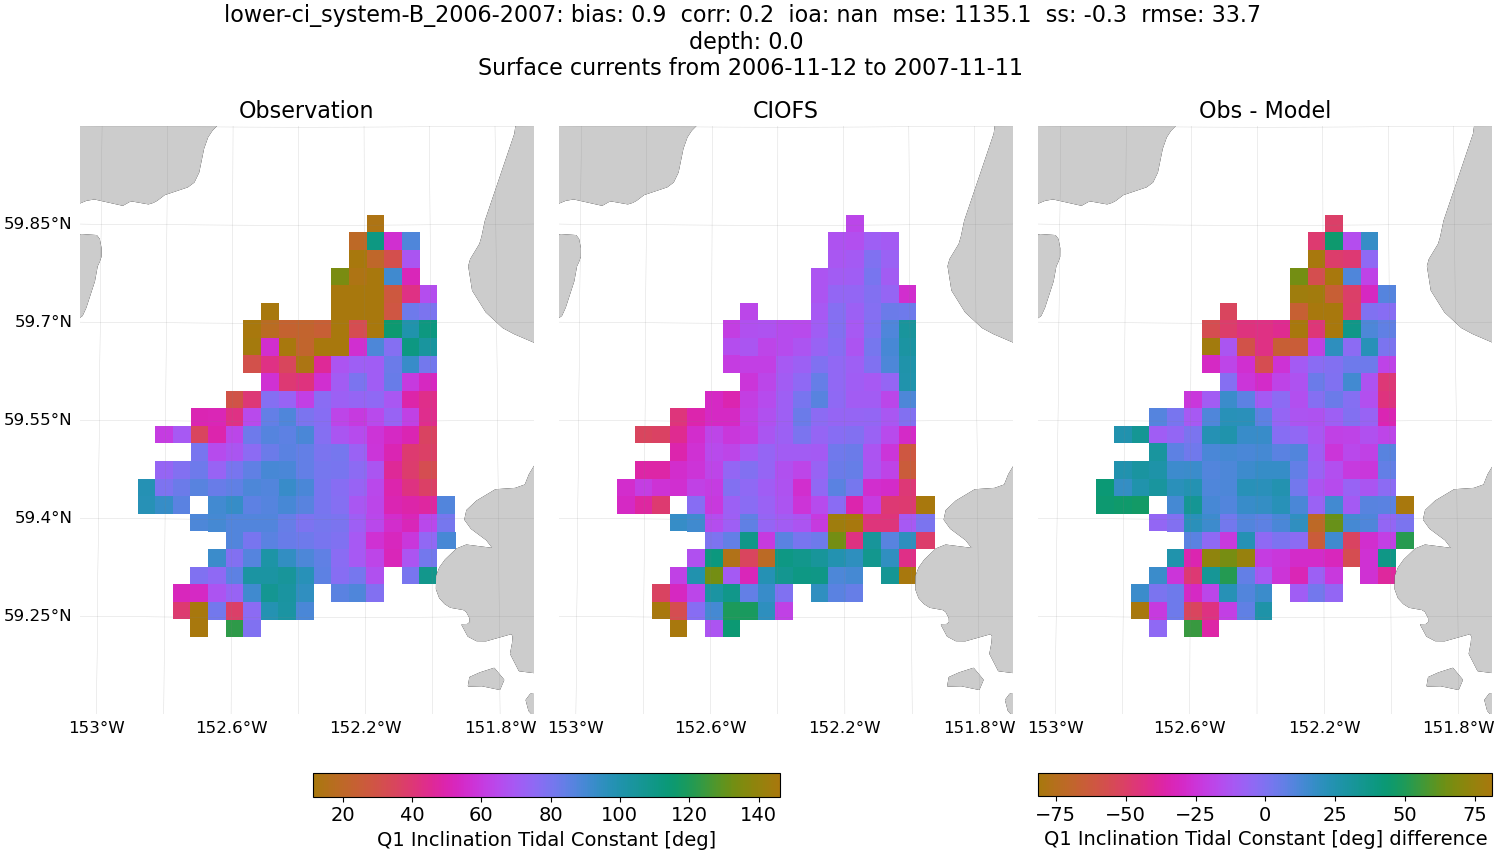
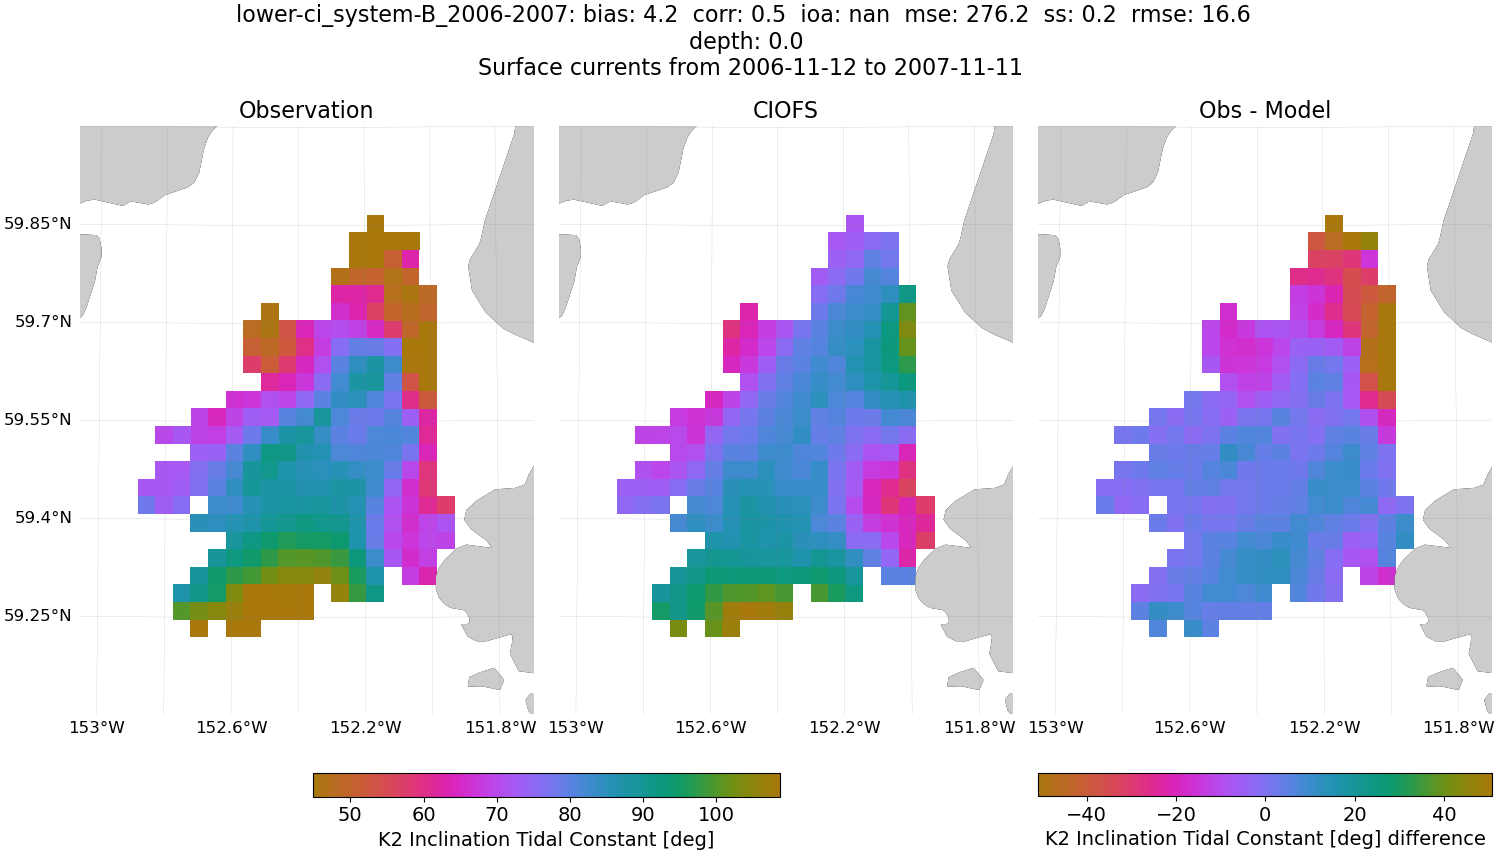
Tidal Constants#
CIOFS
Major Amplitude
Minor Amplitude
Phase

Inclination

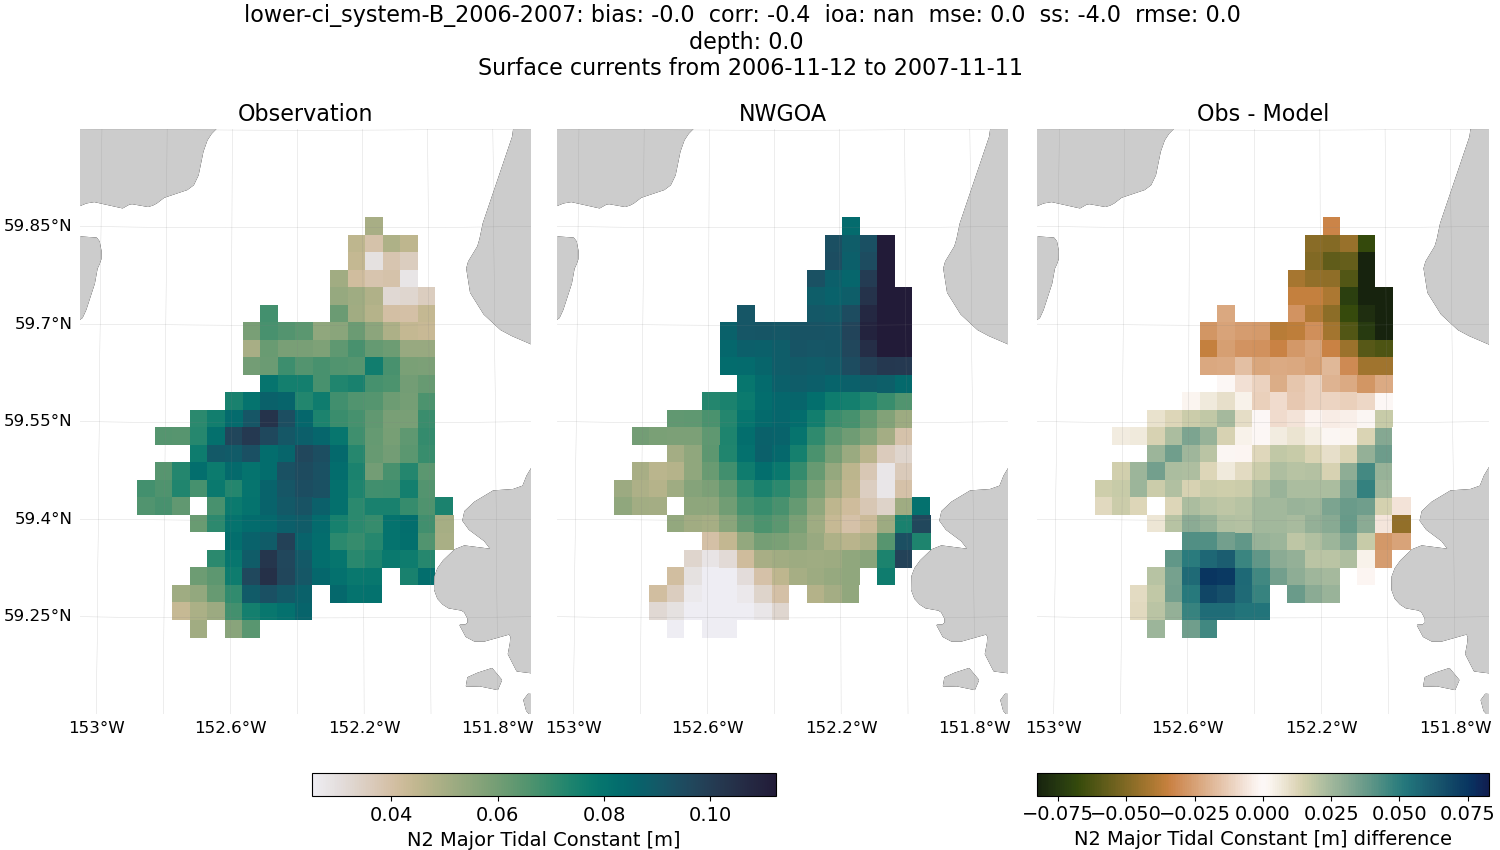
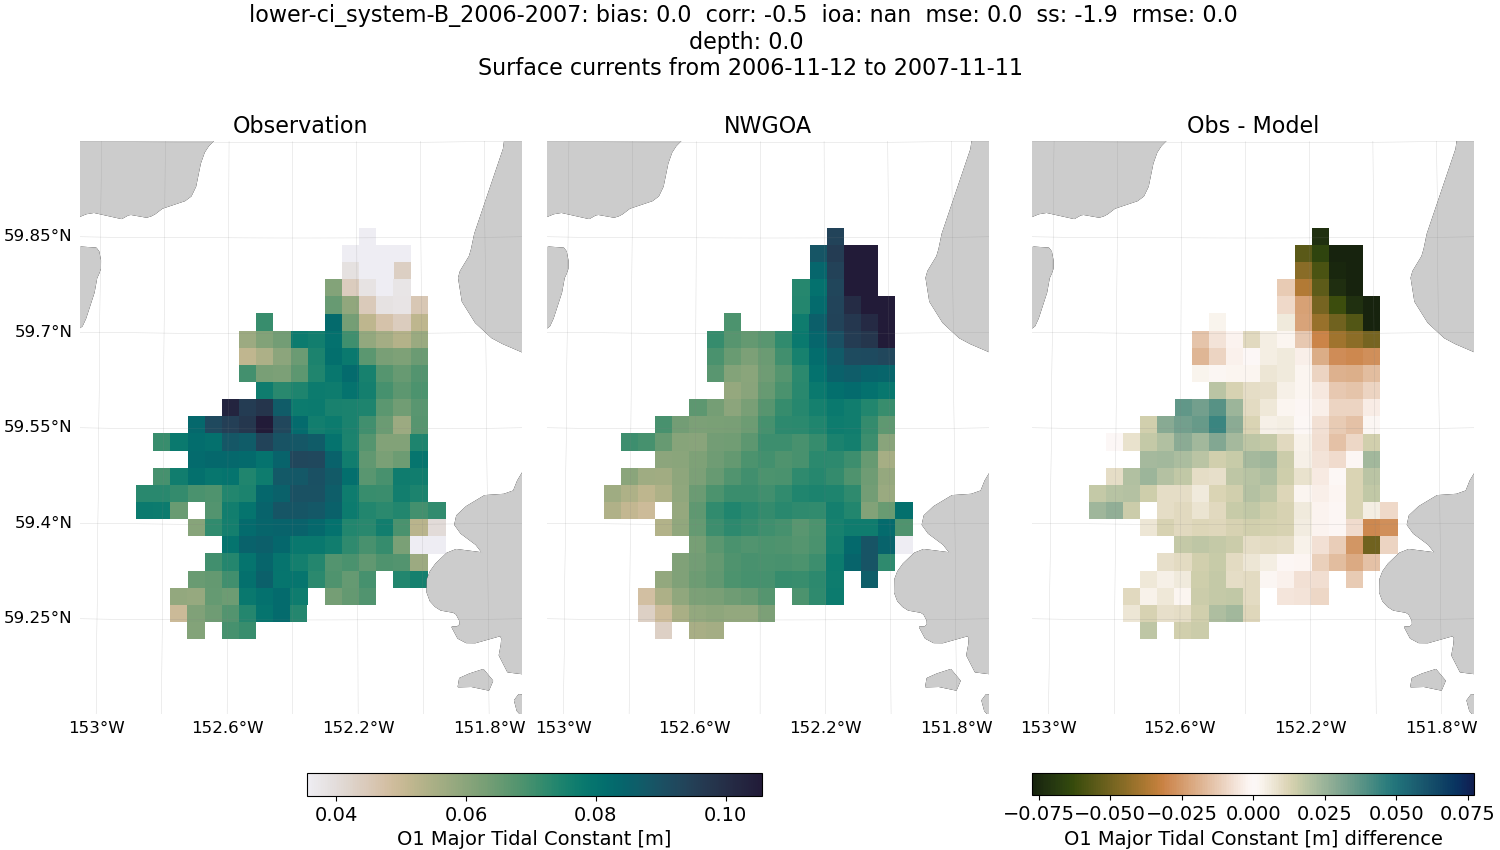
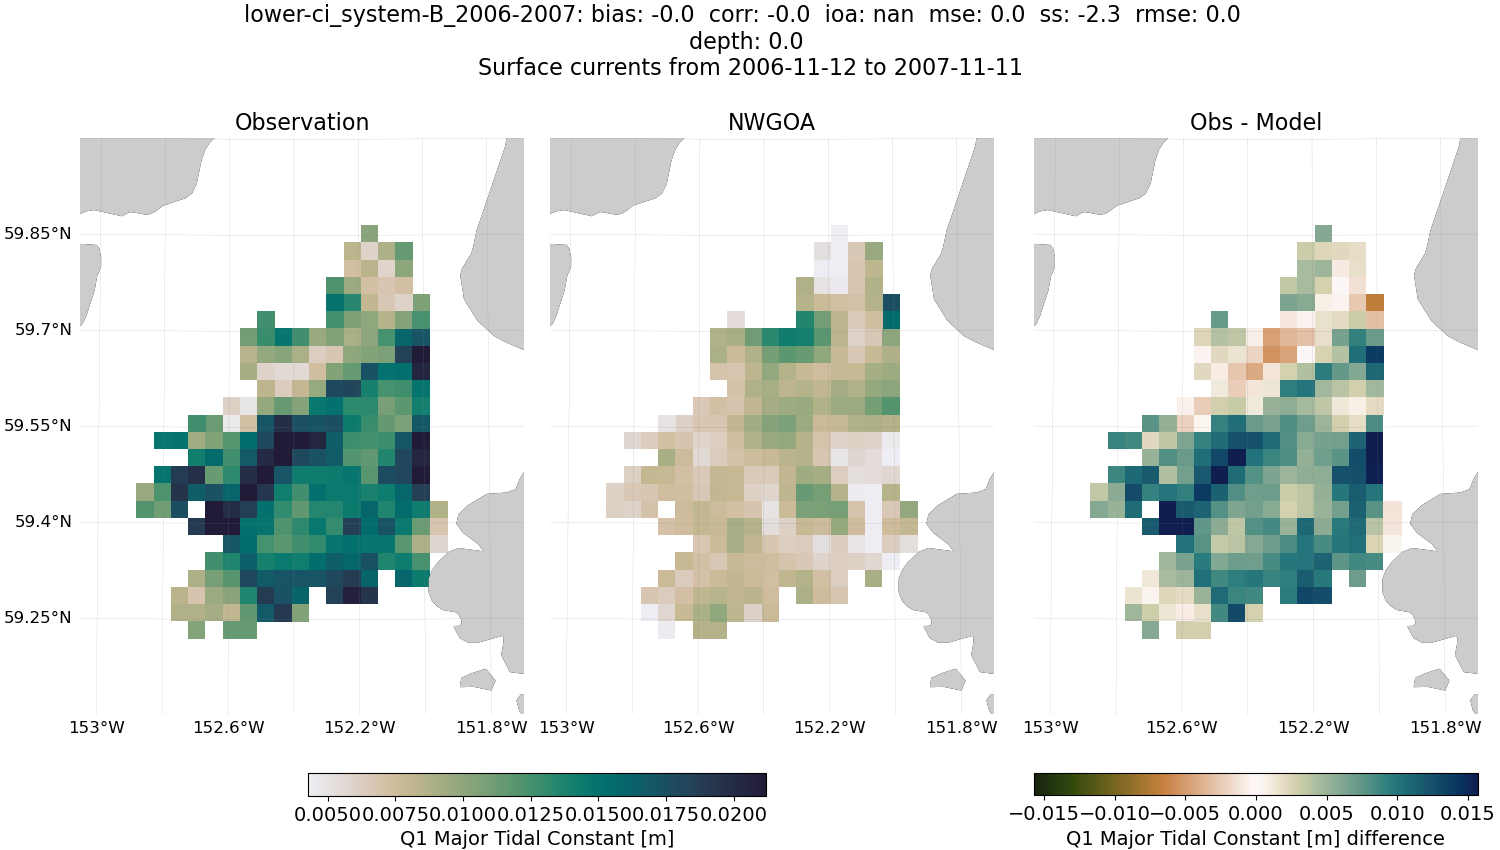
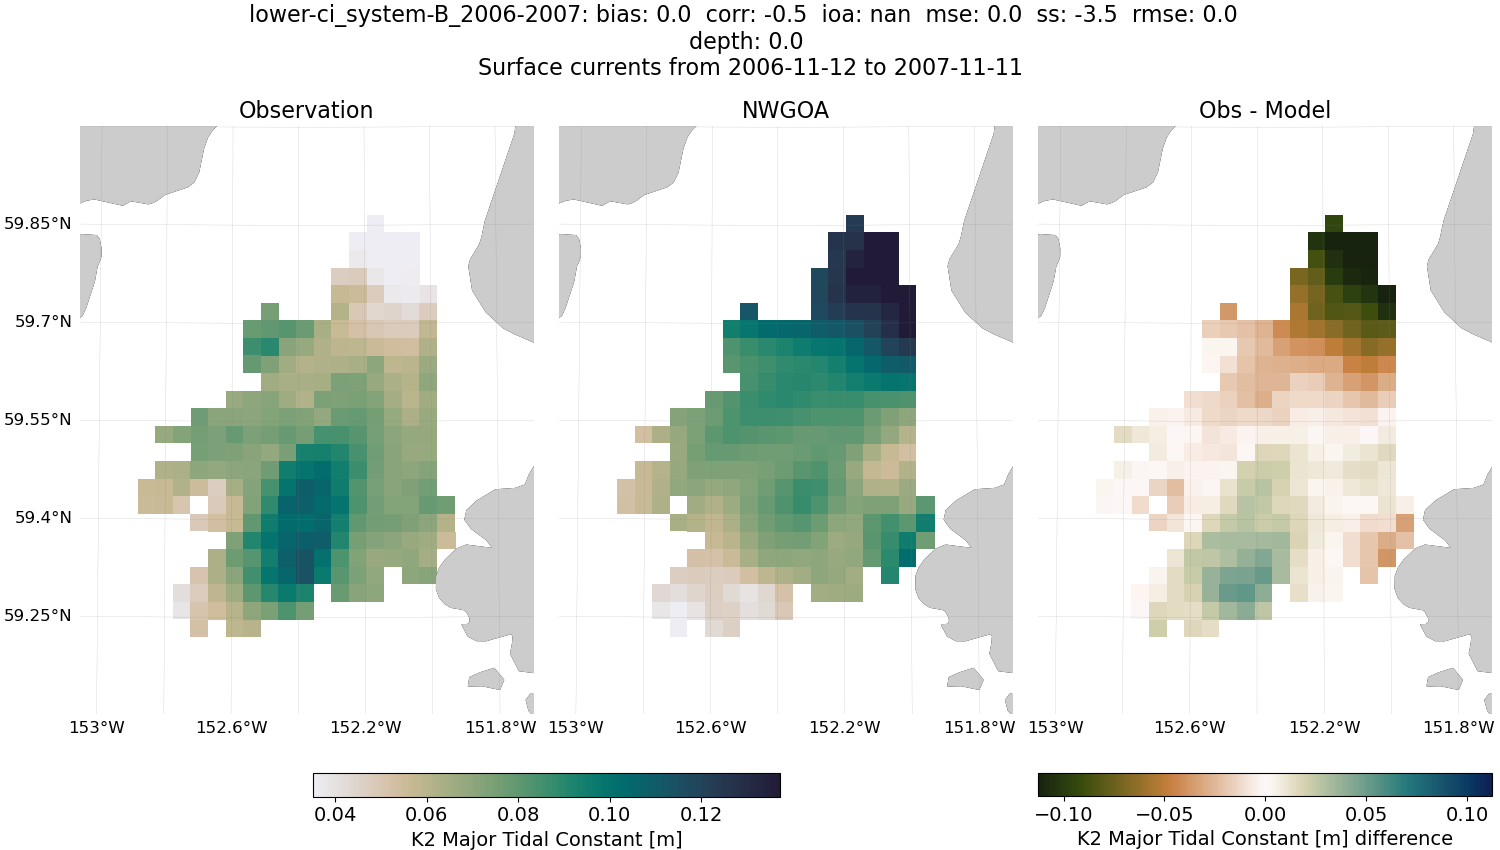
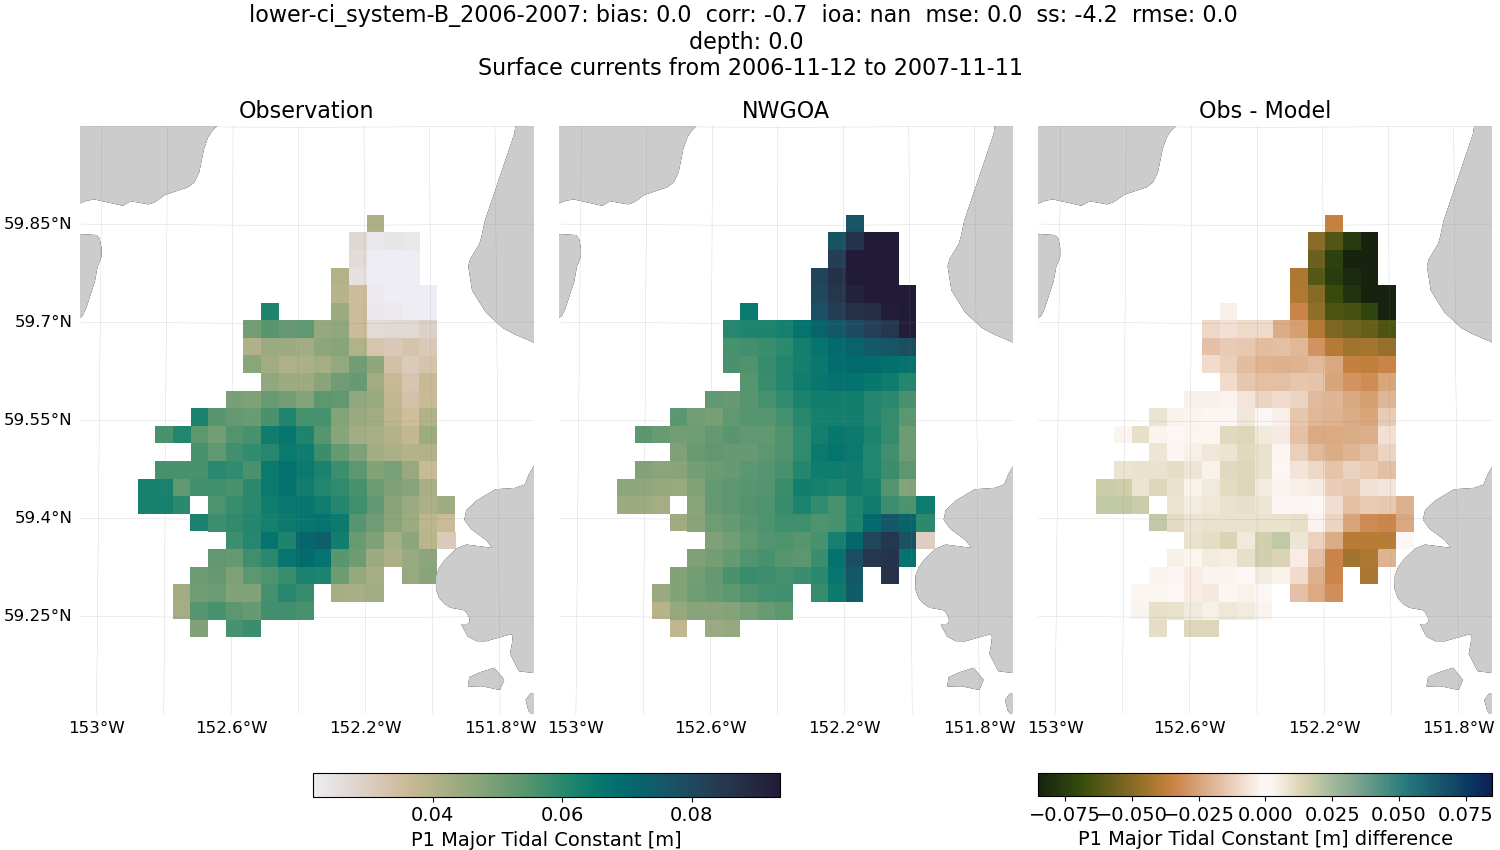
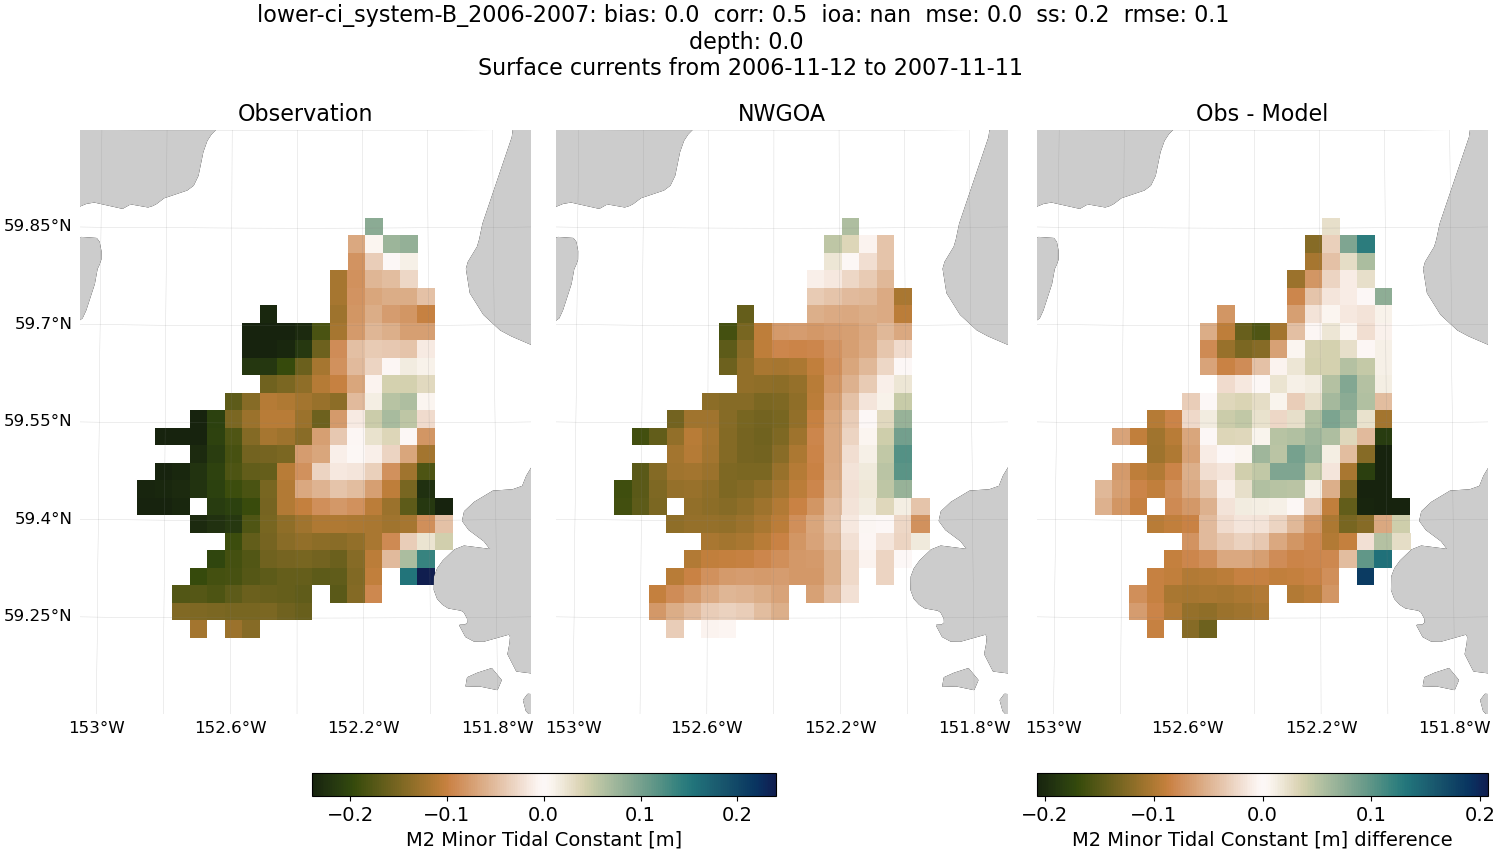
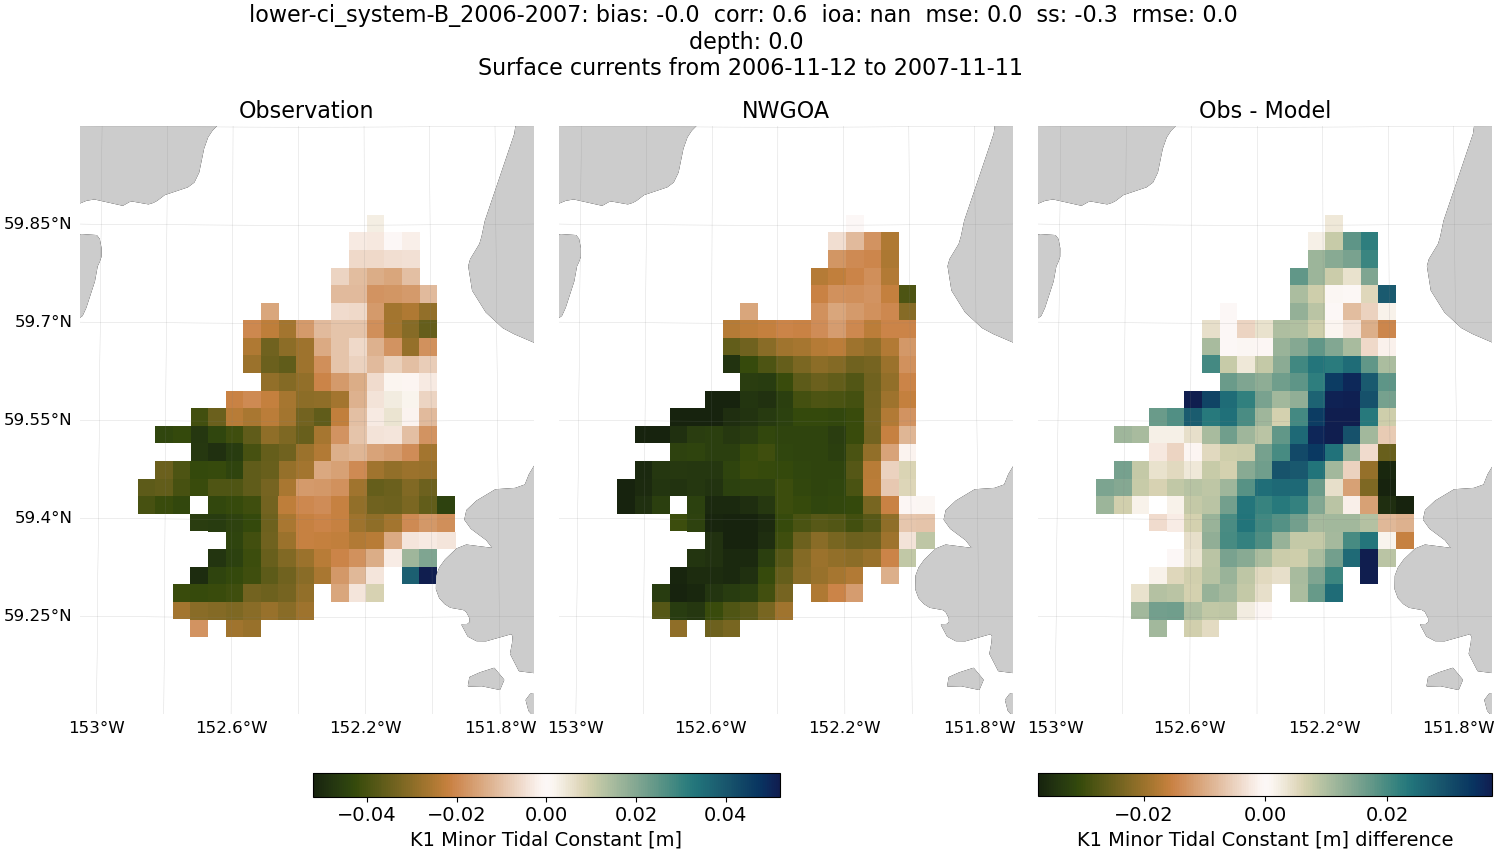
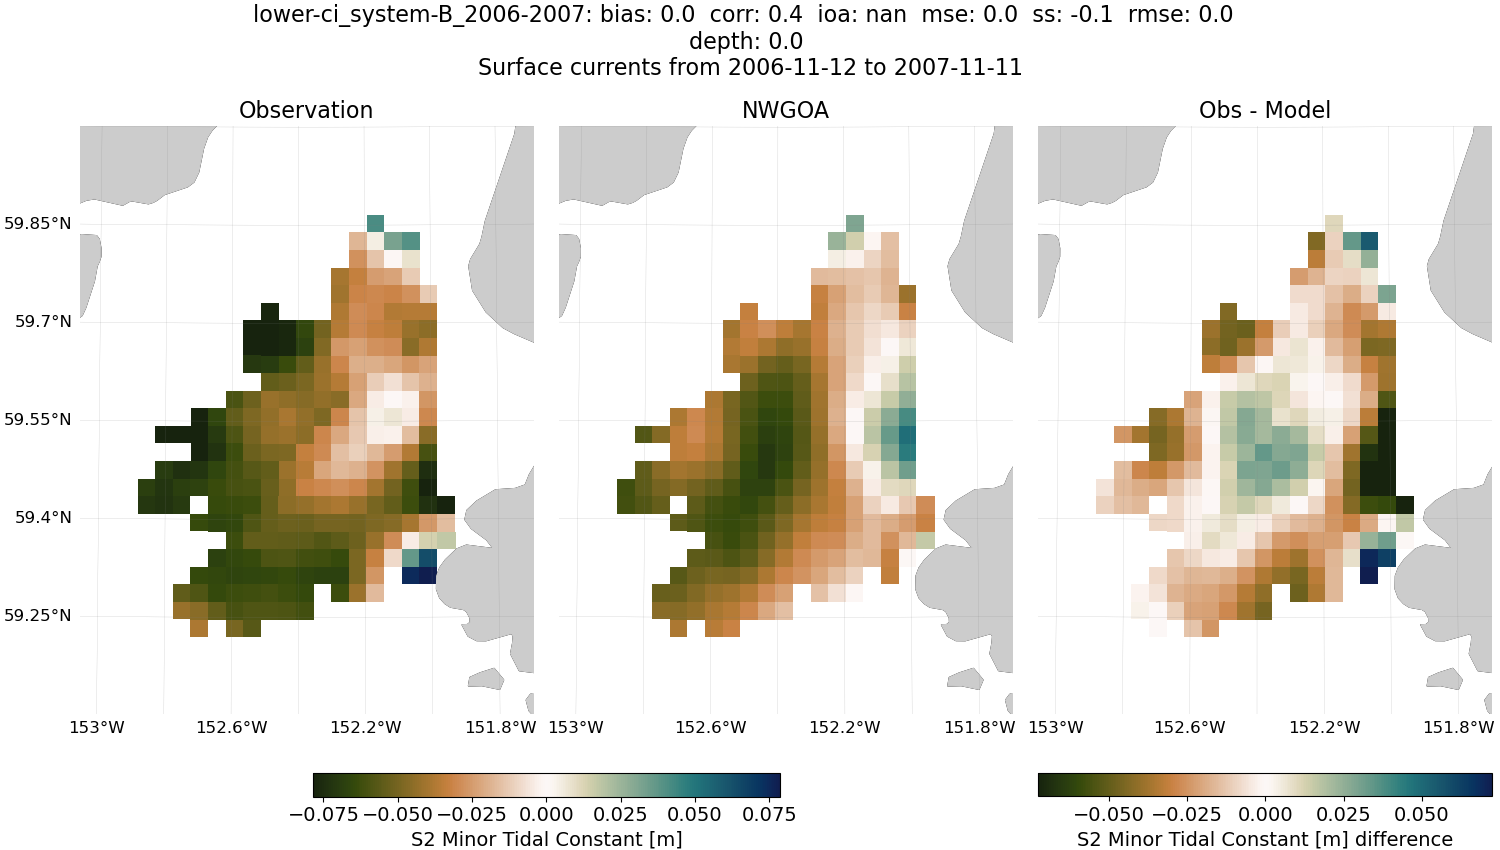
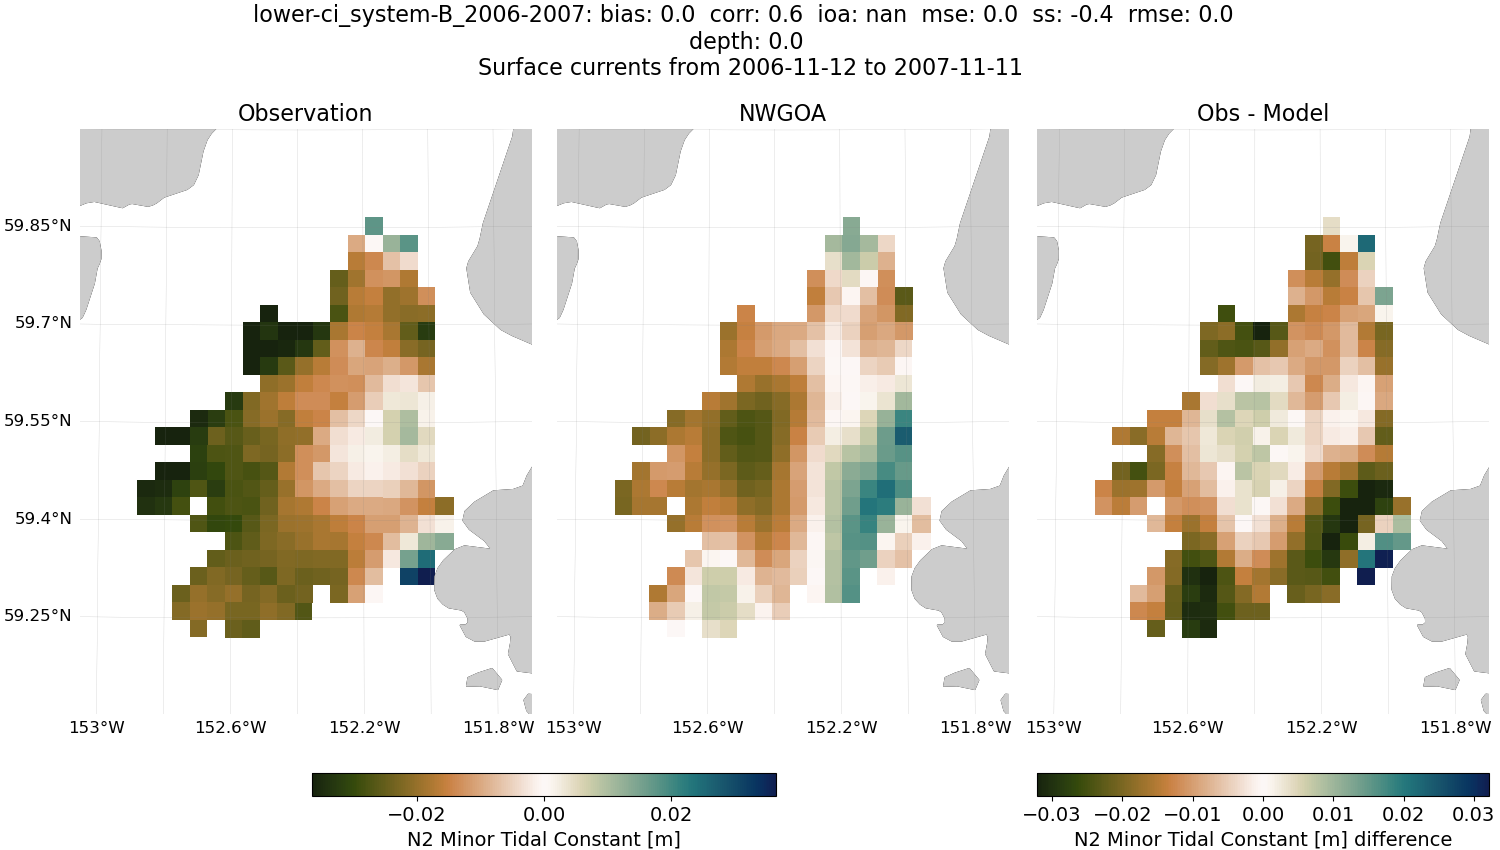
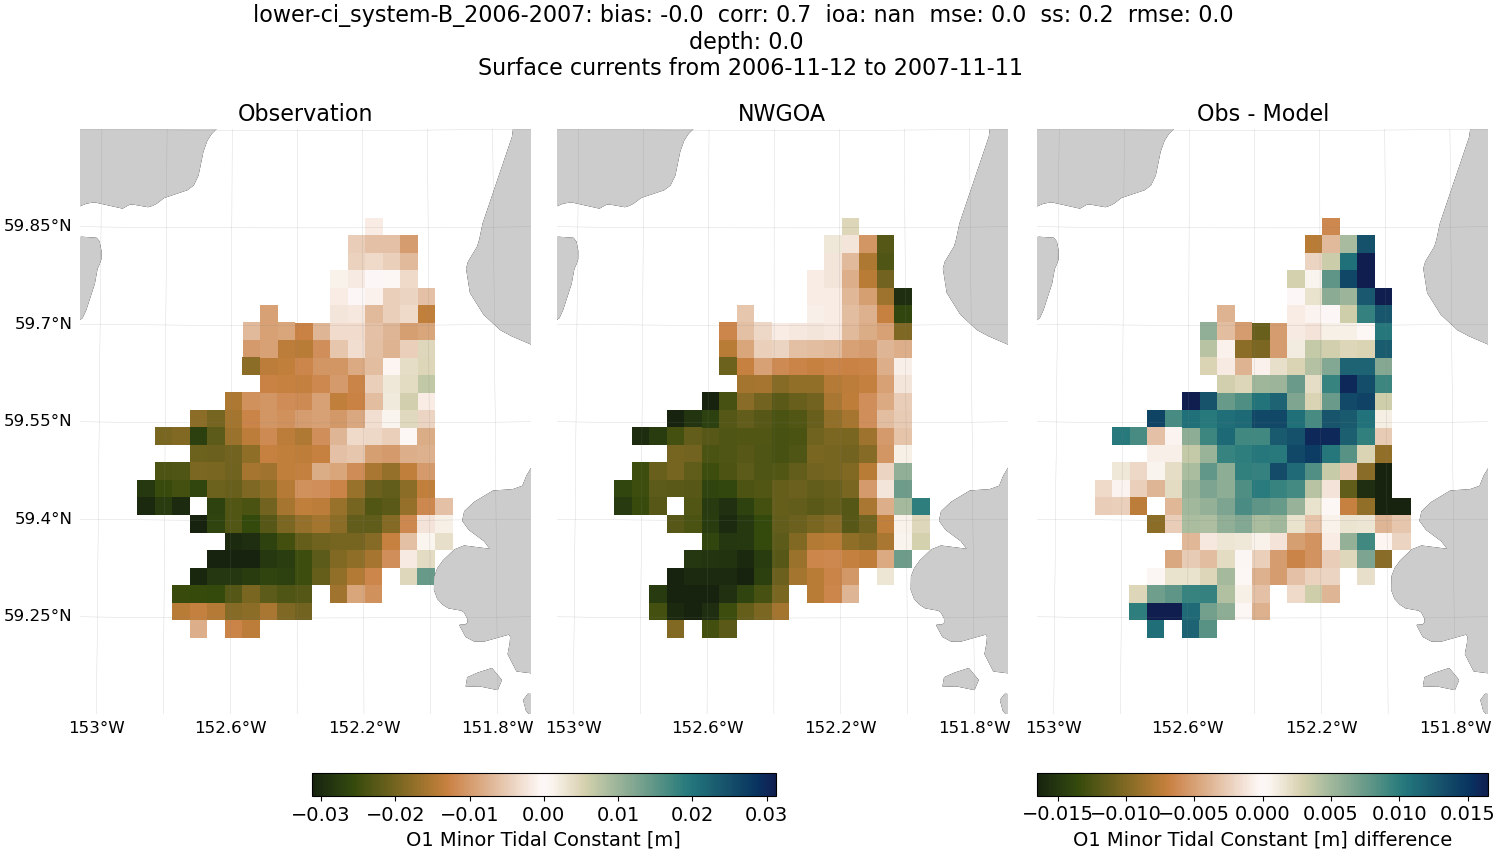
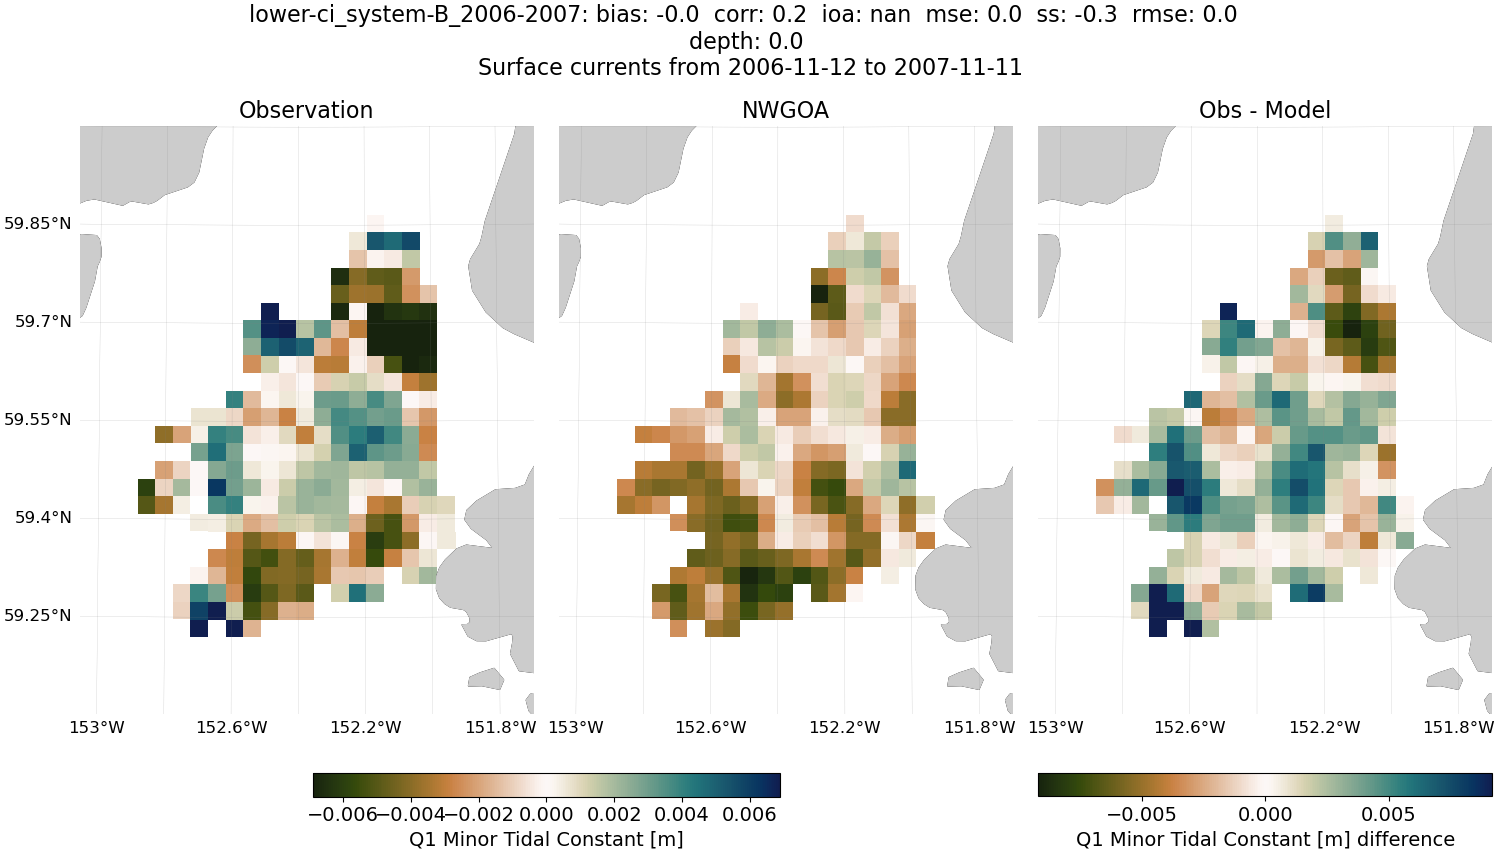
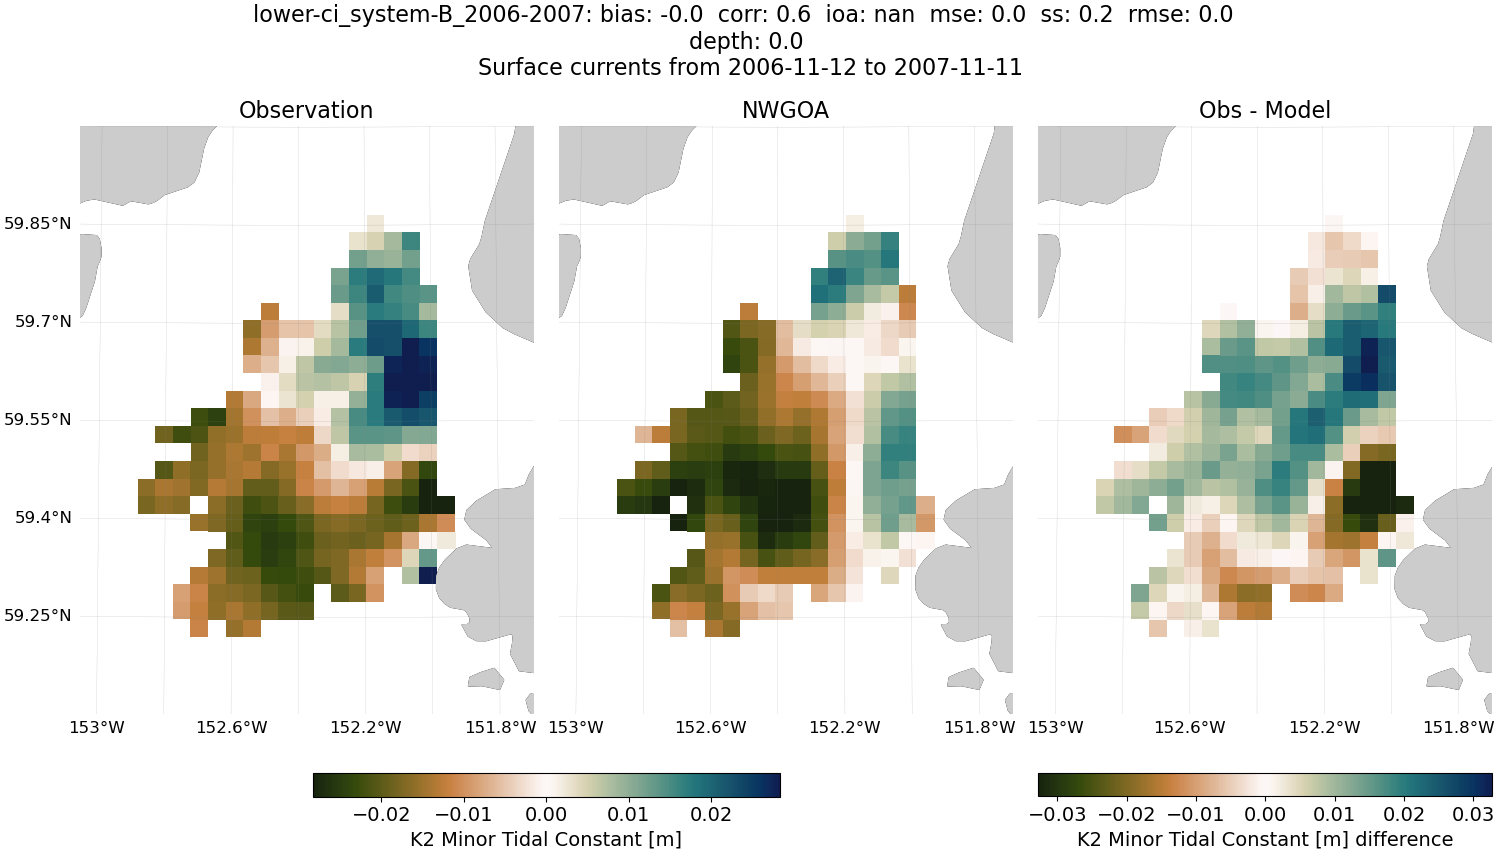
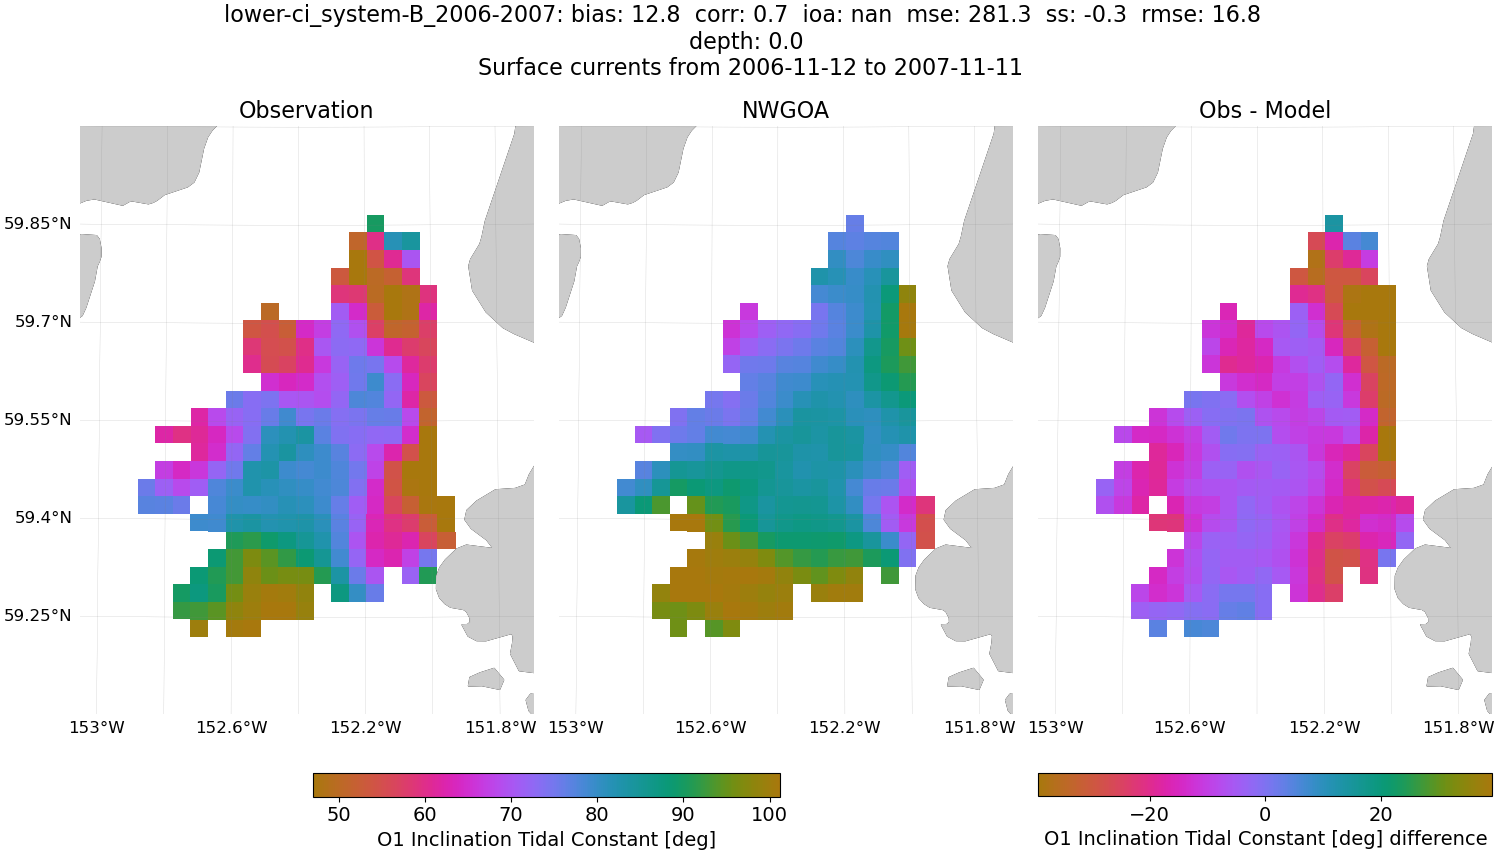
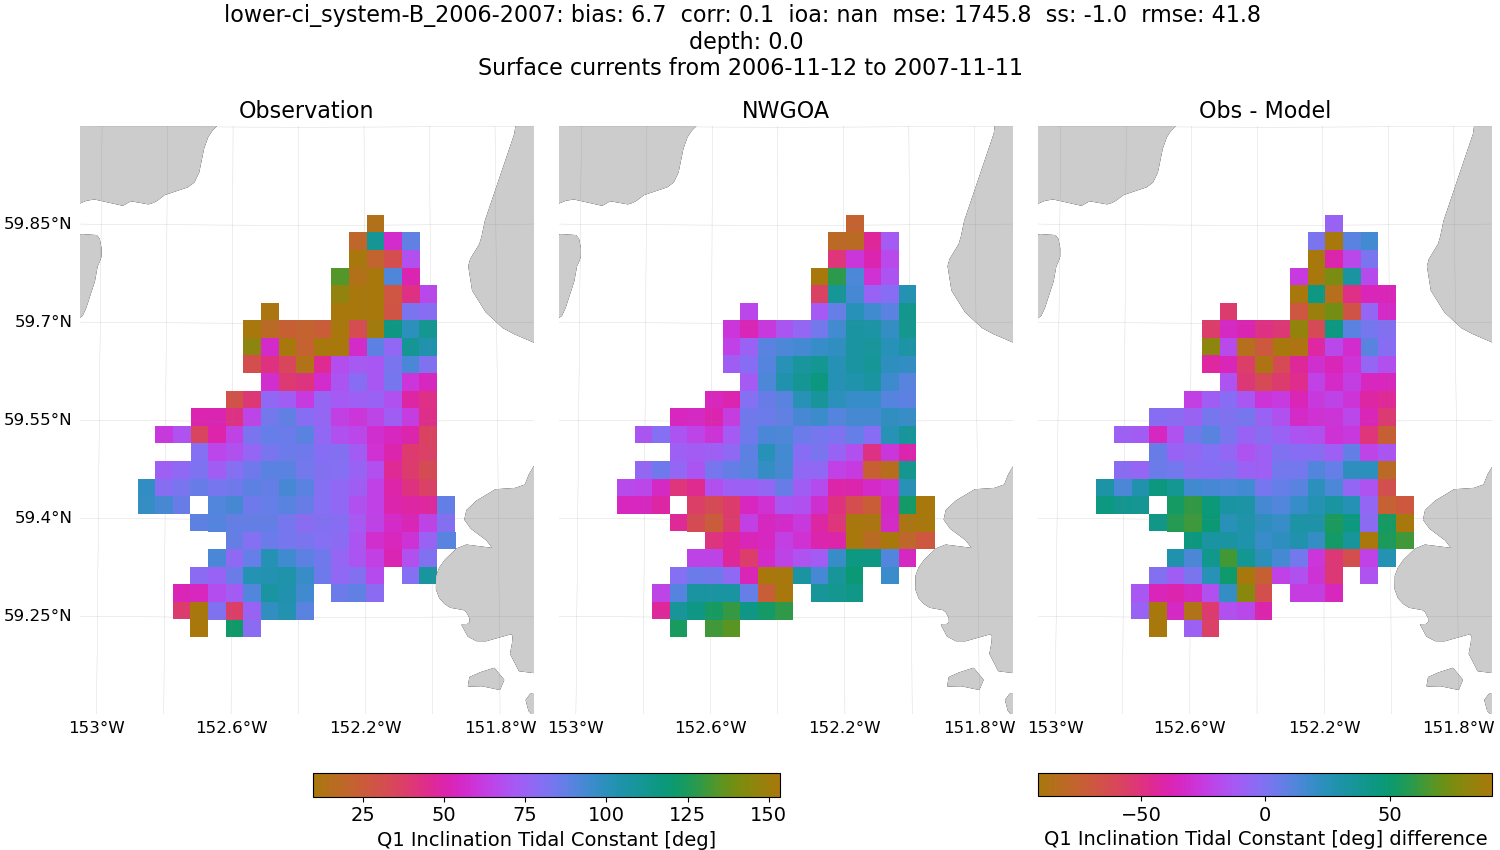
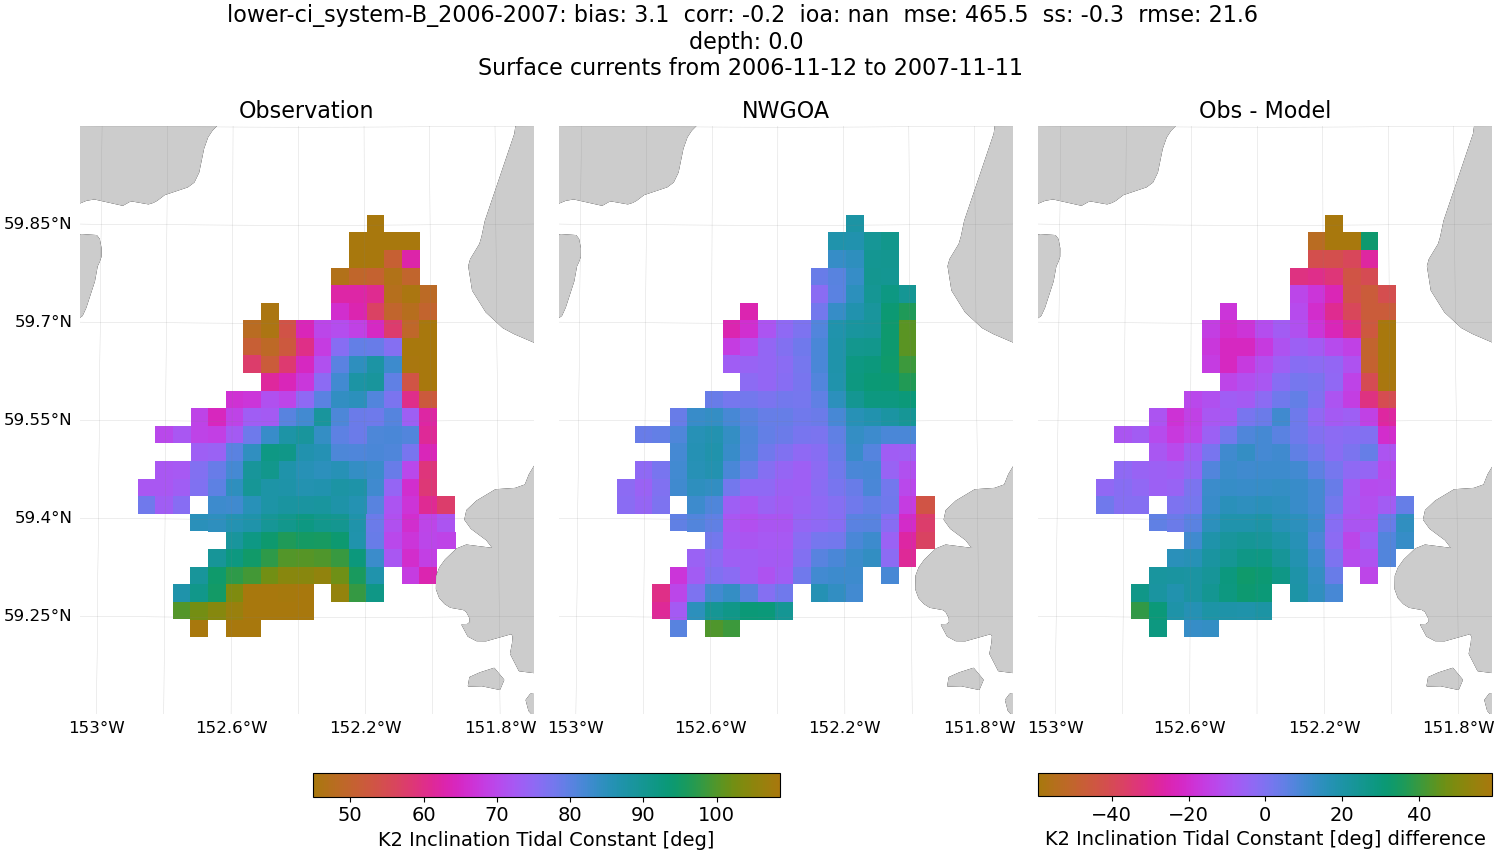
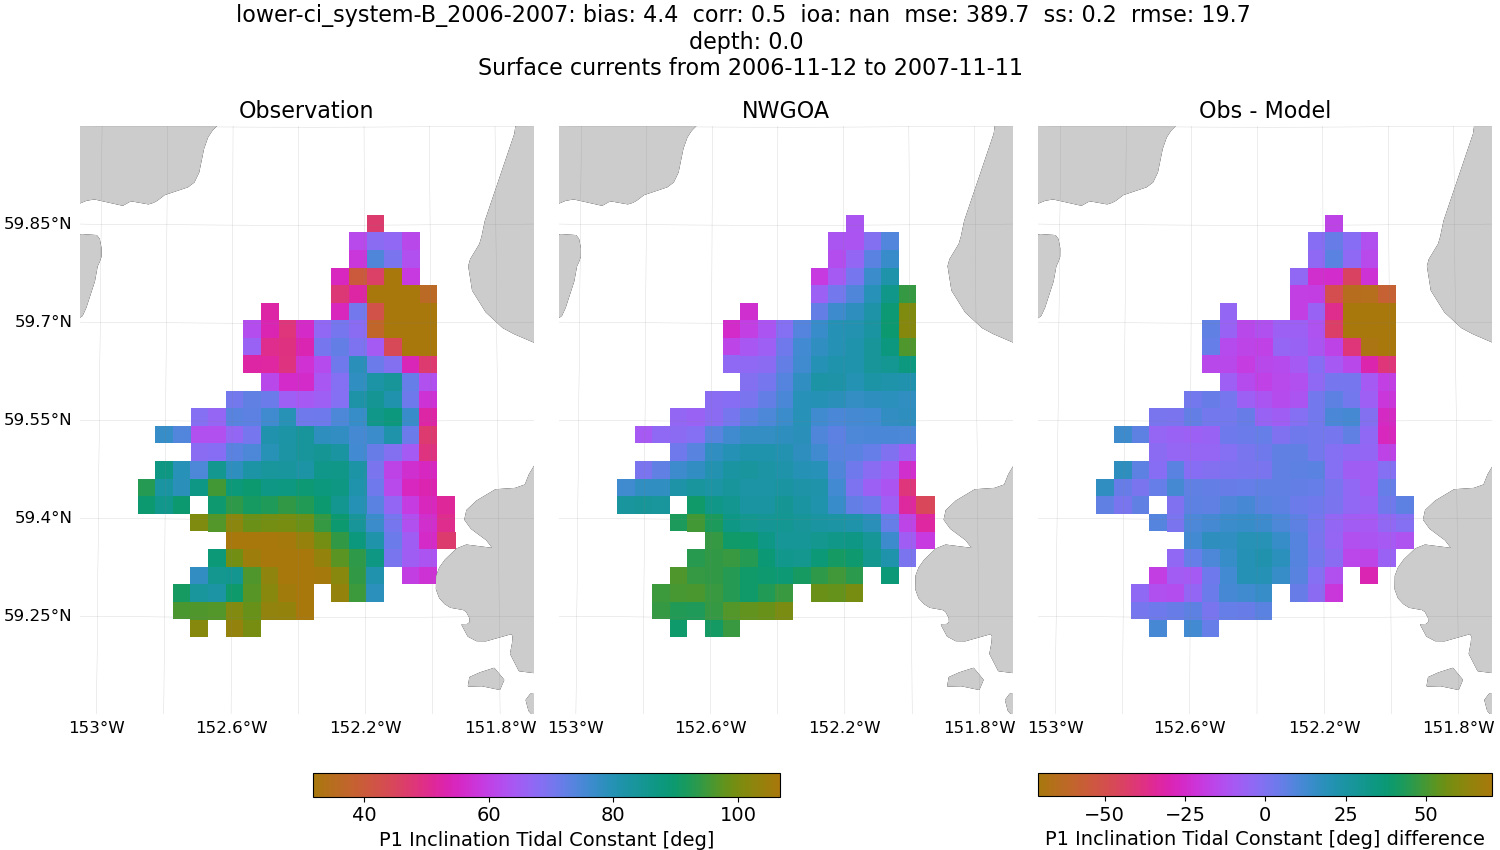
NWGOA
Major Amplitude
Minor Amplitude
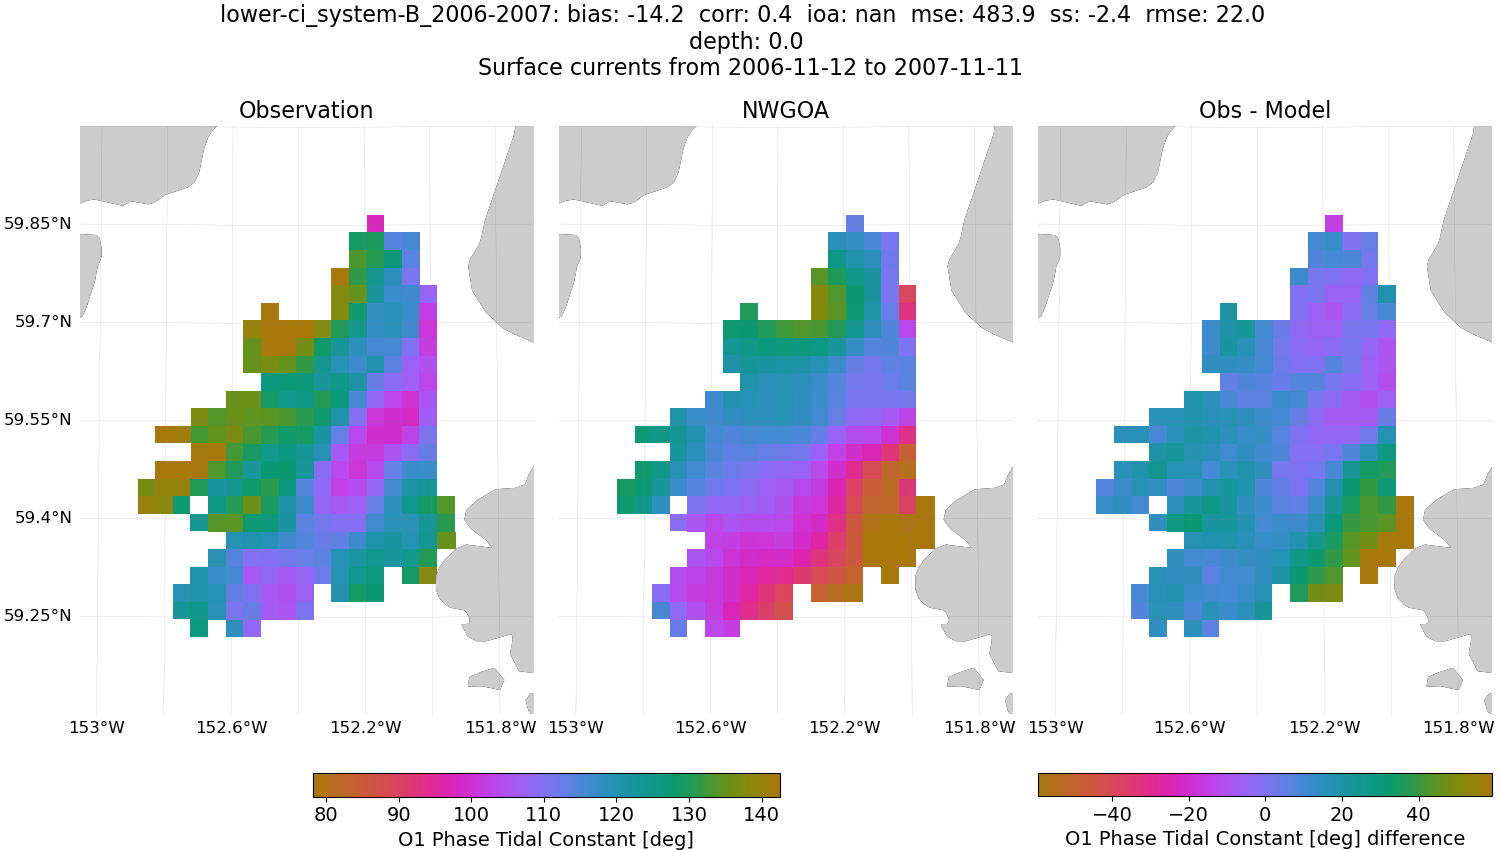
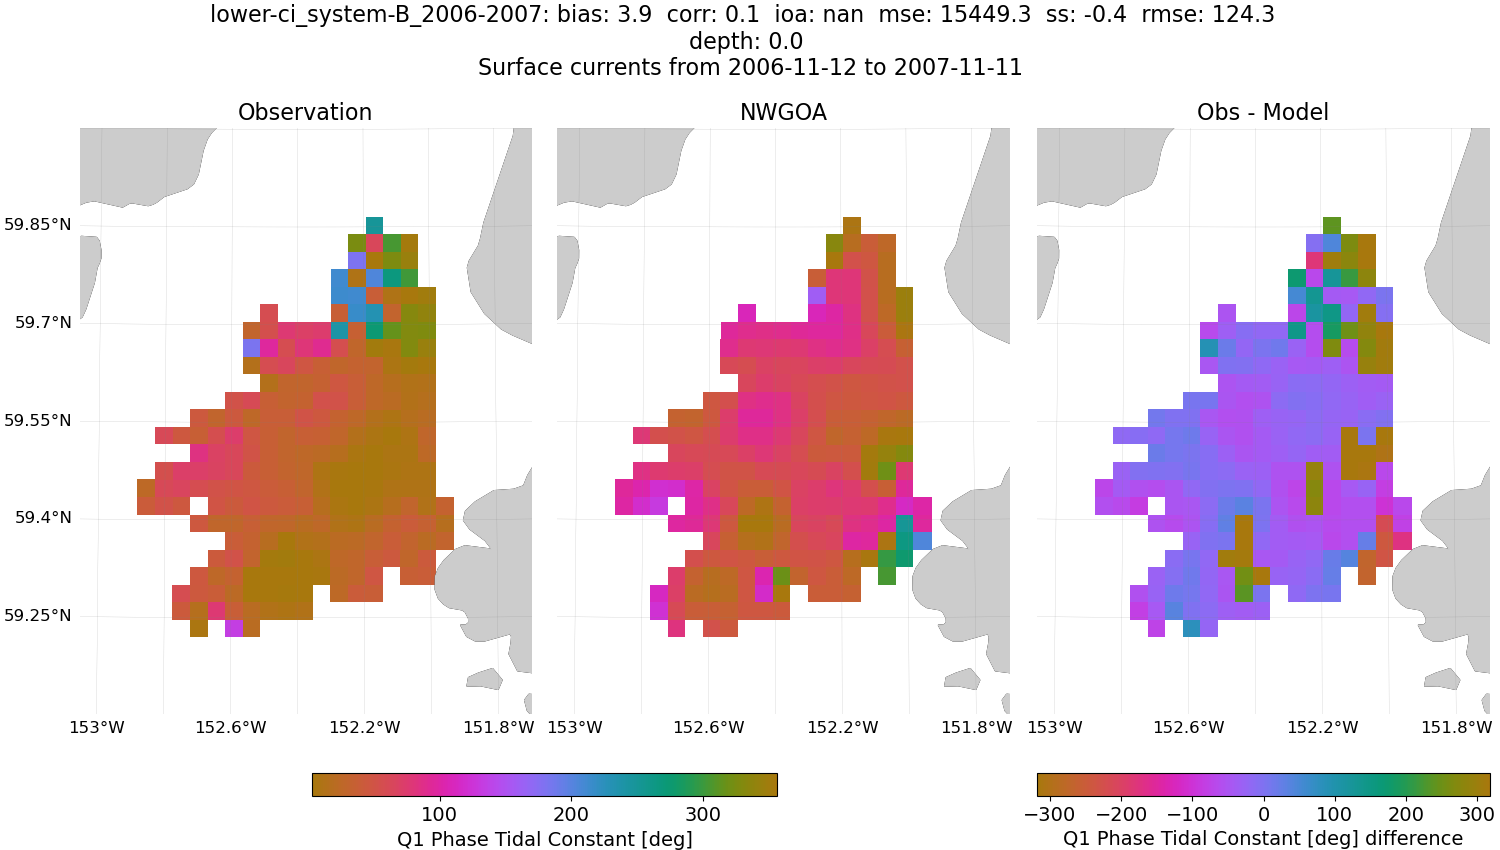
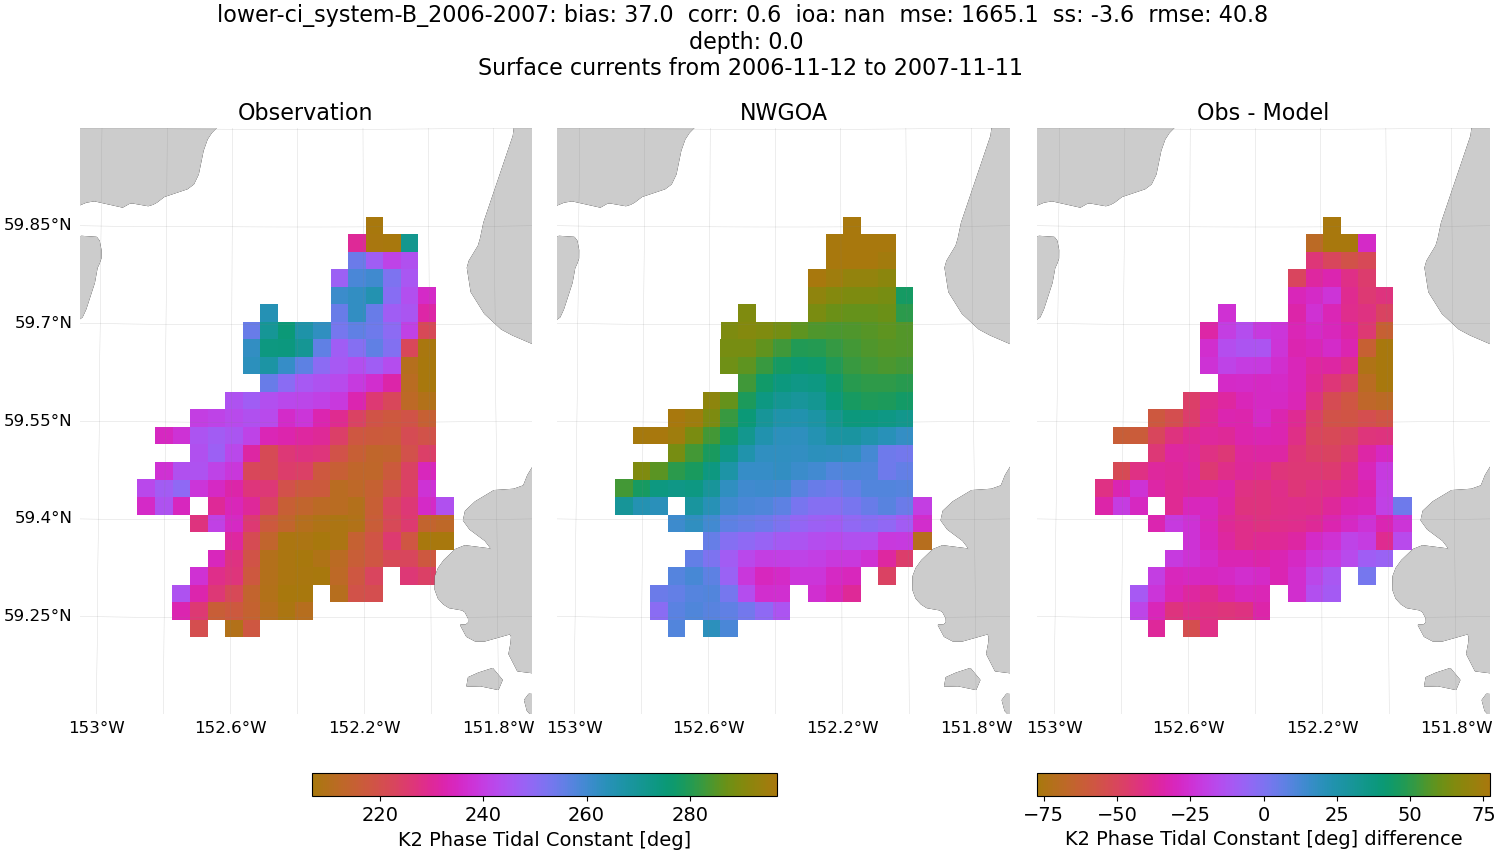
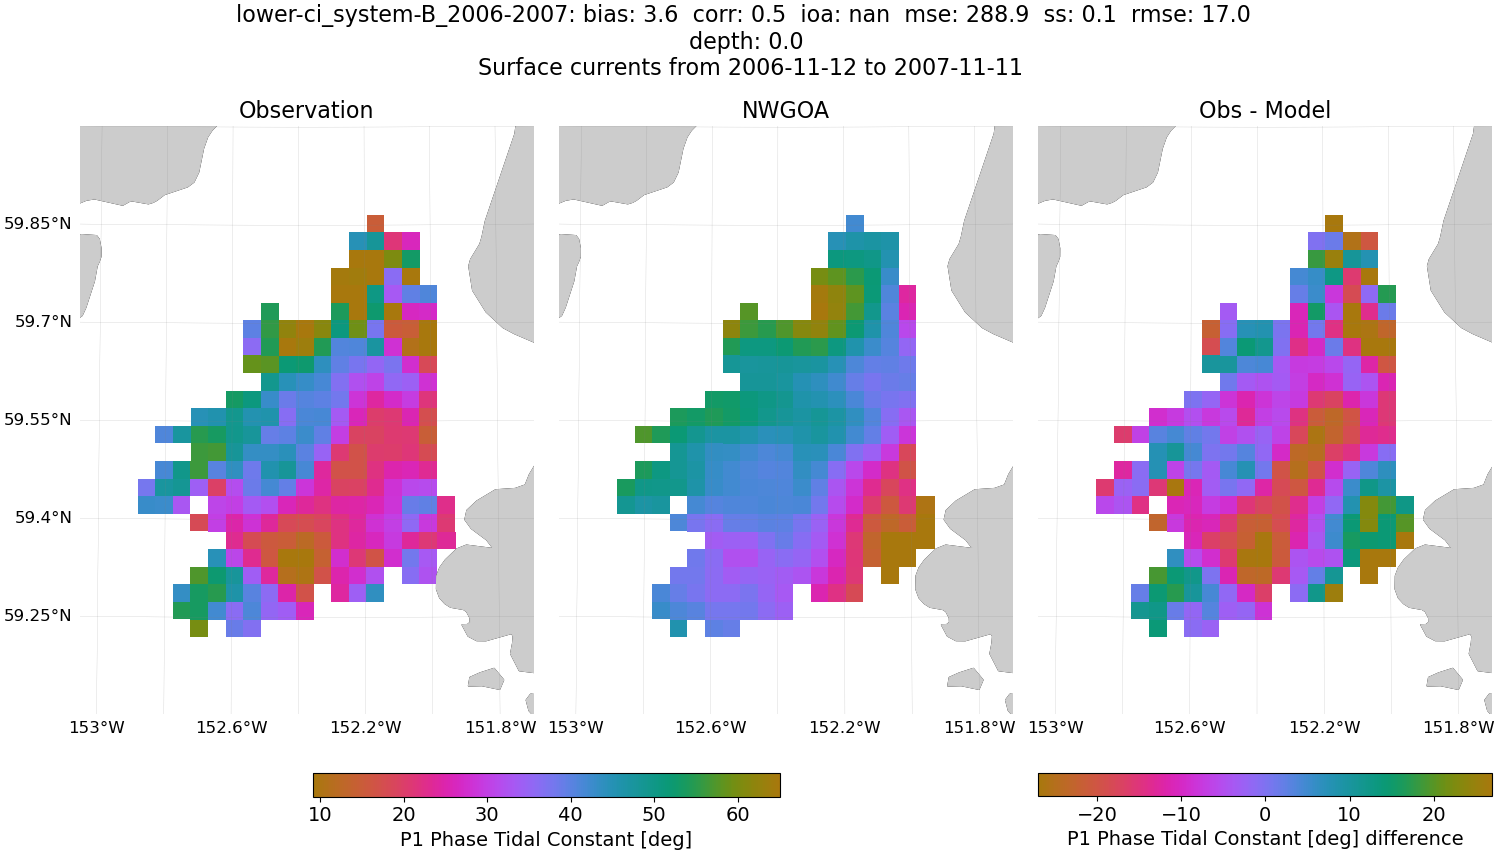
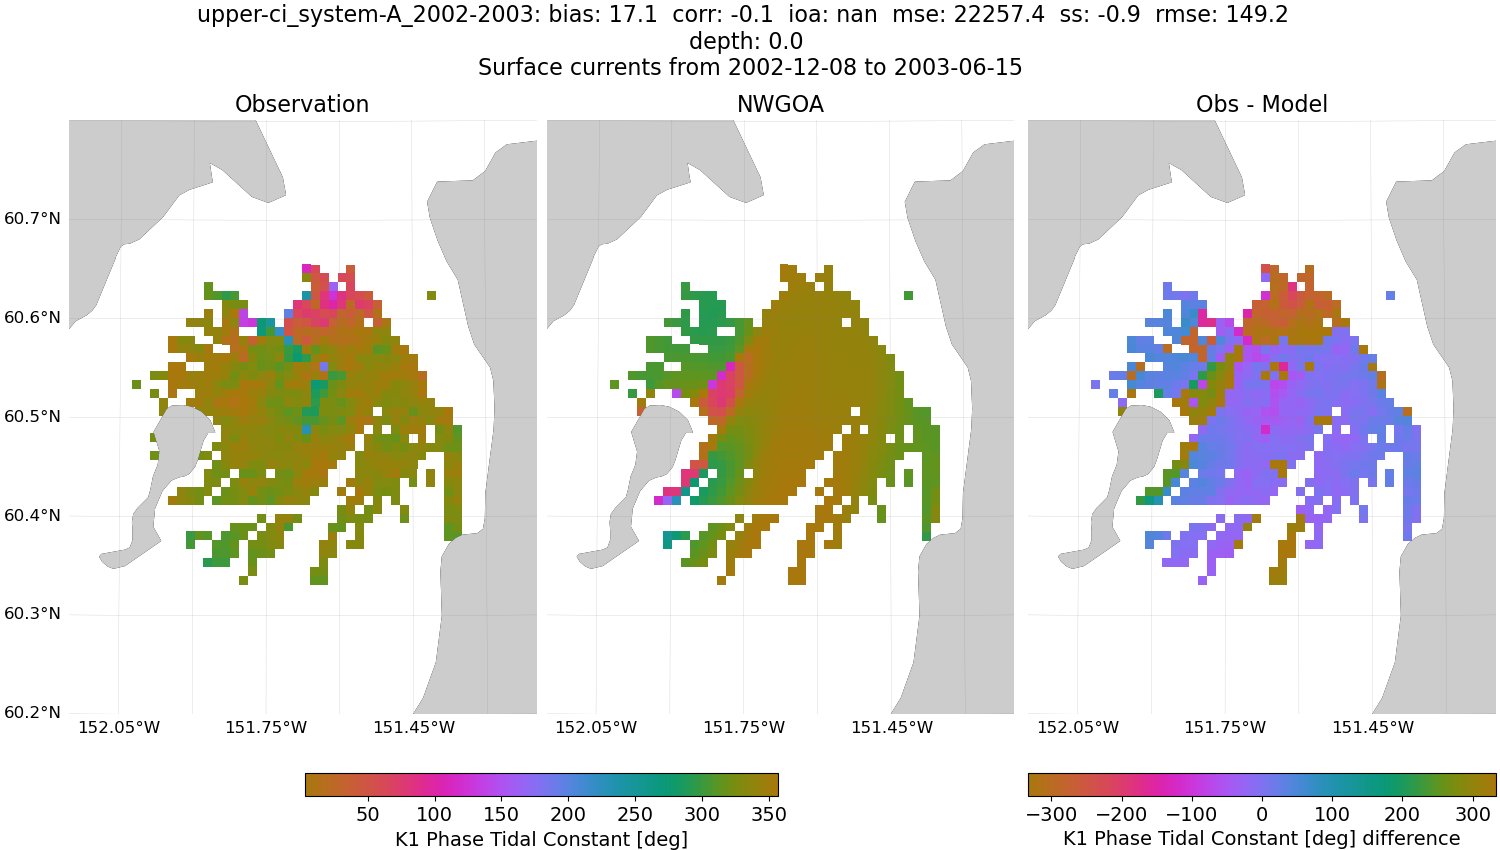
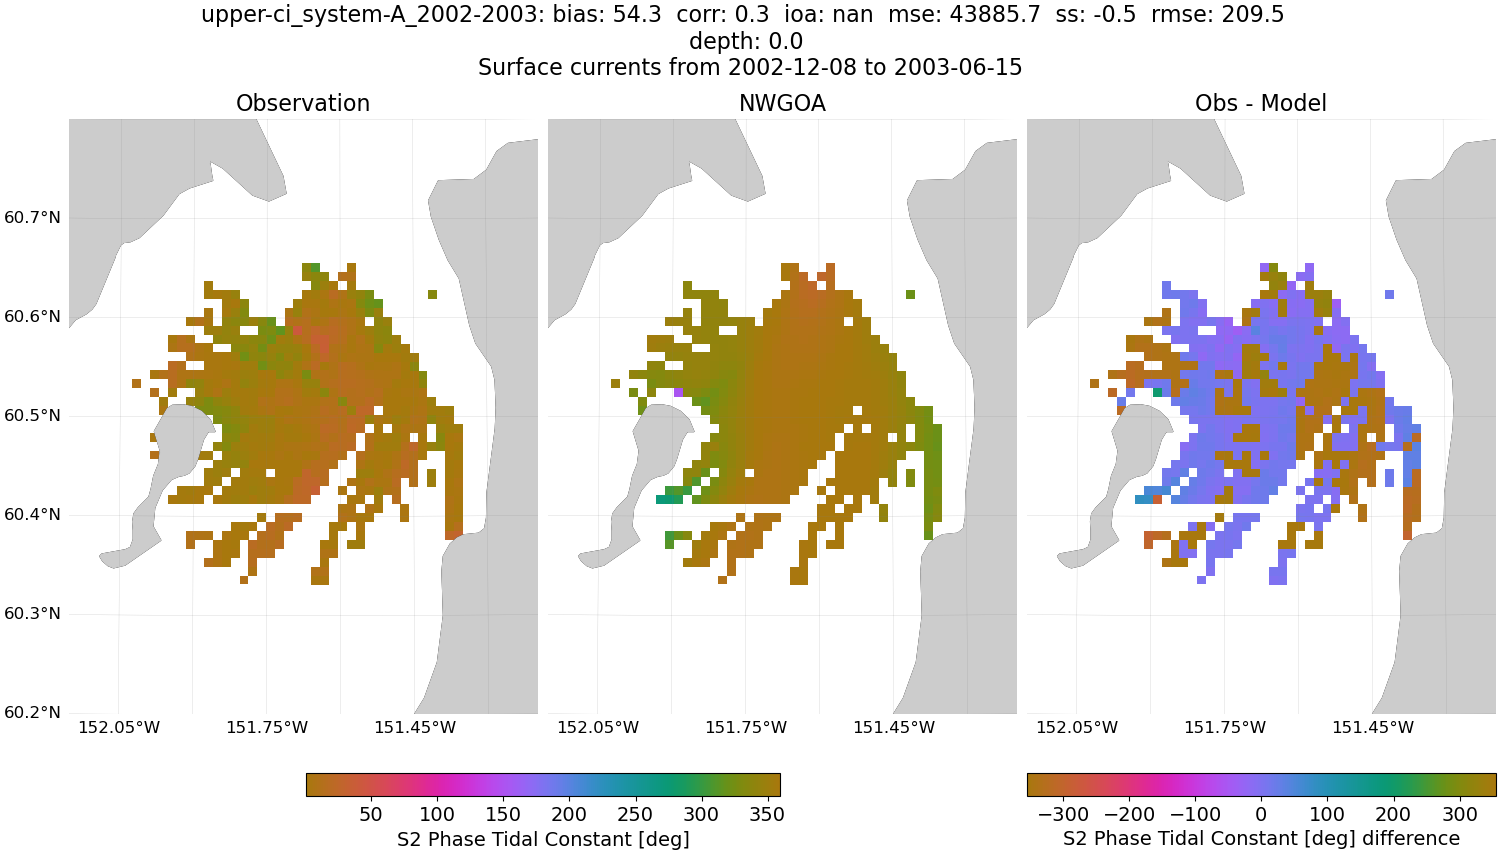
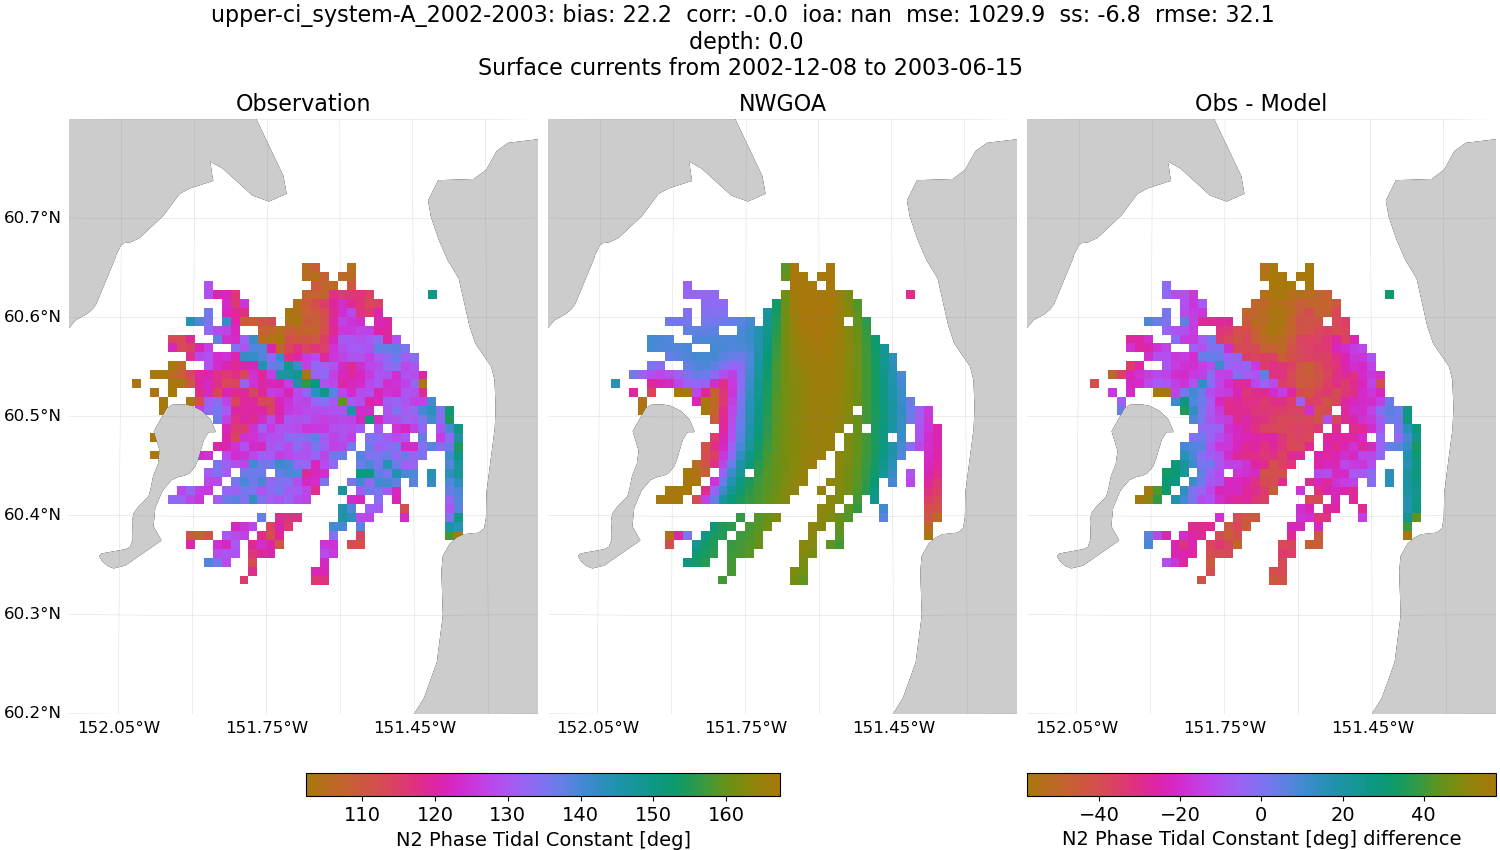
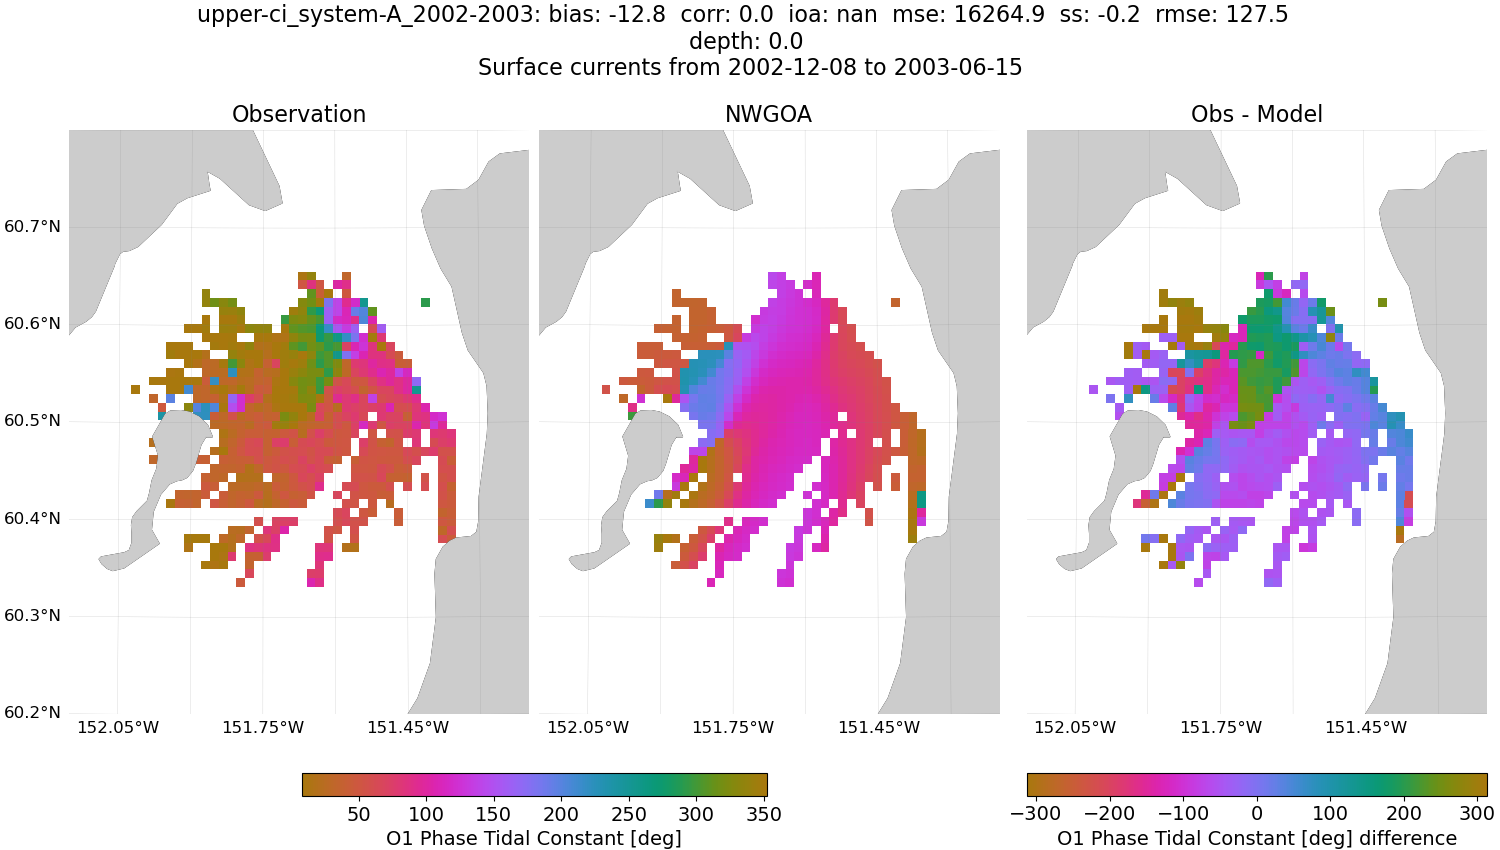
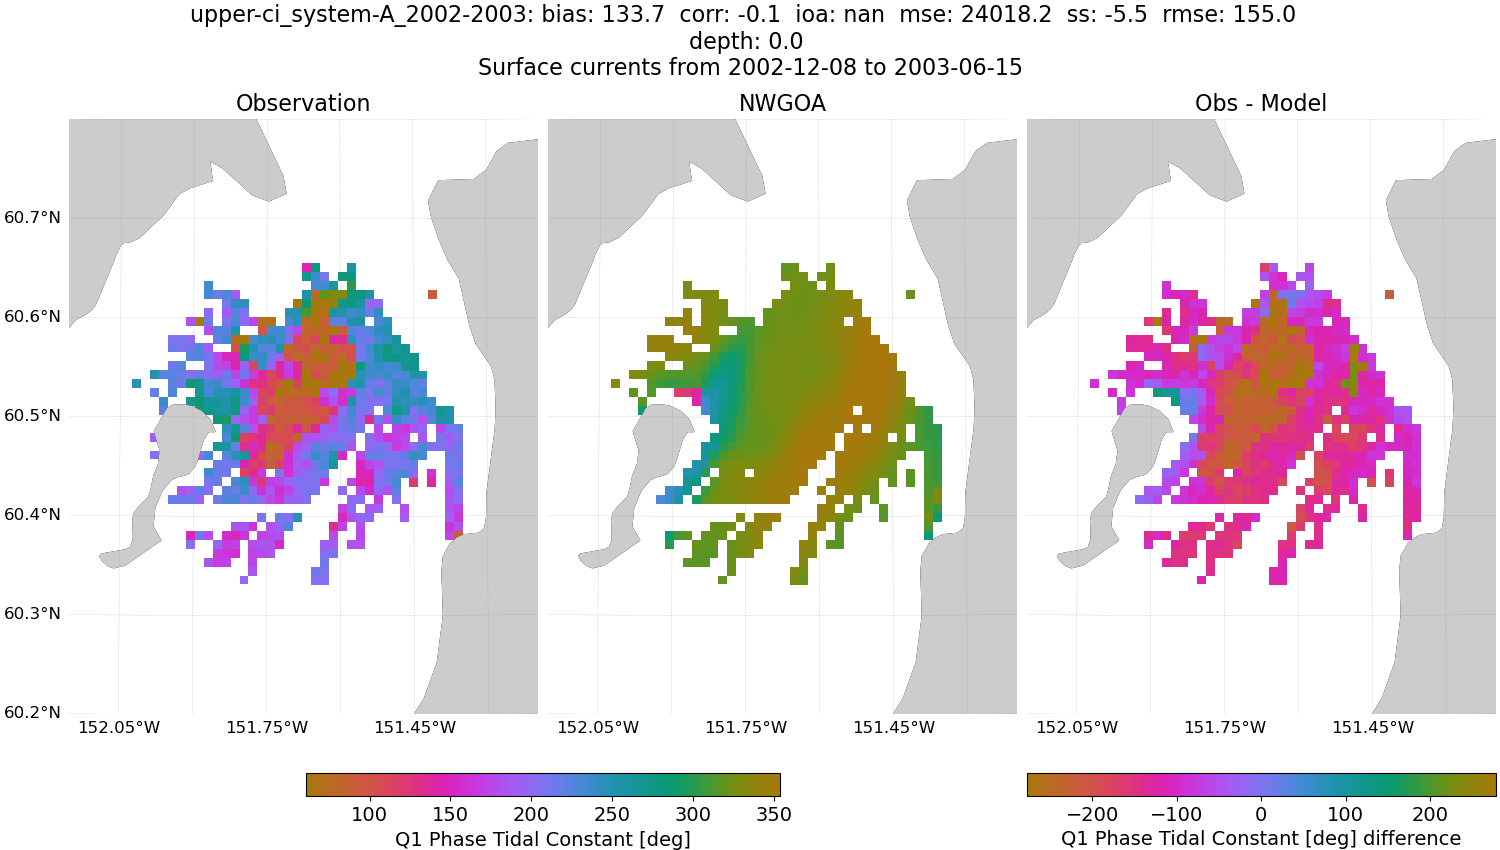
Phase

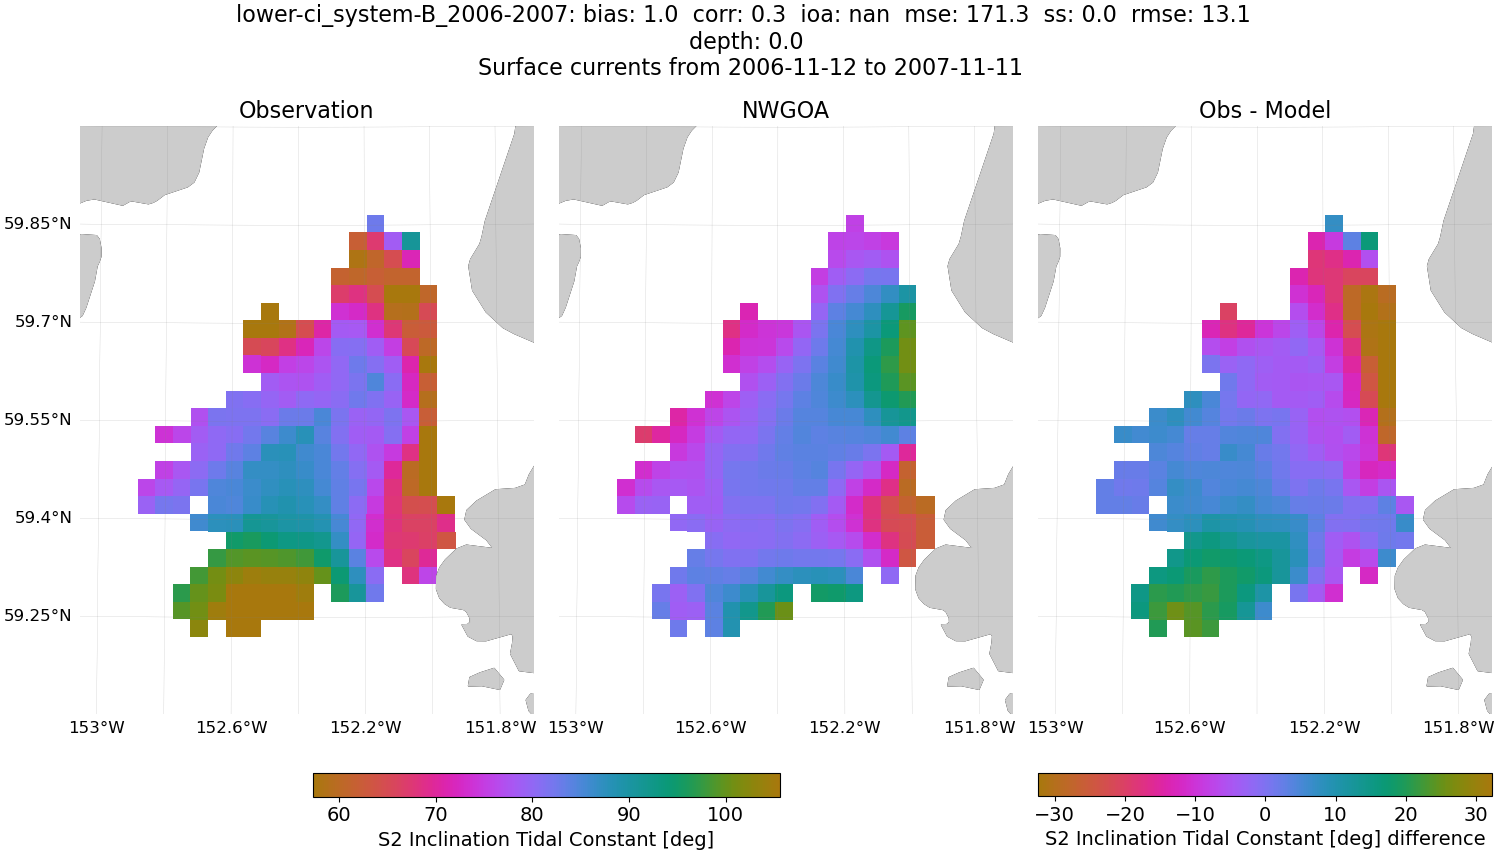
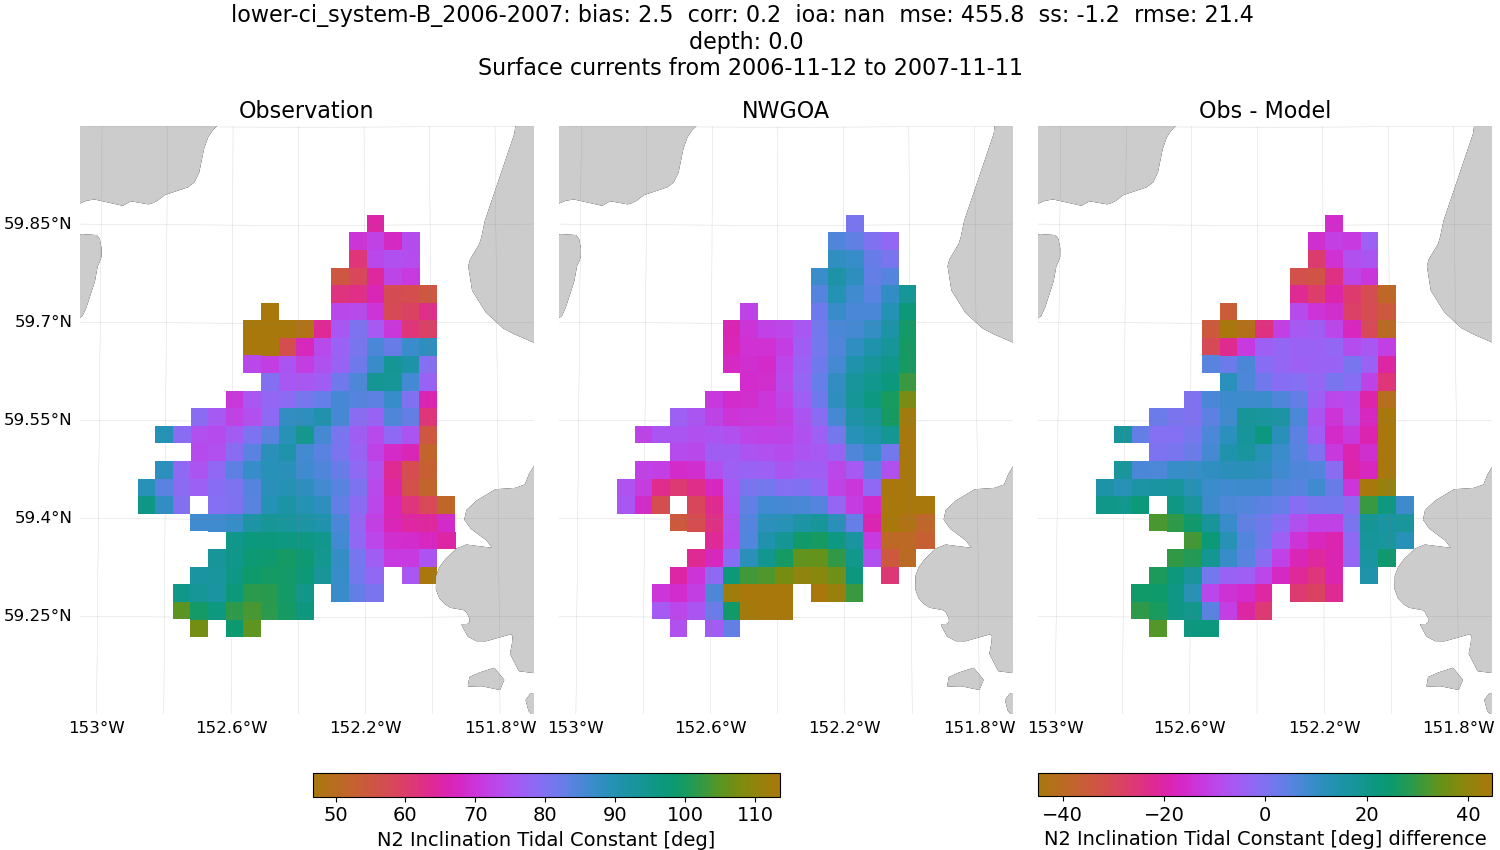
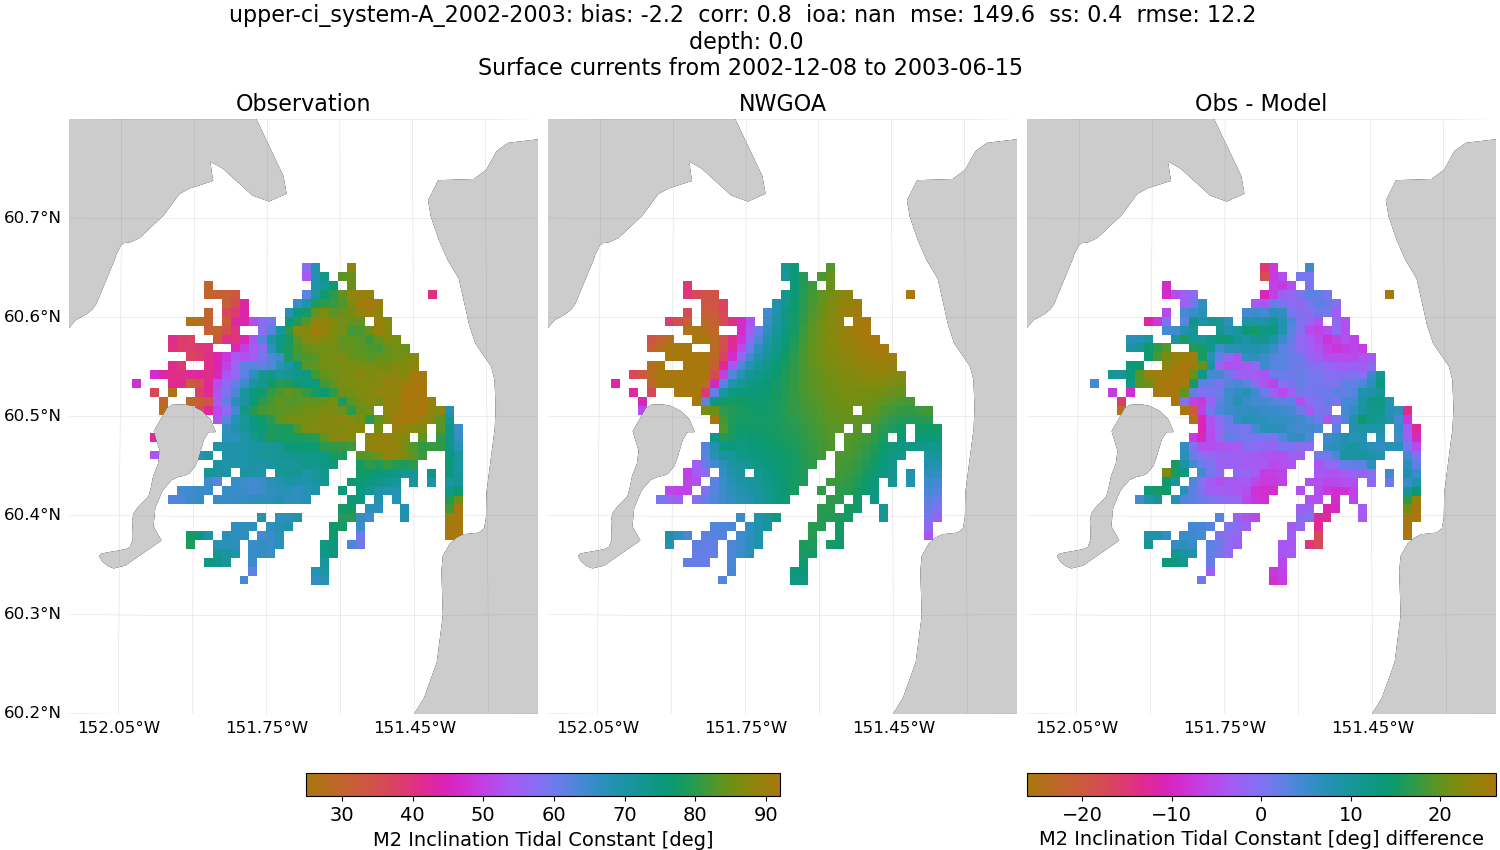
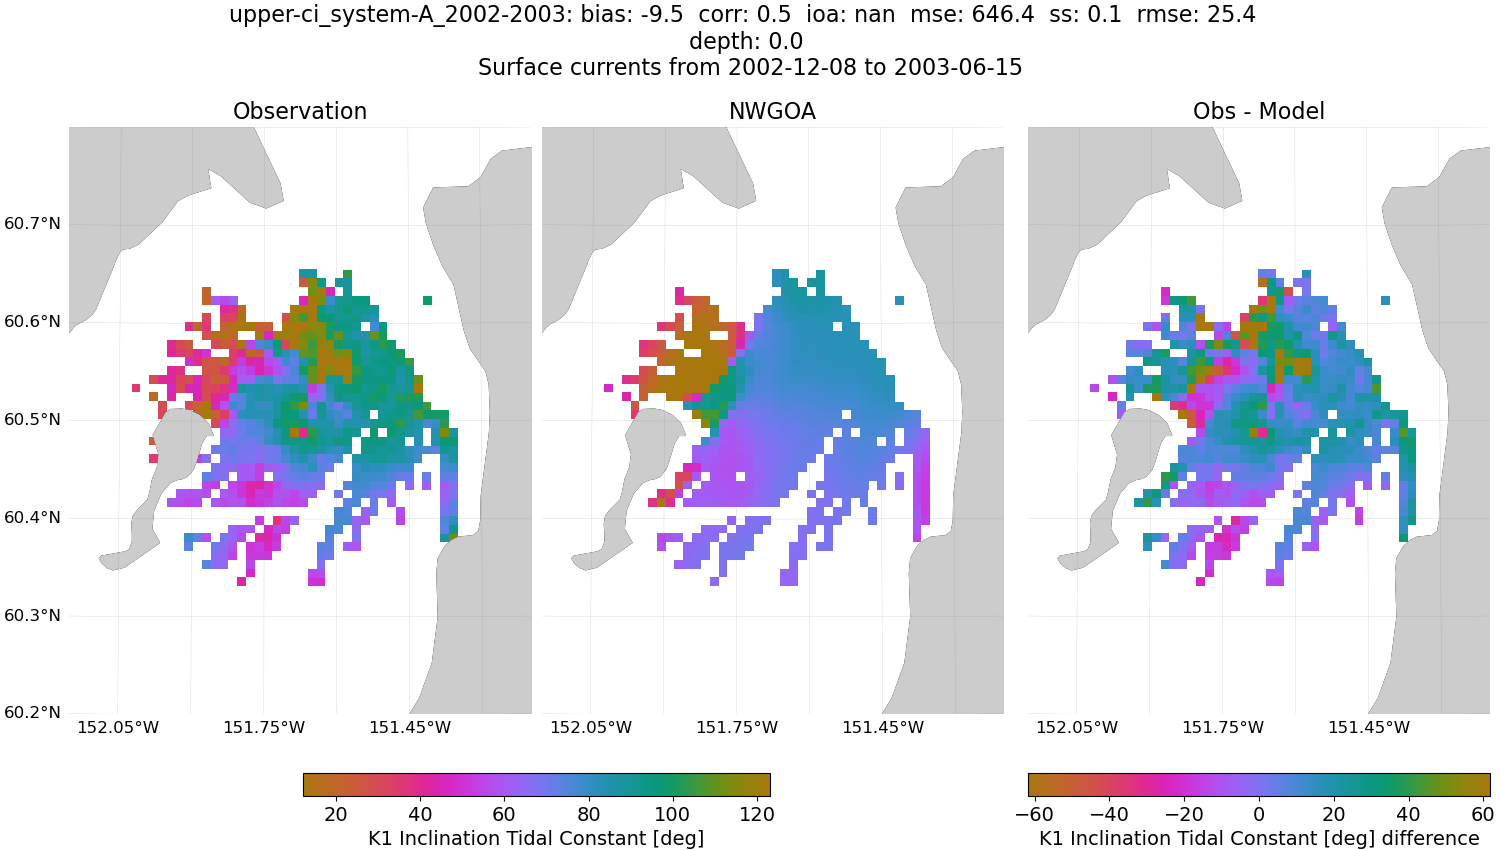
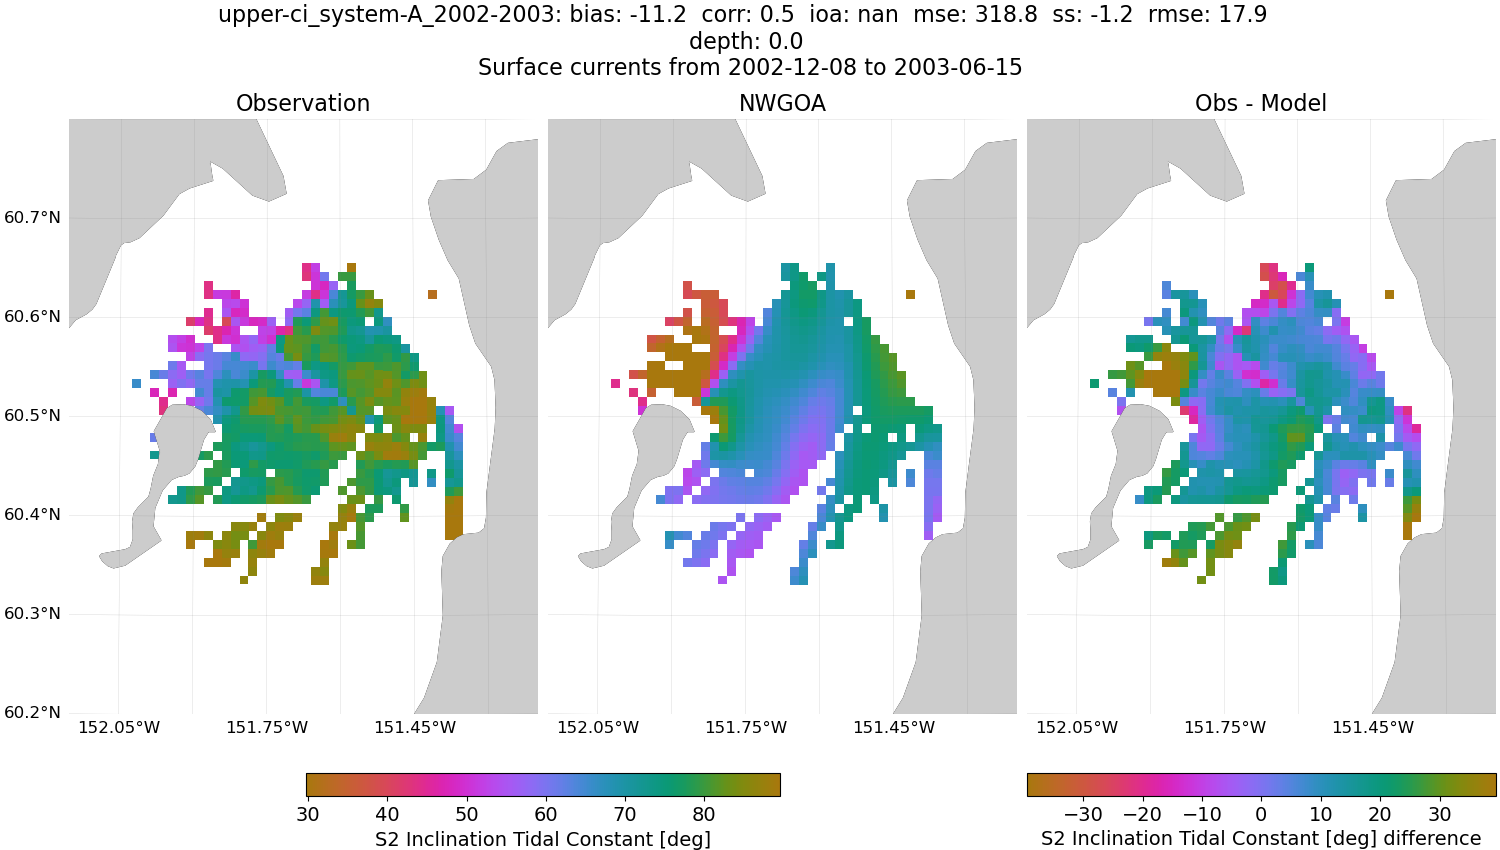
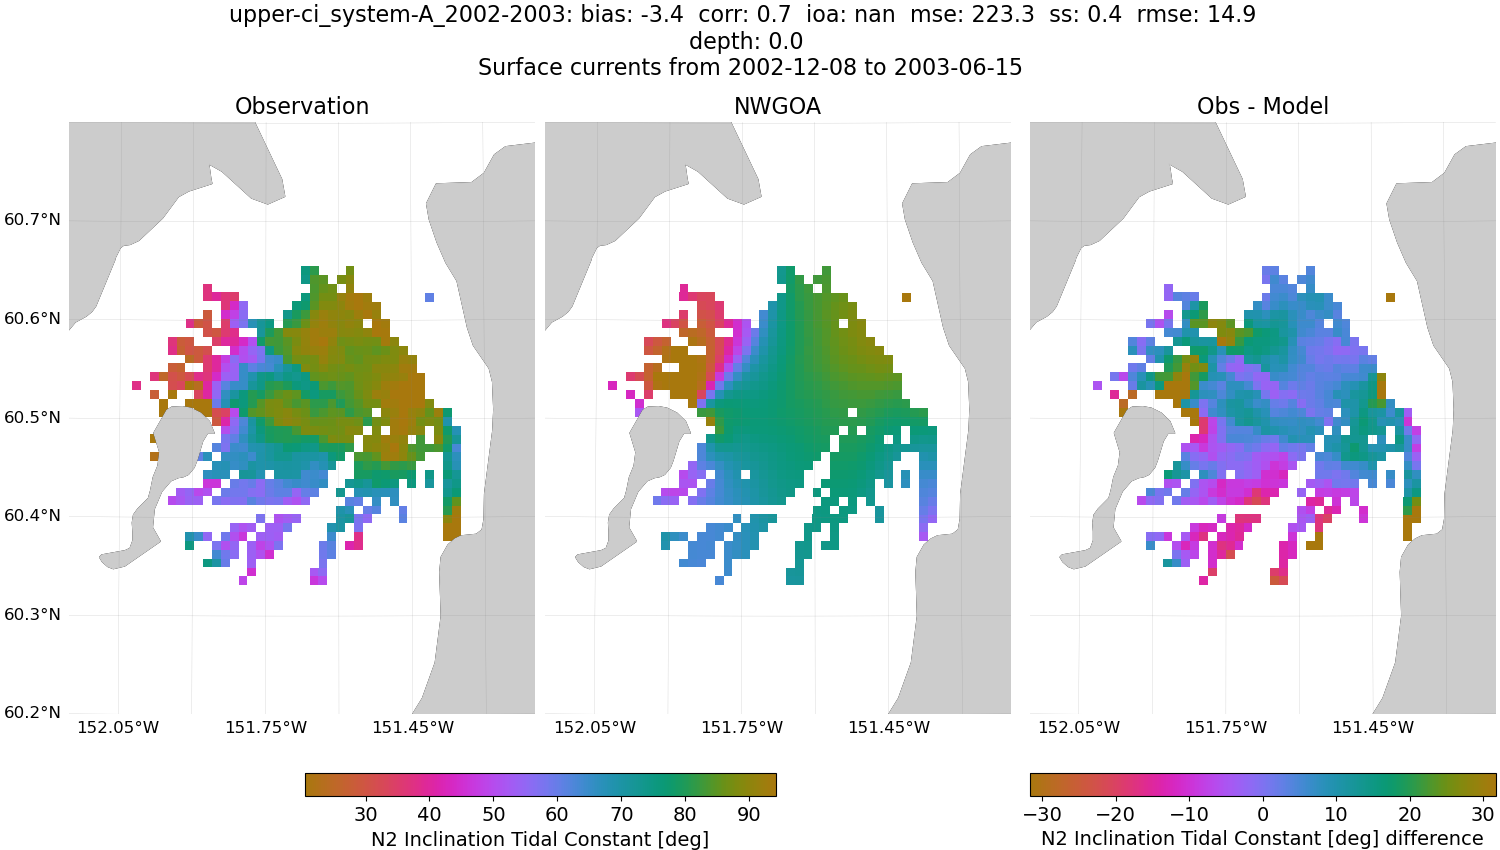
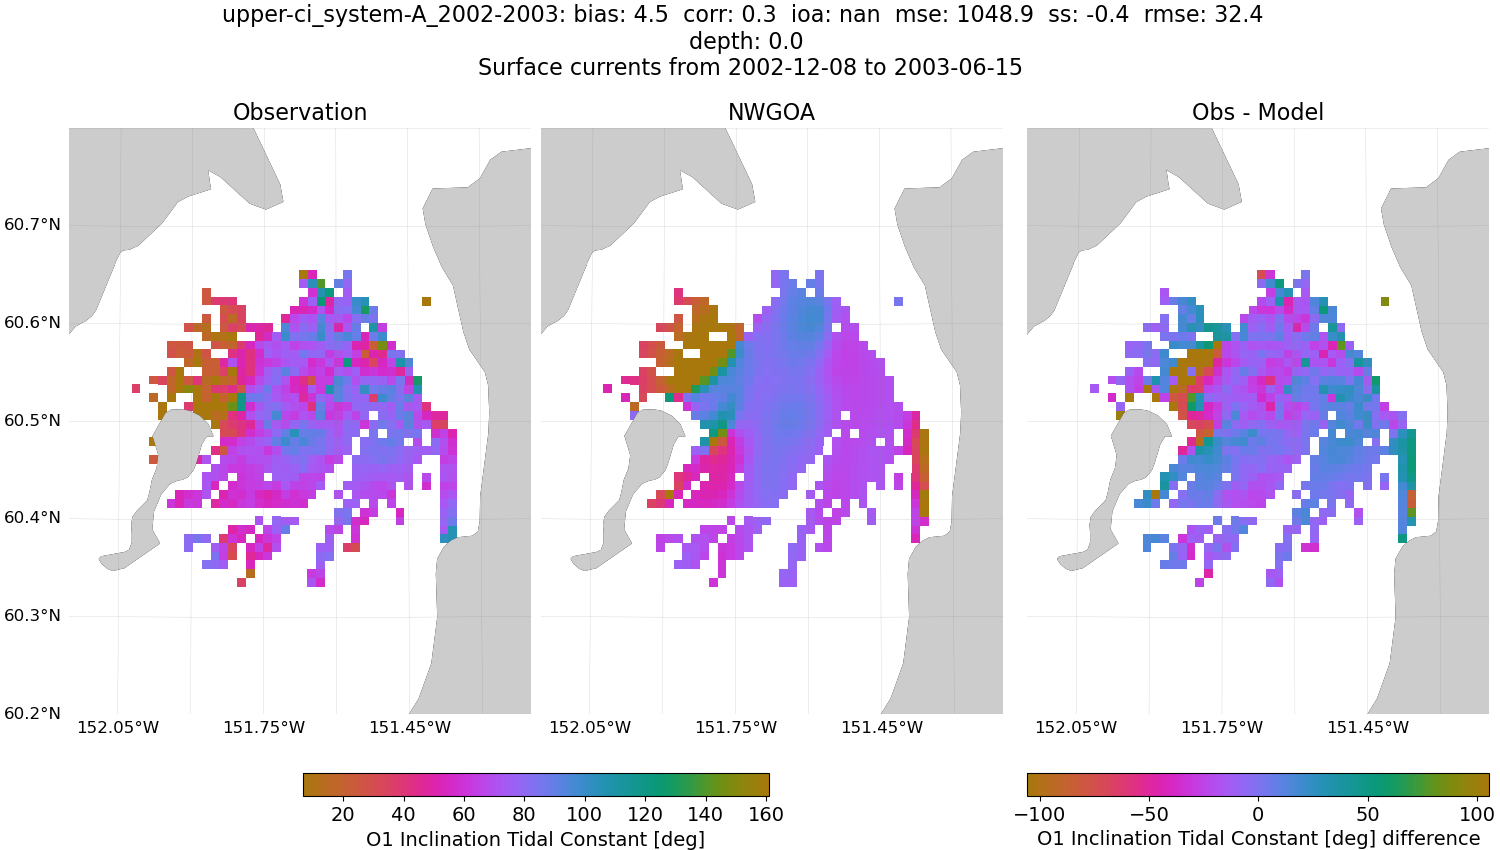
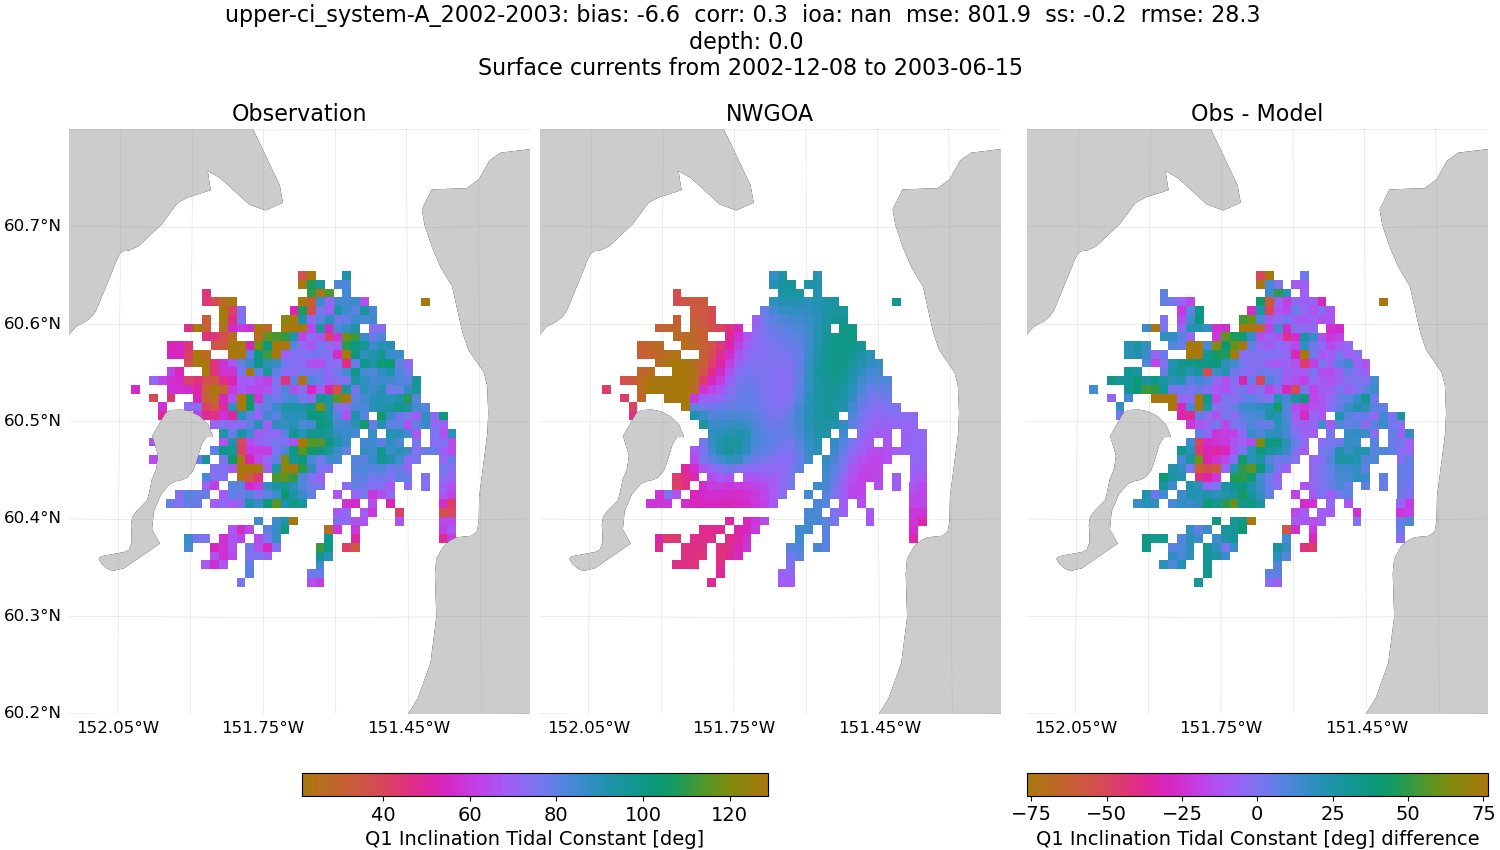
Inclination
upper-ci_system-A_2002-2003#
M2 Tidal Ellipses#
CIOFS#
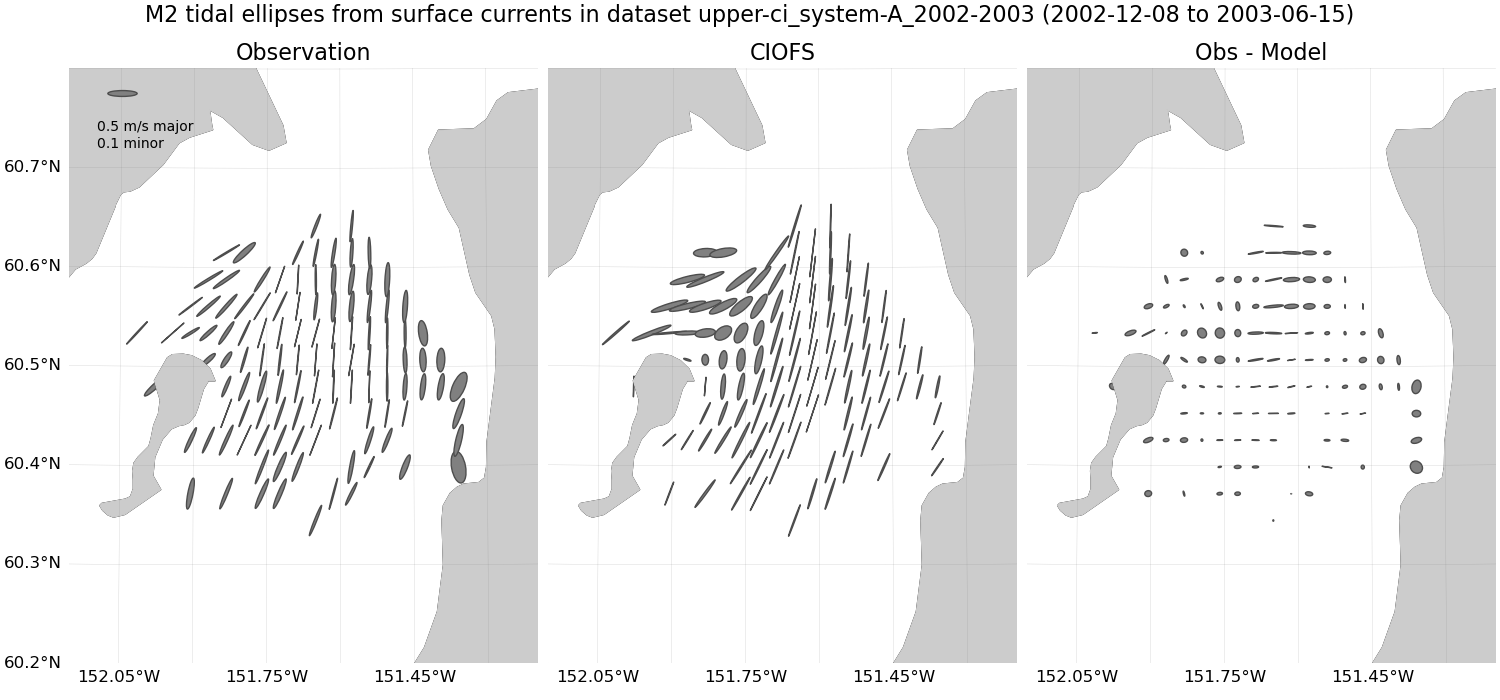
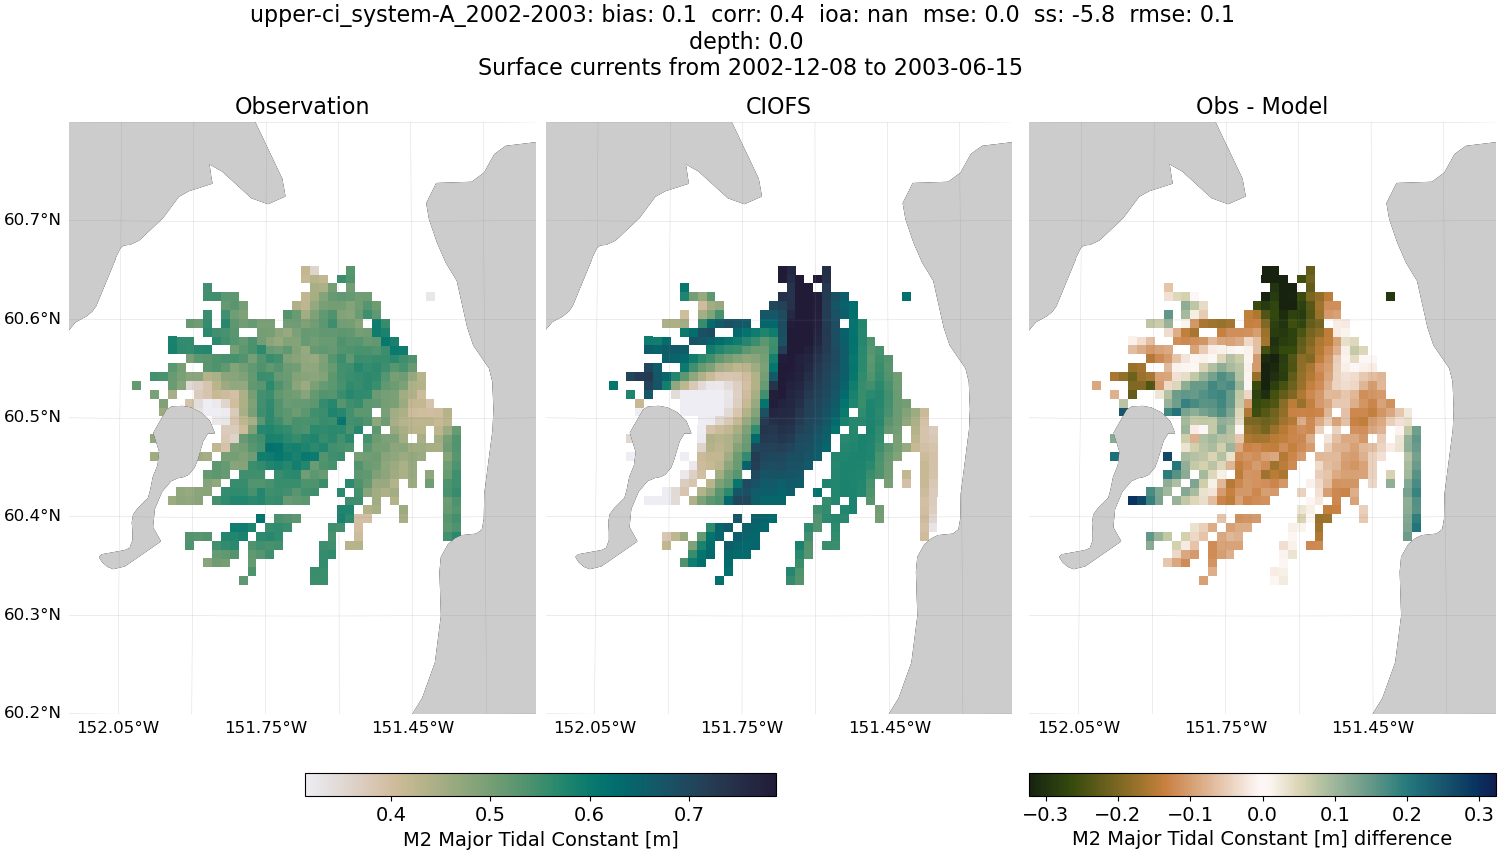
Fig. 67 M2 tidal ellipses from surface currents for CIOFS and dataset upper-ci_system-A_2002-2003#
NWGOA#
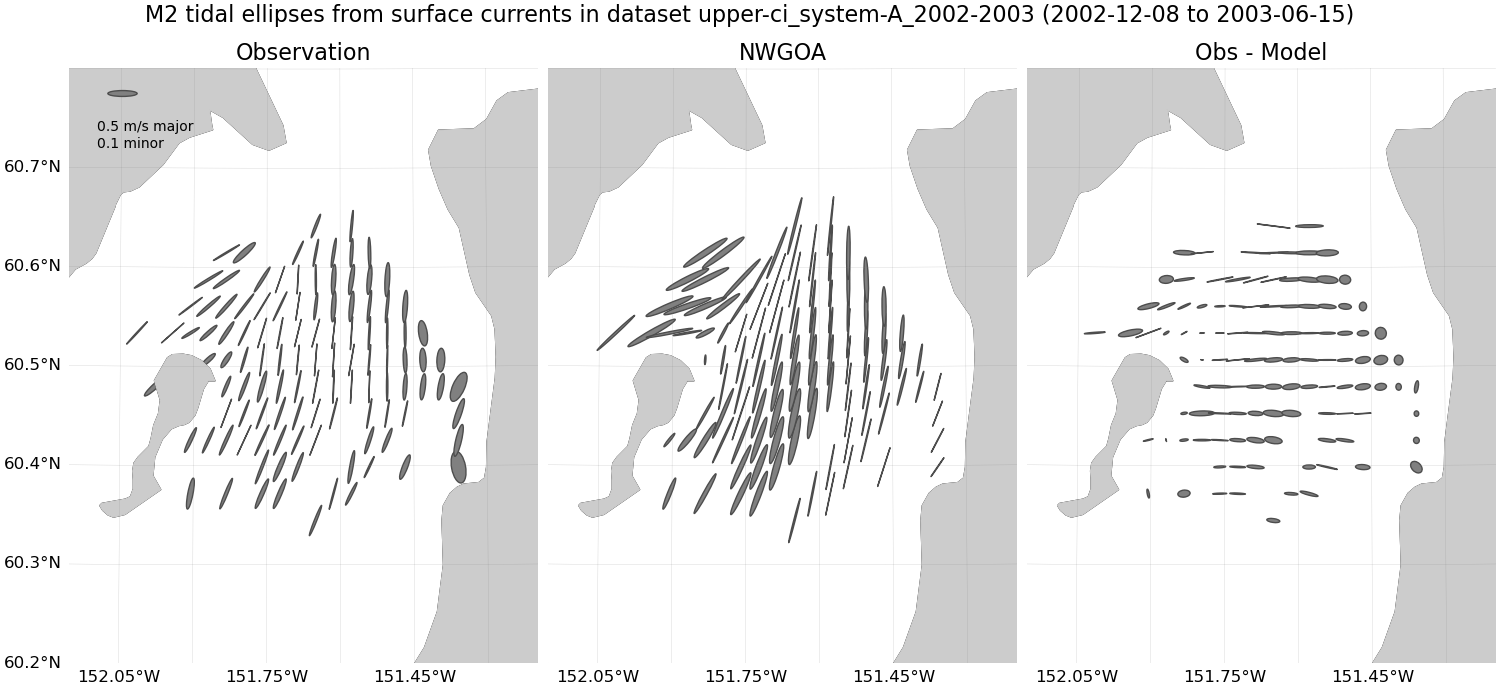
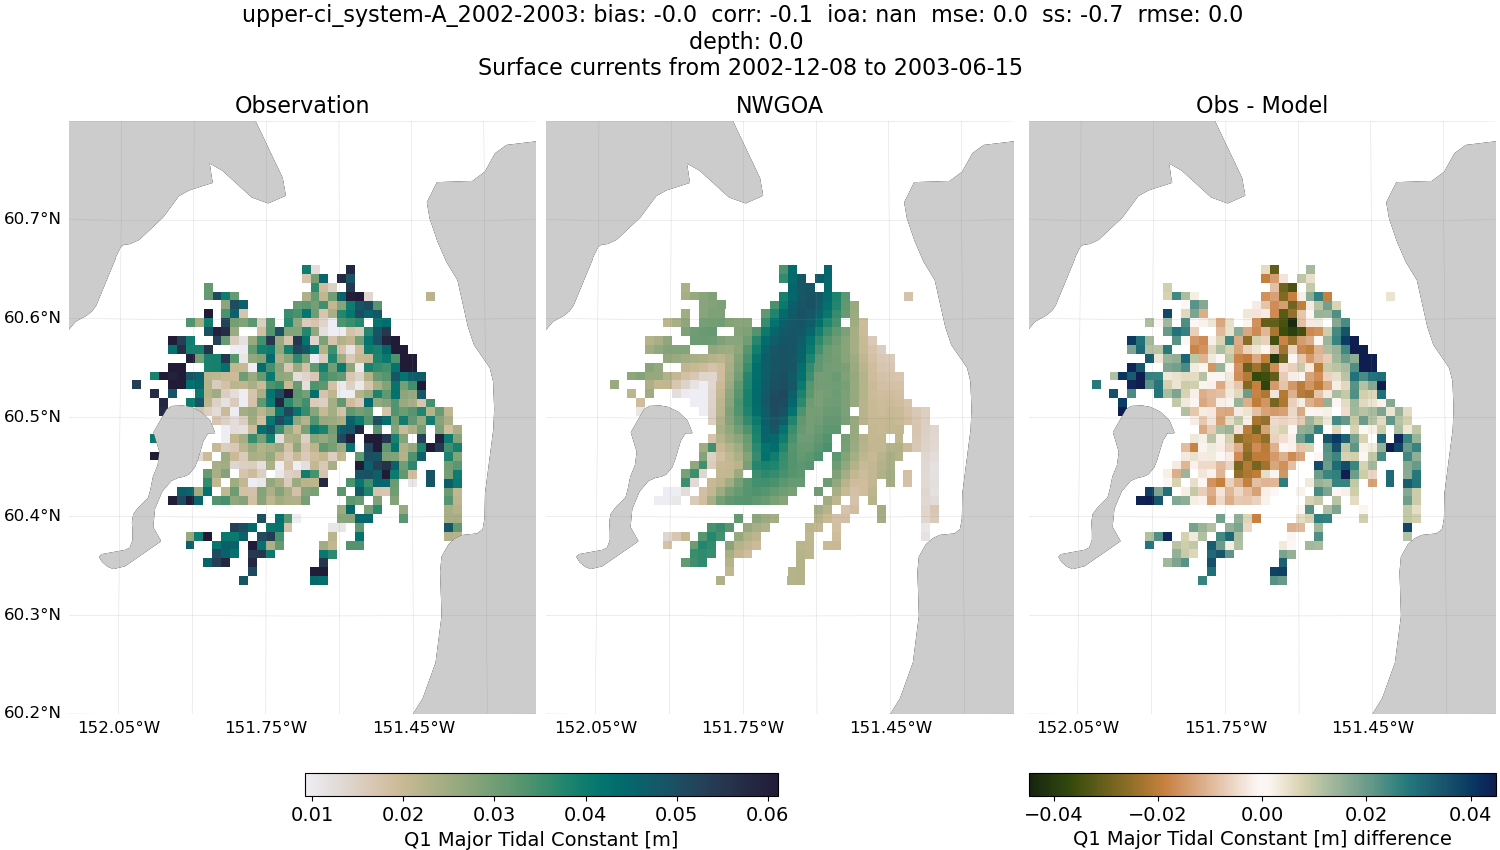
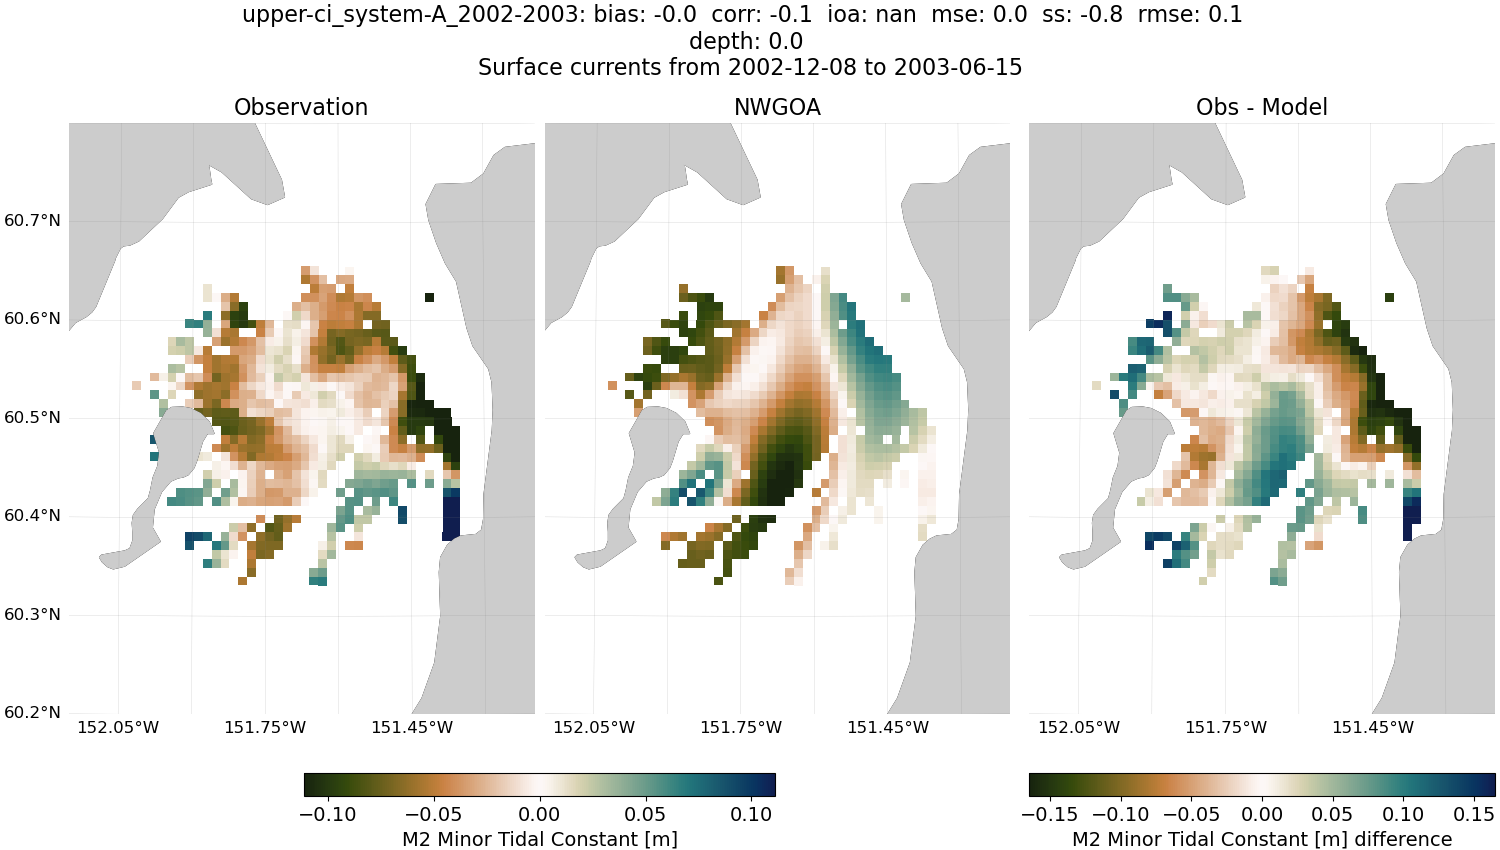
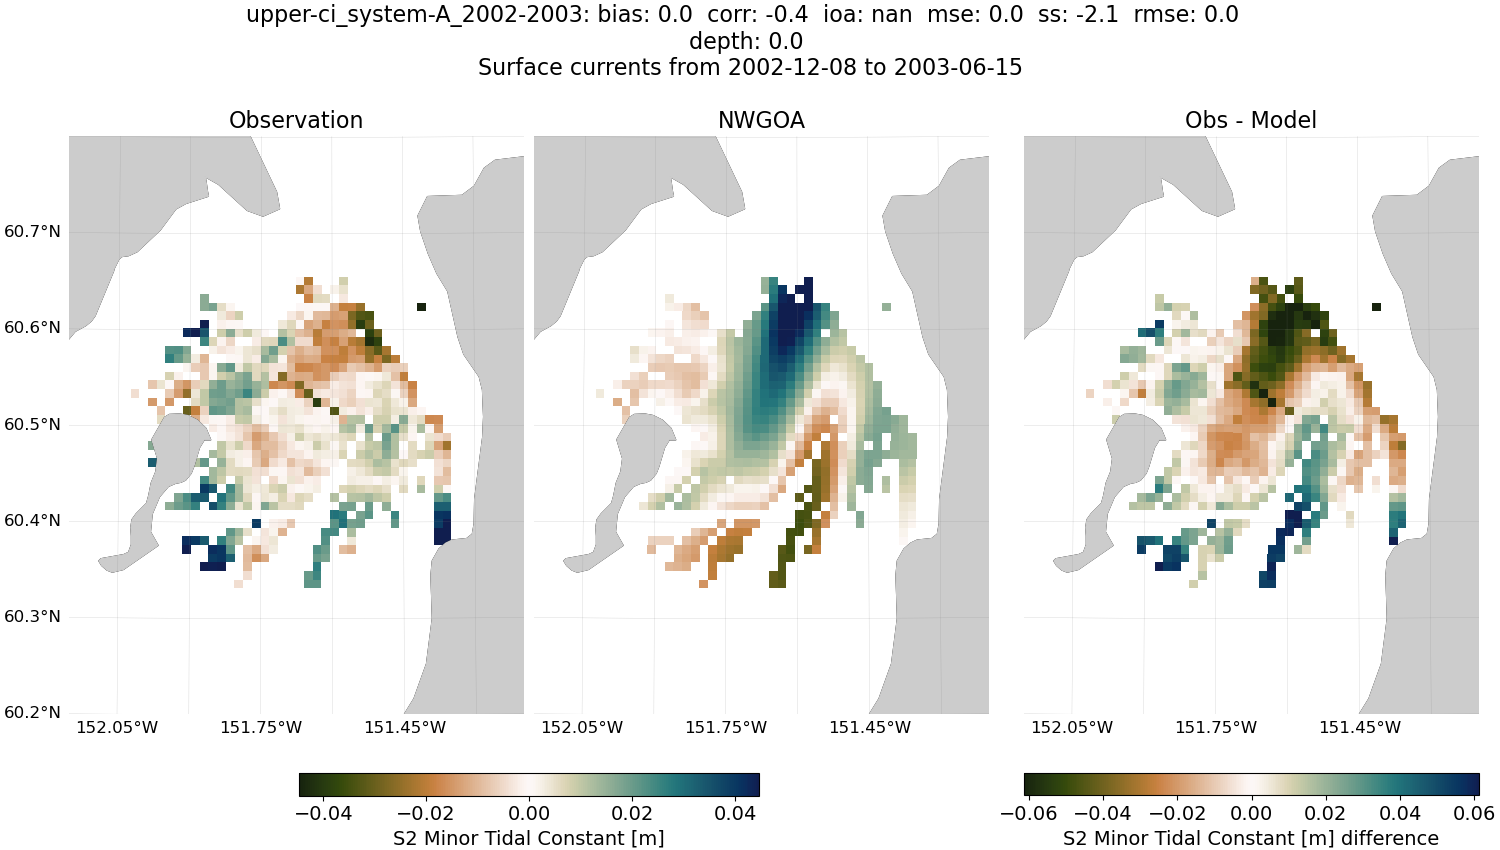
Fig. 68 M2 tidal ellipses from surface currents for NWGOA and dataset upper-ci_system-A_2002-2003#
K1 Tidal Ellipses#
CIOFS#
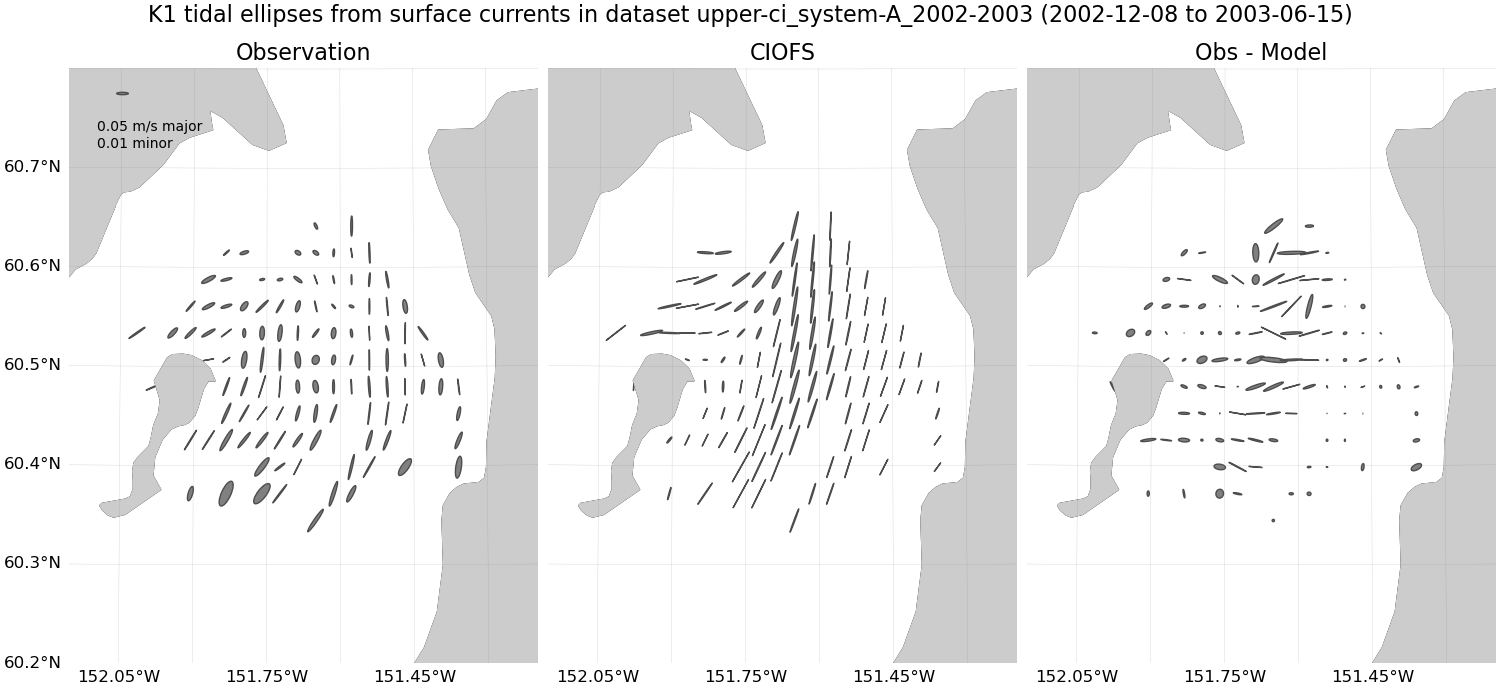
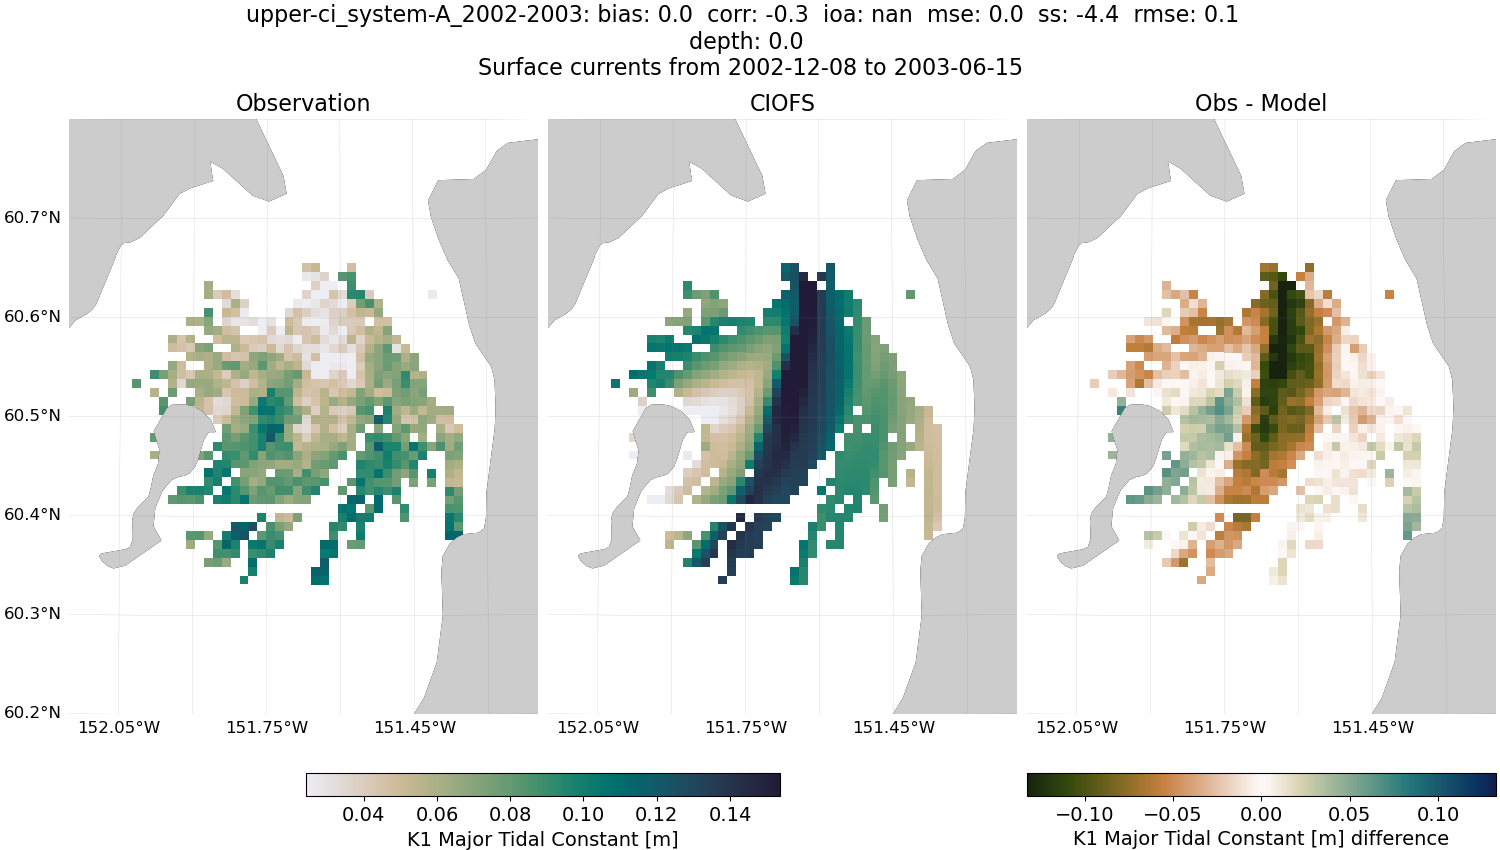
Fig. 69 K1 tidal ellipses from surface currents for CIOFS and dataset upper-ci_system-A_2002-2003#
NWGOA#
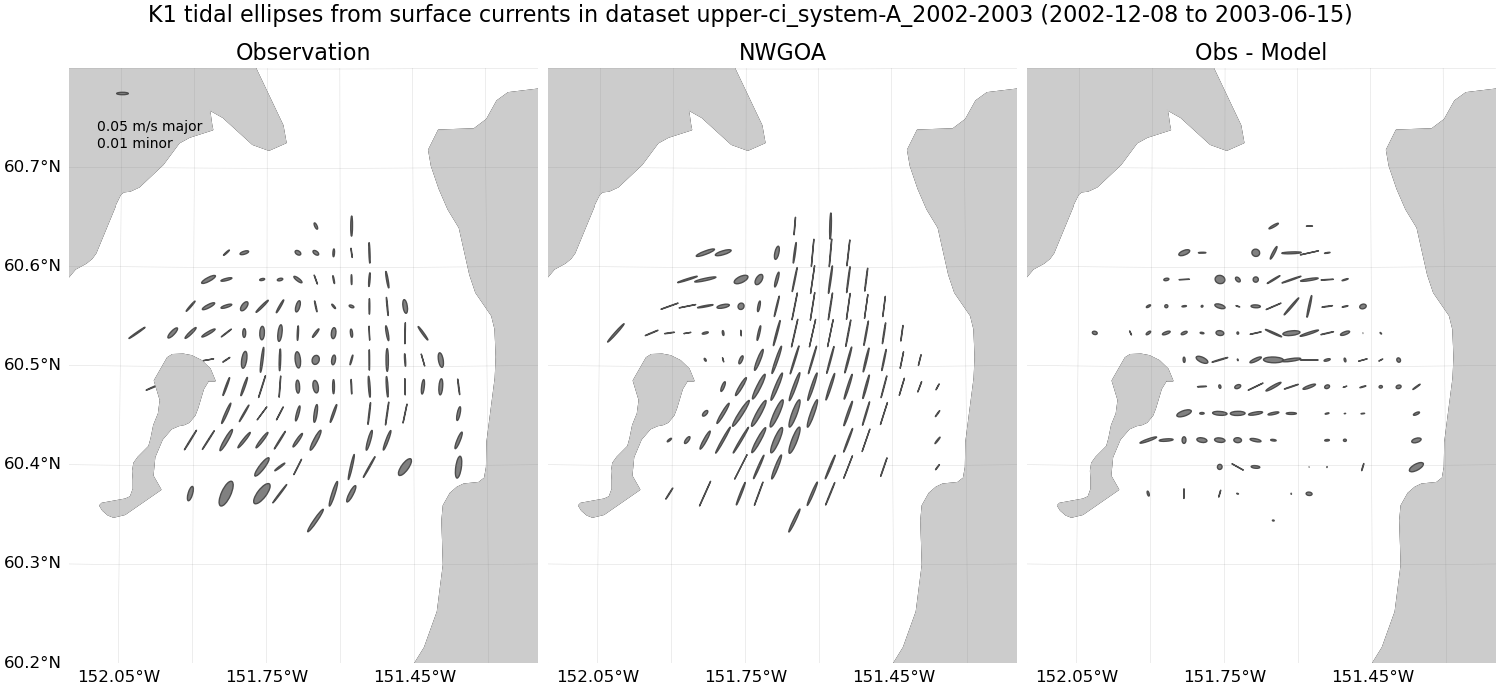
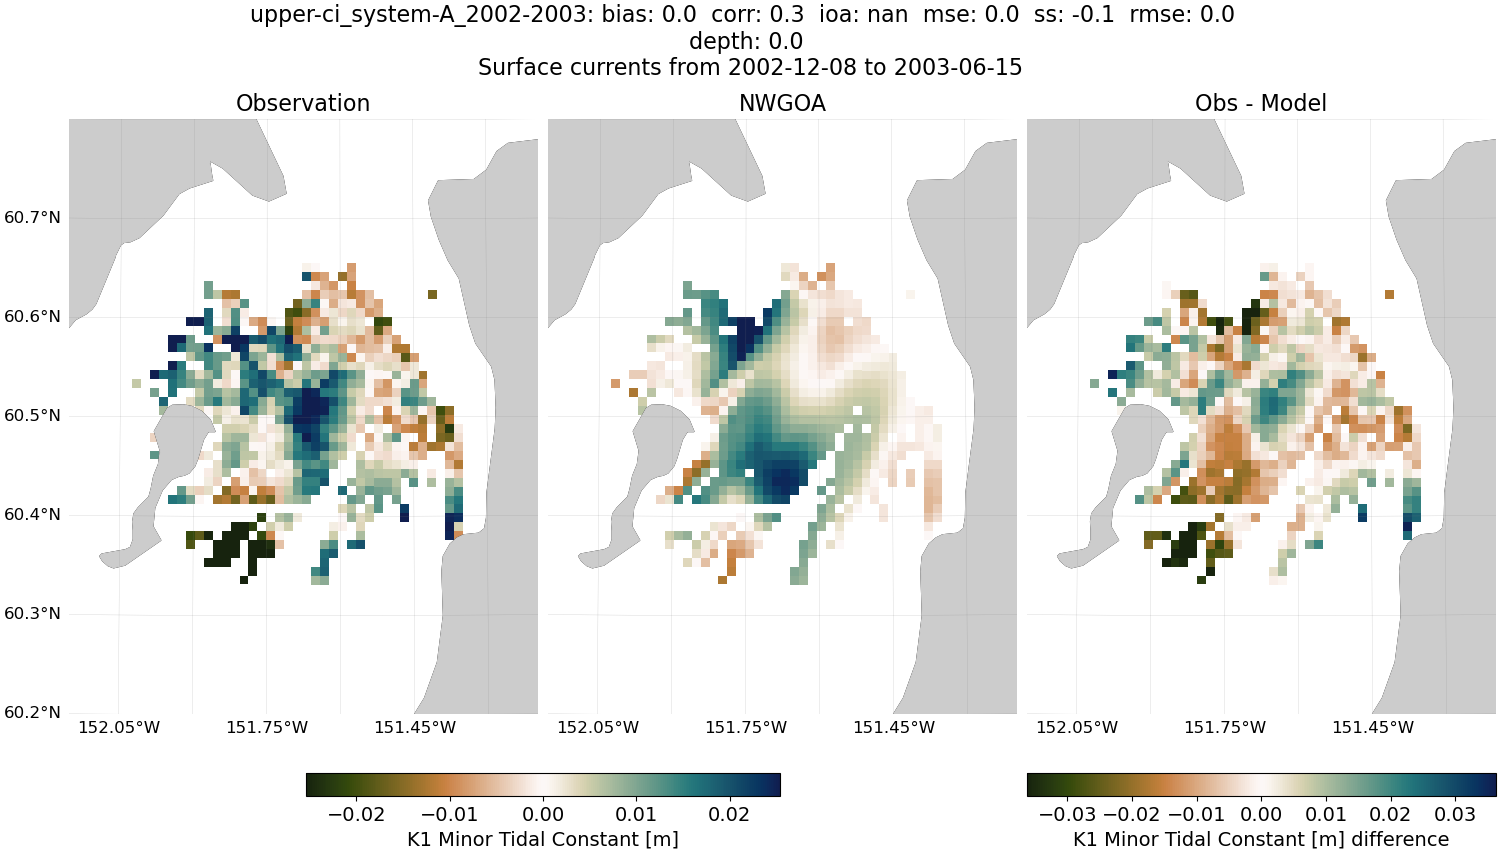
Fig. 70 K1 tidal ellipses from surface currents for NWGOA and dataset upper-ci_system-A_2002-2003#
Subtidal Mean#
CIOFS#
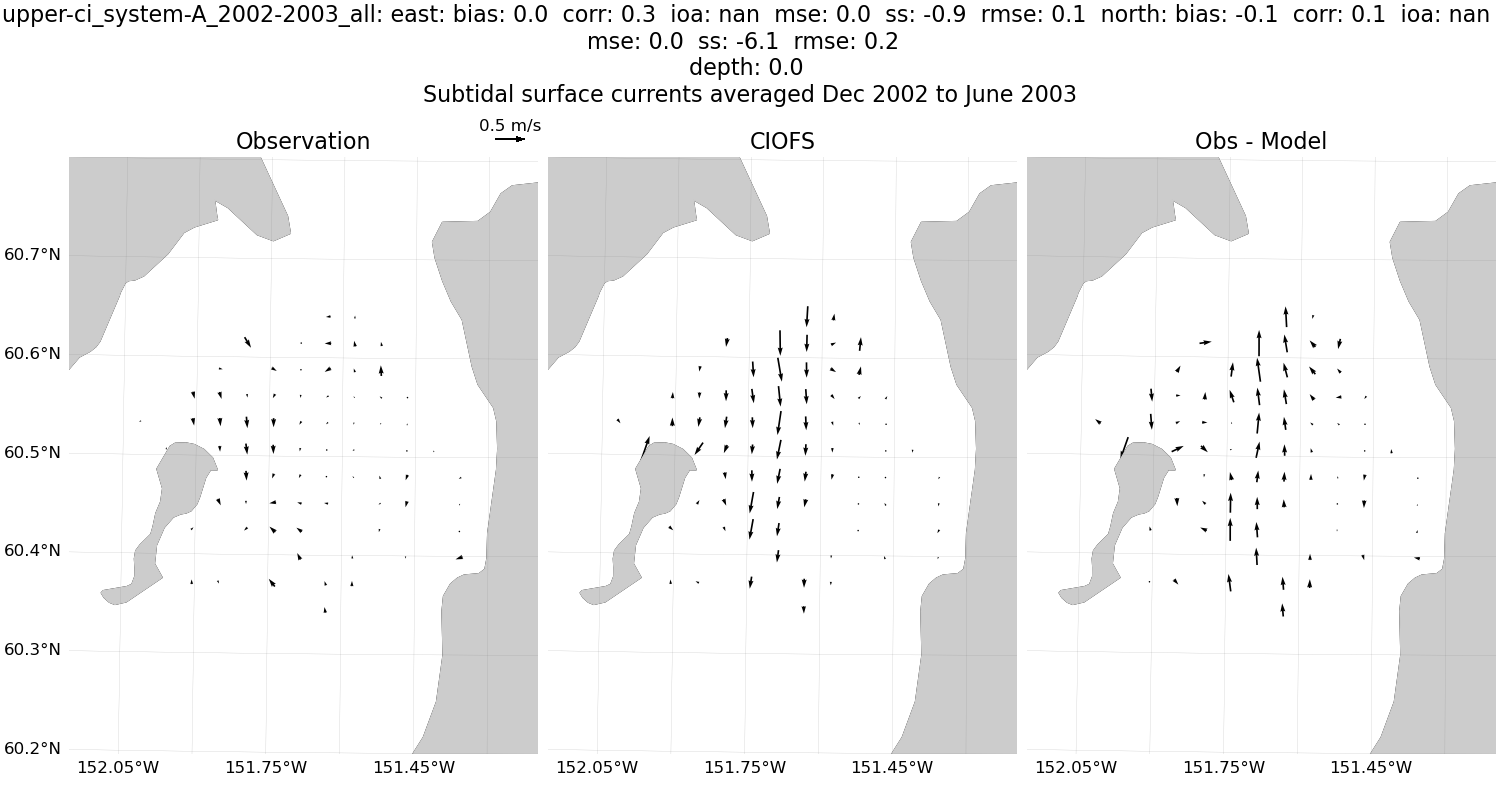
Fig. 71 Subtidal mean from surface currents for CIOFS and dataset upper-ci_system-A_2002-2003#
NWGOA#
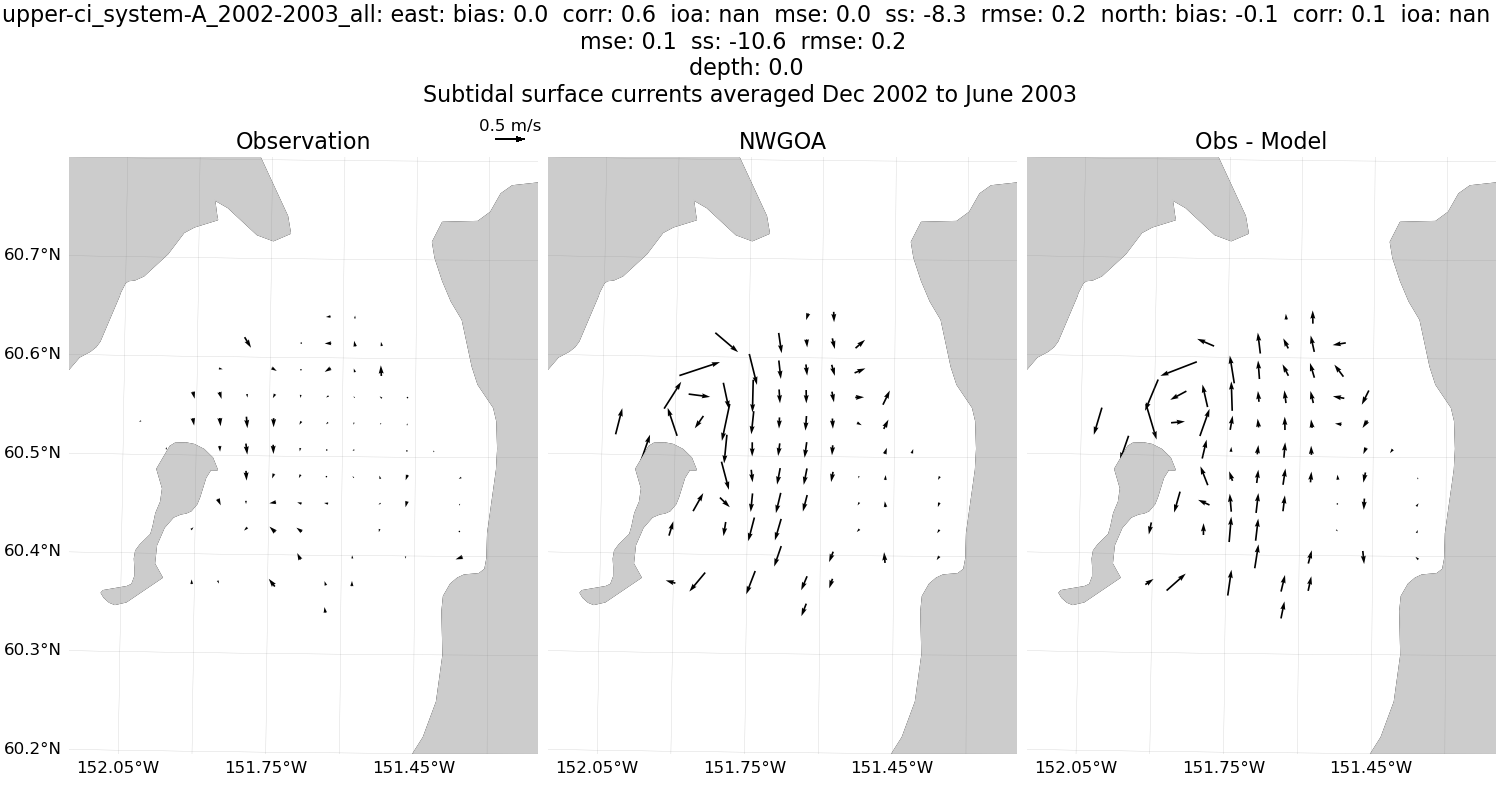
Fig. 72 Subtidal mean from surface currents for NWGOA and dataset upper-ci_system-A_2002-2003#
Hourly#
CIOFS#
Fig. 73 Hourly from surface currents for CIOFS and dataset upper-ci_system-A_2002-2003#
NWGOA#
Fig. 74 Hourly from surface currents for NWGOA and dataset upper-ci_system-A_2002-2003#
Subtidal, 6-Hourly#
CIOFS#
Fig. 75 Subtidal, 6-hourly from surface currents for CIOFS and dataset upper-ci_system-A_2002-2003#
NWGOA#
Fig. 76 Subtidal, 6-hourly from surface currents for NWGOA and dataset upper-ci_system-A_2002-2003#
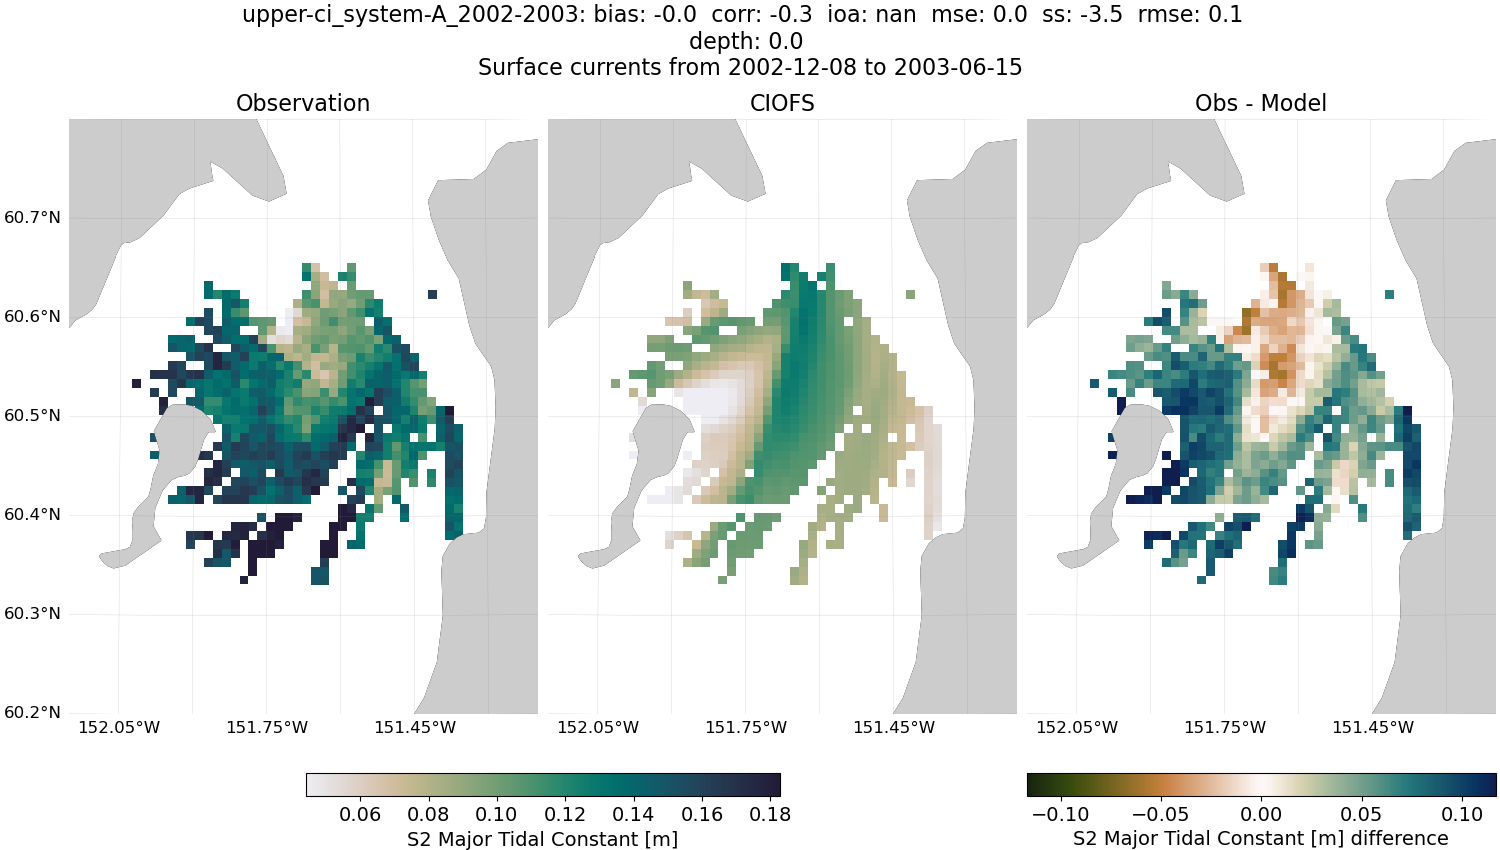
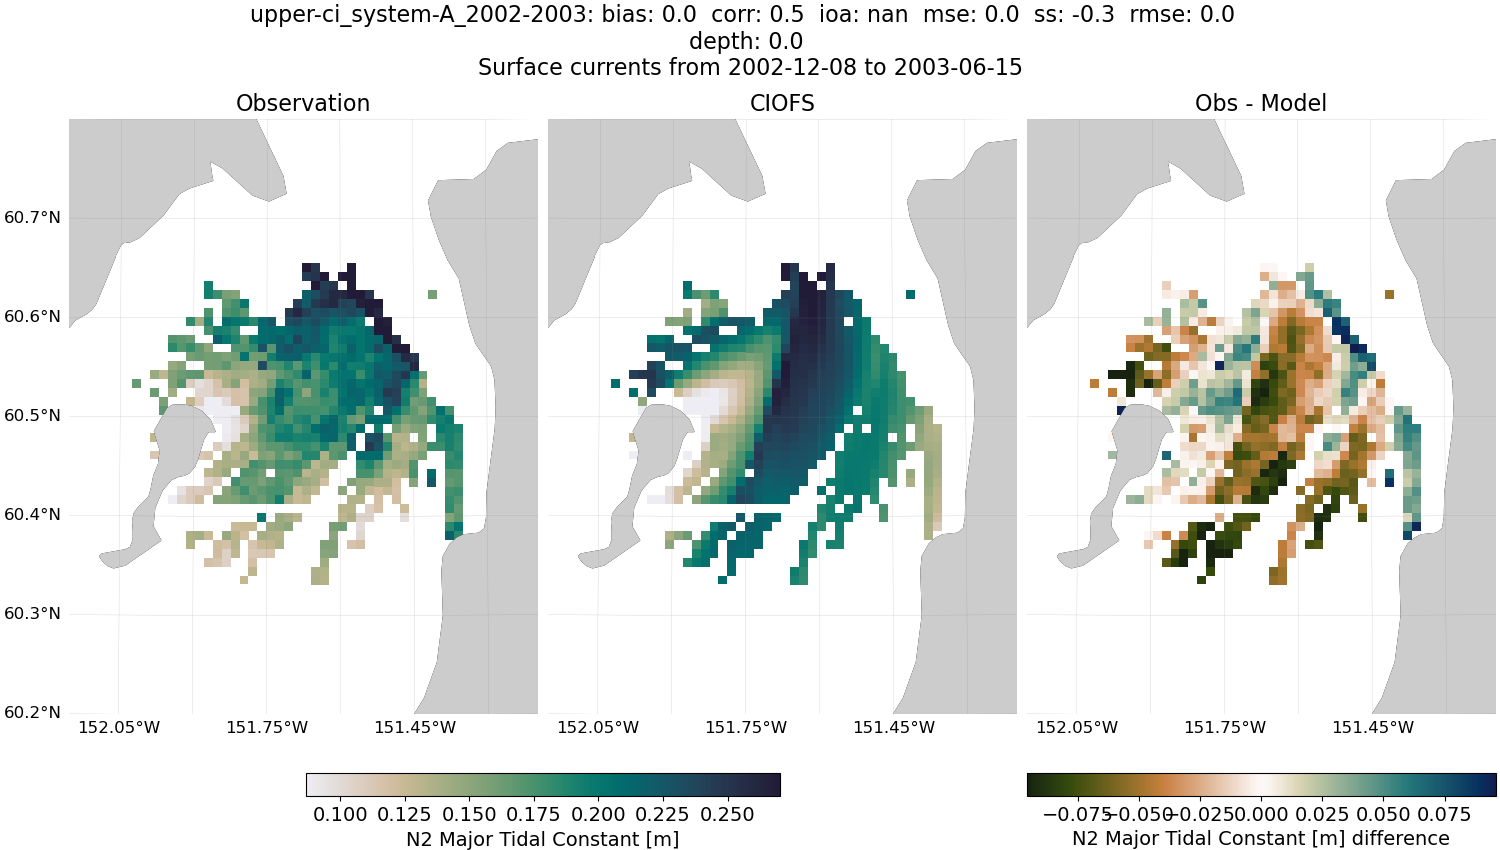
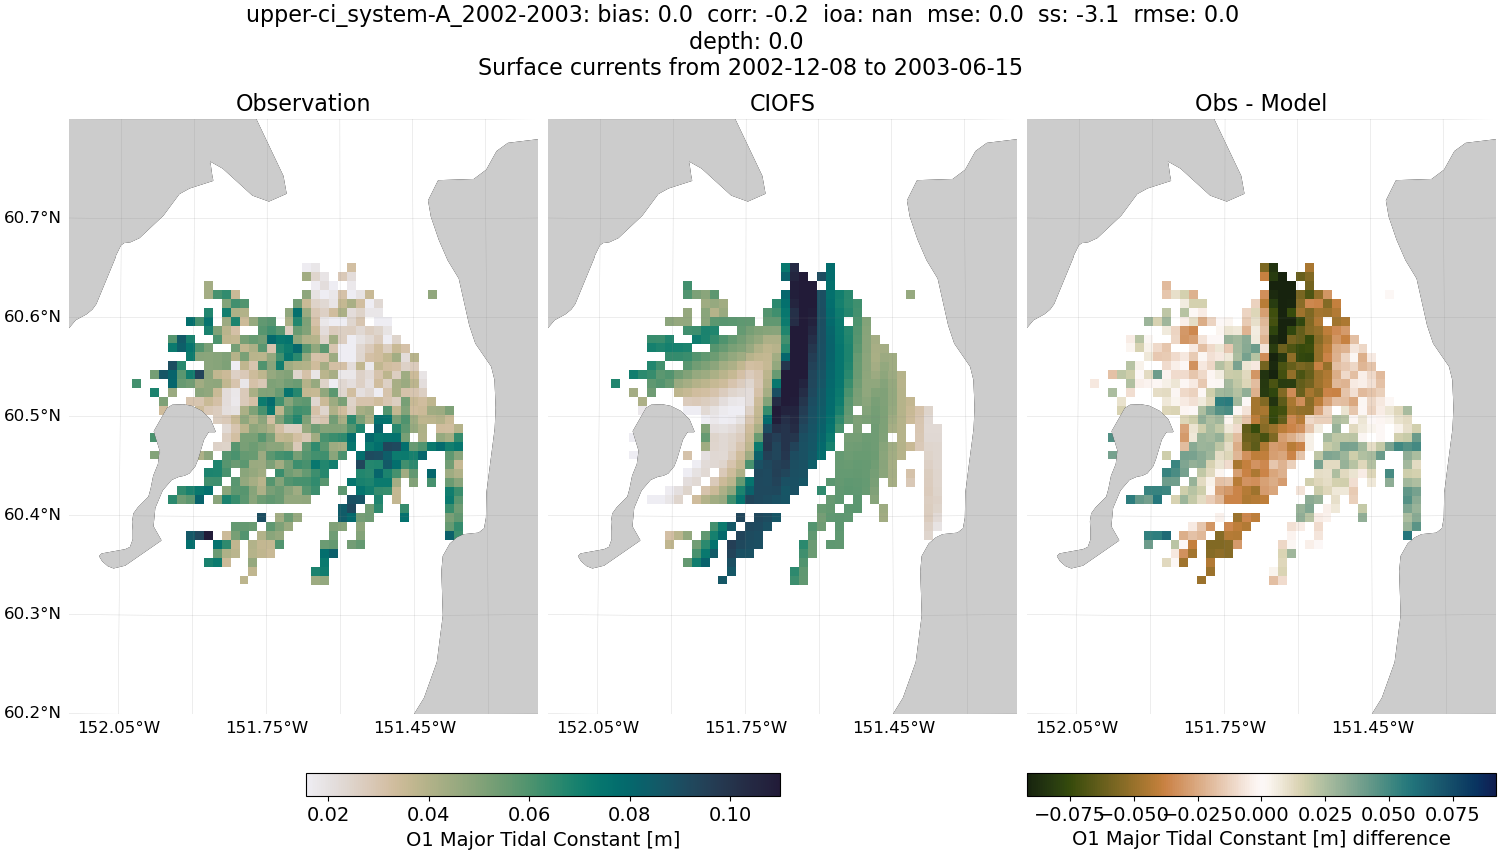
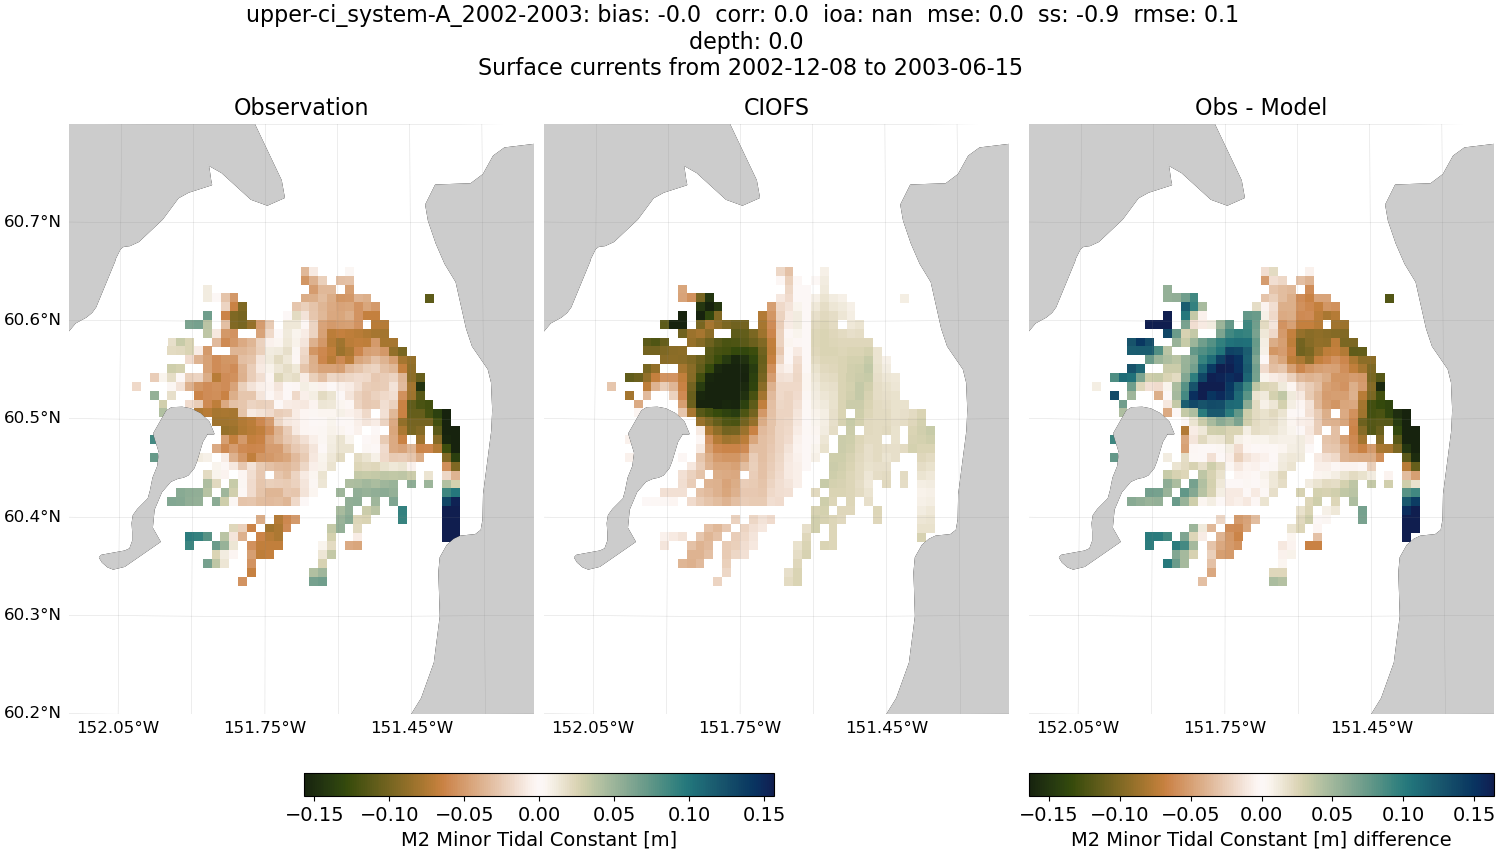
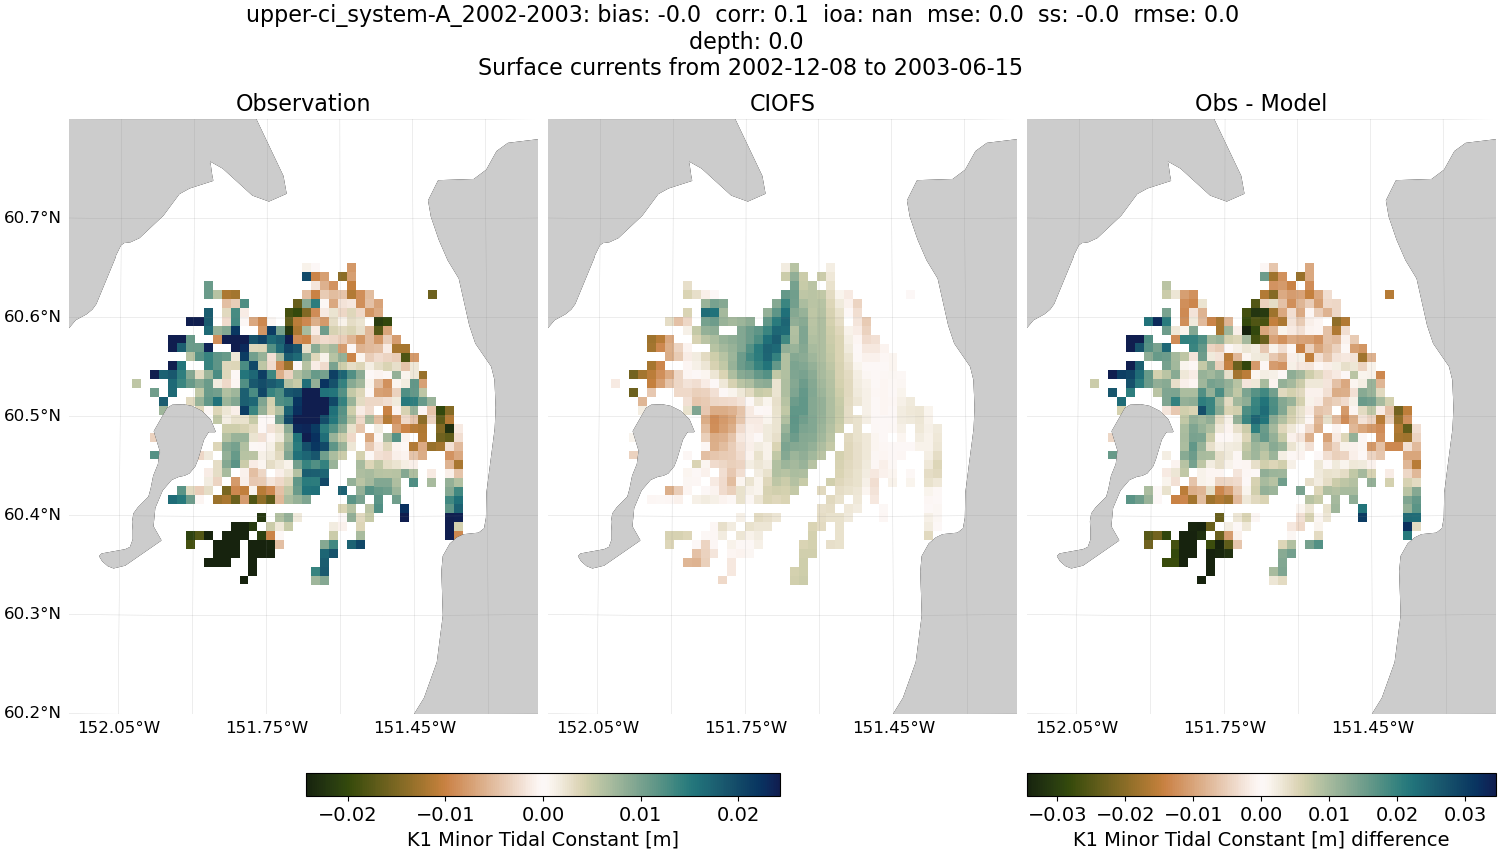
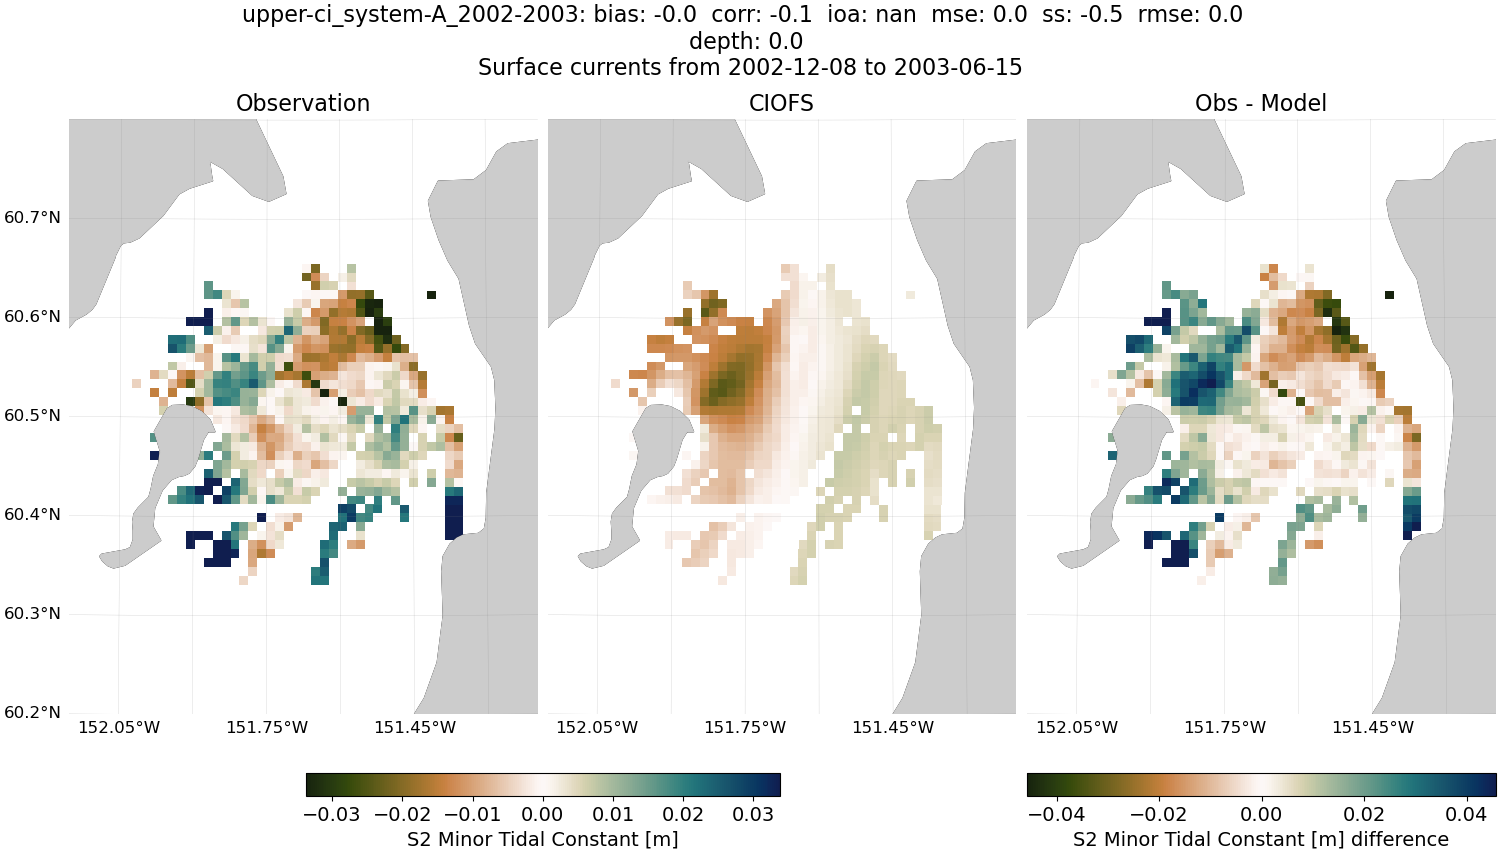
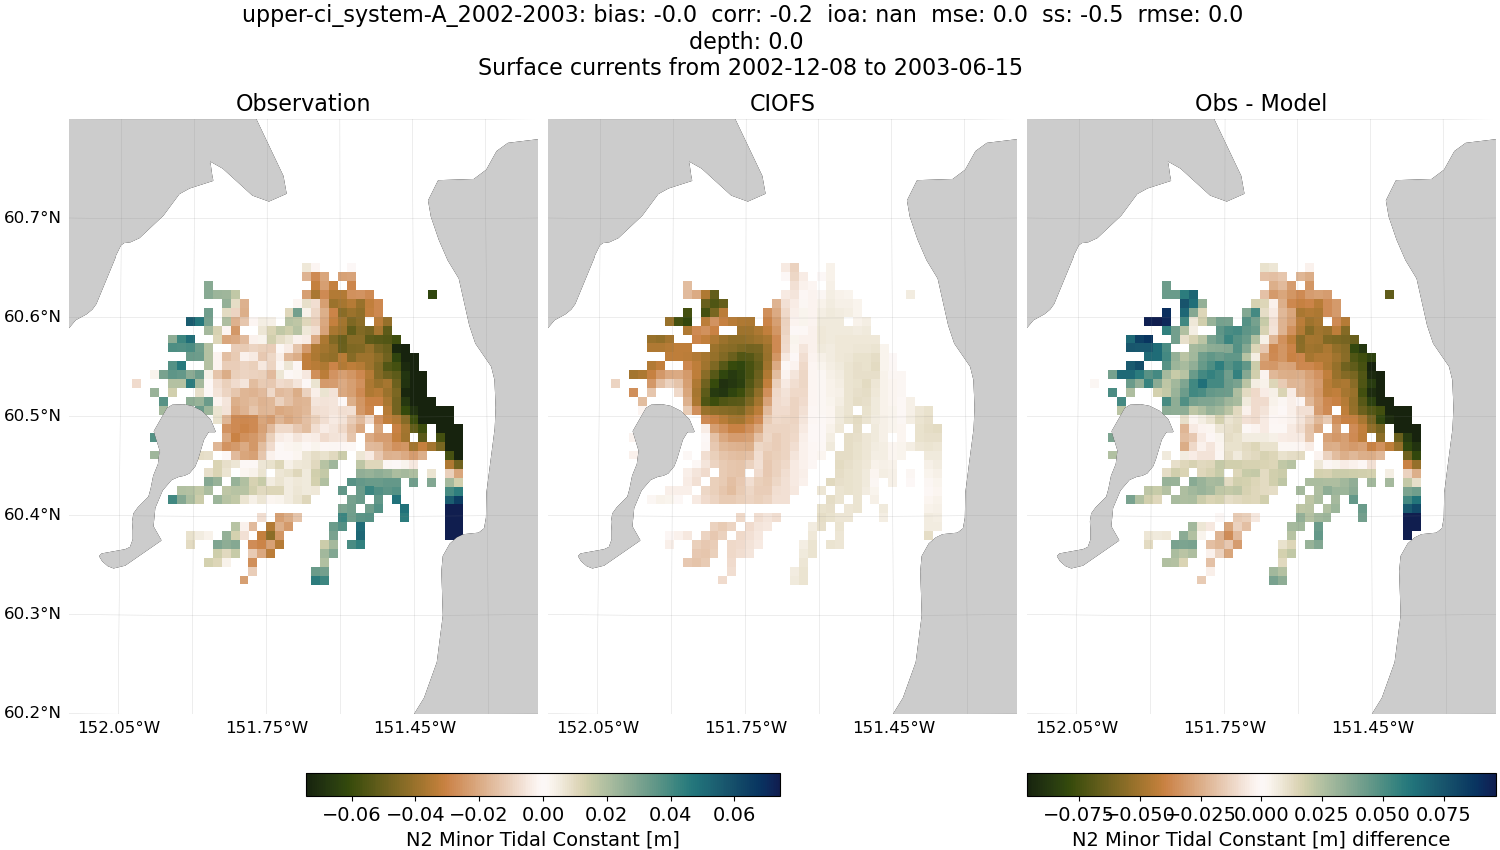
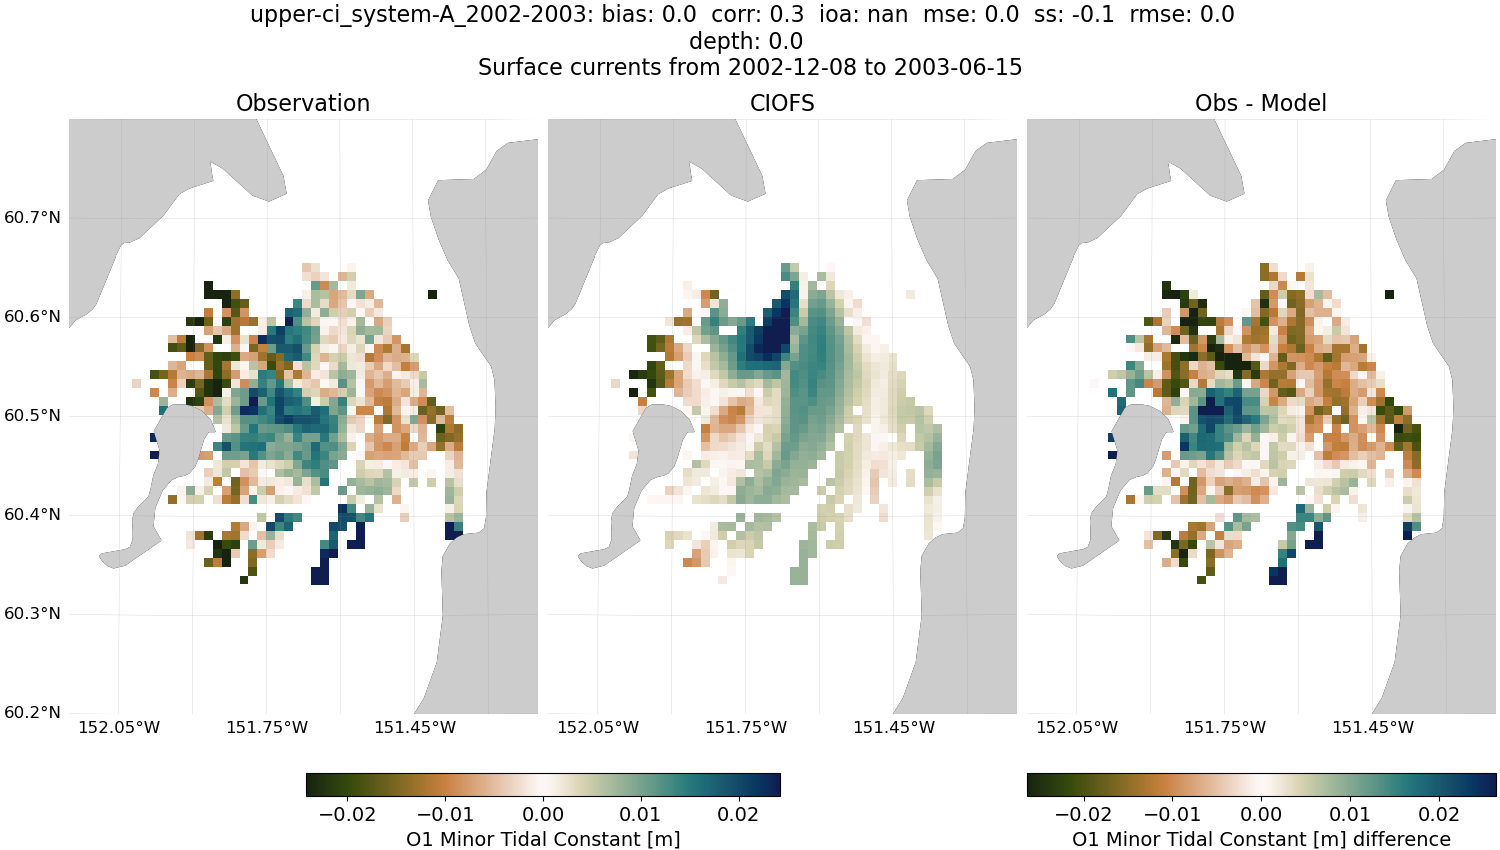
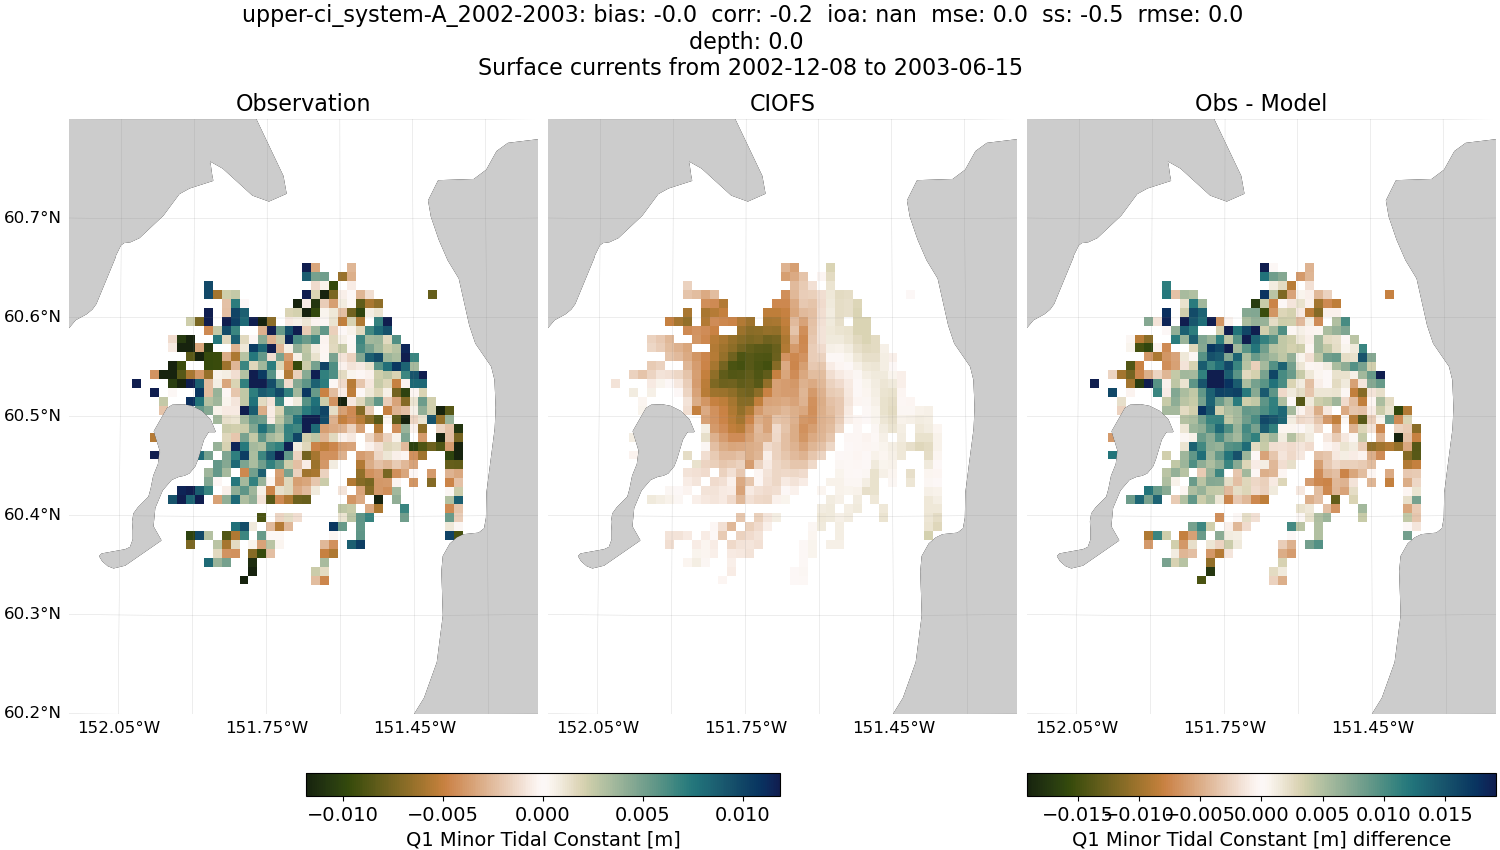
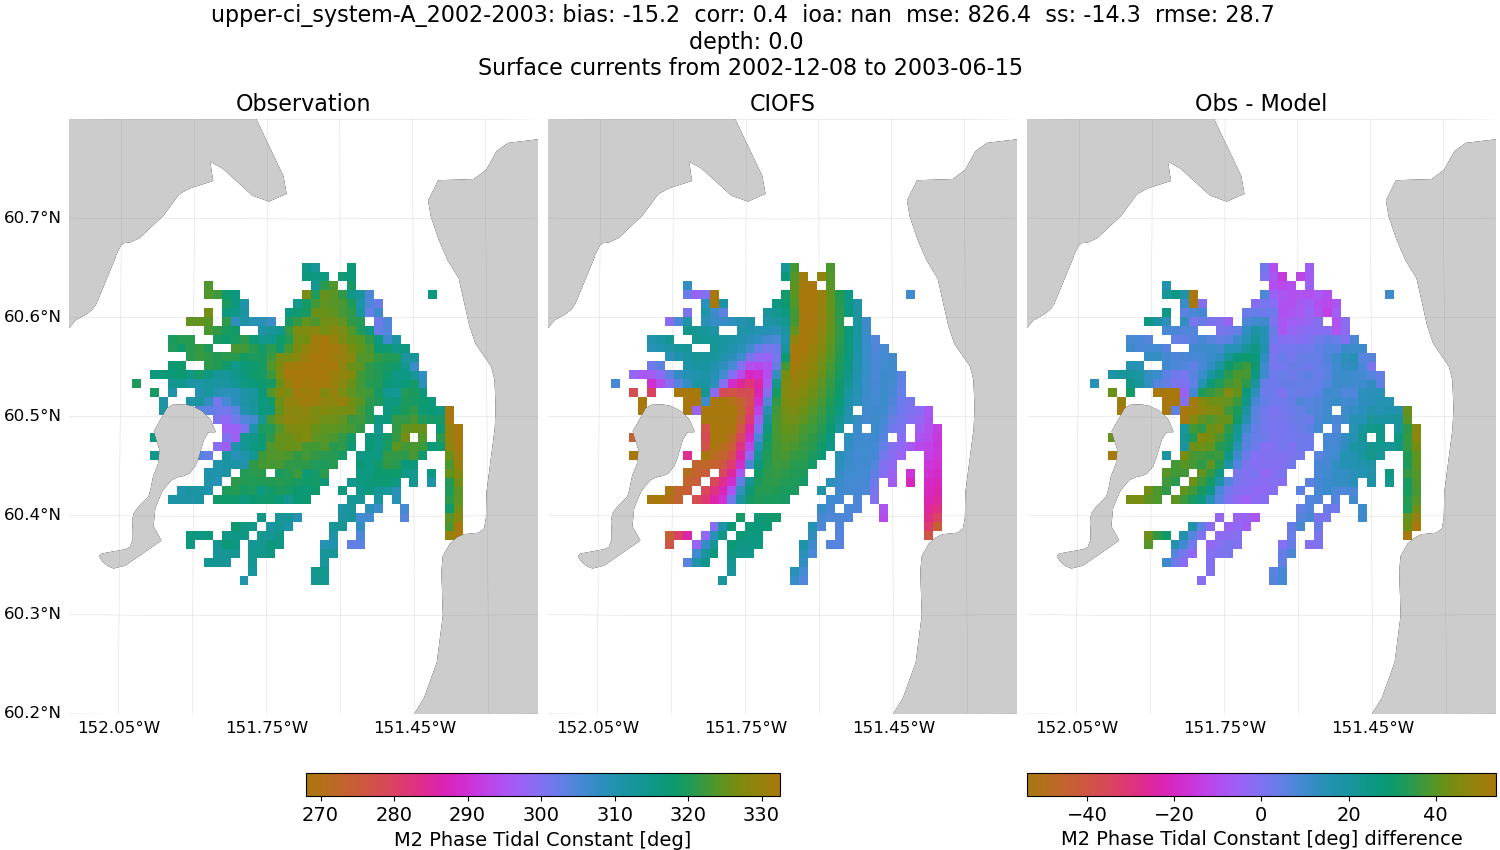
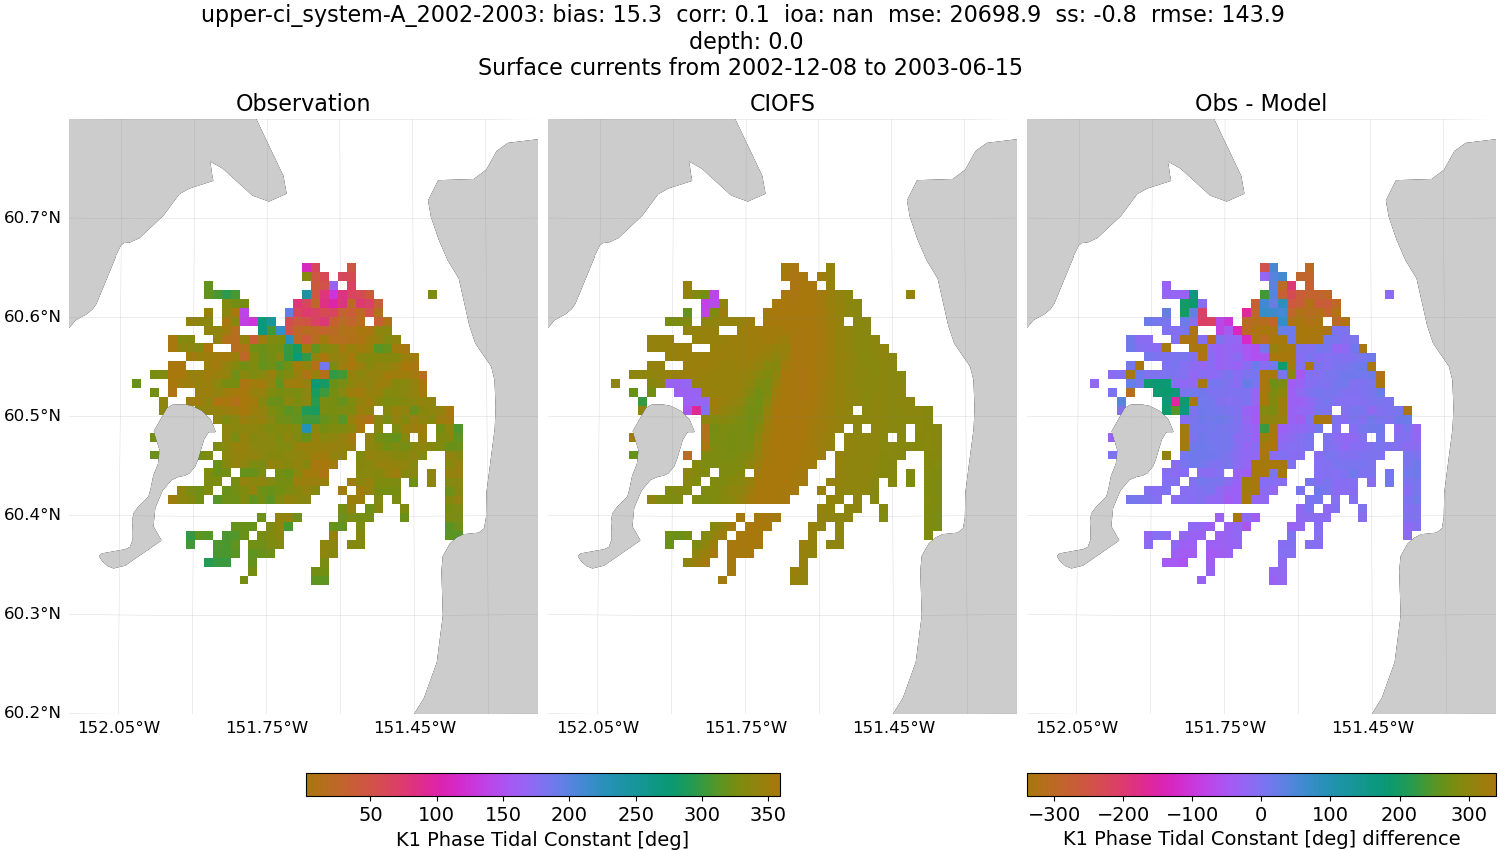
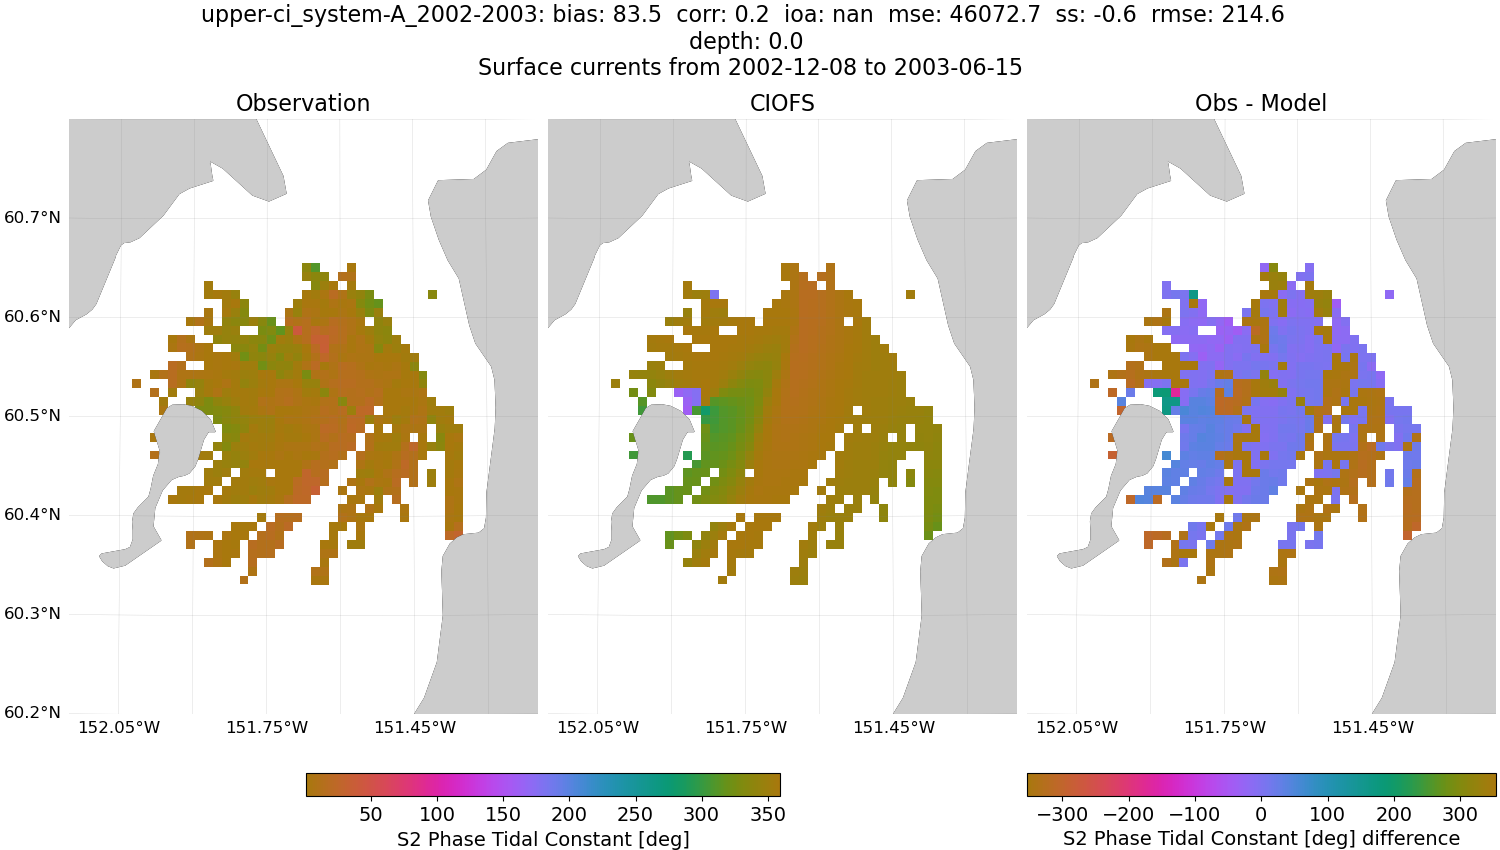
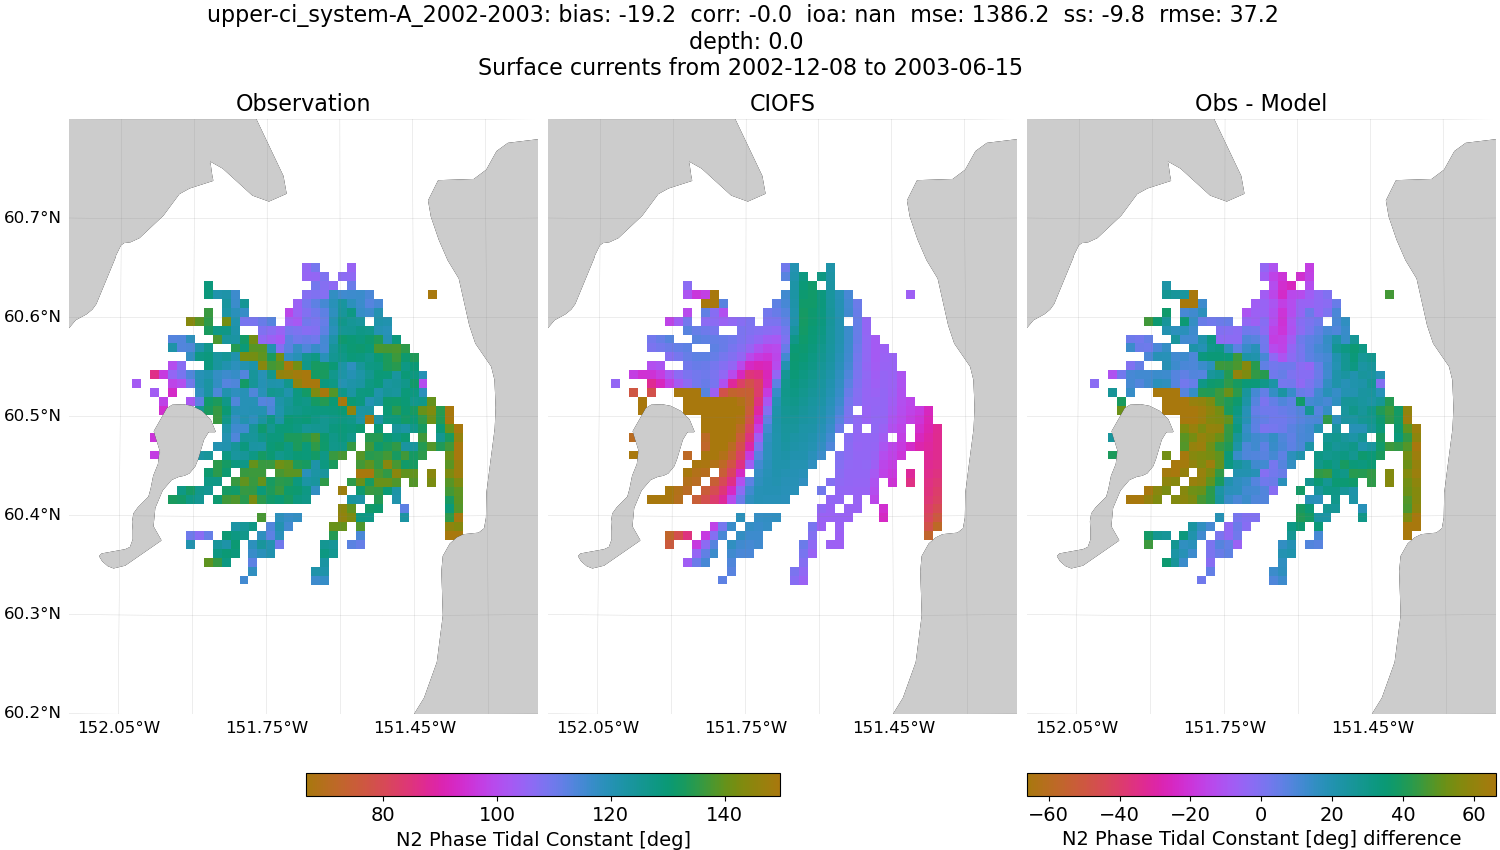
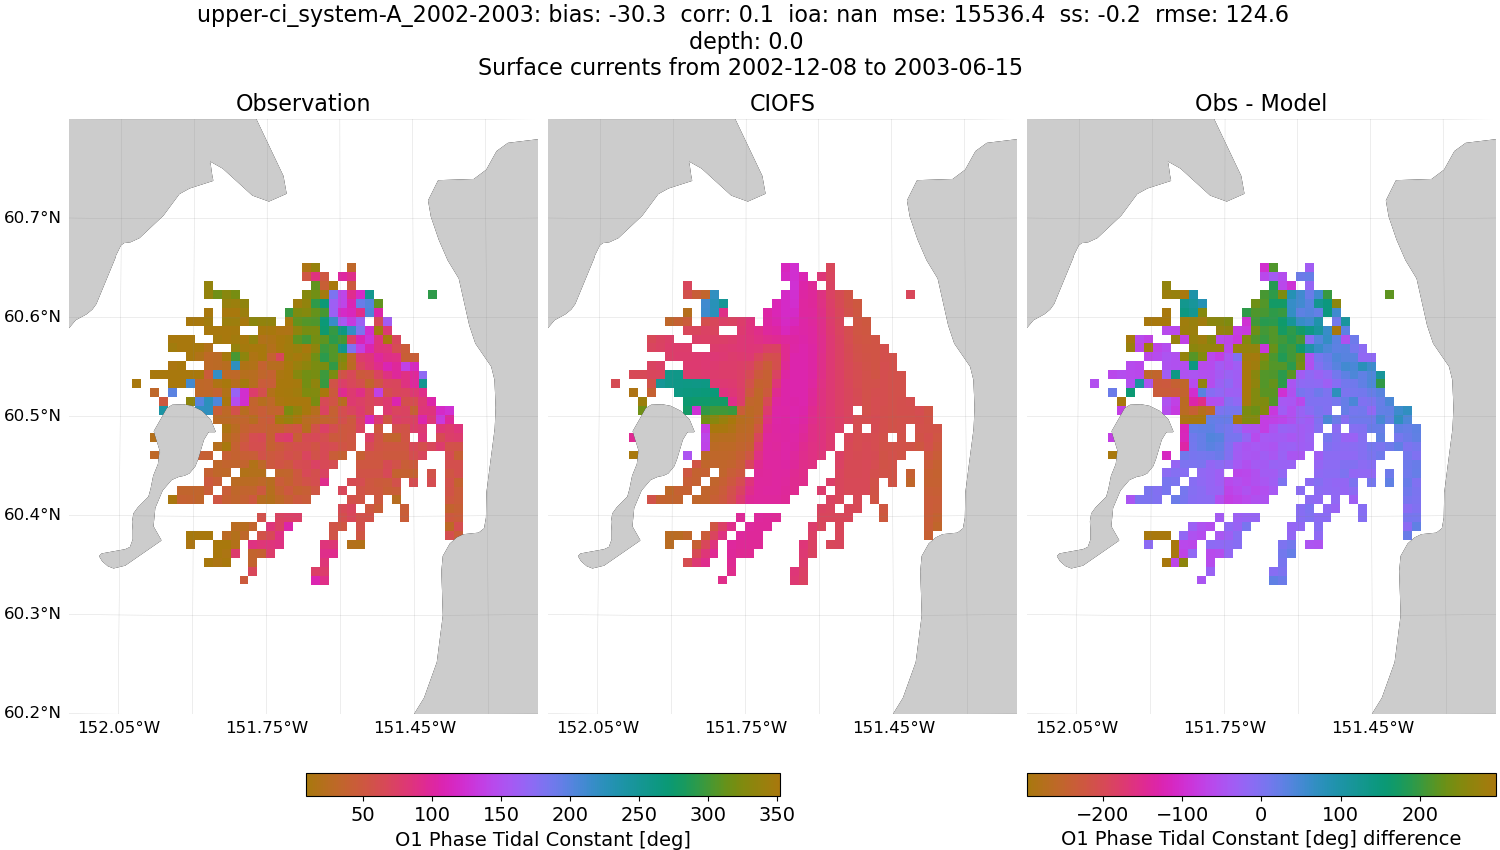
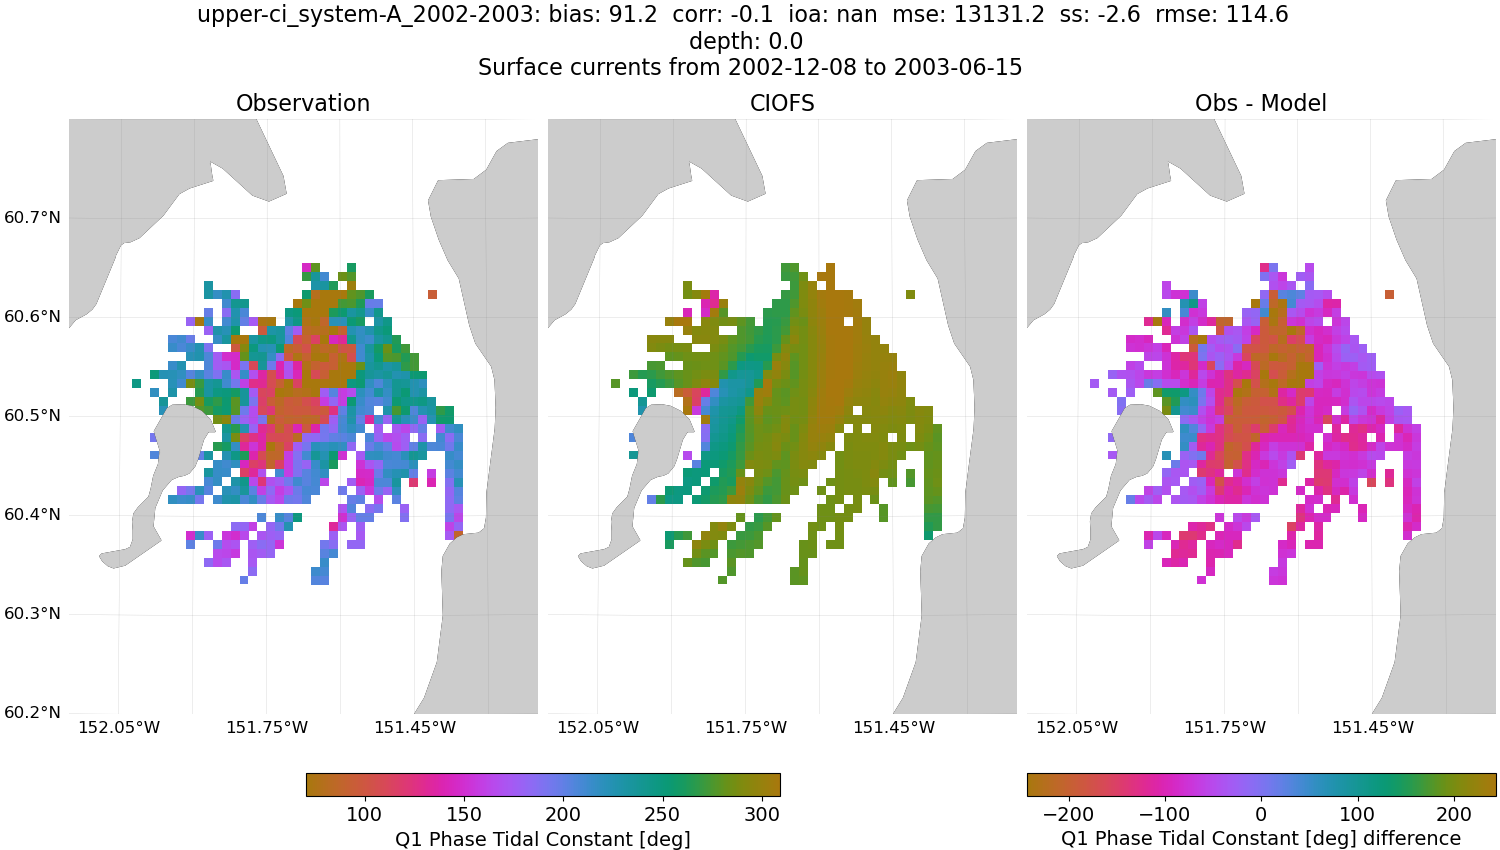
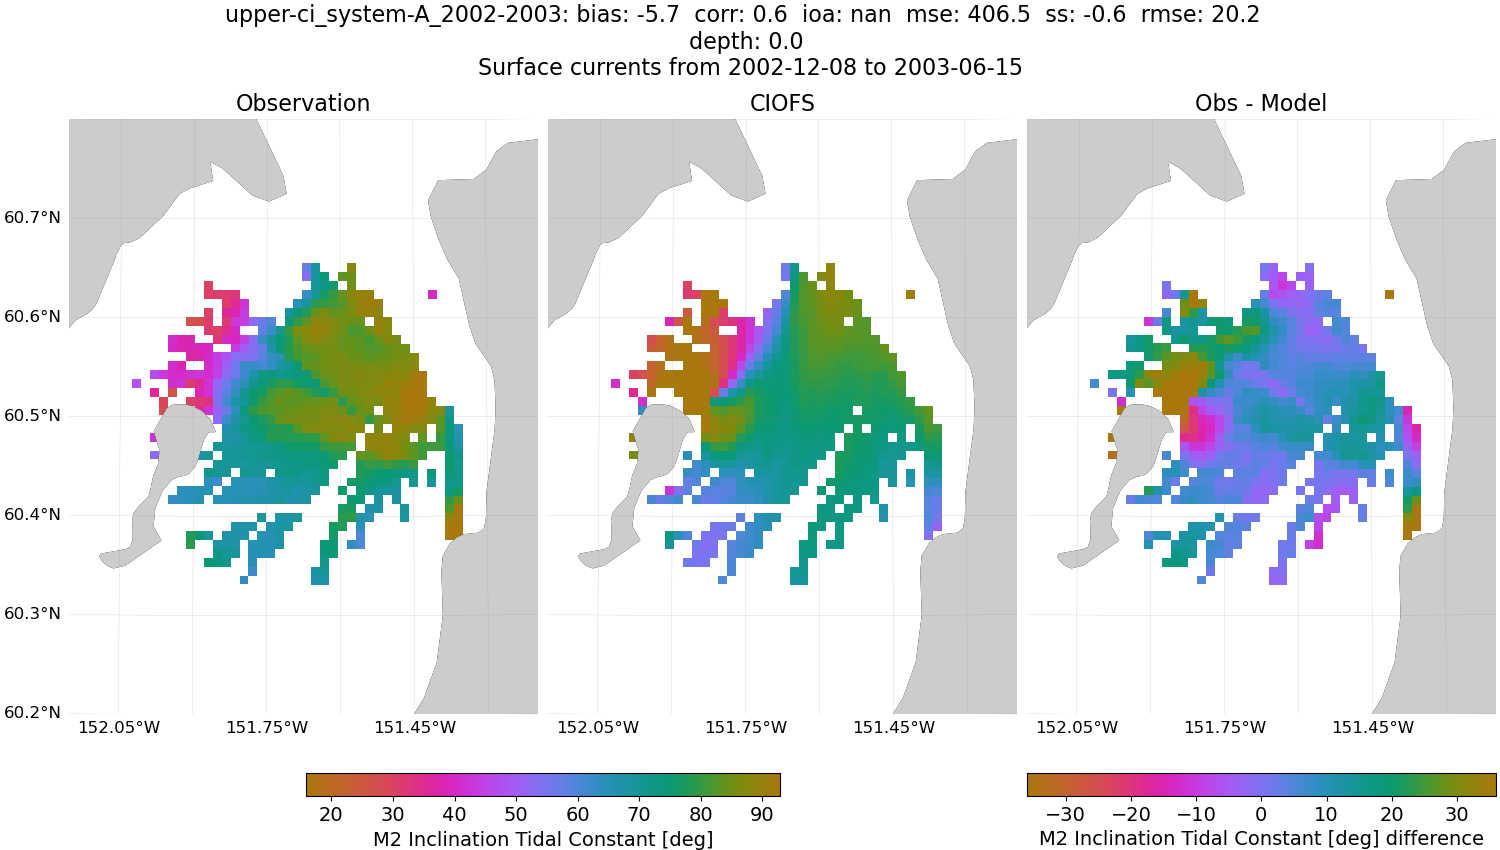
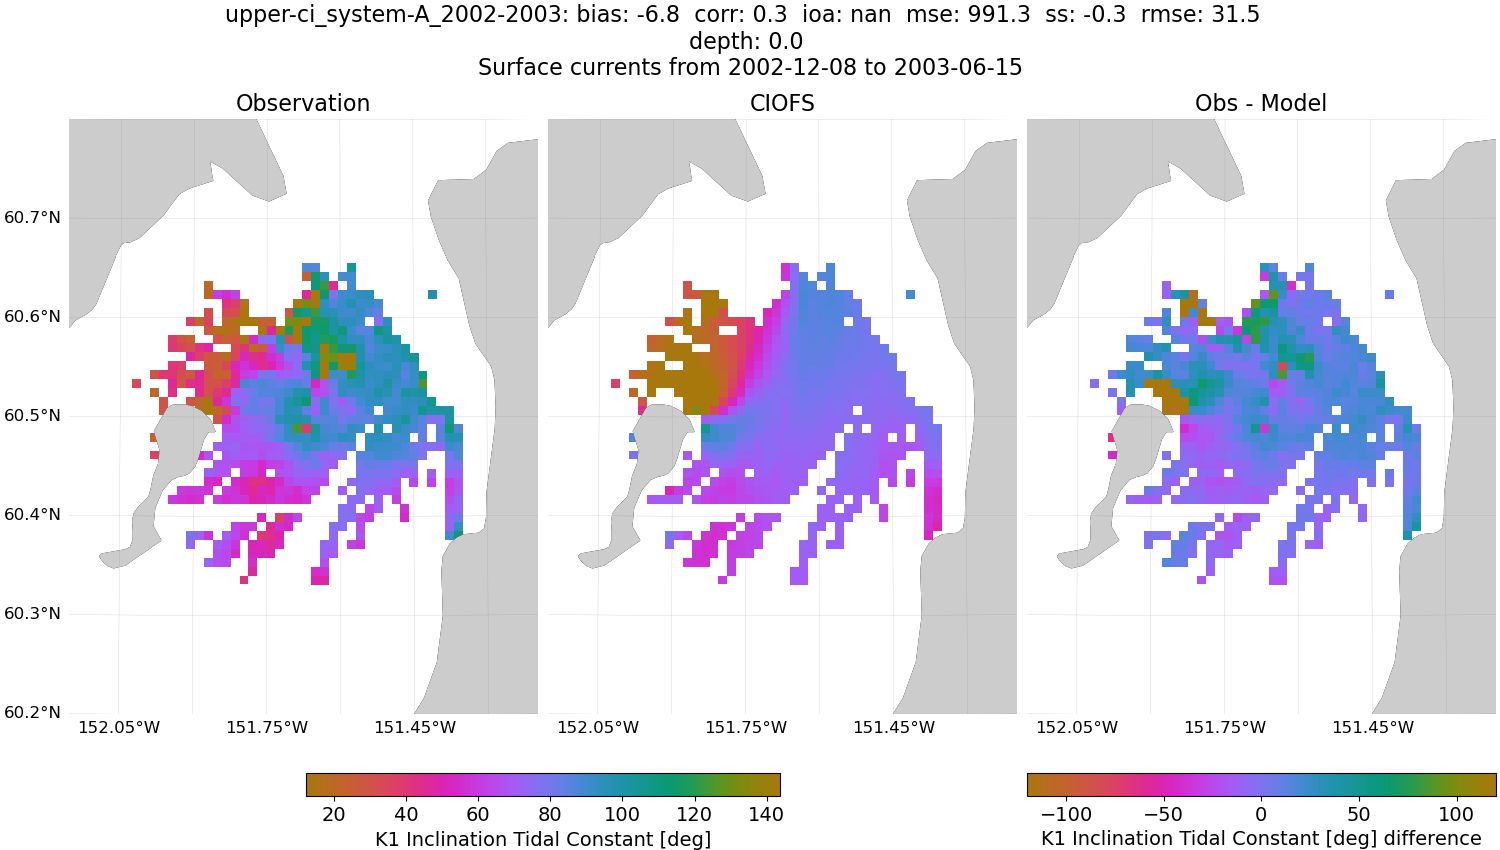
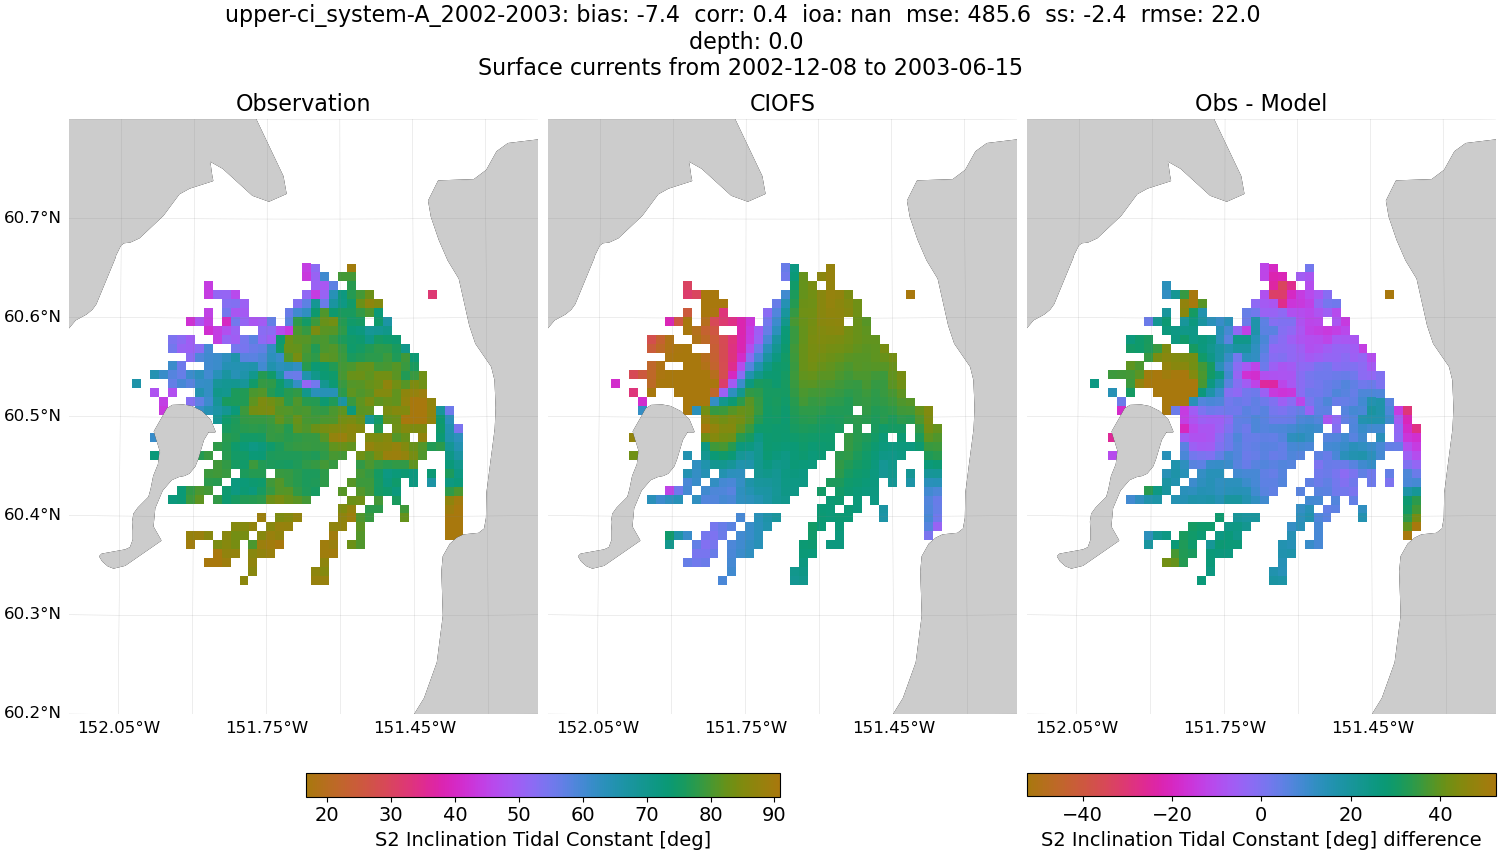
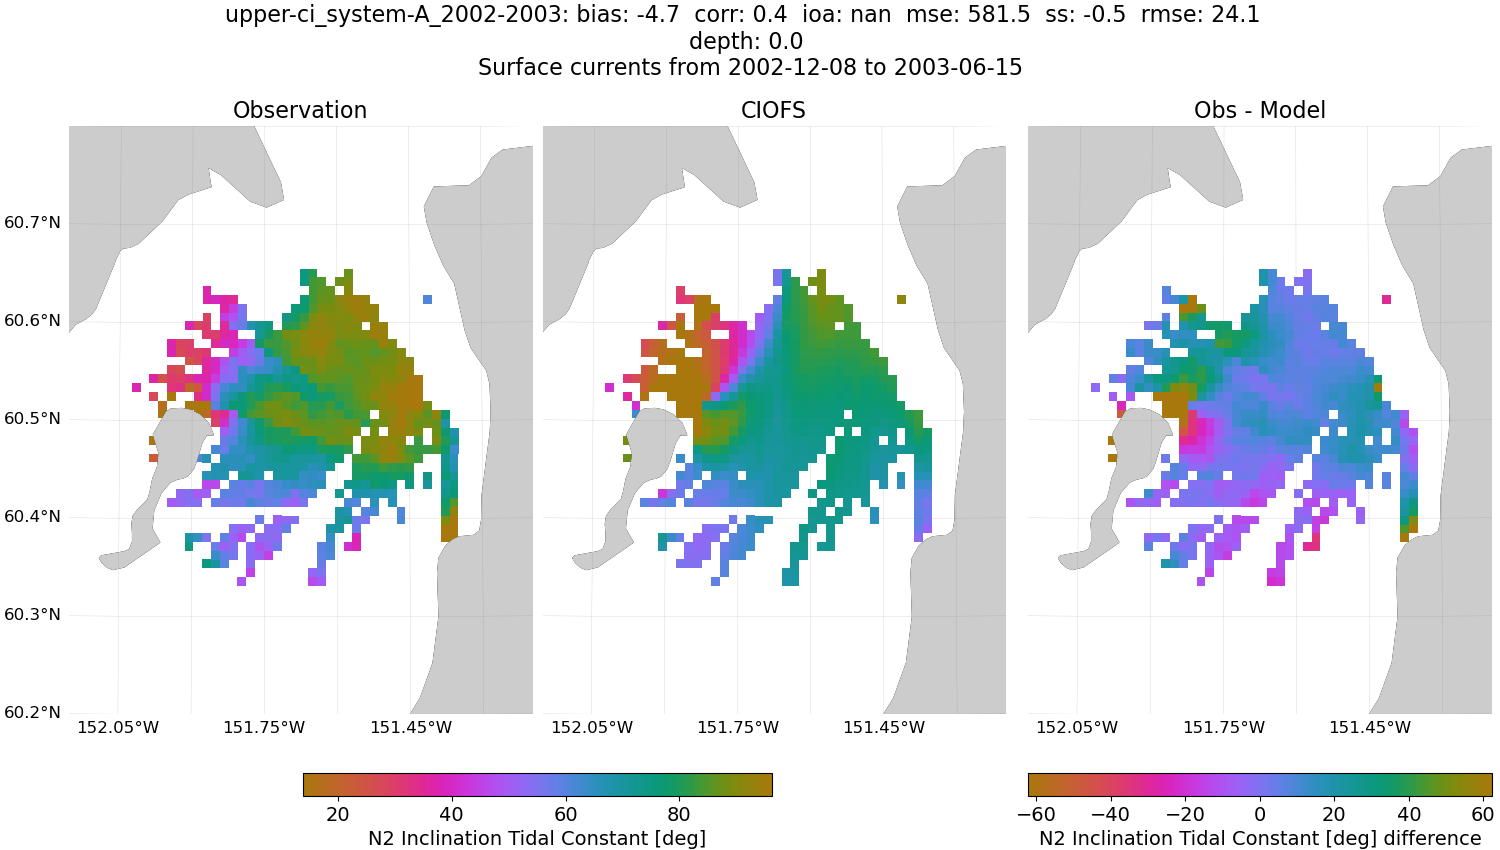
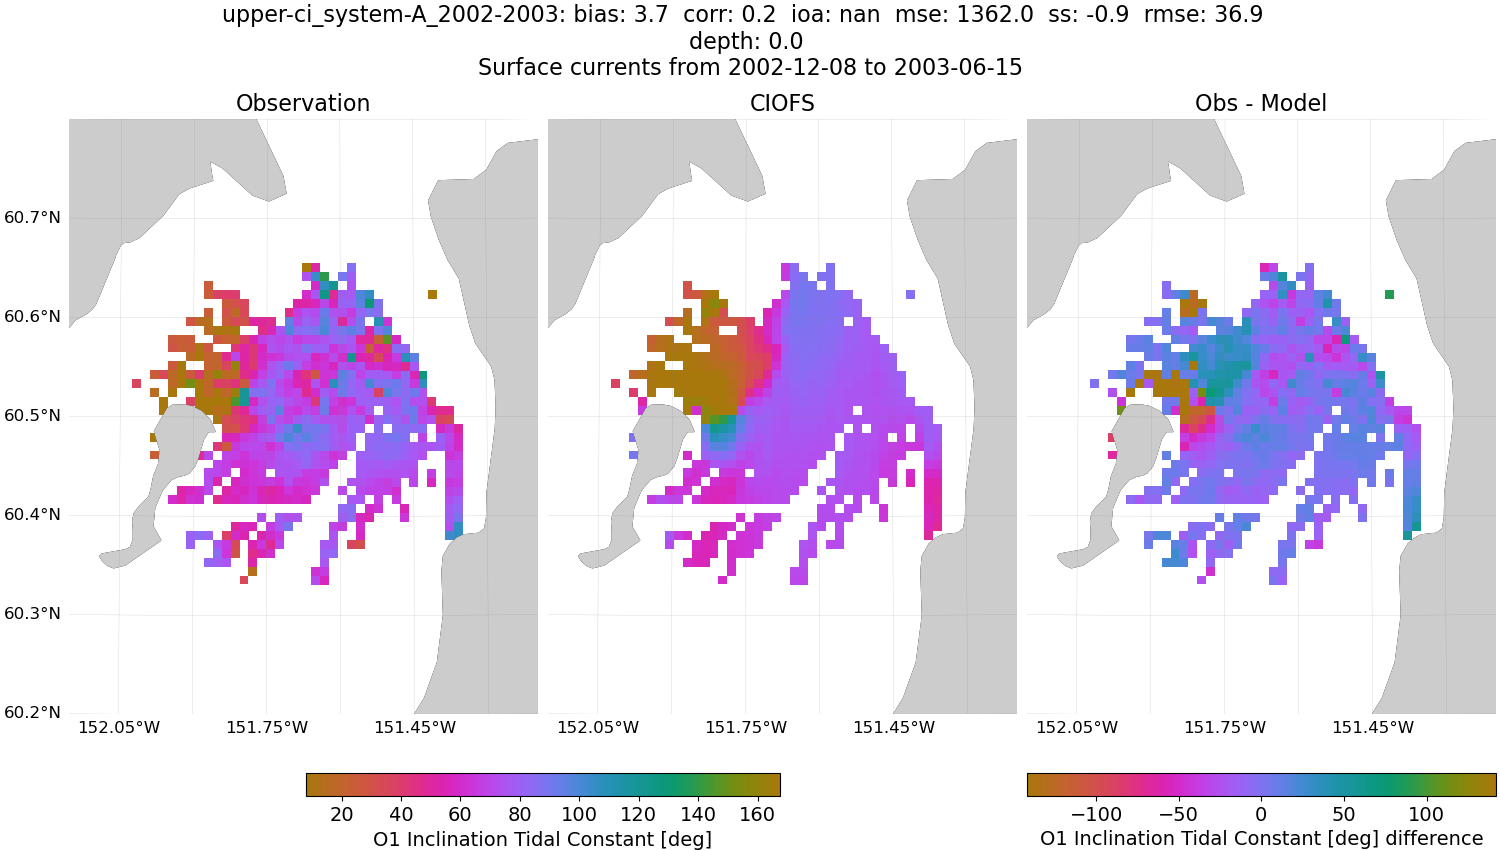
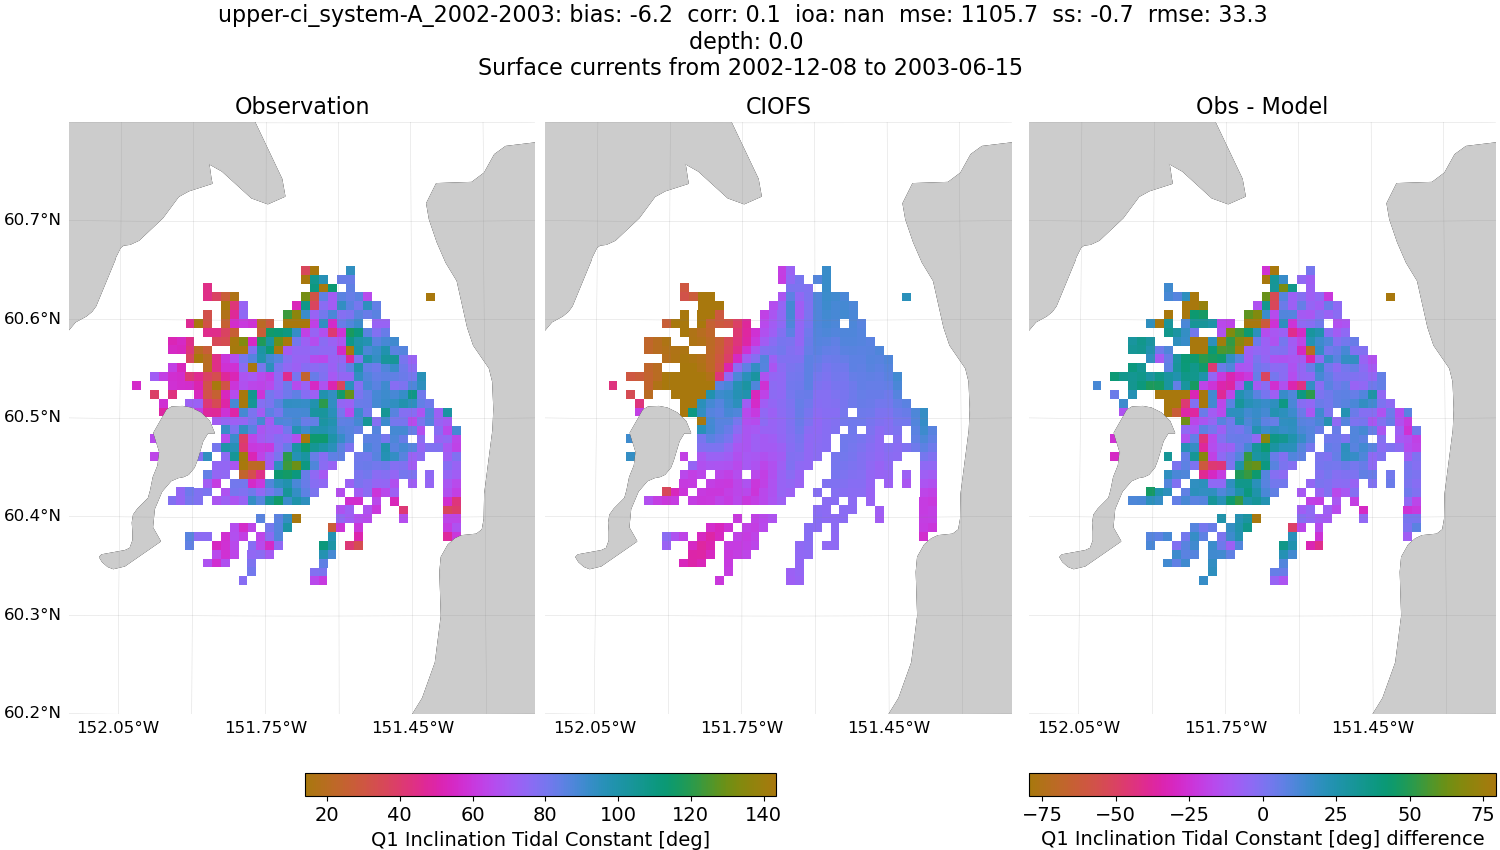
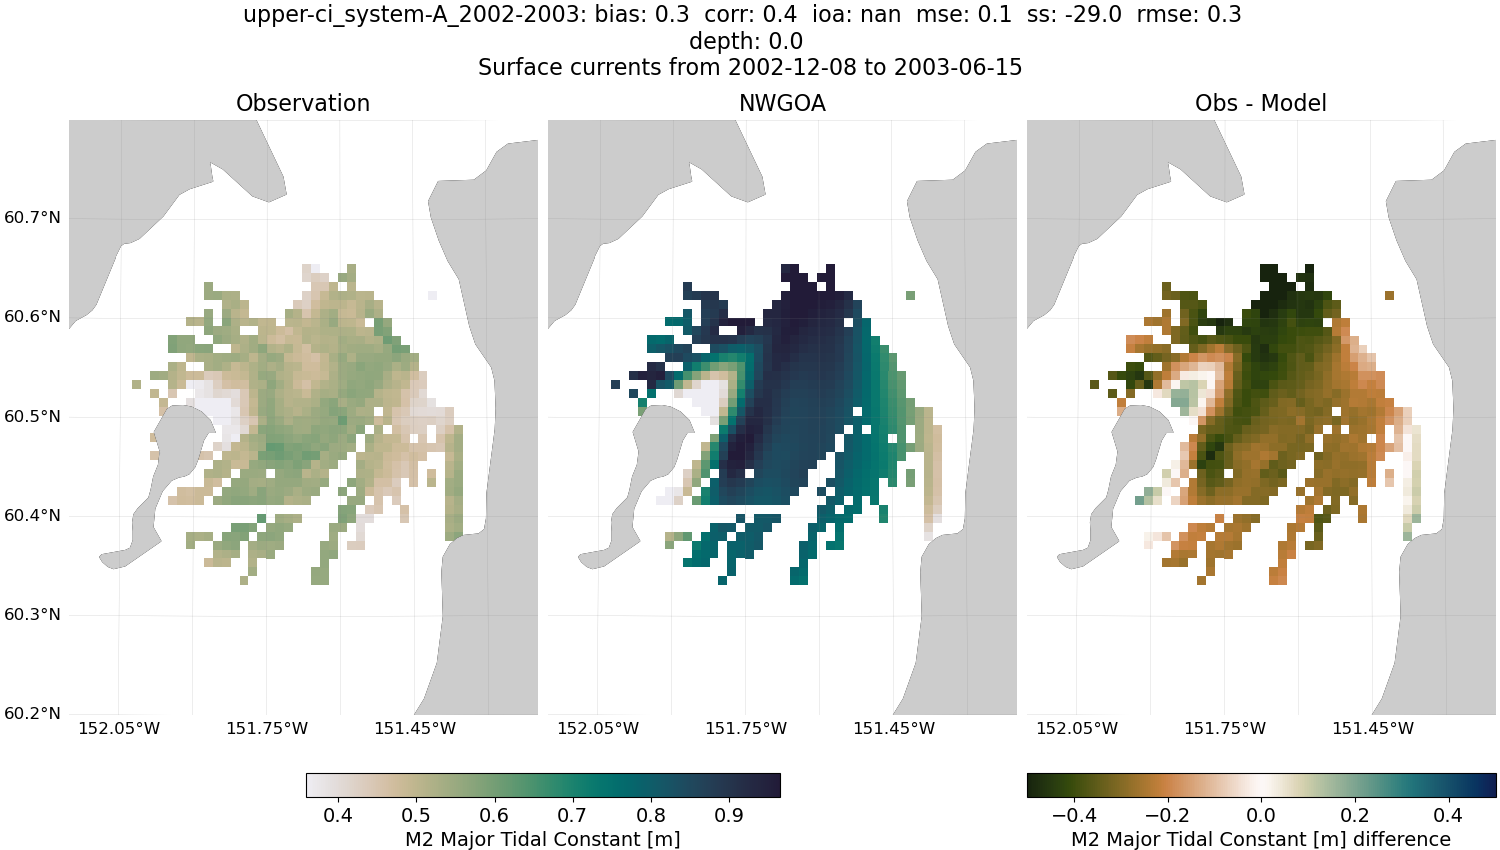
Tidal Constants#
CIOFS
Major Amplitude


Minor Amplitude


Phase


Inclination

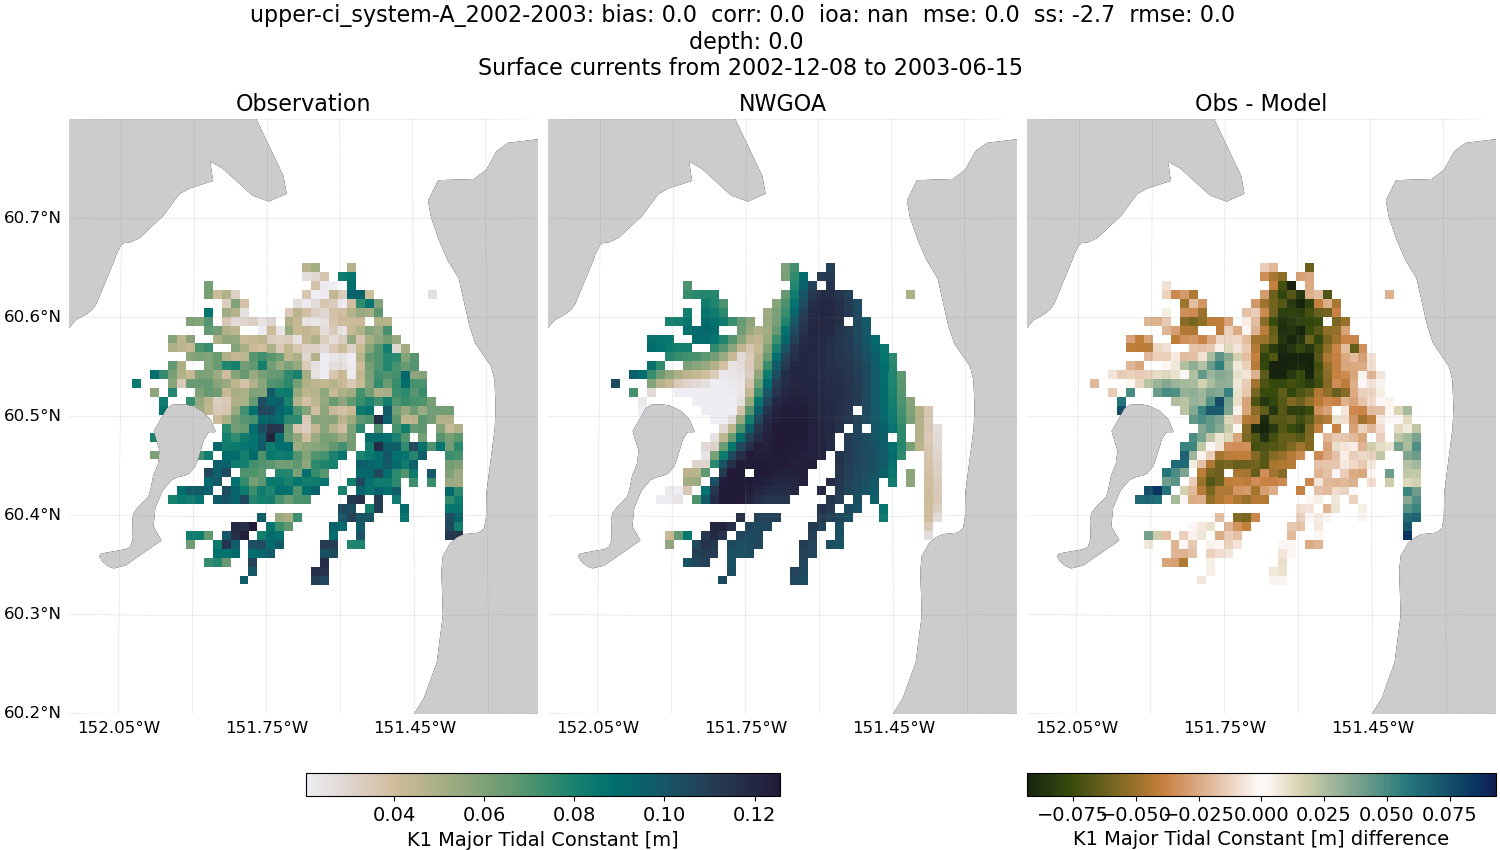
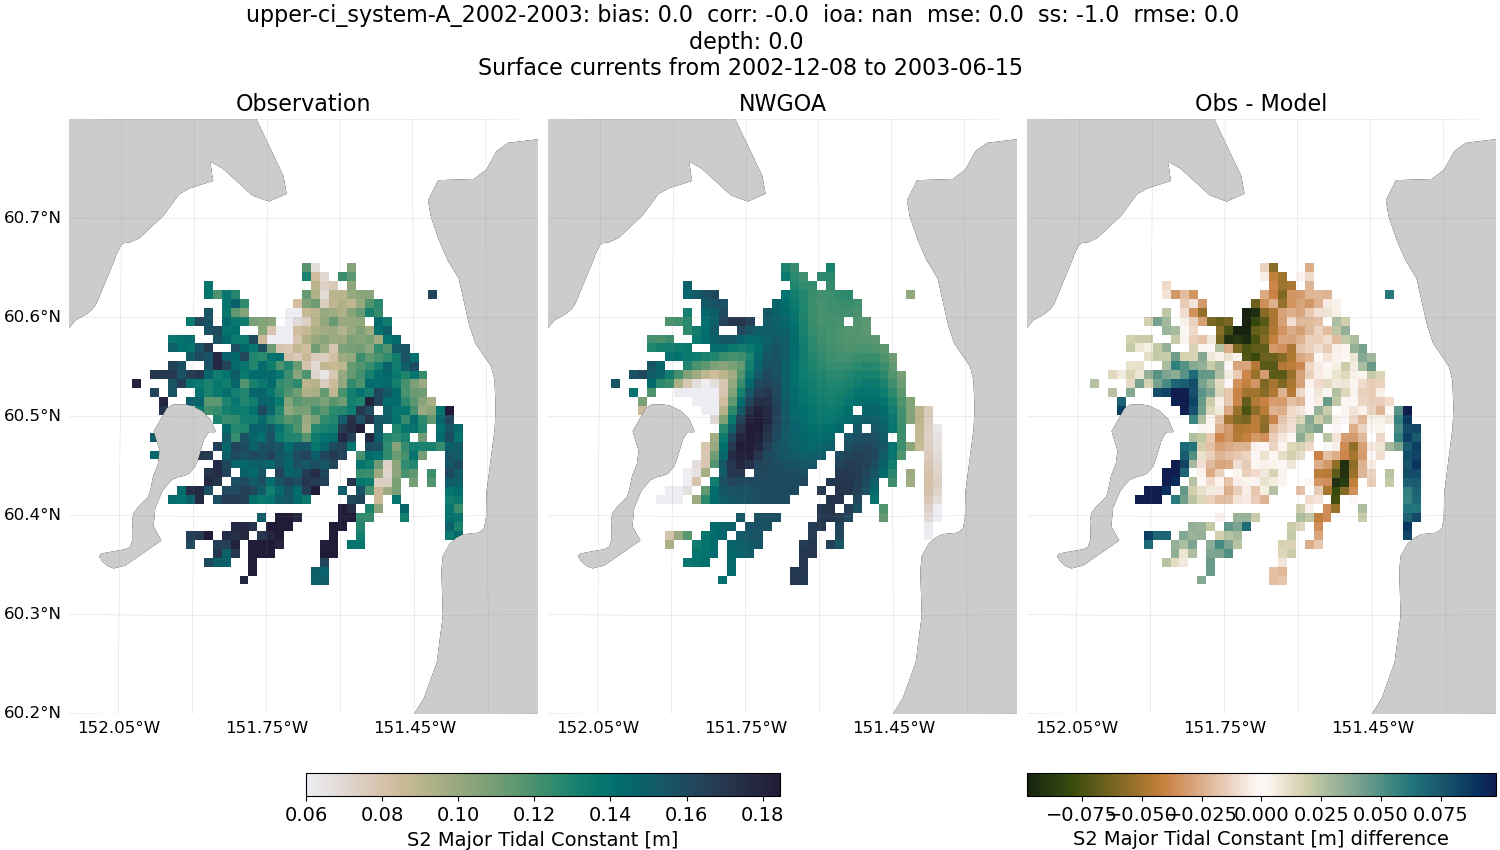
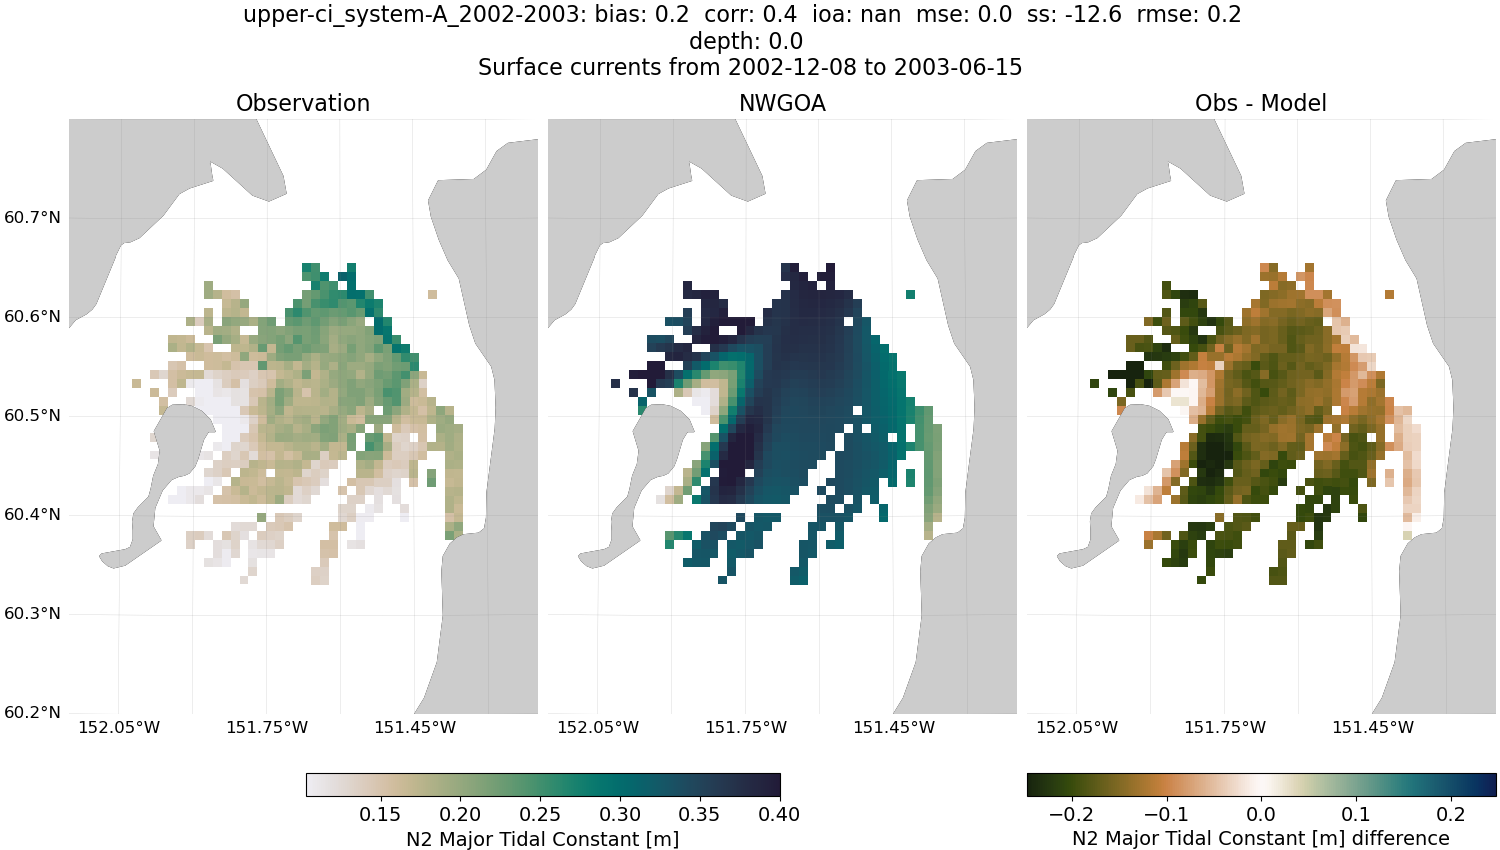
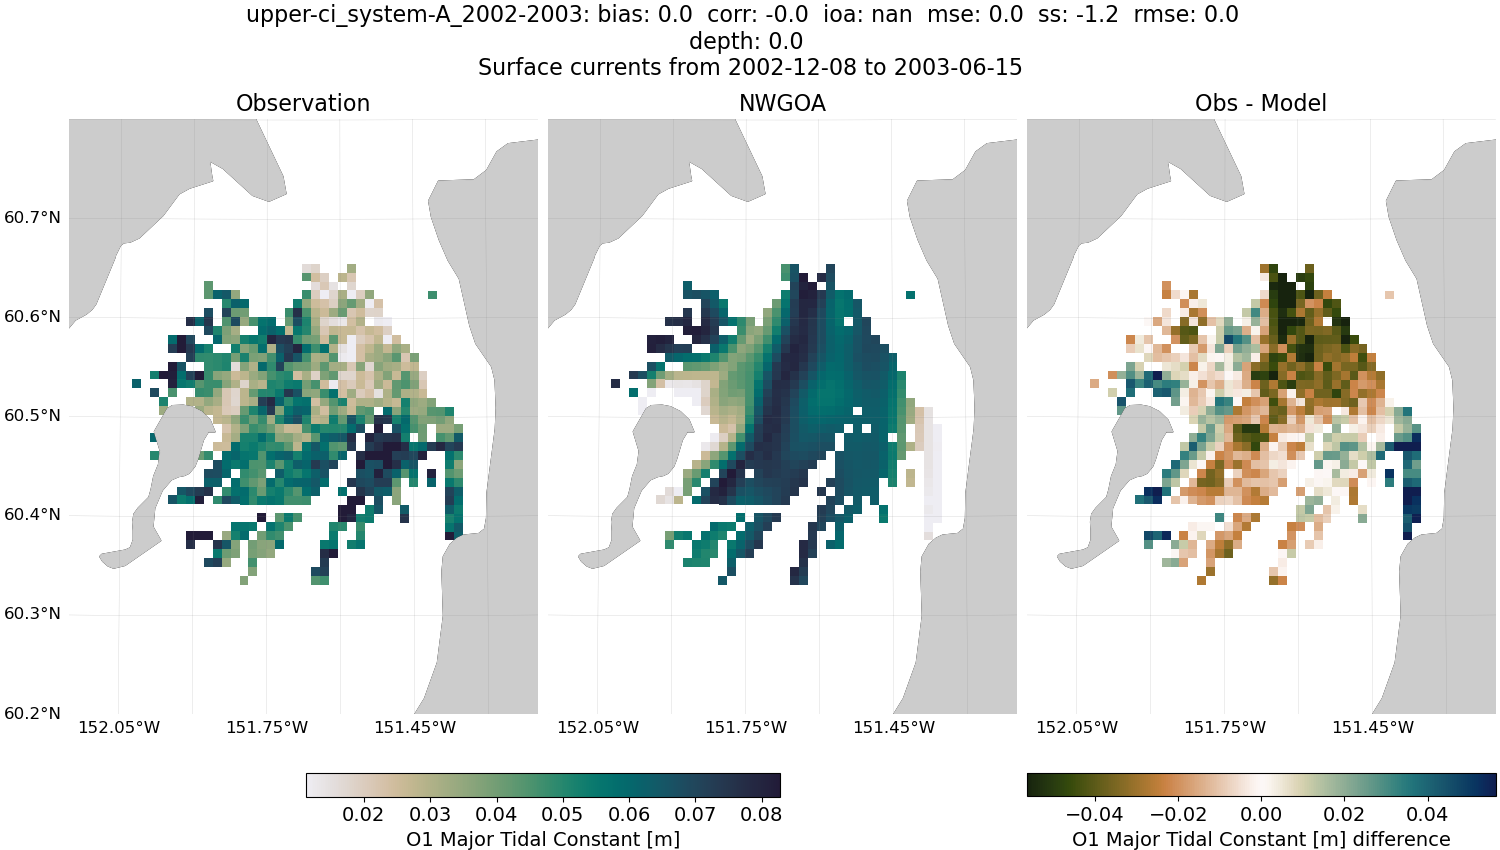
NWGOA
Major Amplitude


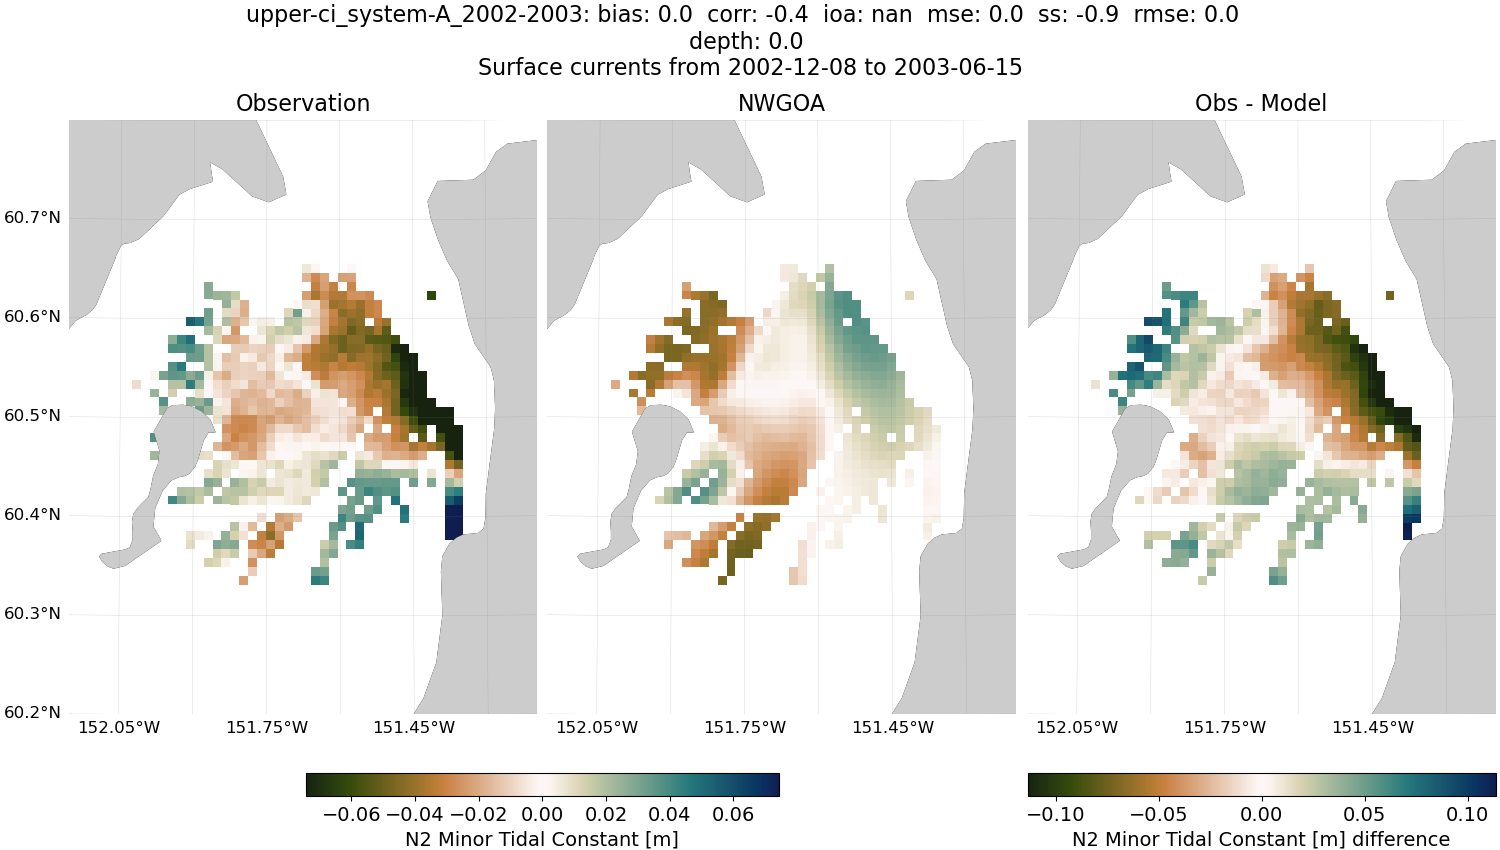
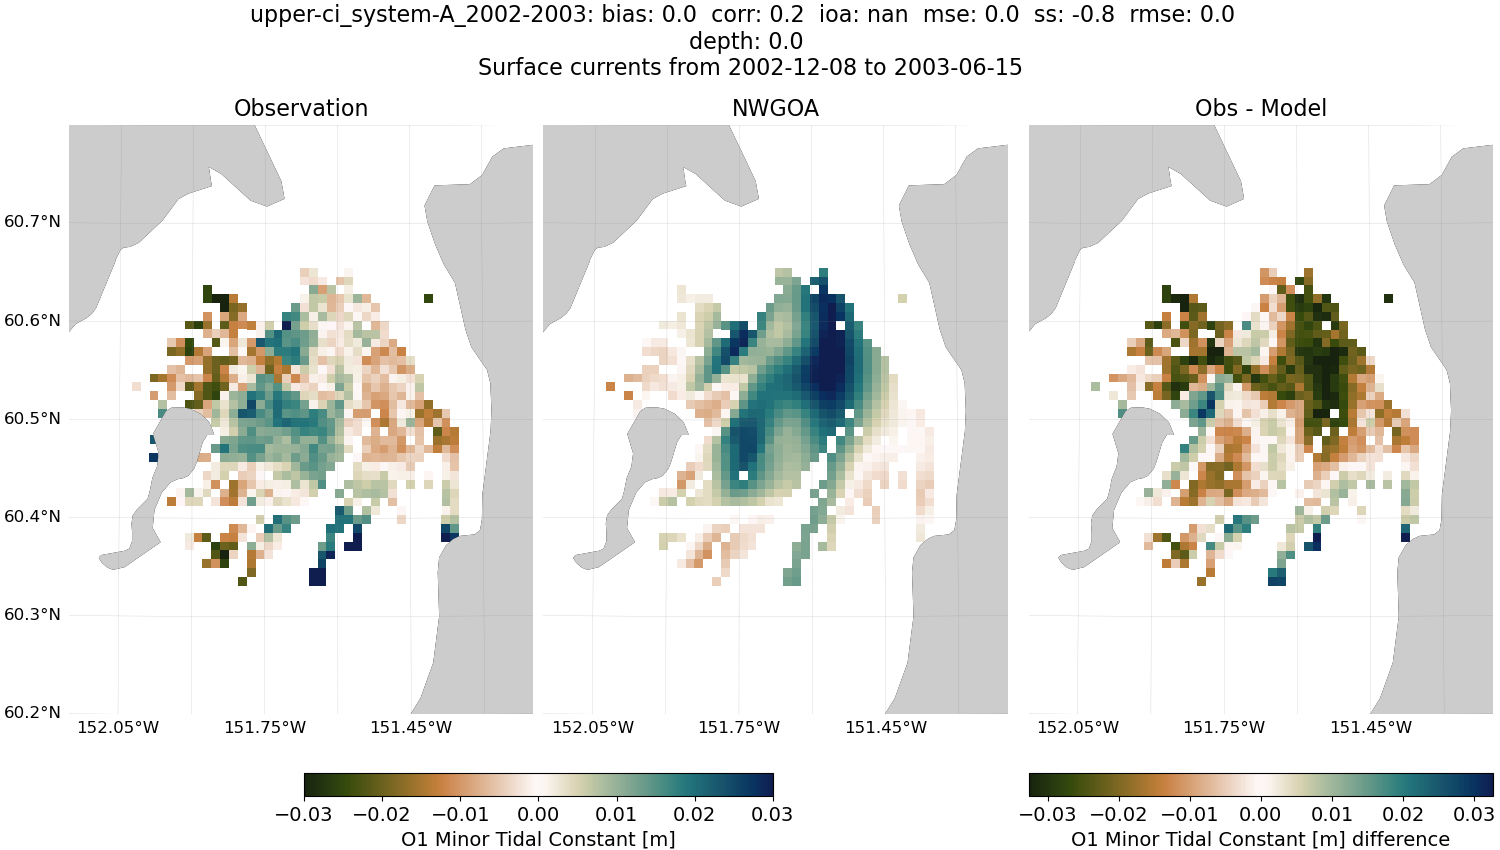
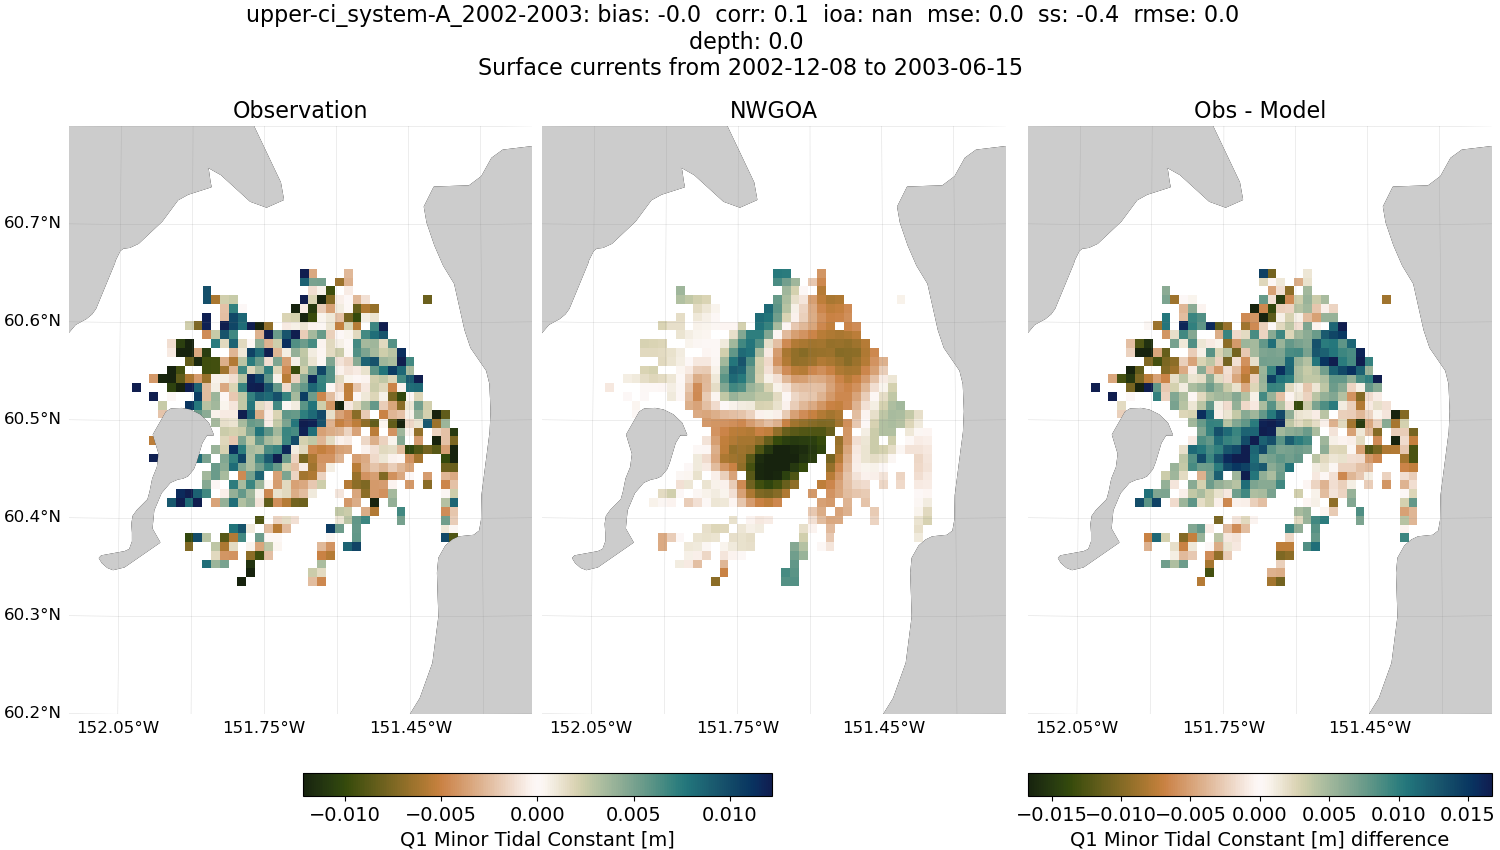
Minor Amplitude


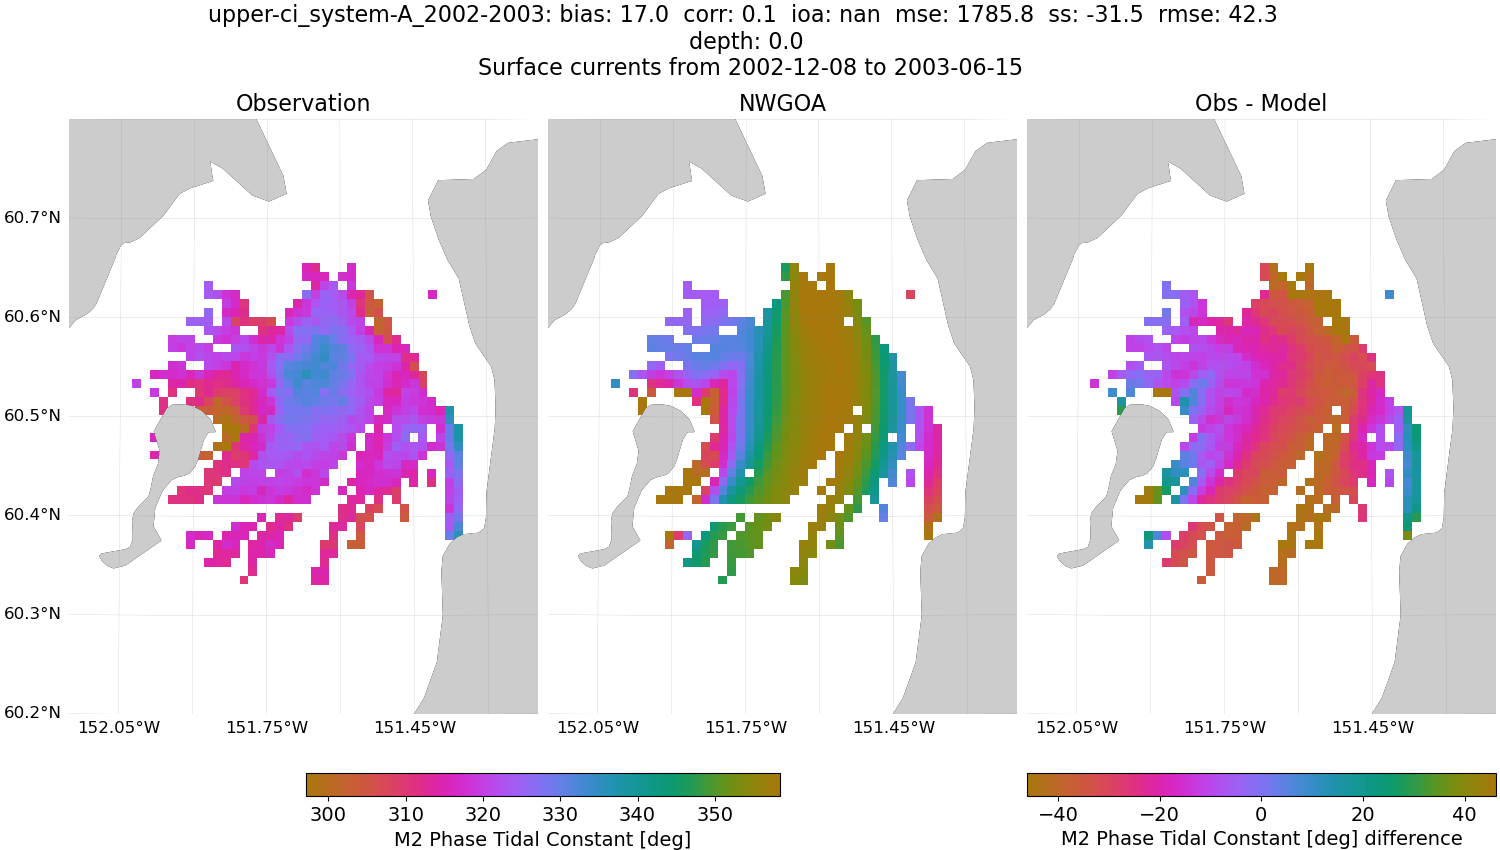
Phase

Inclination


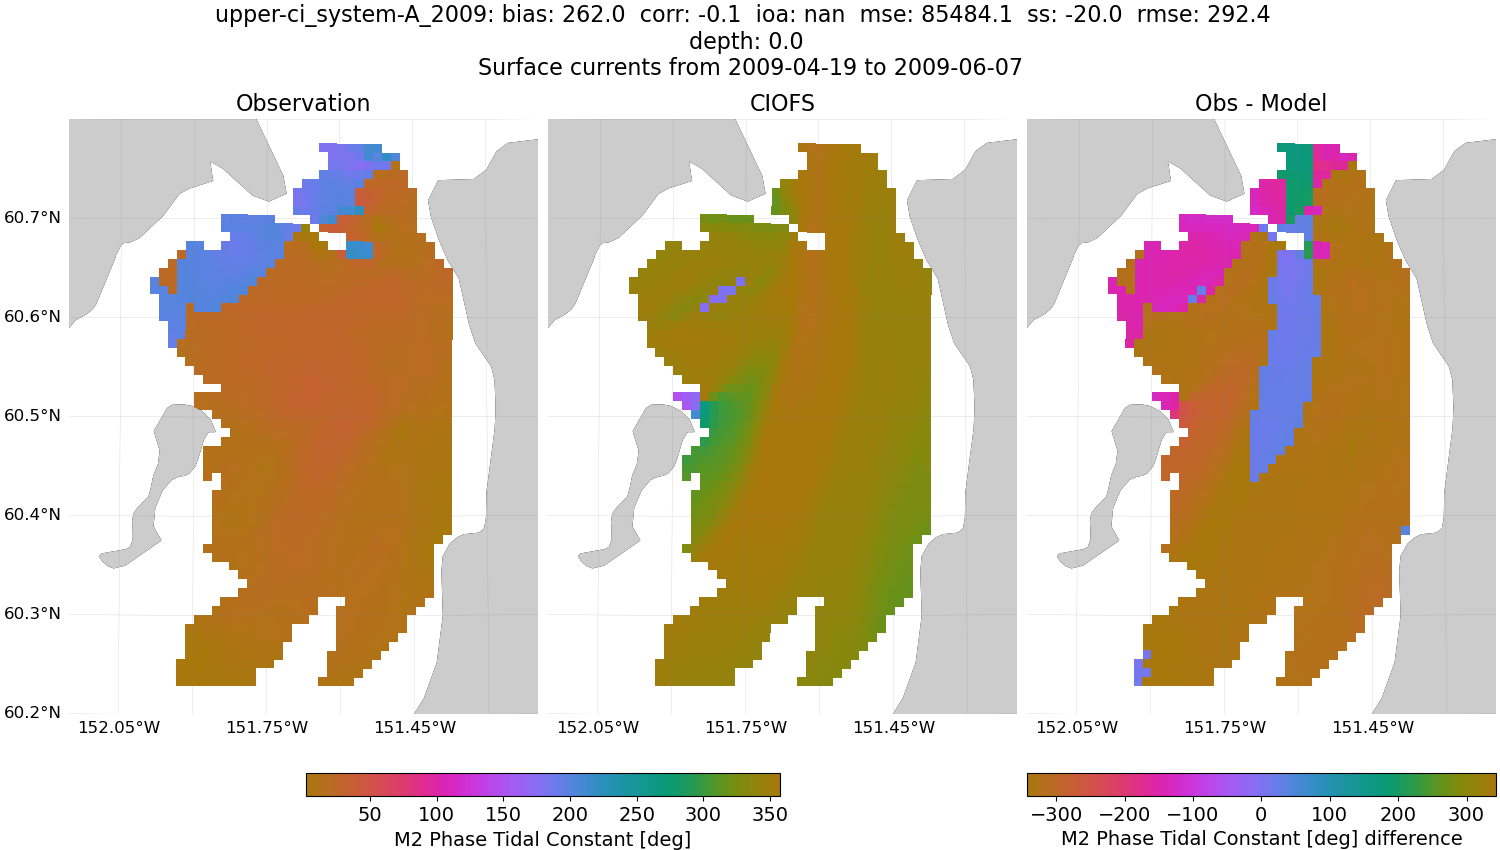
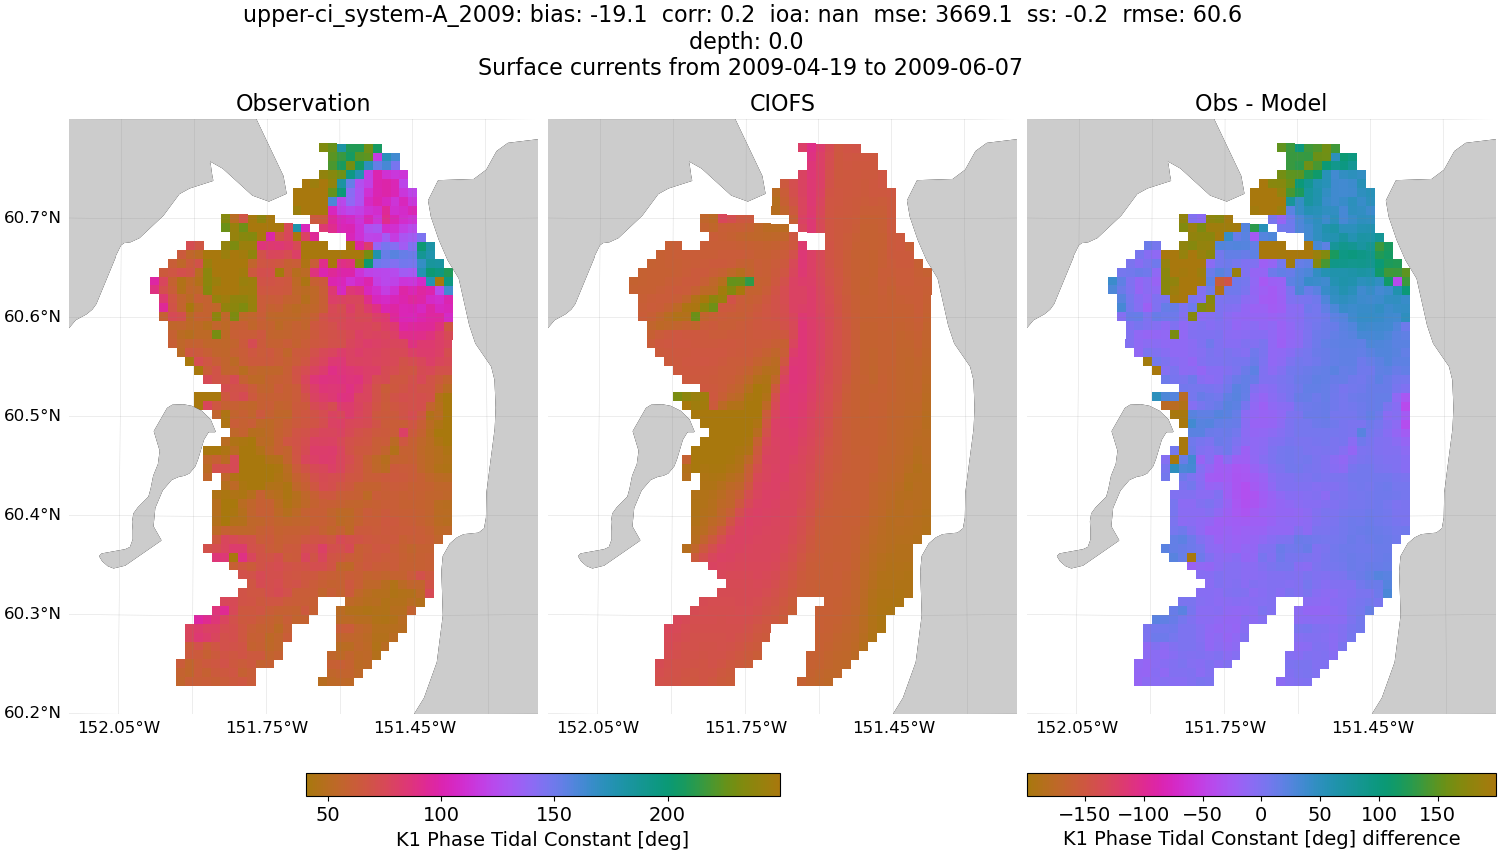
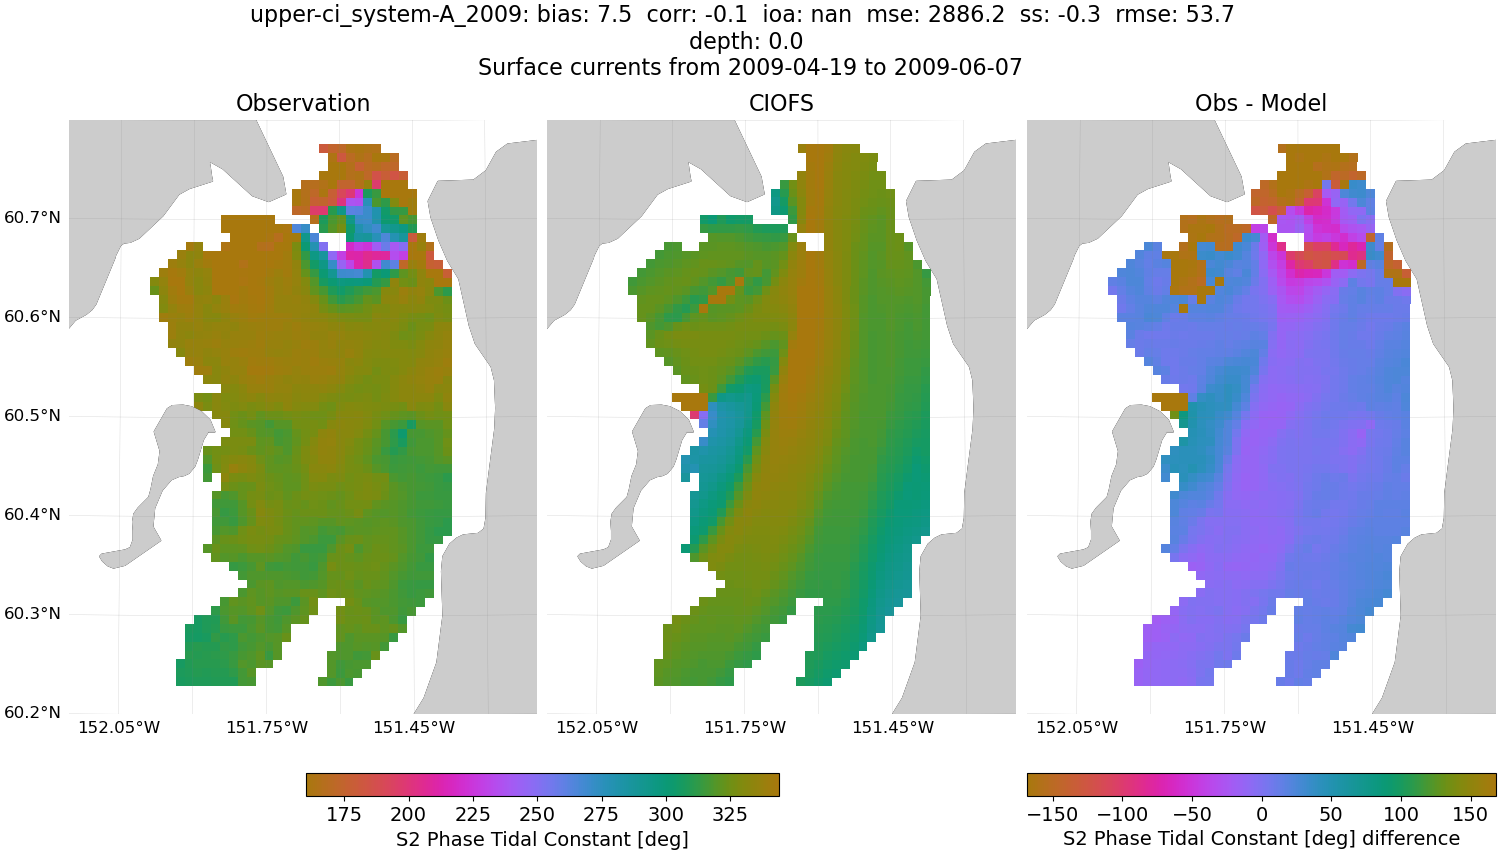
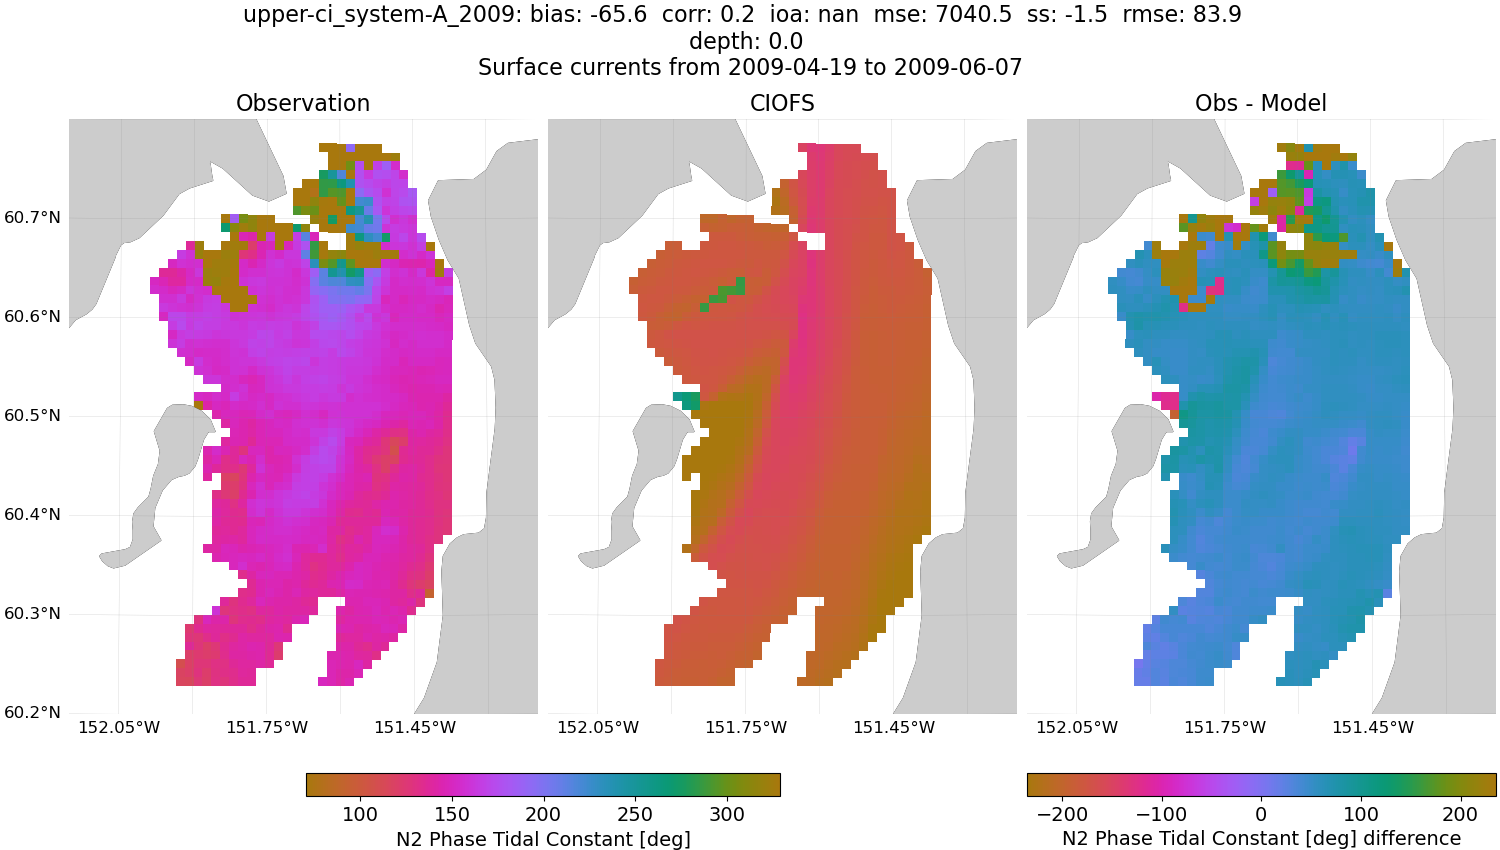
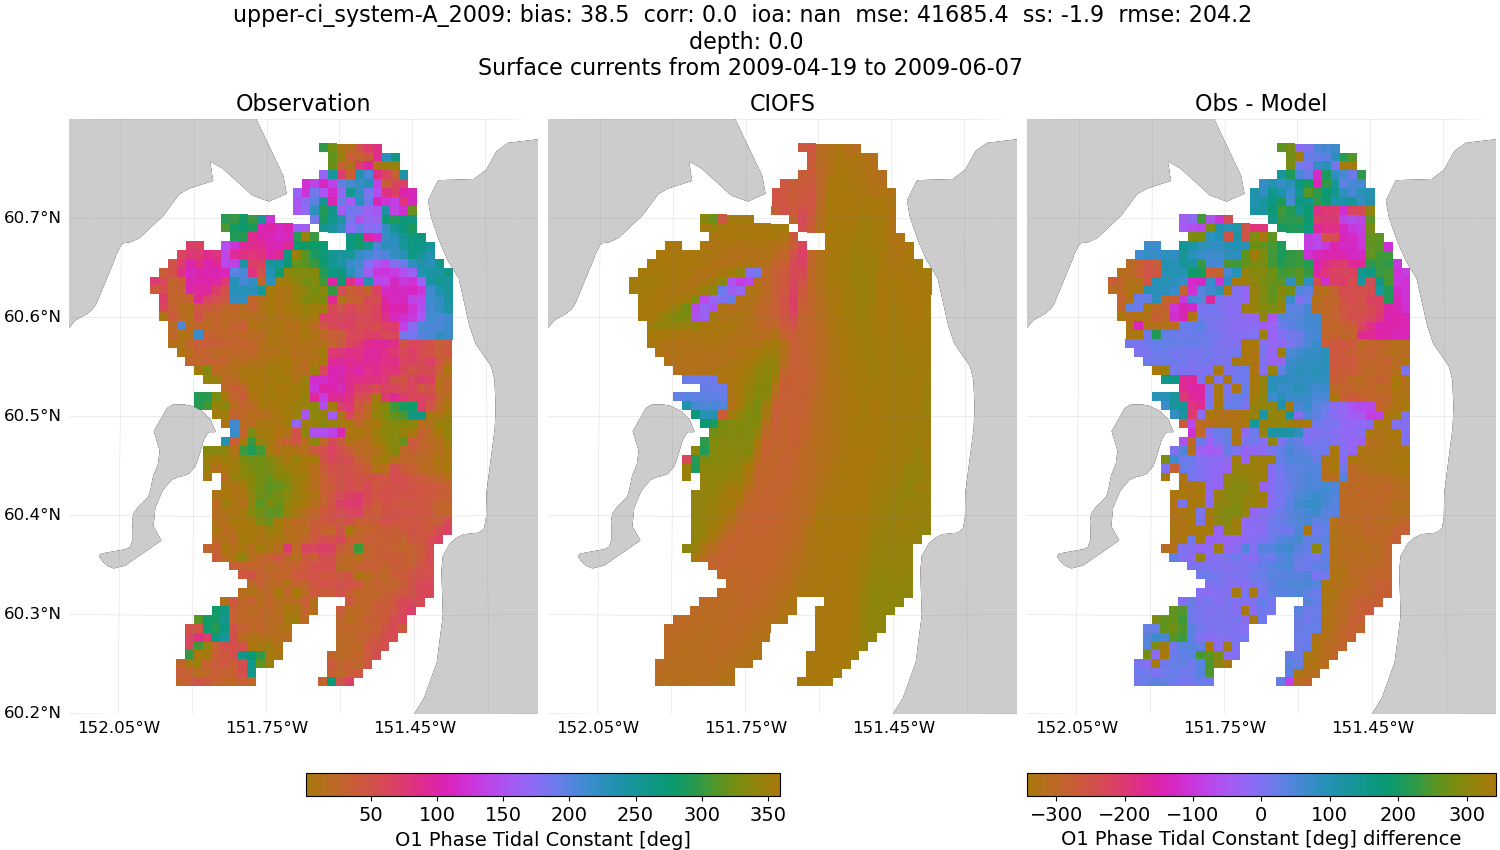
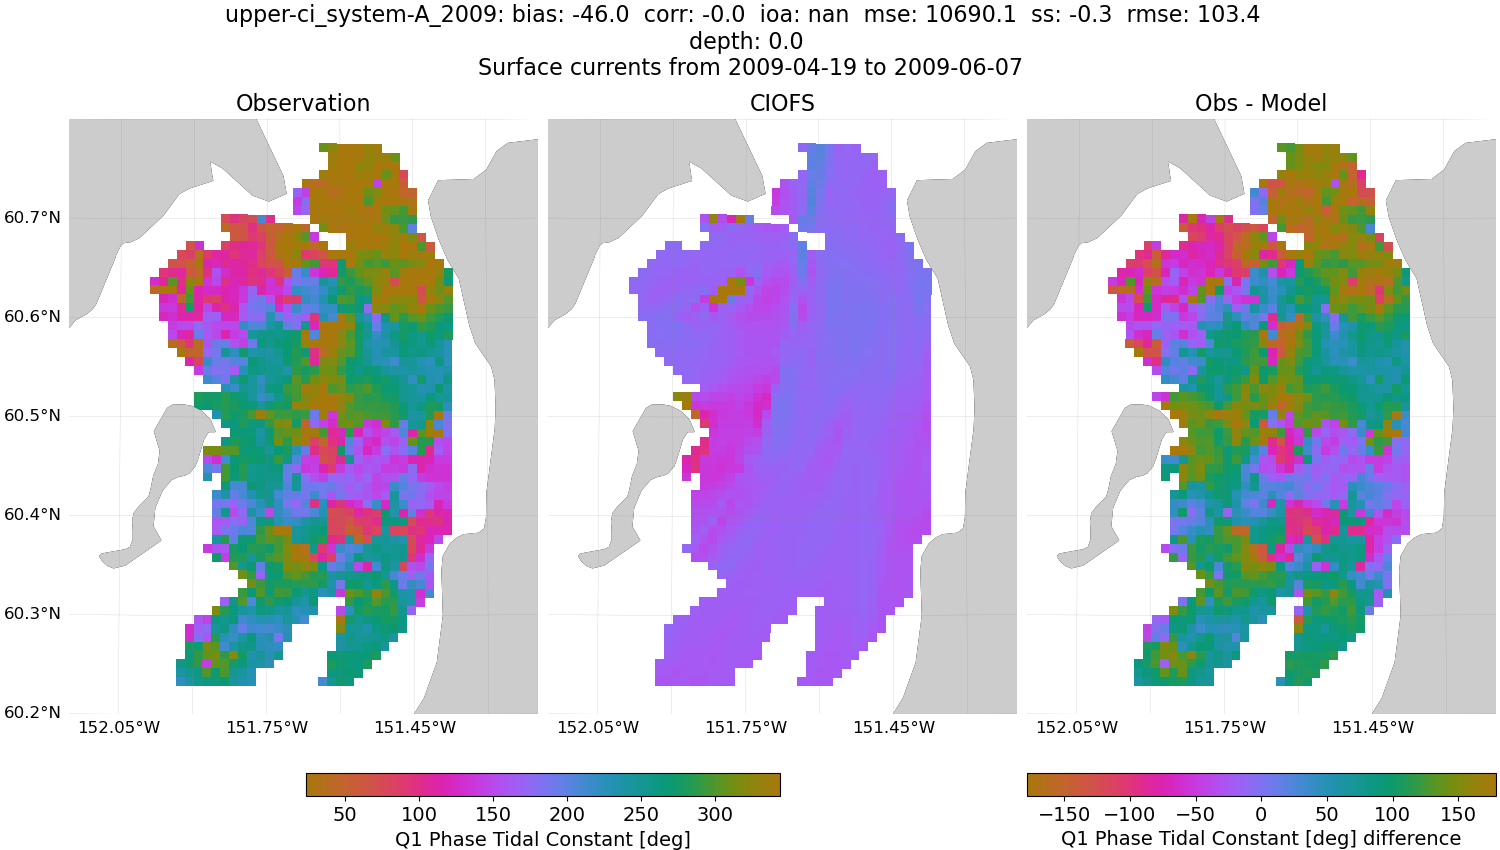
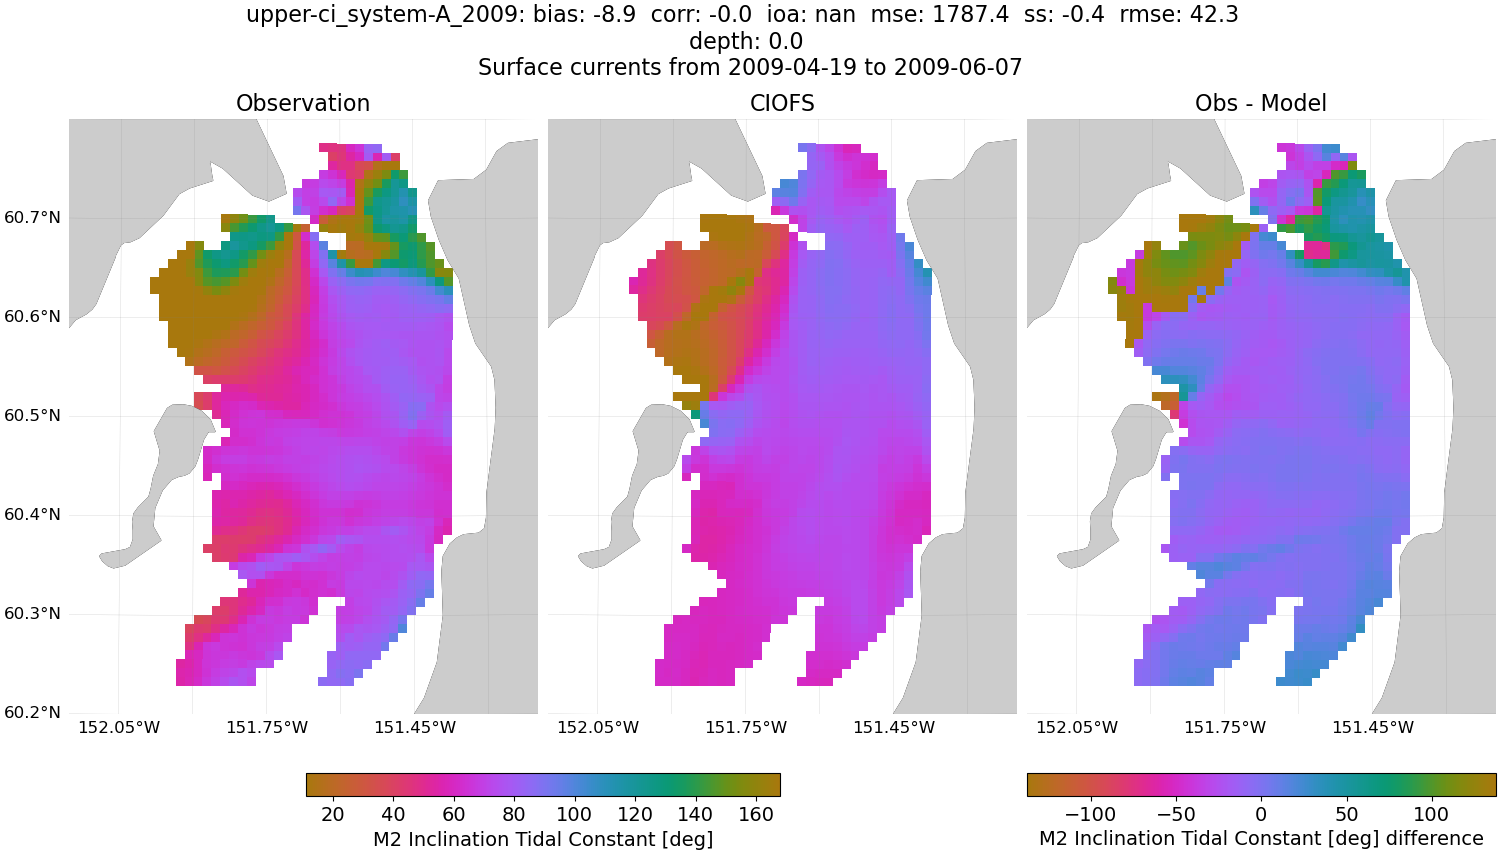
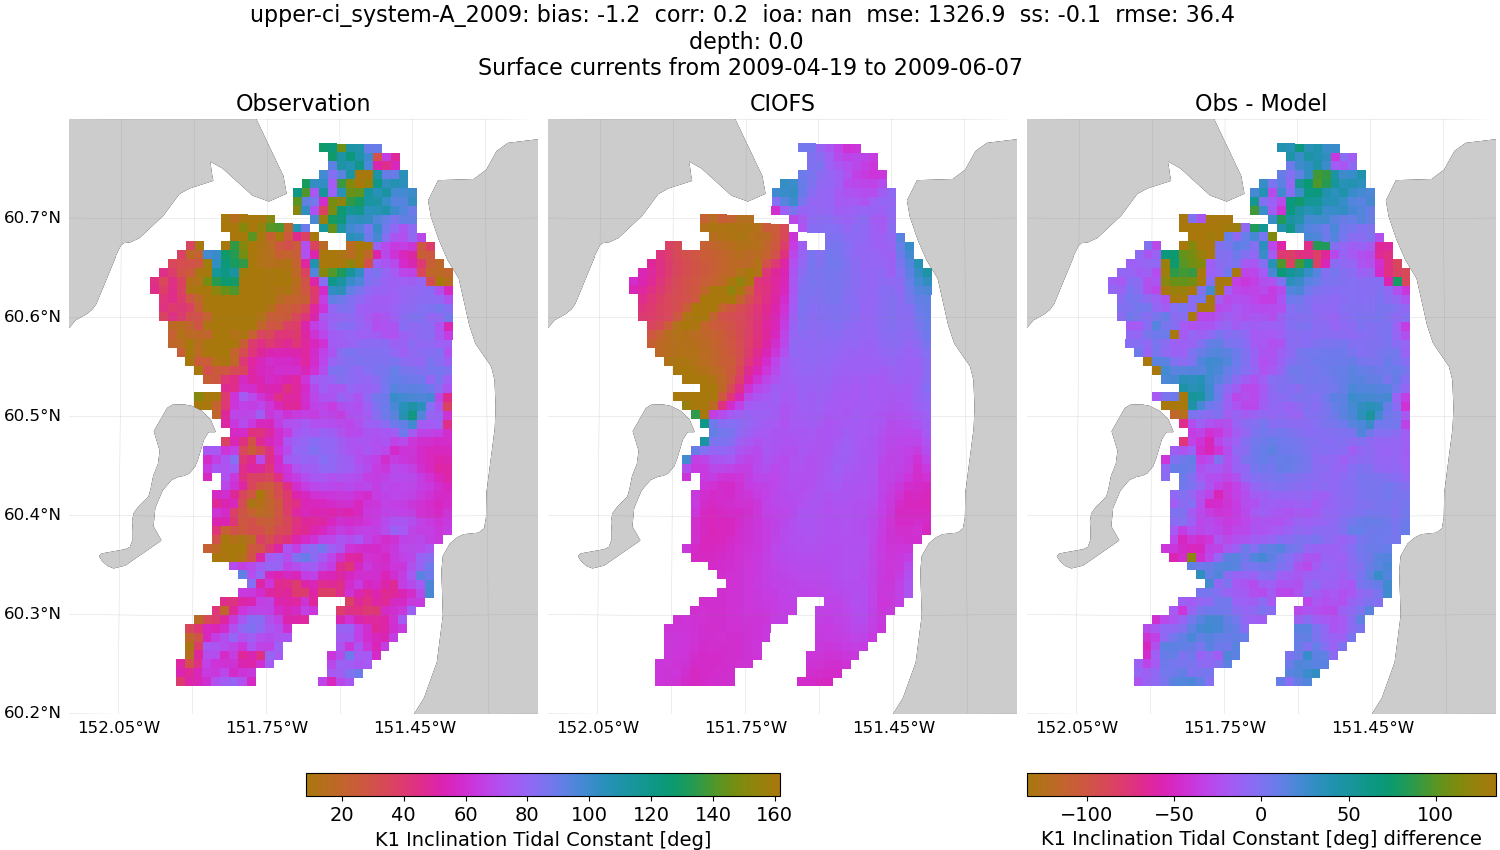
upper-ci_system-A_2009#
M2 Tidal Ellipses#
CIOFS#
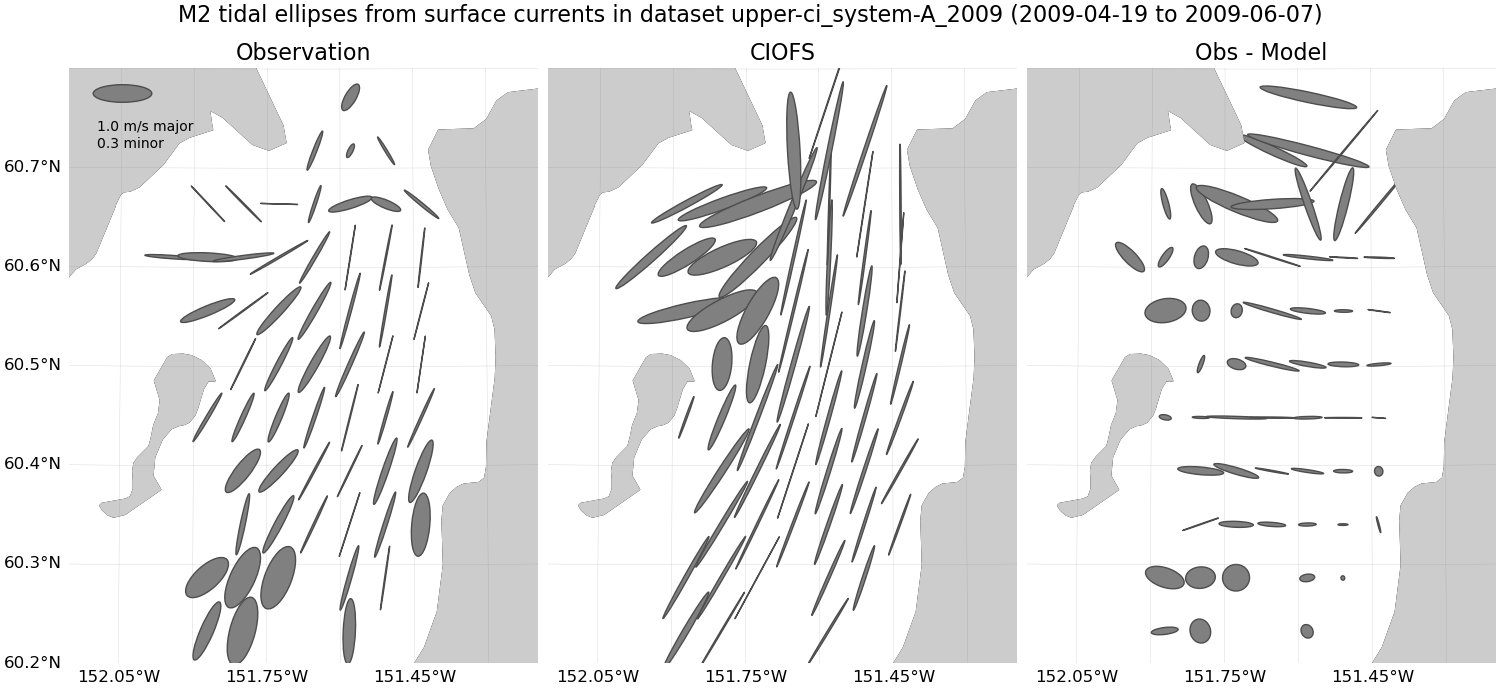
Fig. 77 M2 tidal ellipses from surface currents for CIOFS and dataset upper-ci_system-A_2009#
NWGOA#
NWGOA: Data time range is 2009-04-19 to 2009-06-07 but model ends 2009-01-01.
K1 Tidal Ellipses#
CIOFS#
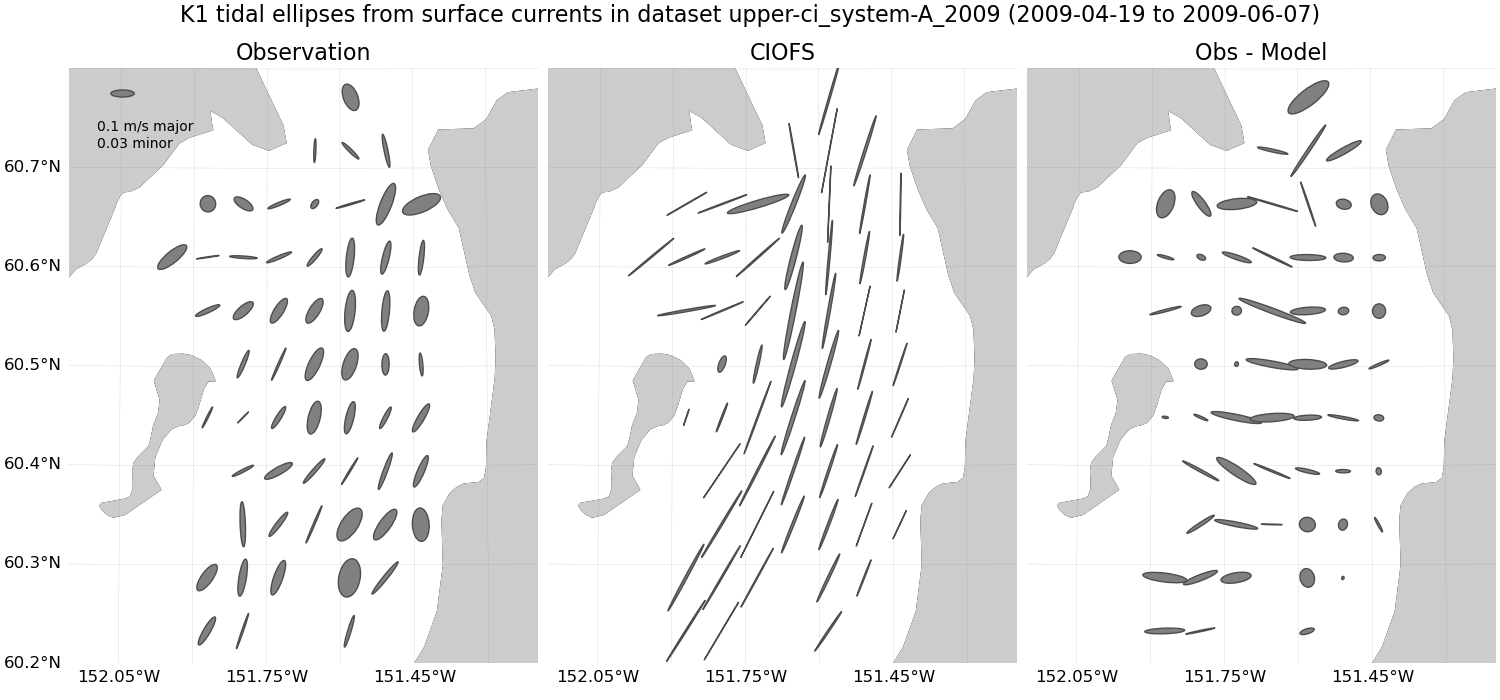
Fig. 78 K1 tidal ellipses from surface currents for CIOFS and dataset upper-ci_system-A_2009#
NWGOA#
NWGOA: Data time range is 2009-04-19 to 2009-06-07 but model ends 2009-01-01.
Subtidal Mean#
CIOFS#
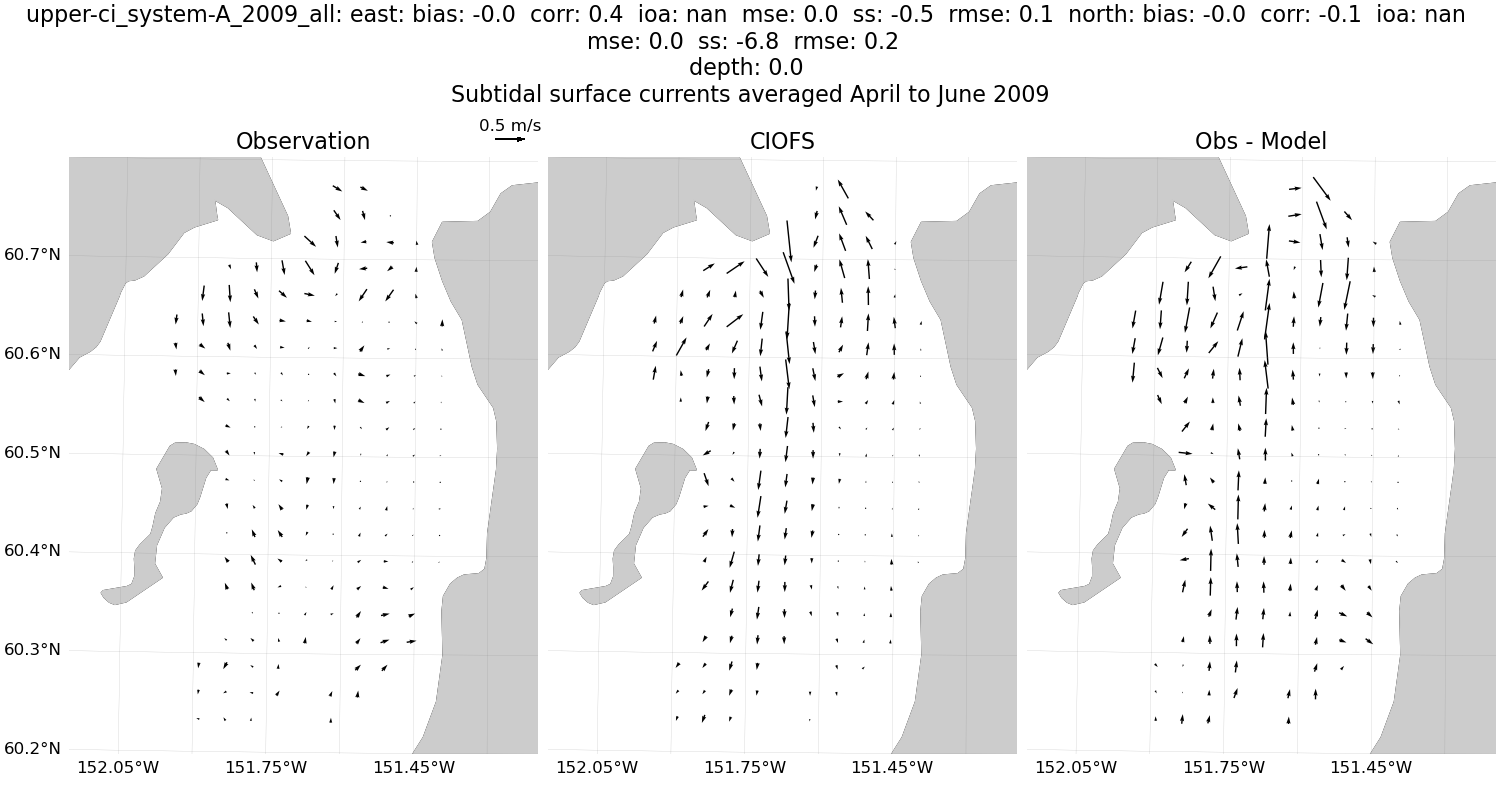
Fig. 79 Subtidal mean from surface currents for CIOFS and dataset upper-ci_system-A_2009#
NWGOA#
NWGOA: Data time range is 2009-04-19 to 2009-06-07 but model ends 2009-01-01.
Hourly#
CIOFS#
Fig. 80 Hourly from surface currents for CIOFS and dataset upper-ci_system-A_2009#
NWGOA#
NWGOA: Data time range is 2009-04-19 to 2009-06-07 but model ends 2009-01-01.
Subtidal, 6-Hourly#
CIOFS#
Fig. 81 Subtidal, 6-hourly from surface currents for CIOFS and dataset upper-ci_system-A_2009#
NWGOA#
NWGOA: Data time range is 2009-04-19 to 2009-06-07 but model ends 2009-01-01.
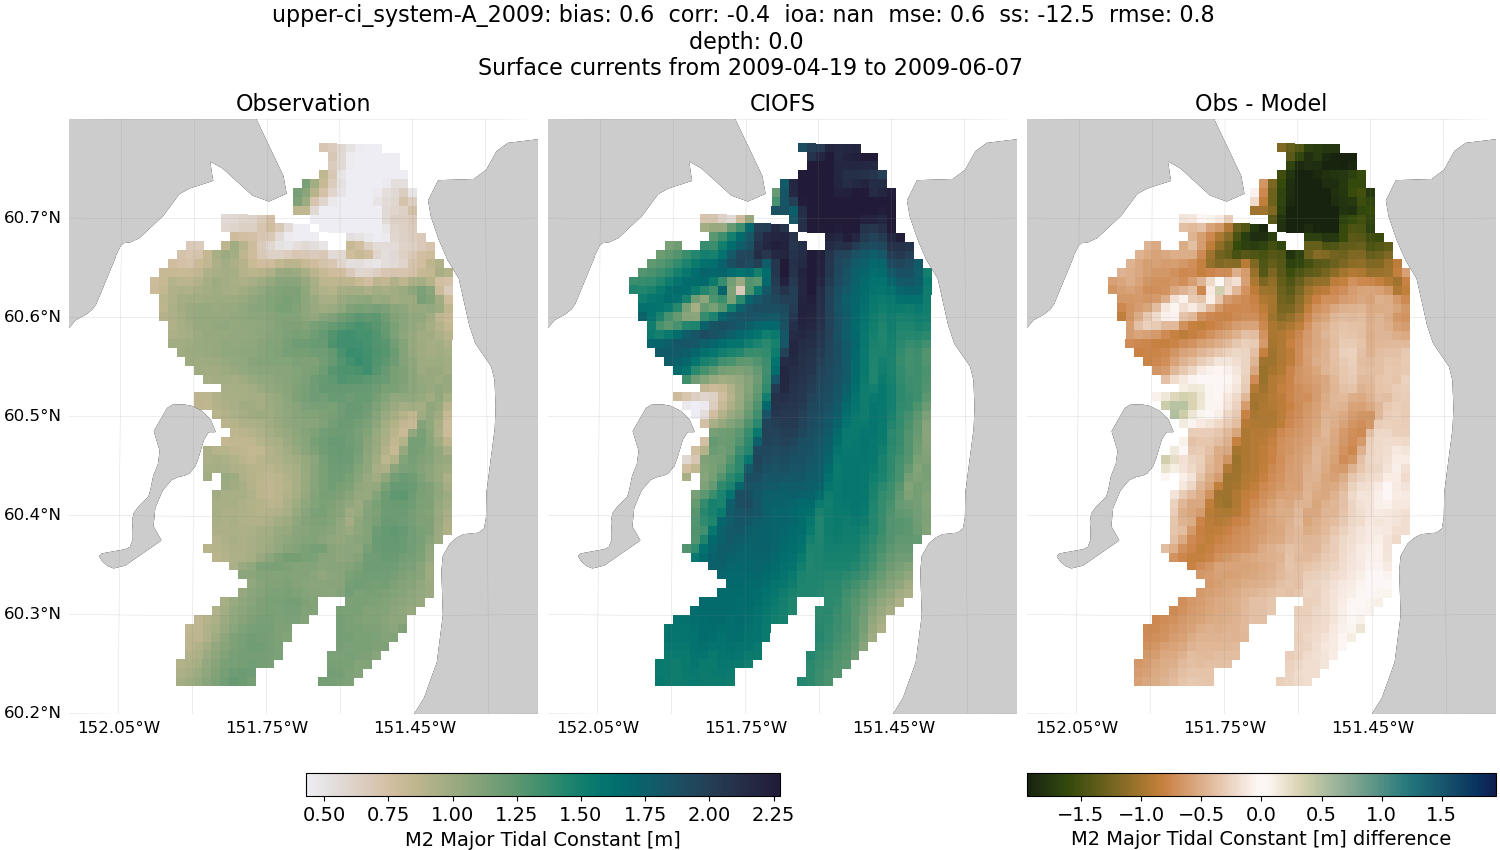
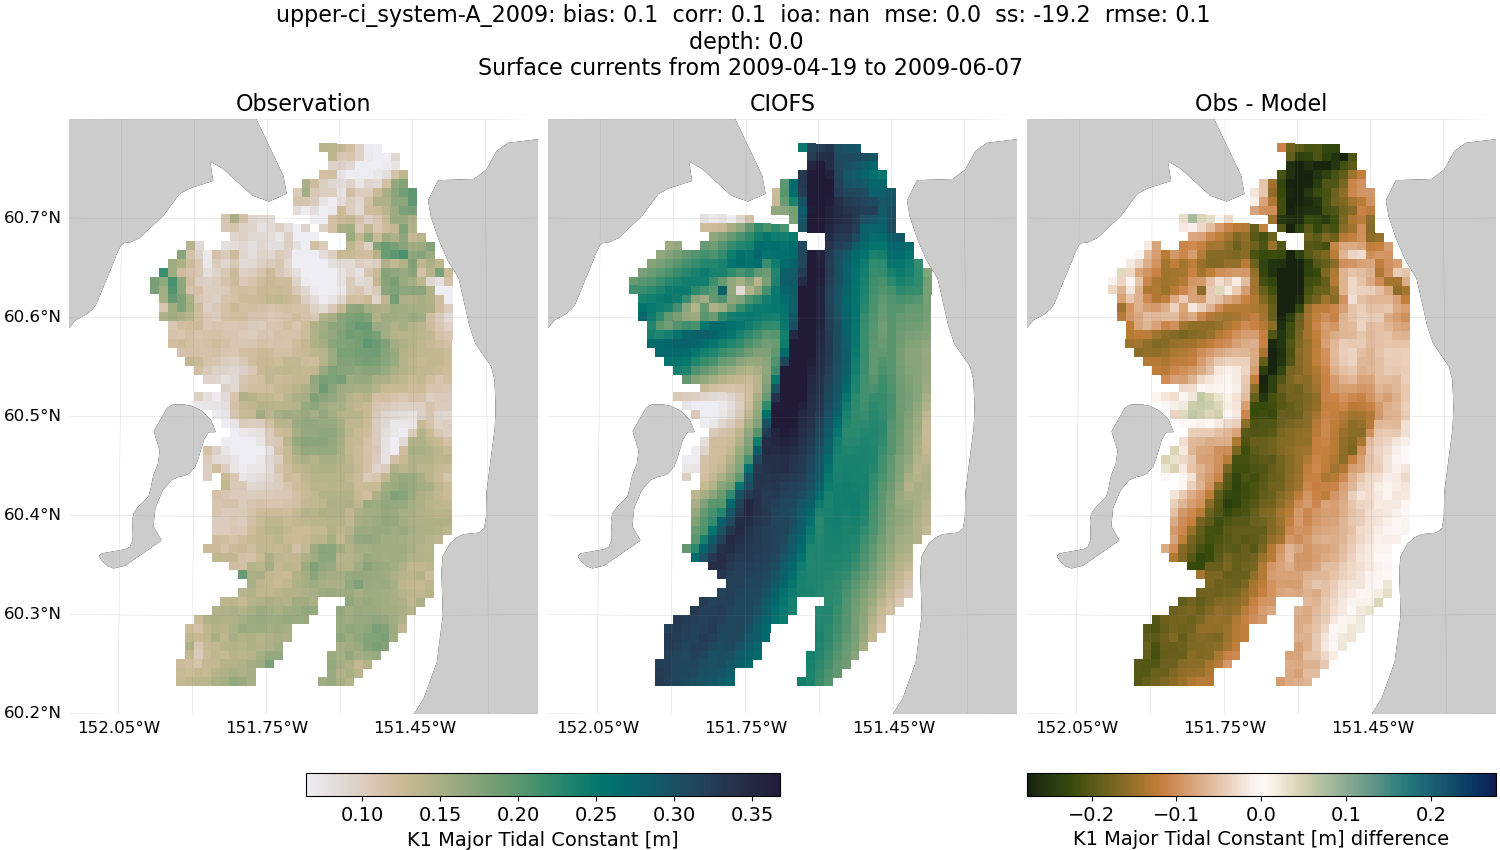
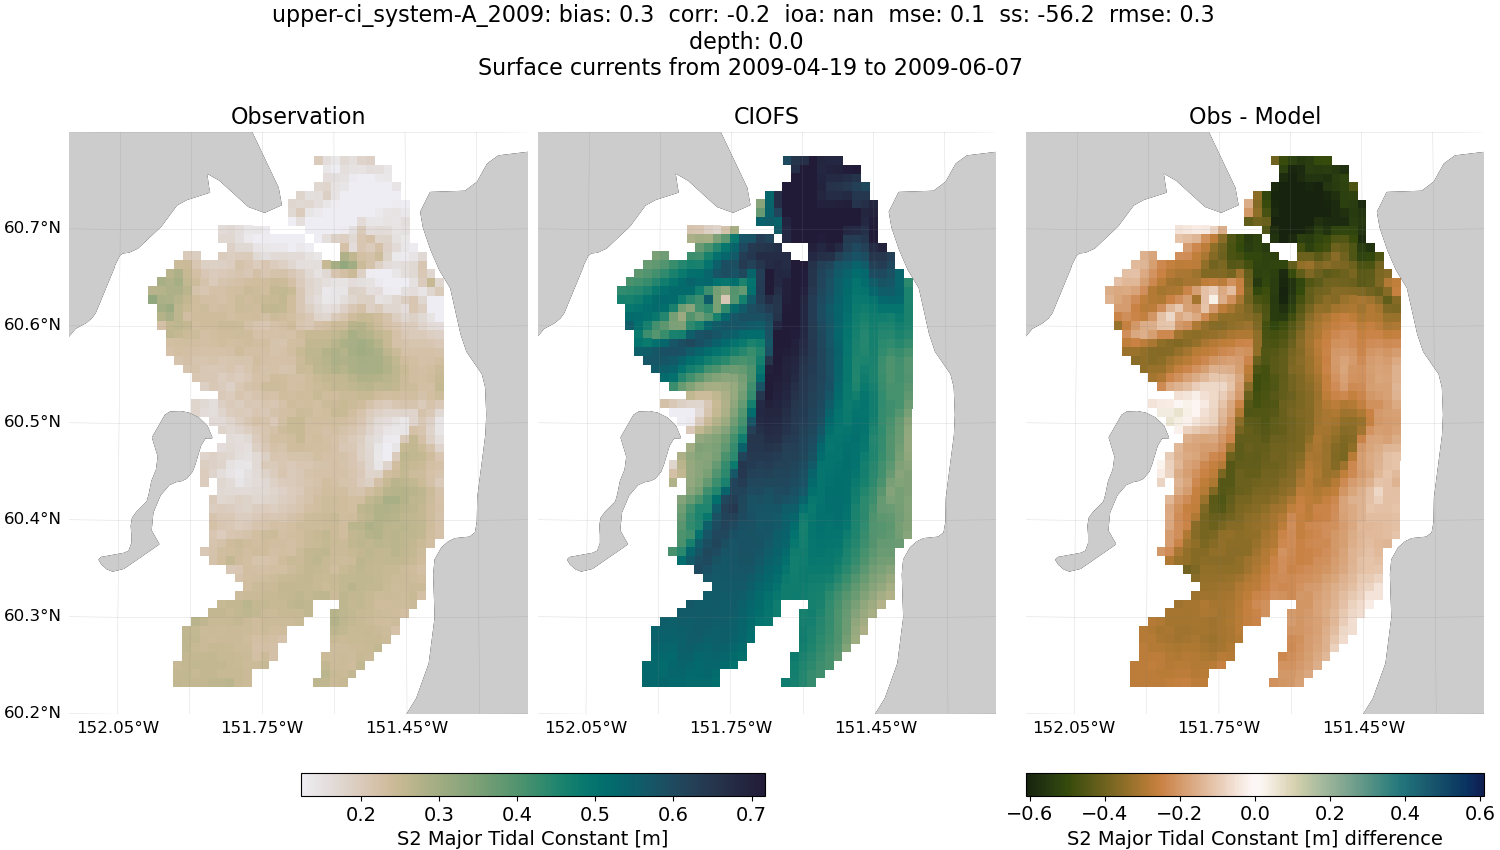
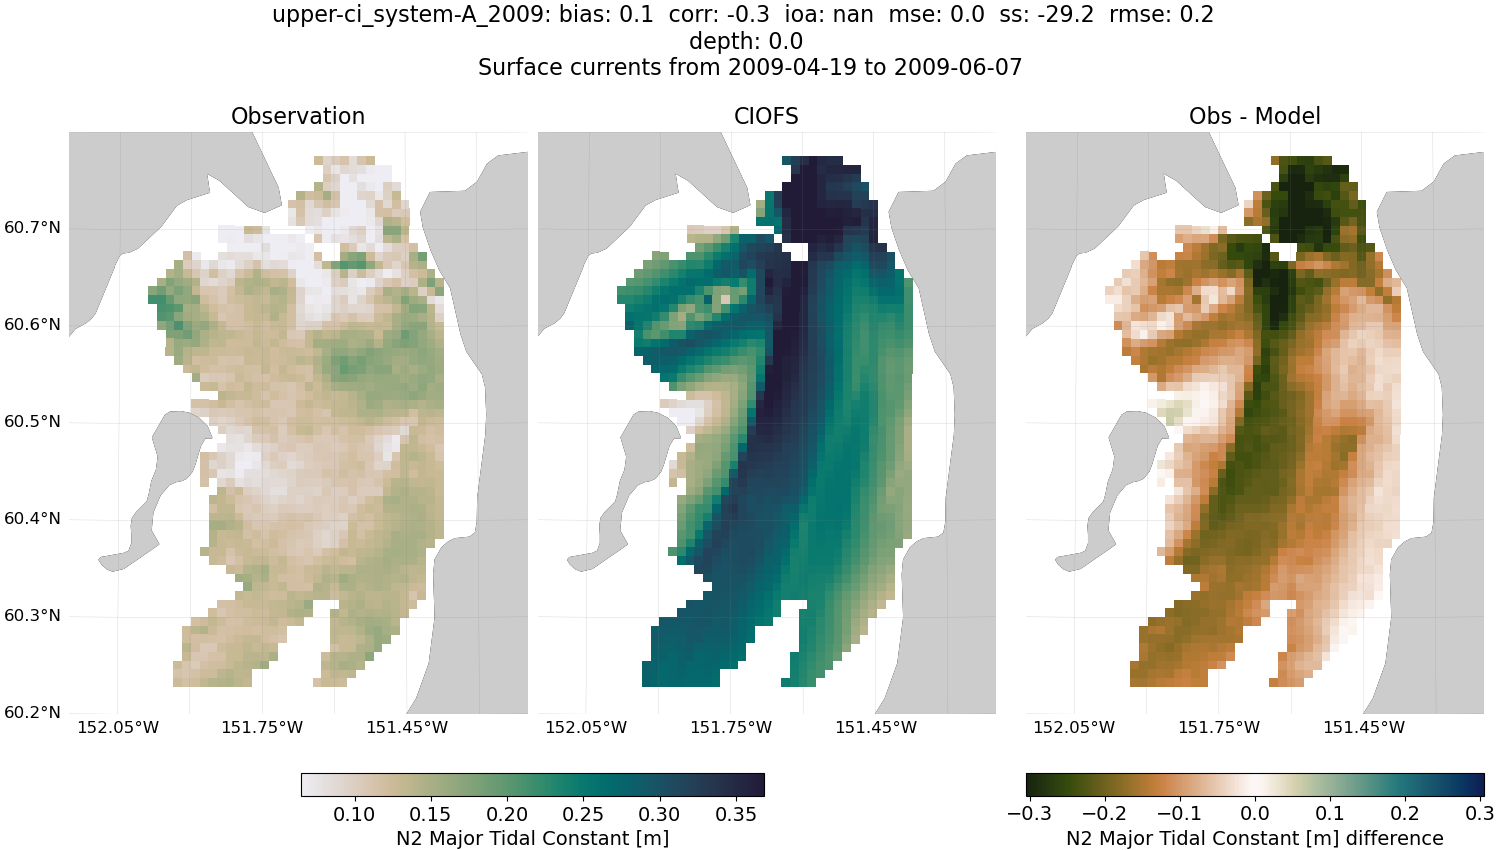
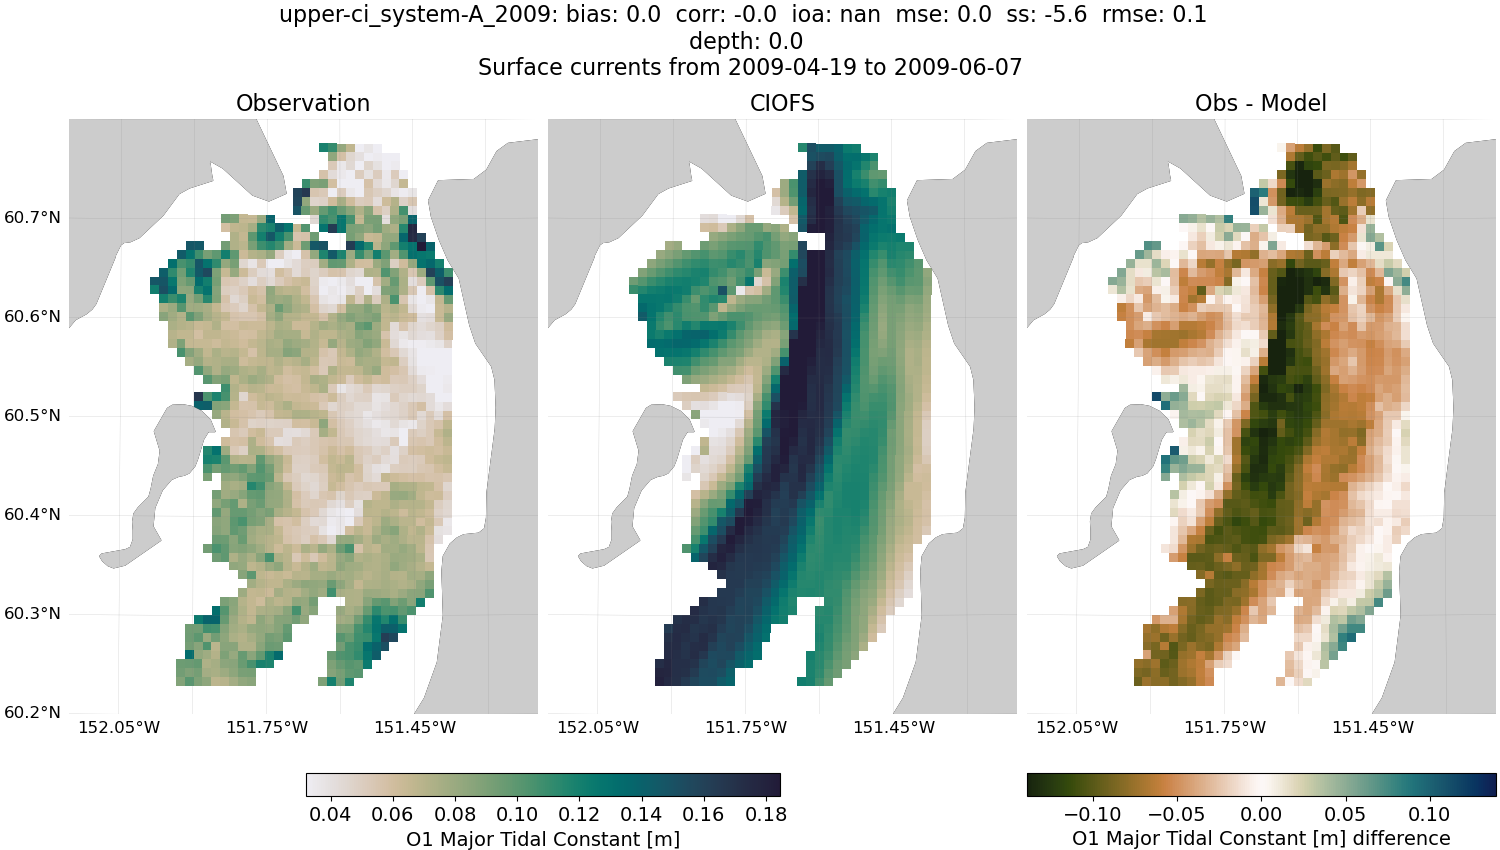
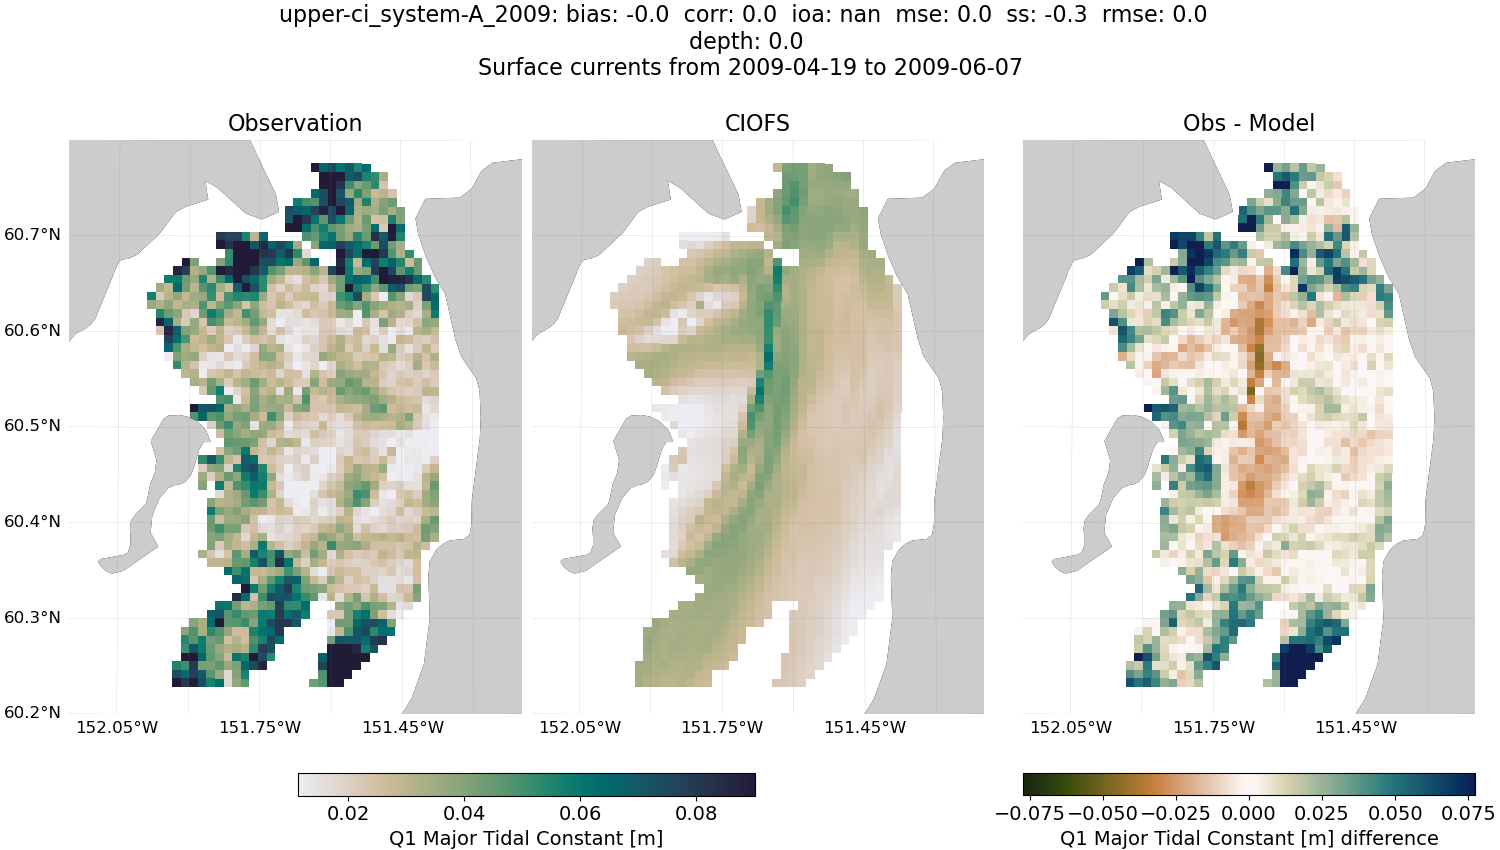
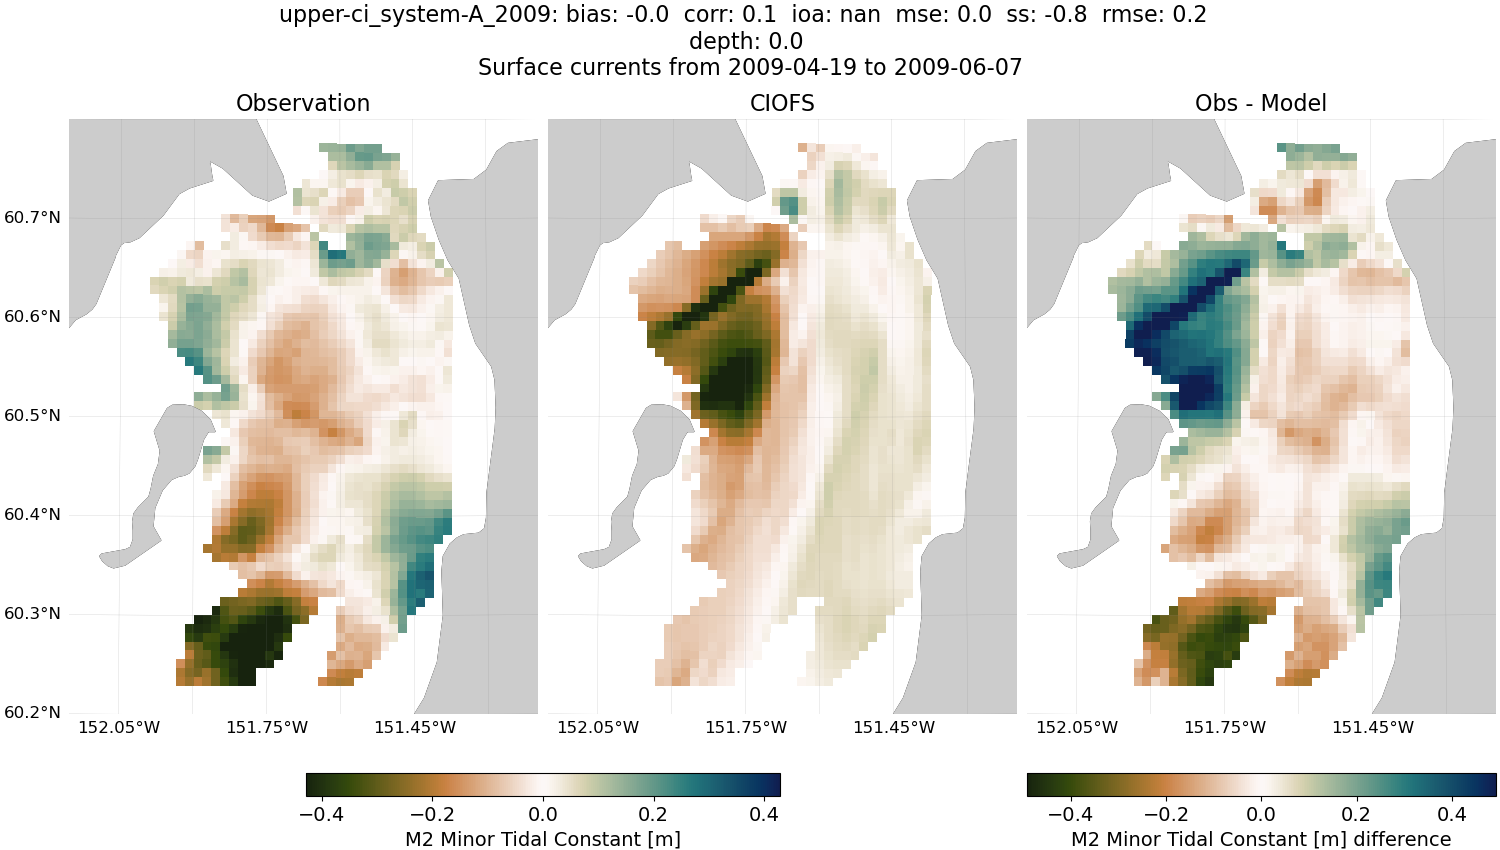
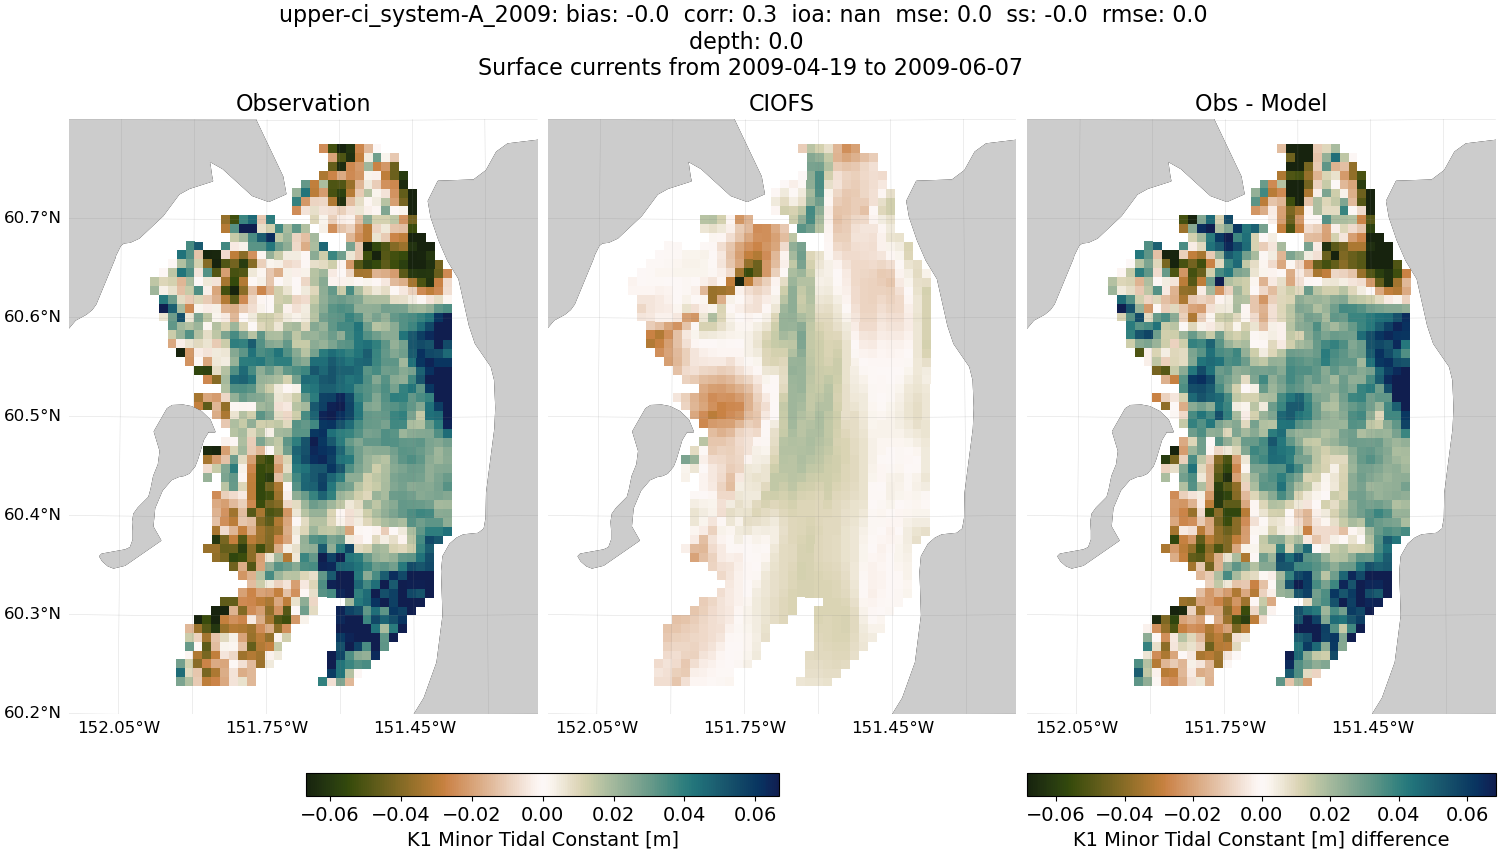
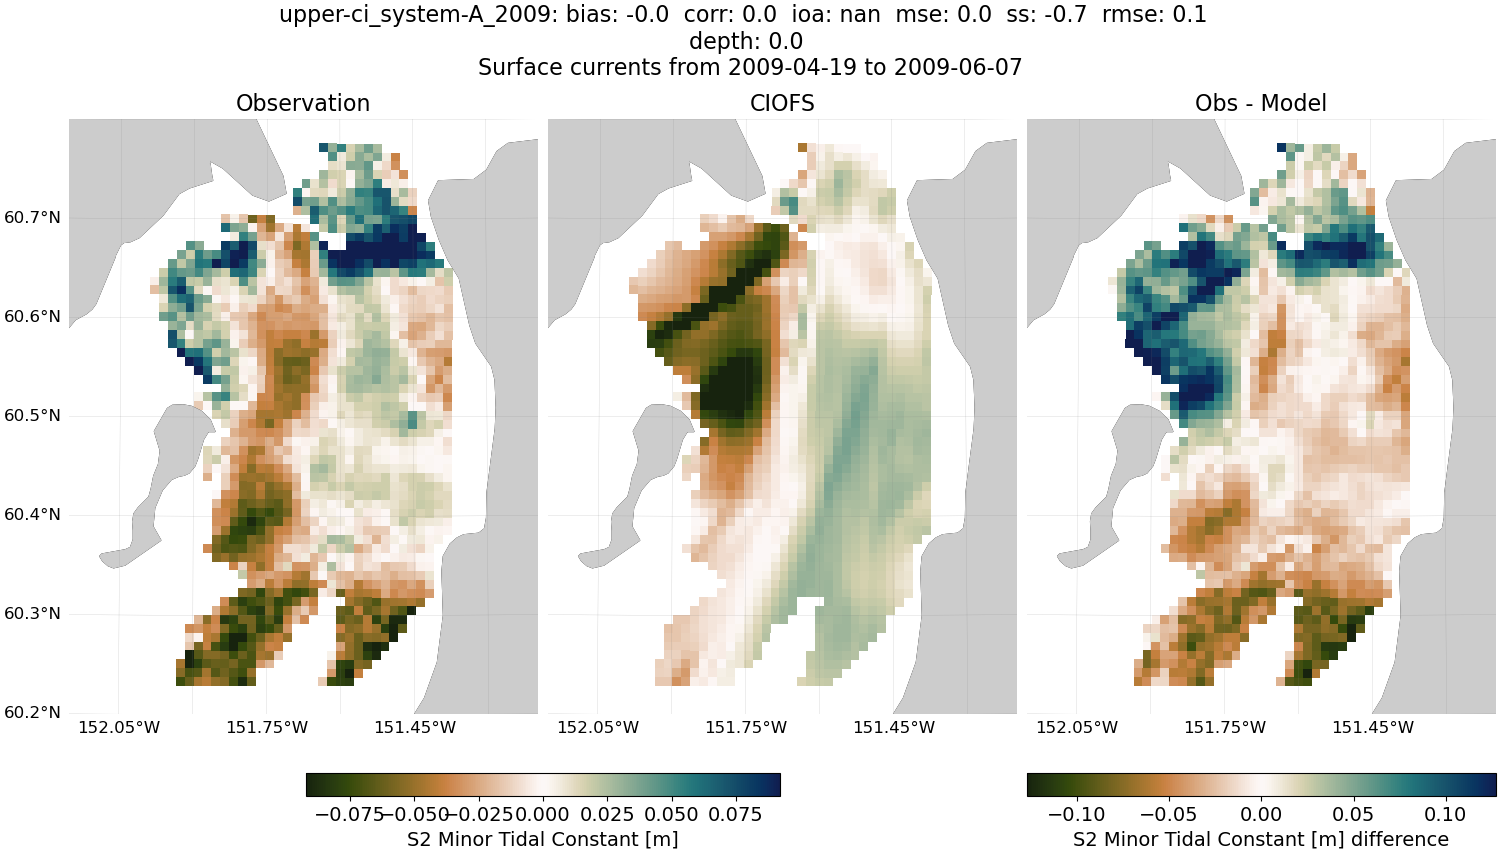
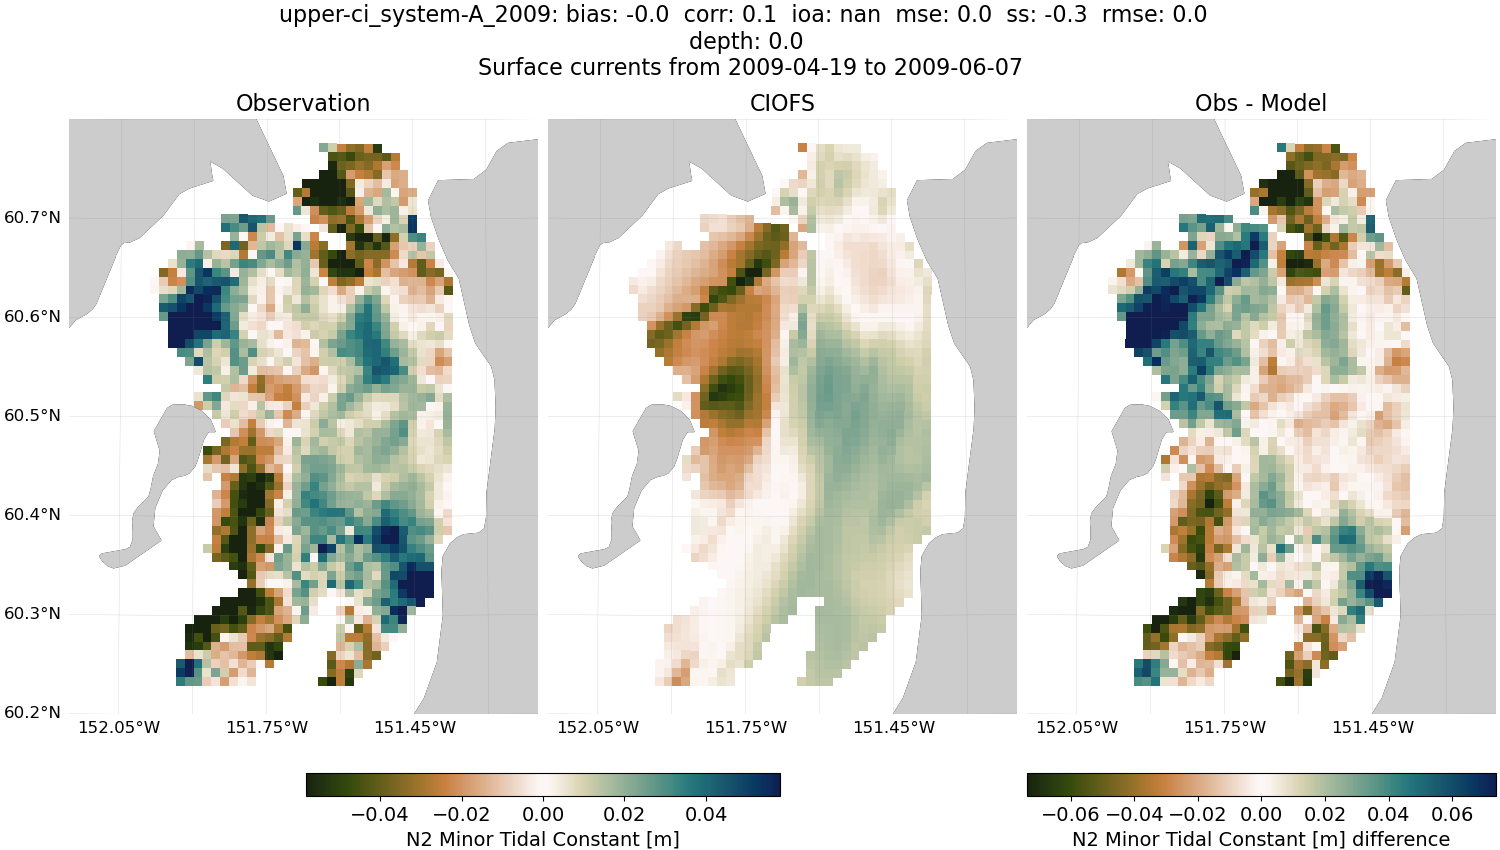
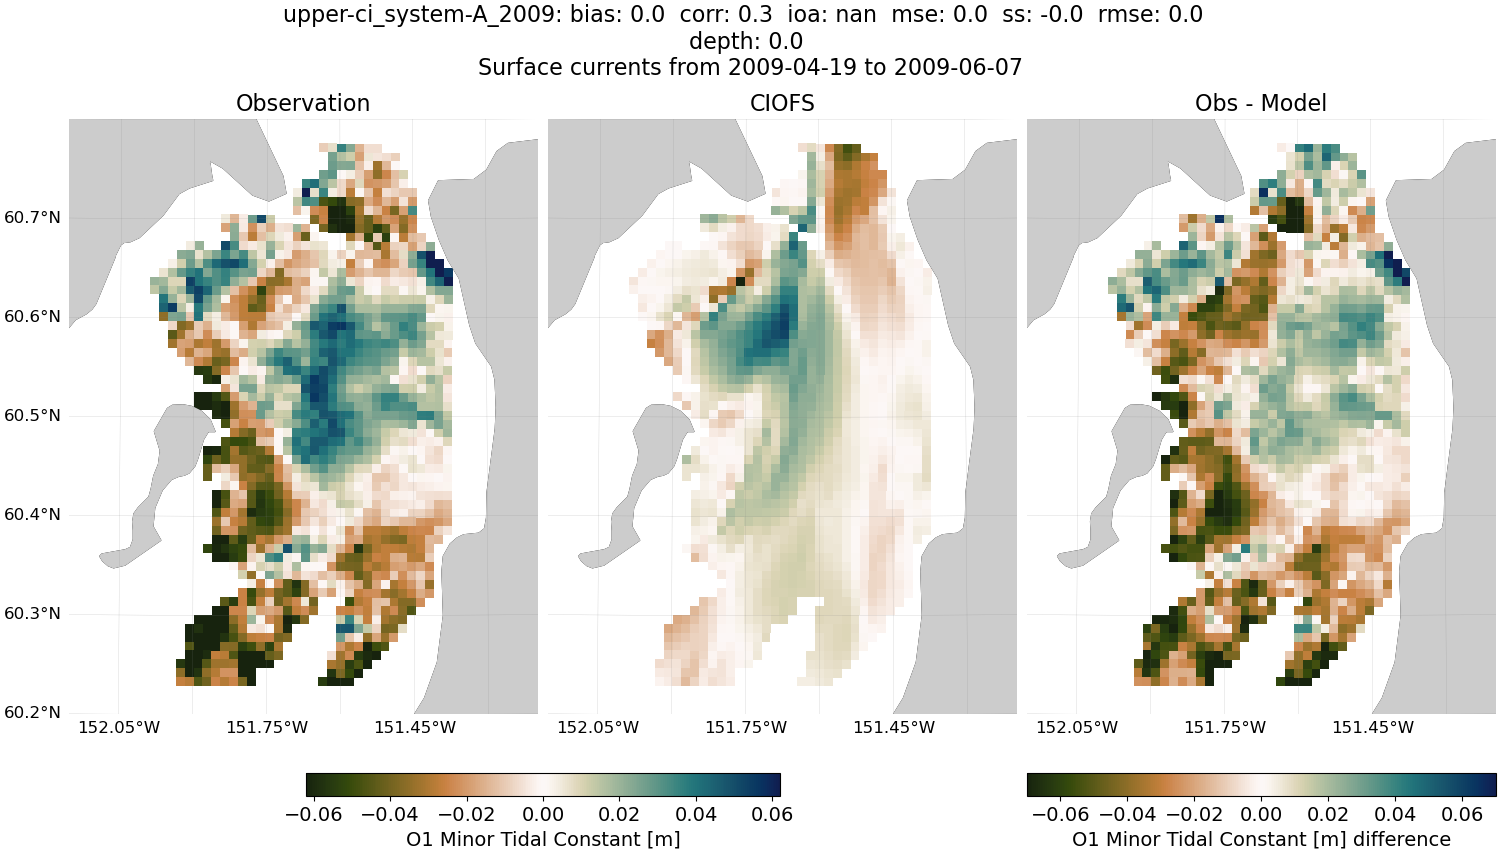
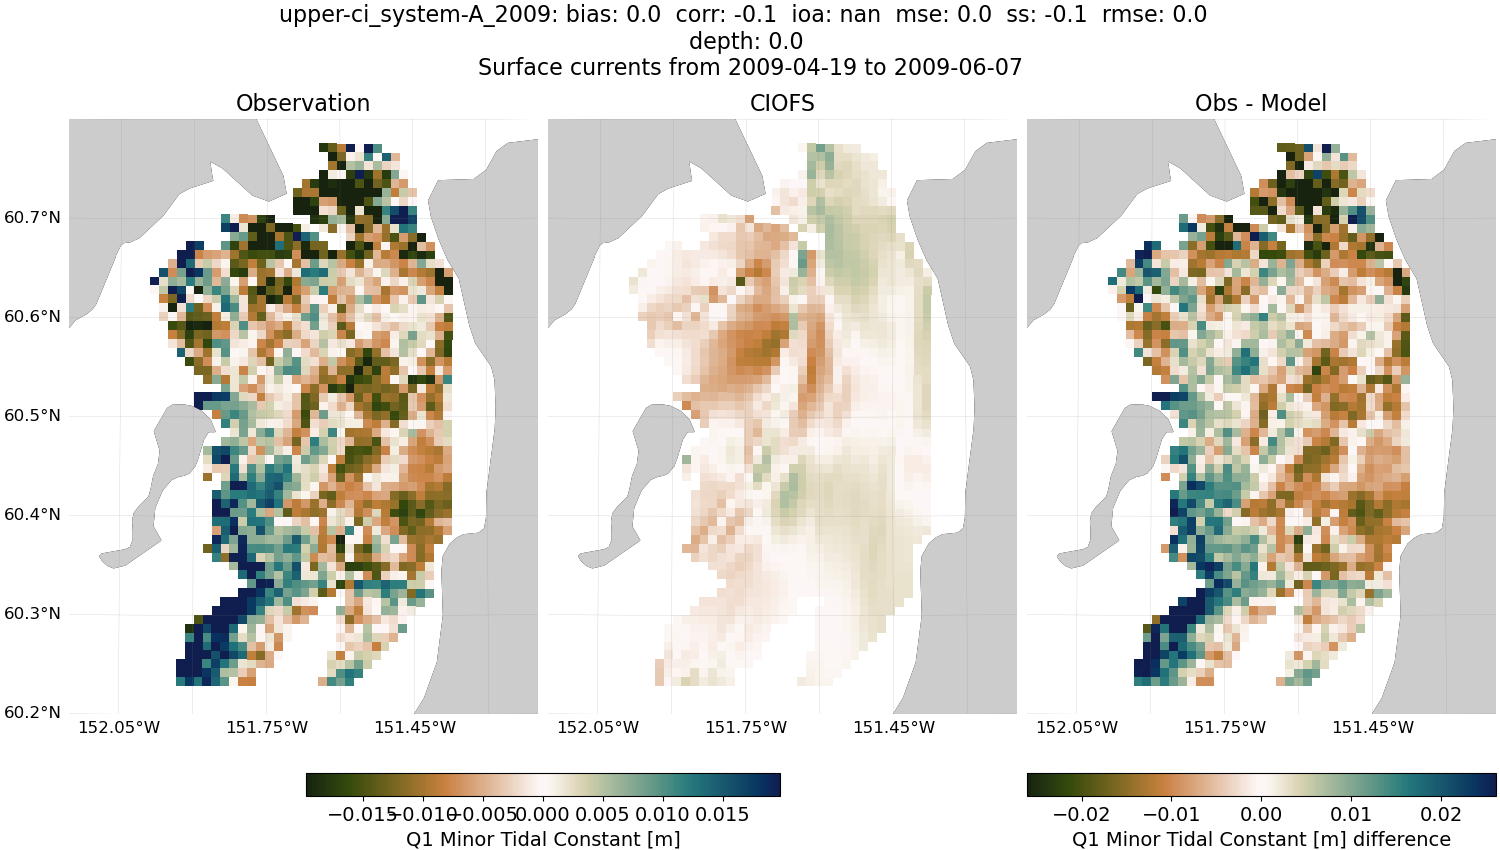
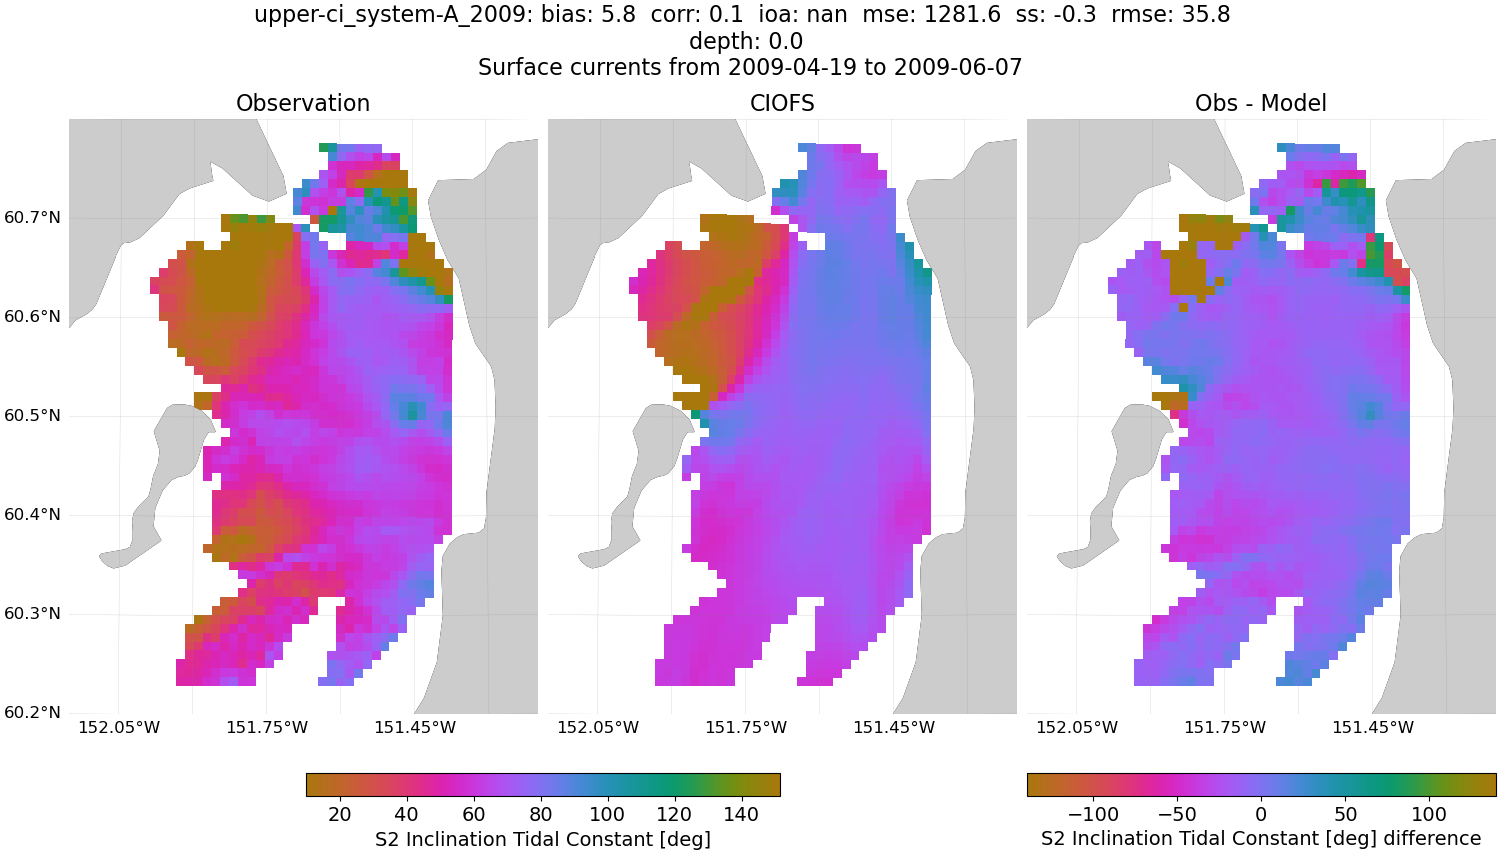
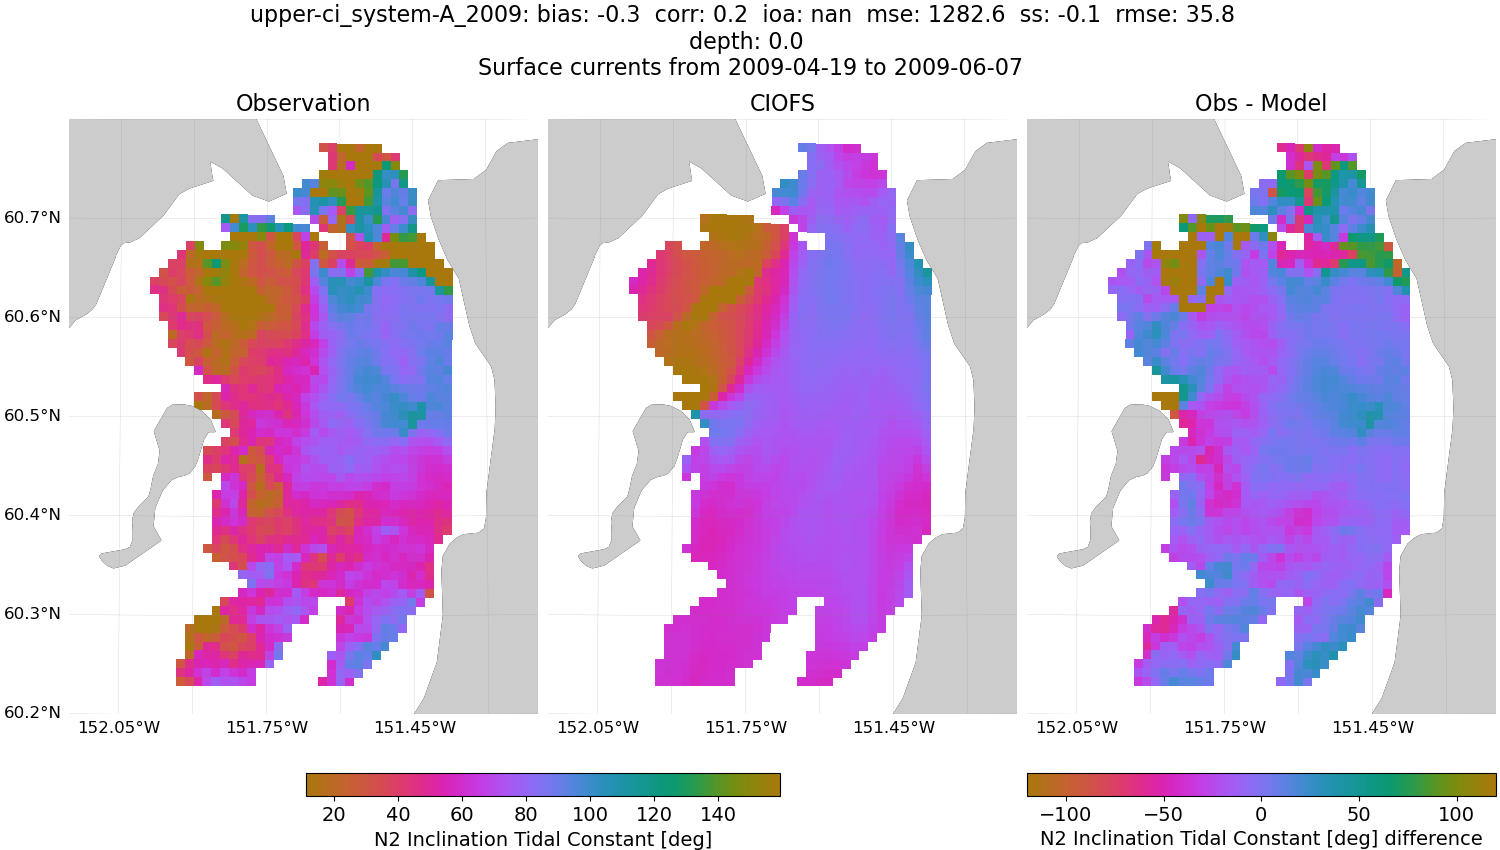
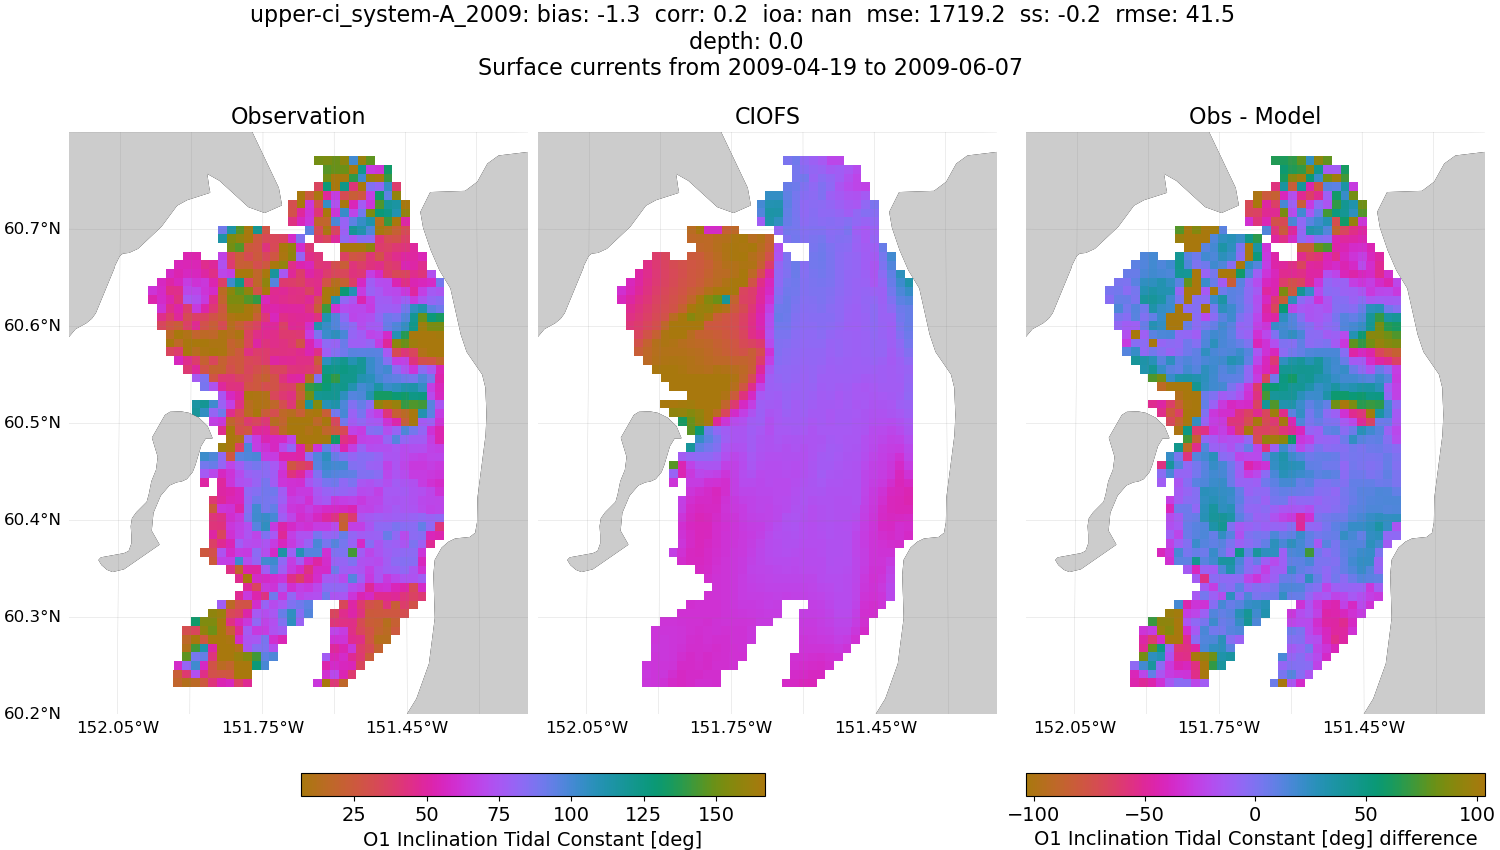
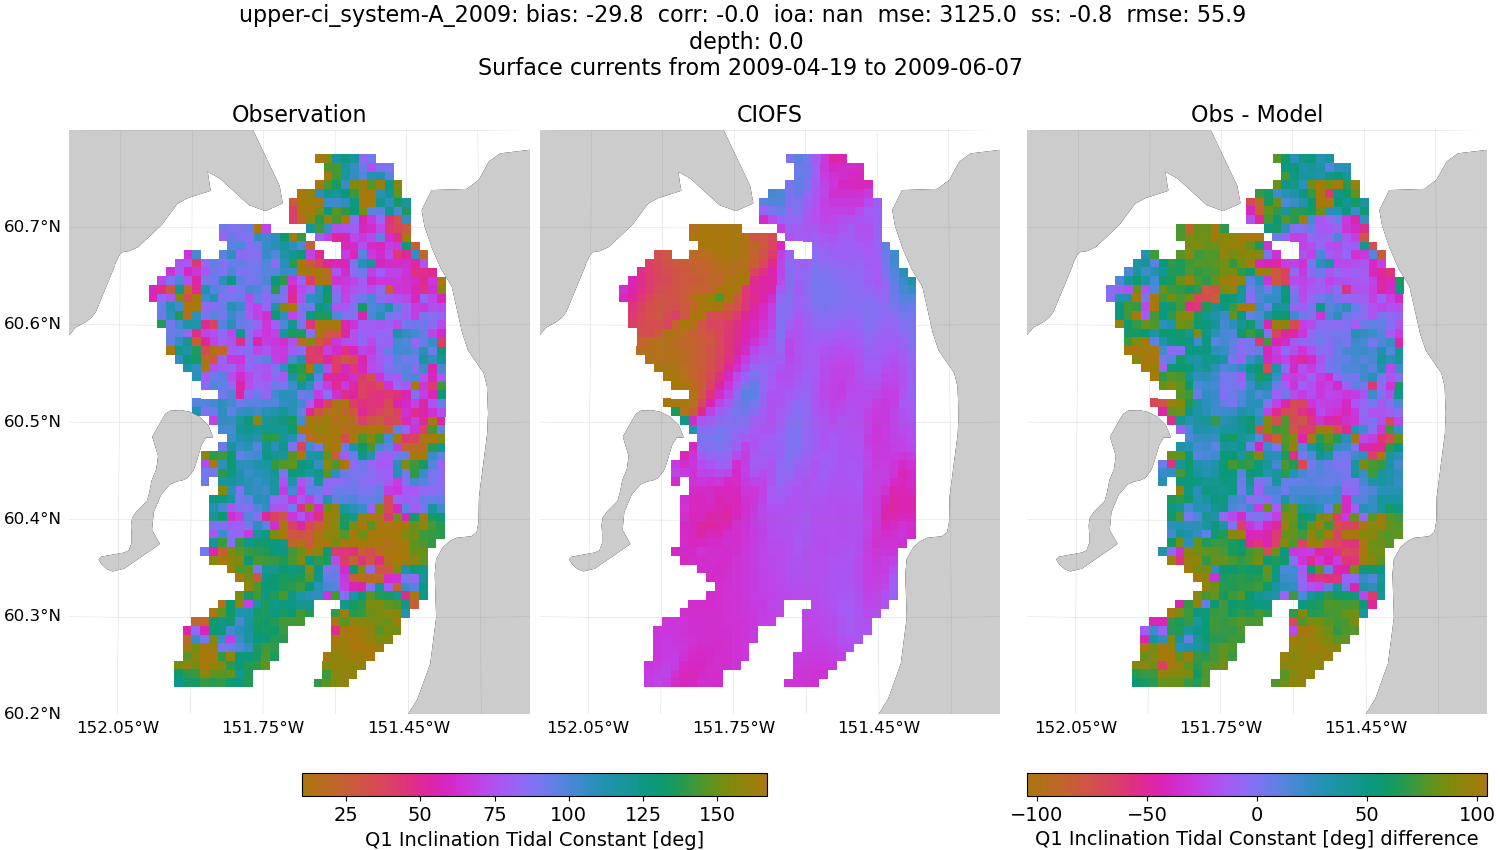
Tidal Constants#
CIOFS
Major Amplitude

Minor Amplitude


Phase


Inclination


NWGOA: Data time range is 2009-04-19 to 2009-06-07 but model ends 2009-01-01.