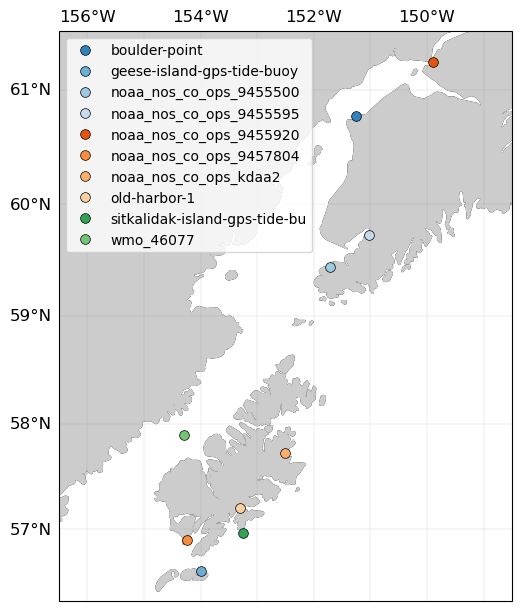
Moorings (NOAA): across Cook Inlet#
moorings_noaa
See the full dataset page for more information: Moorings (NOAA): across Cook Inlet
Map of Moorings#
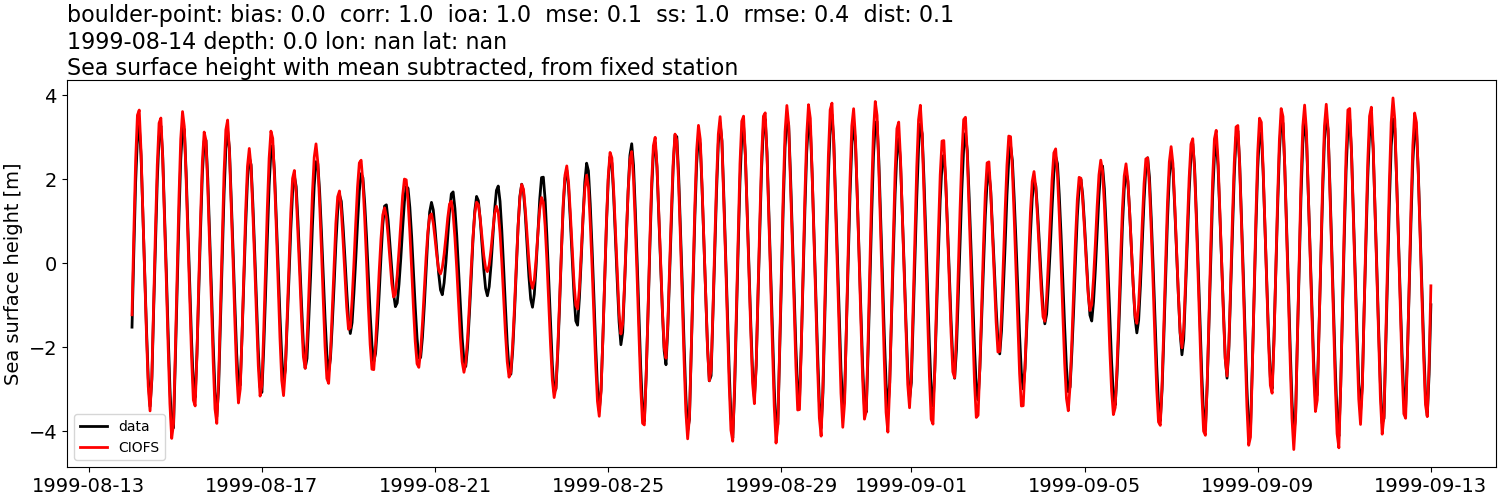
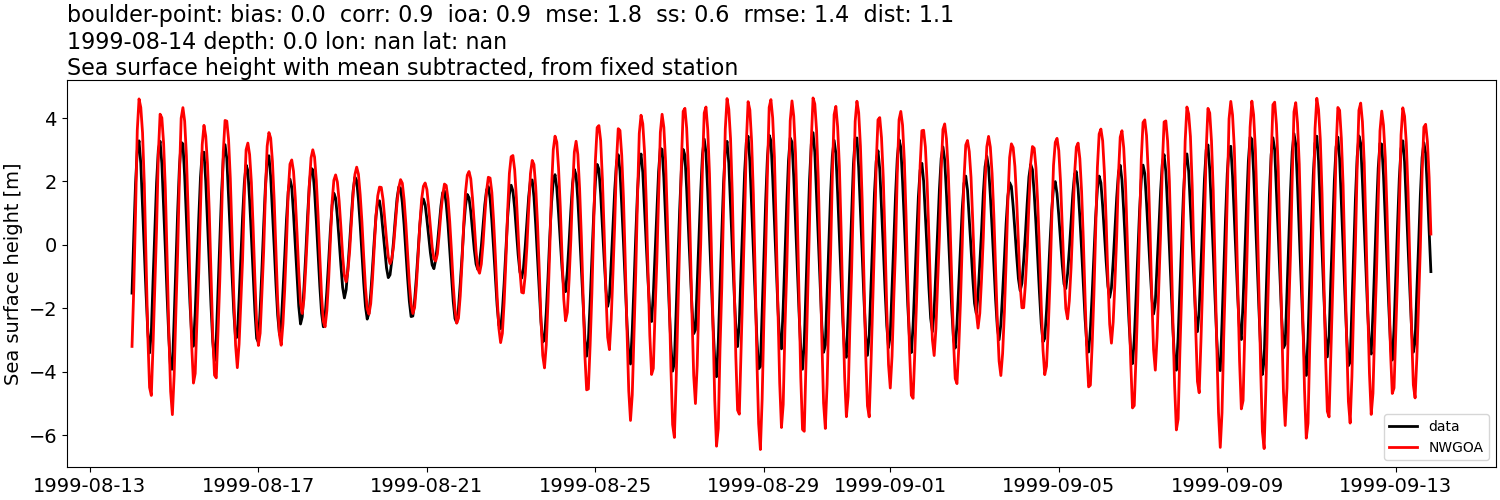
boulder-point#
Sea surface height: mean subtracted#
CIOFS#
NWGOA#
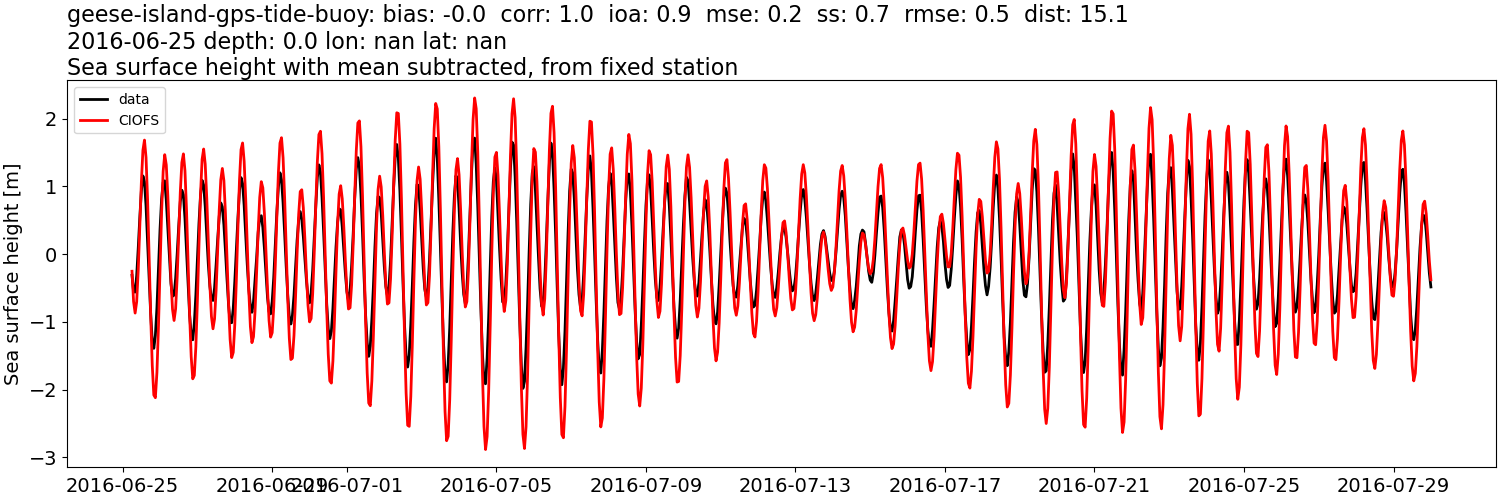
geese-island-gps-tide-buoy#
NWGOA: Data time range is 2016-06-25 to 2016-07-30 but model ends 2009-01-01.
Sea surface height: mean subtracted#
CIOFS#
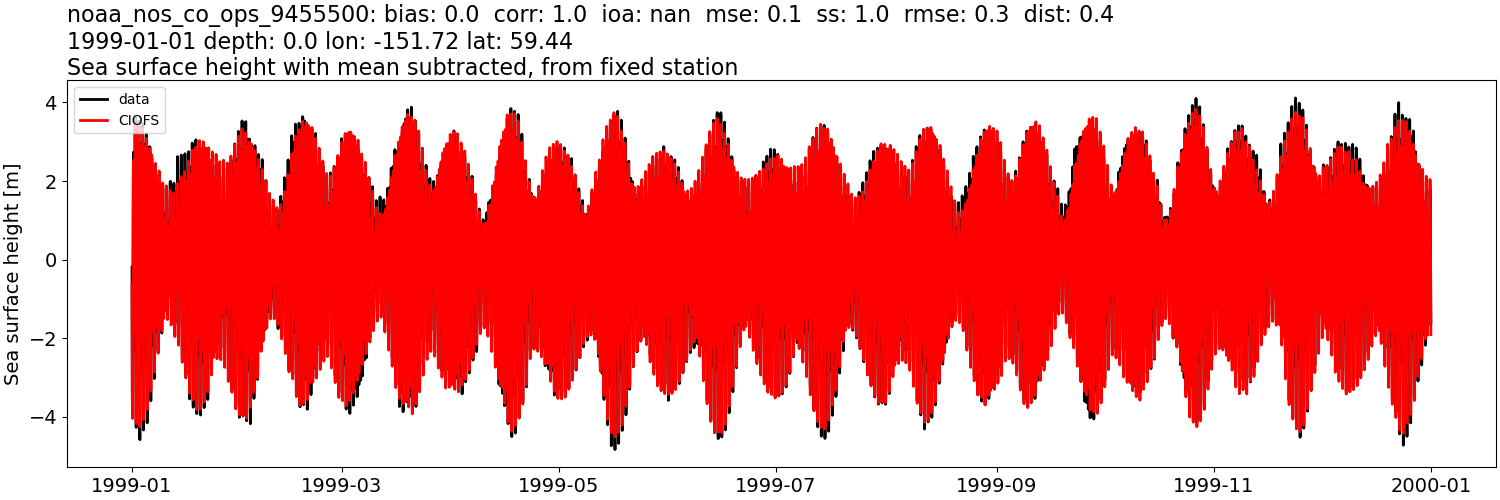
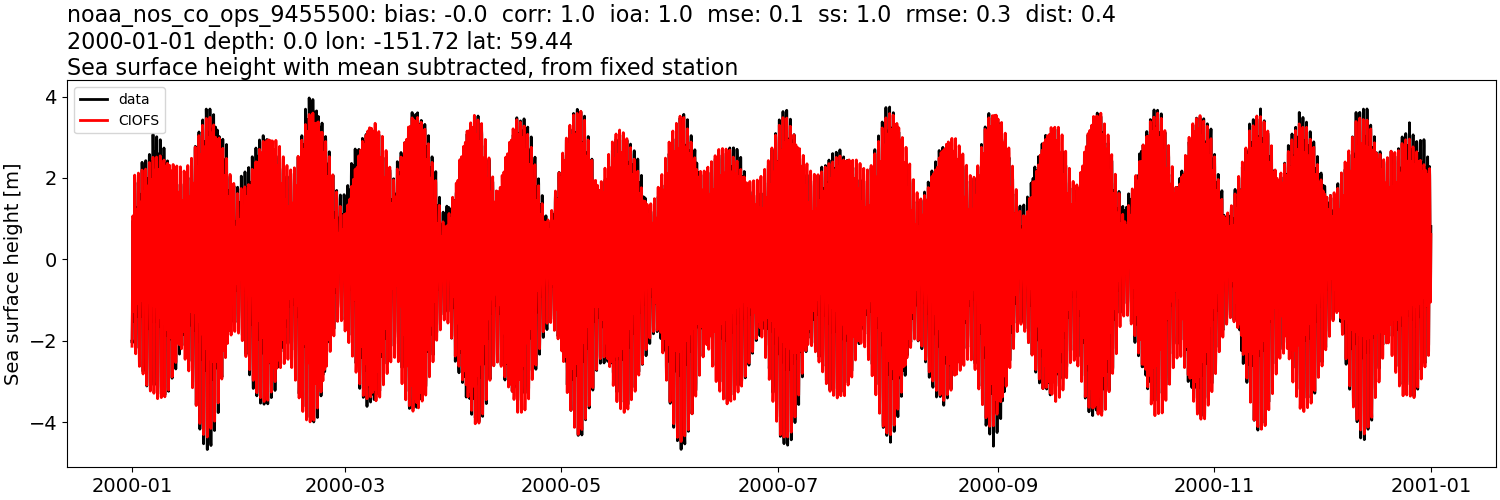
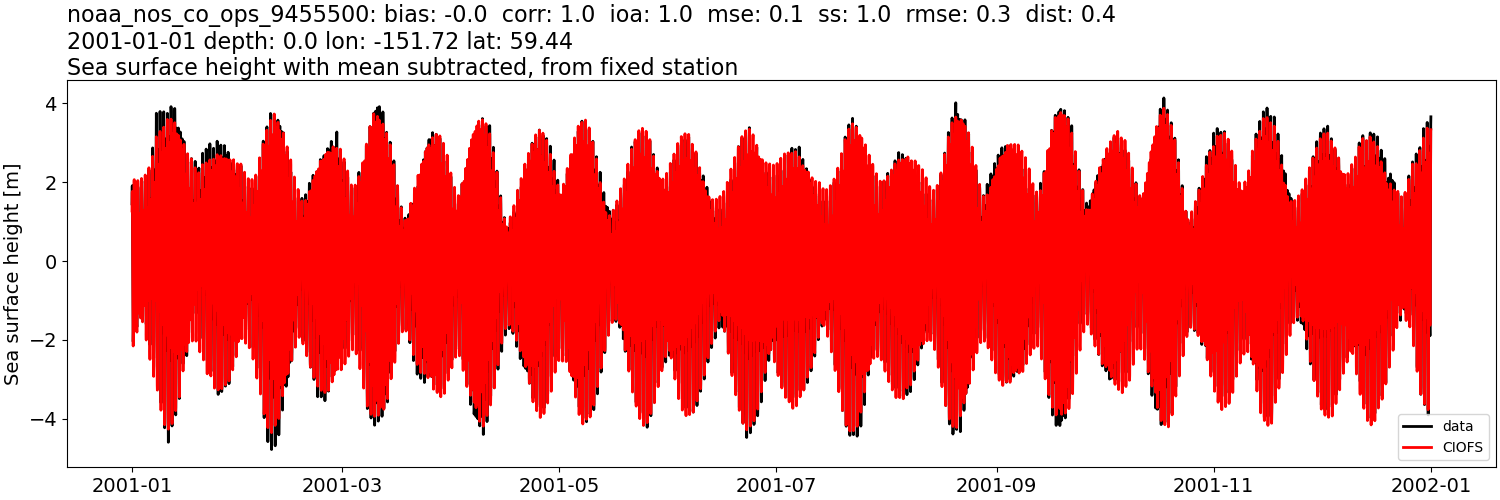
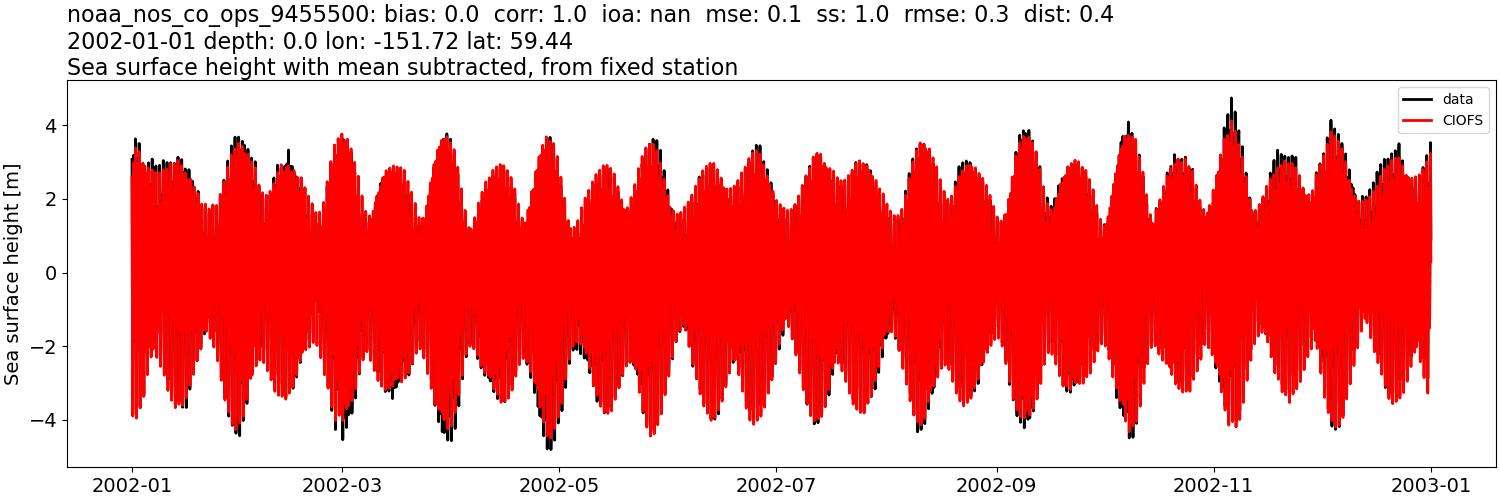
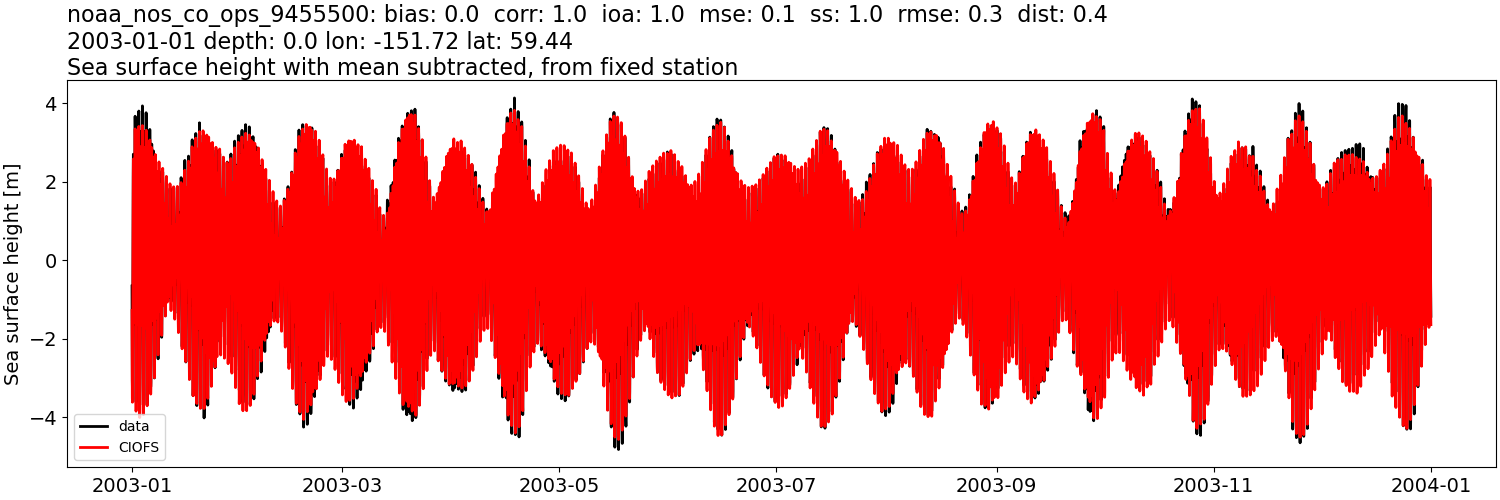
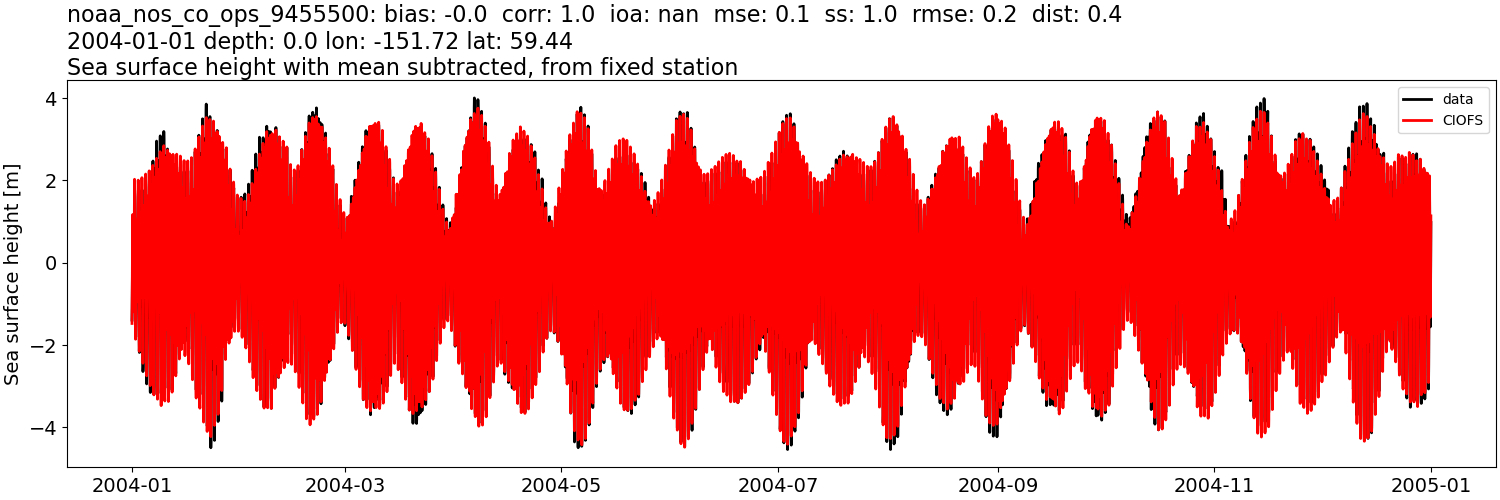
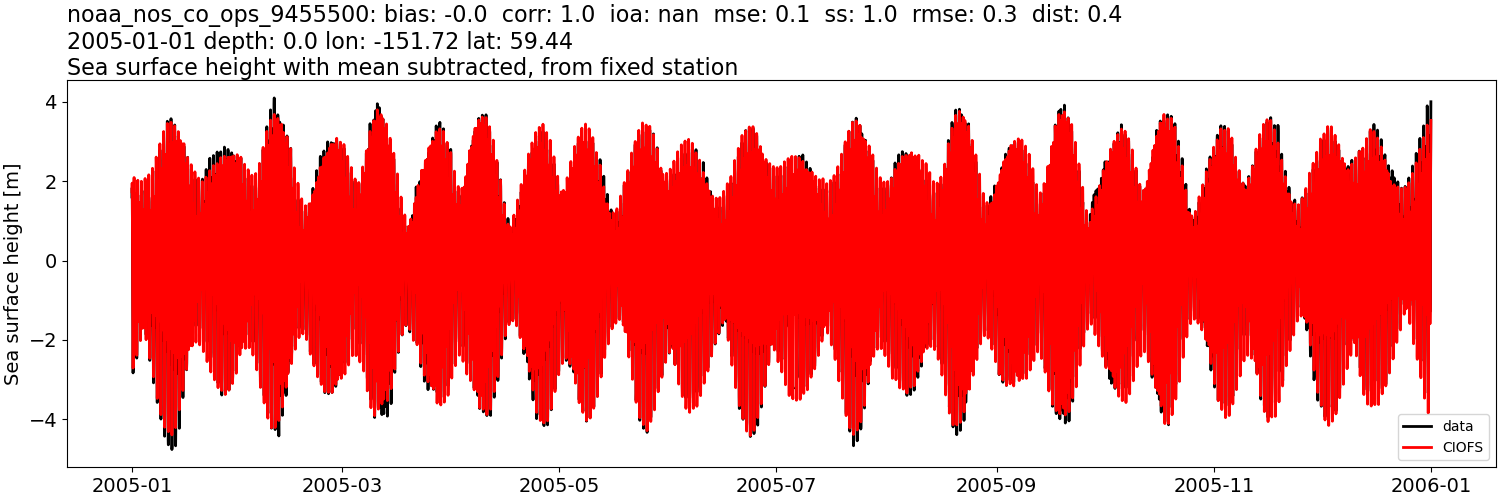
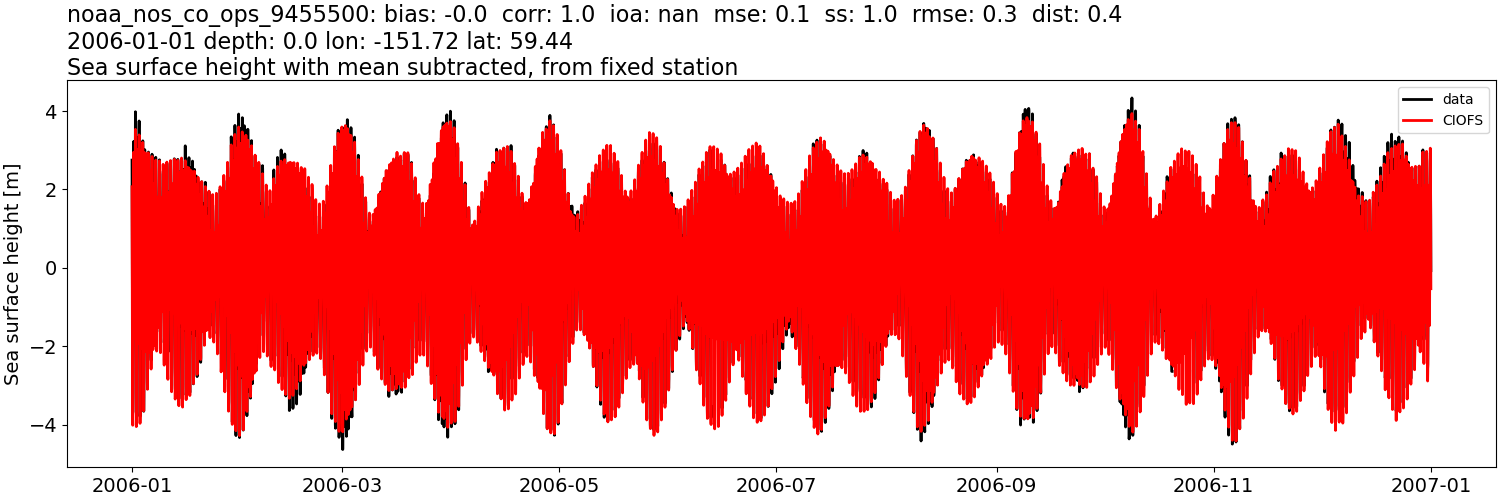
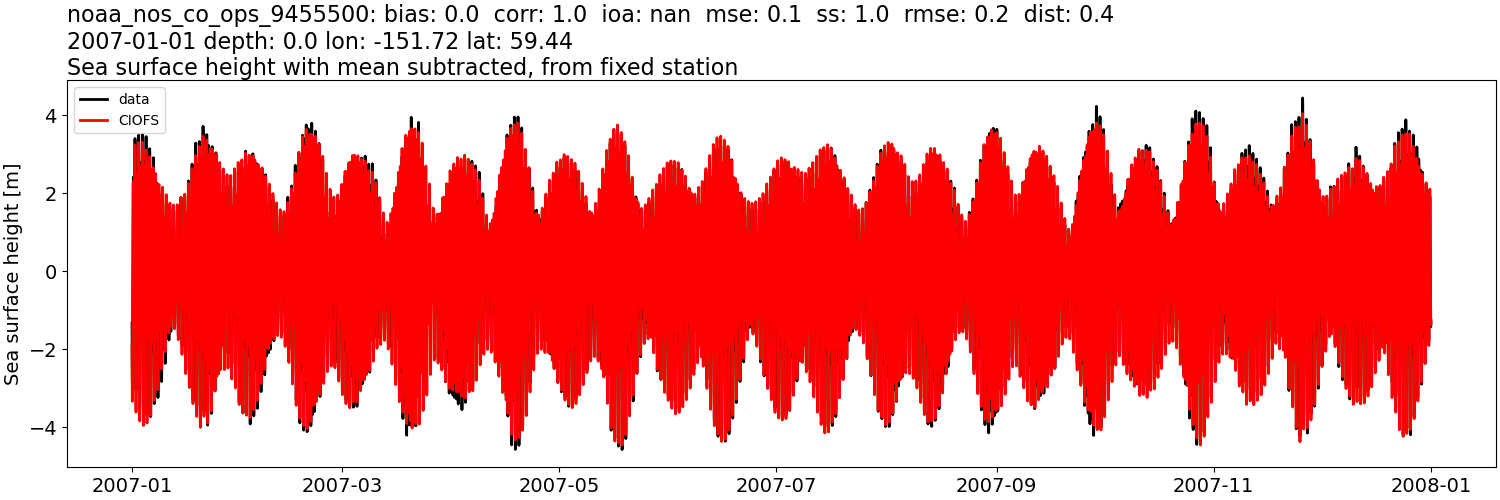
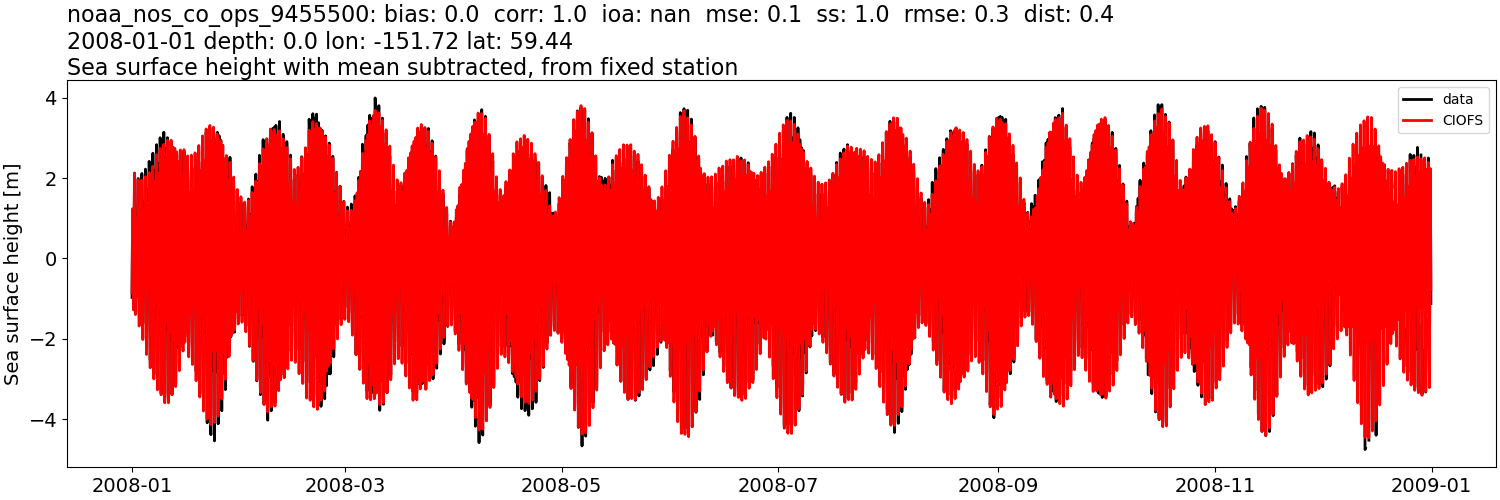
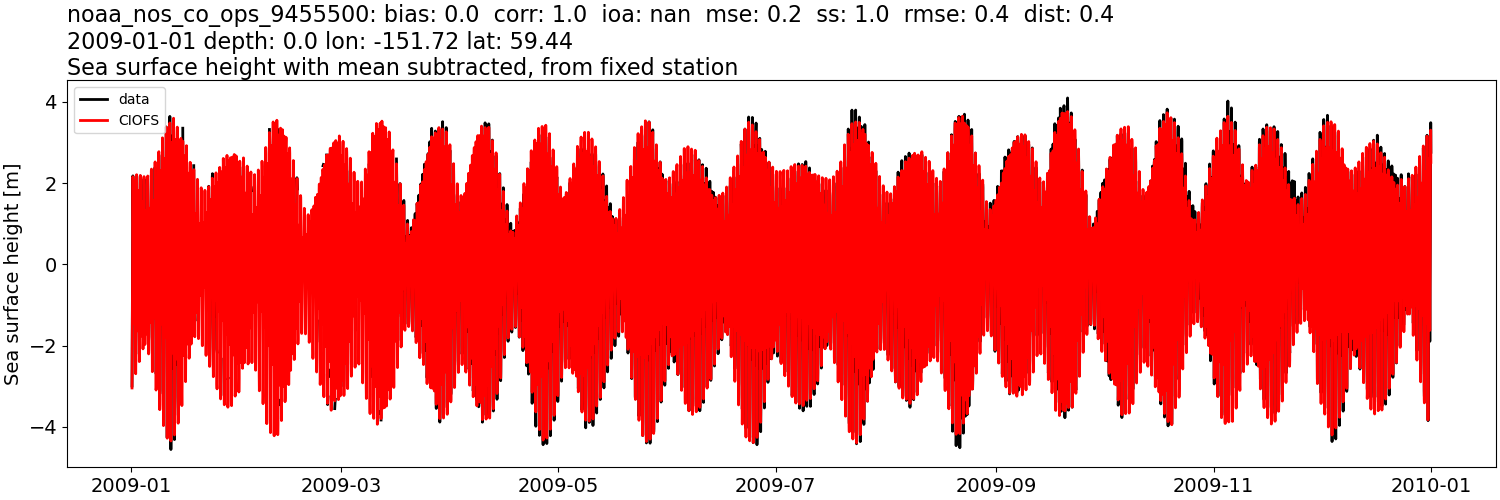
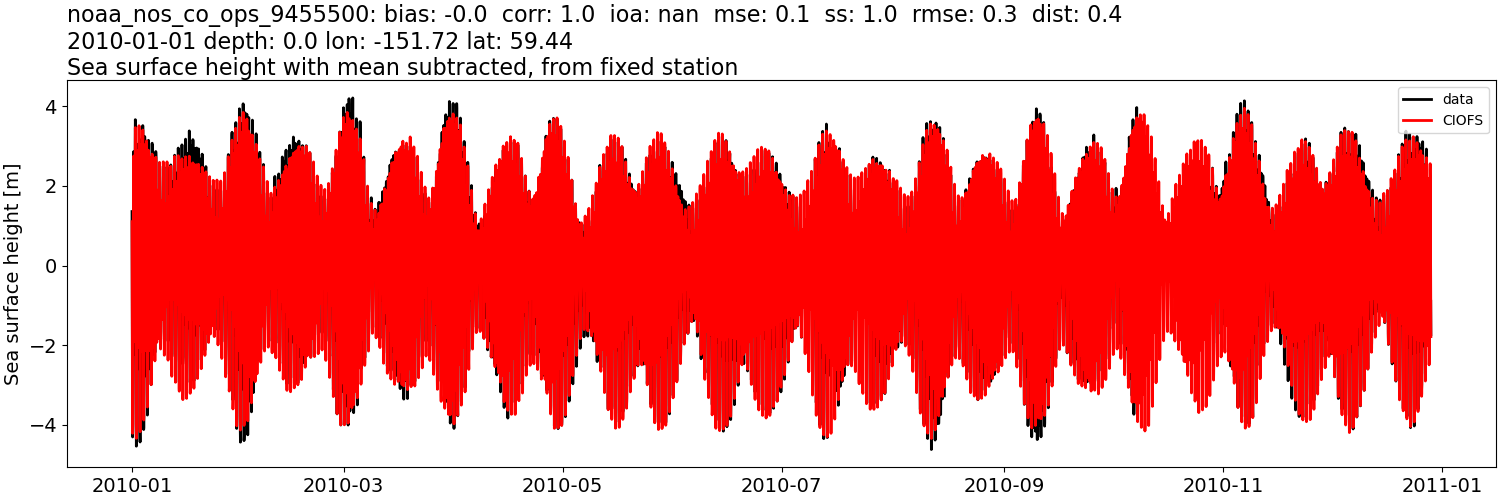
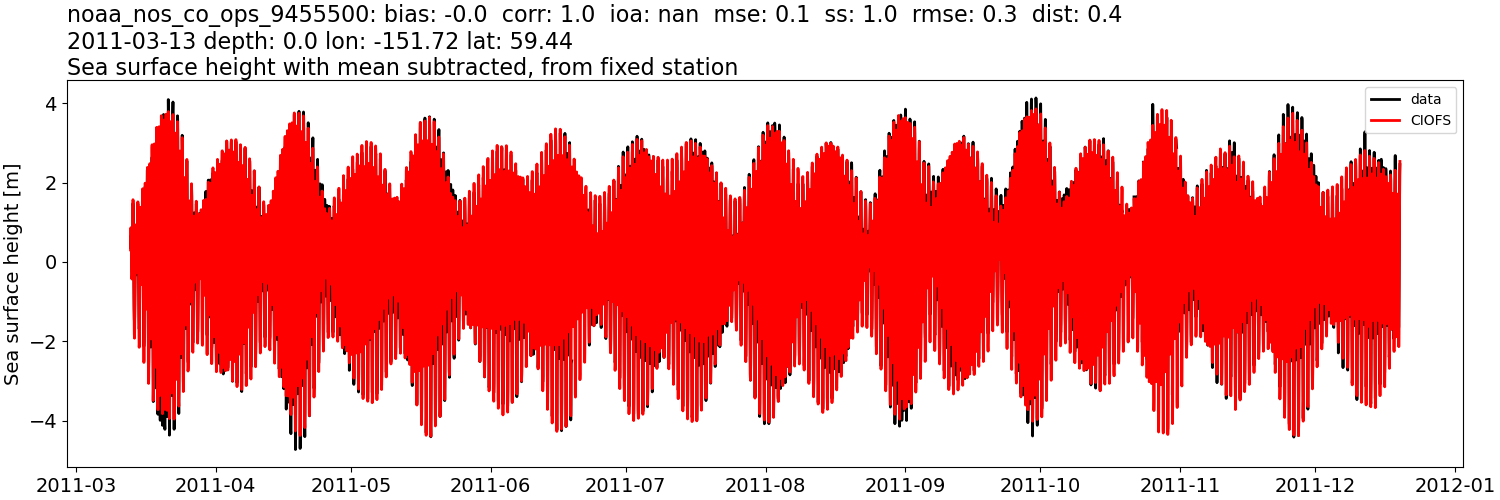
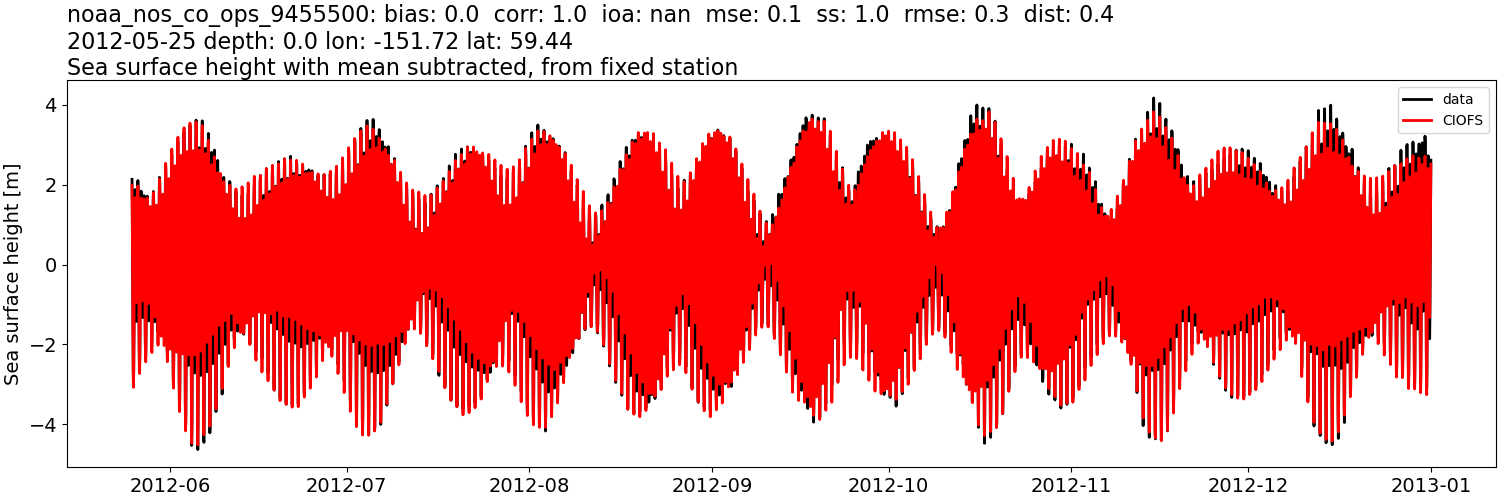
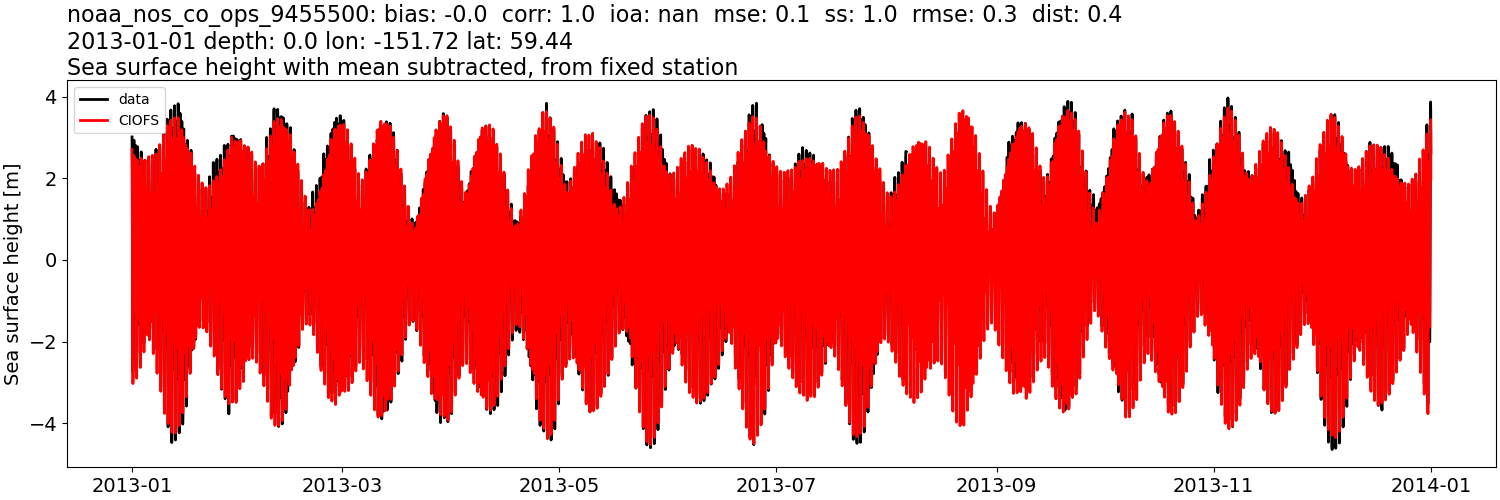
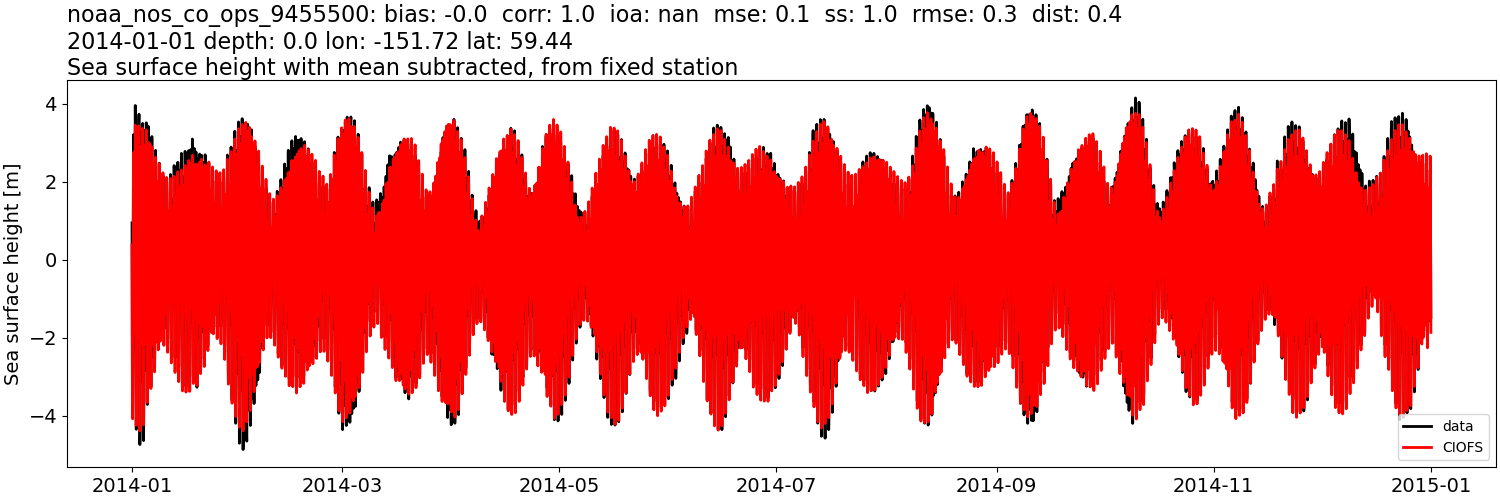
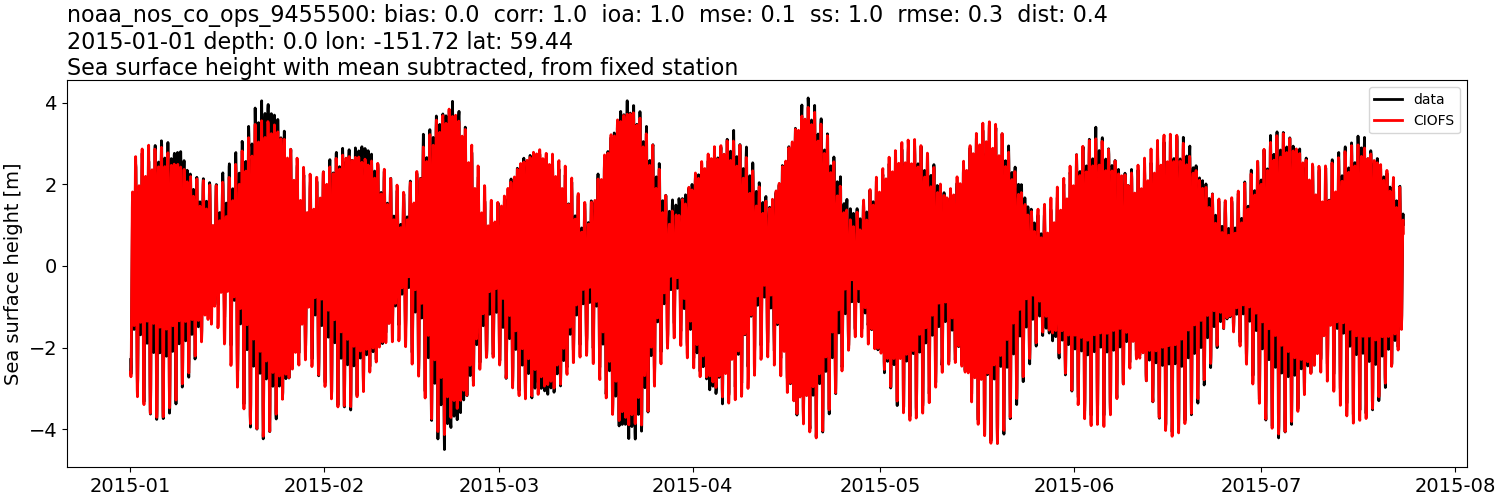
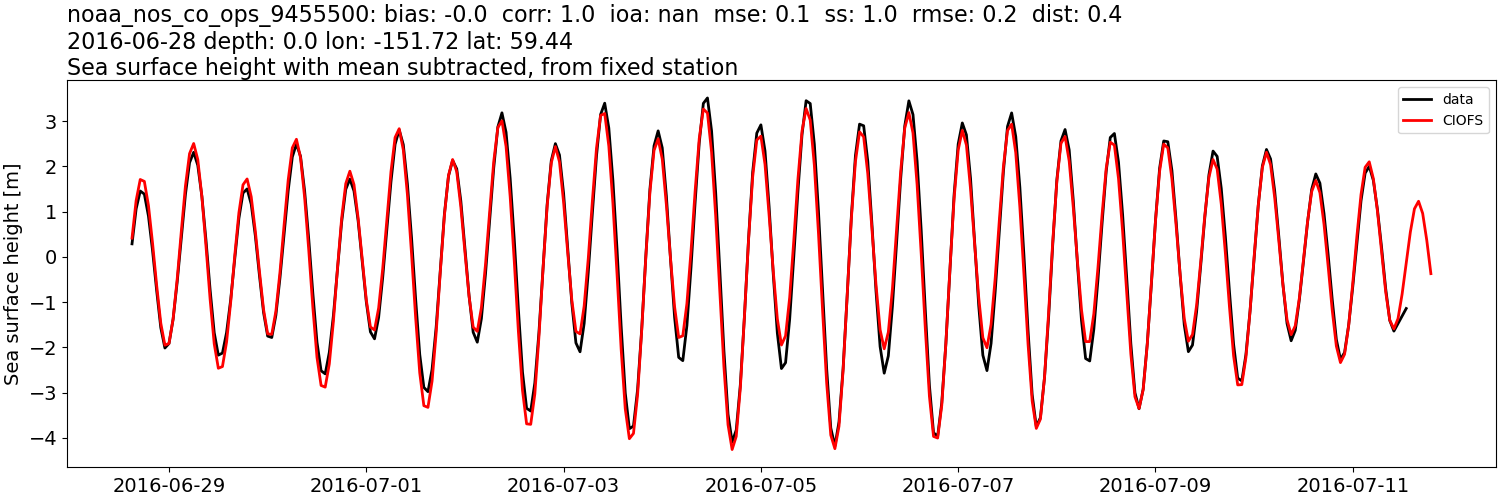
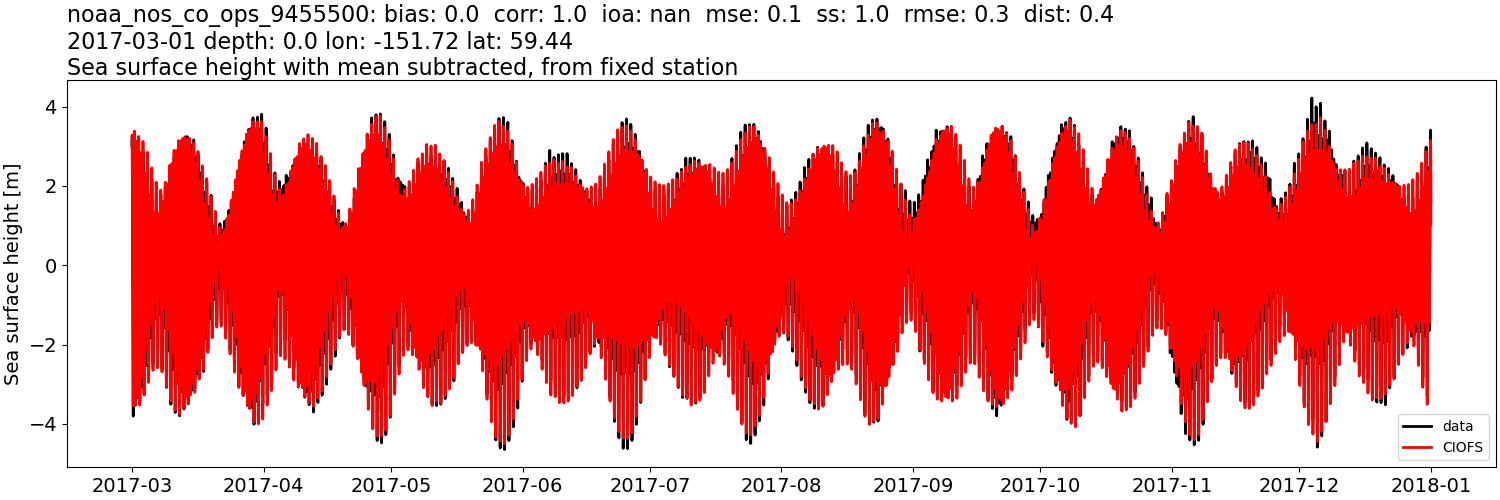
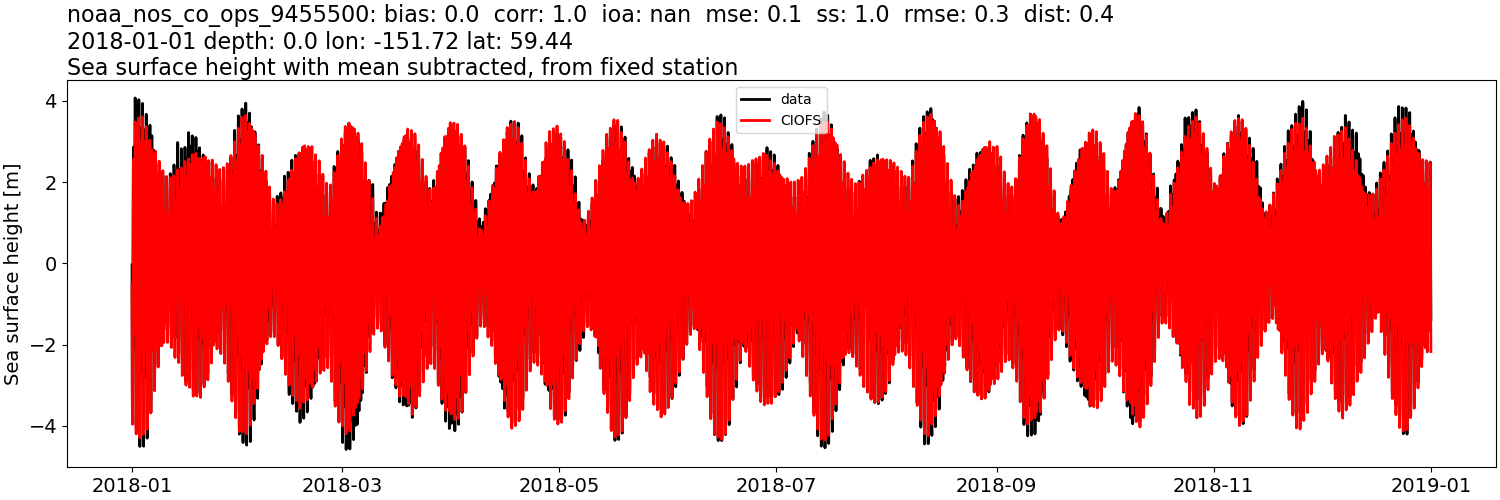
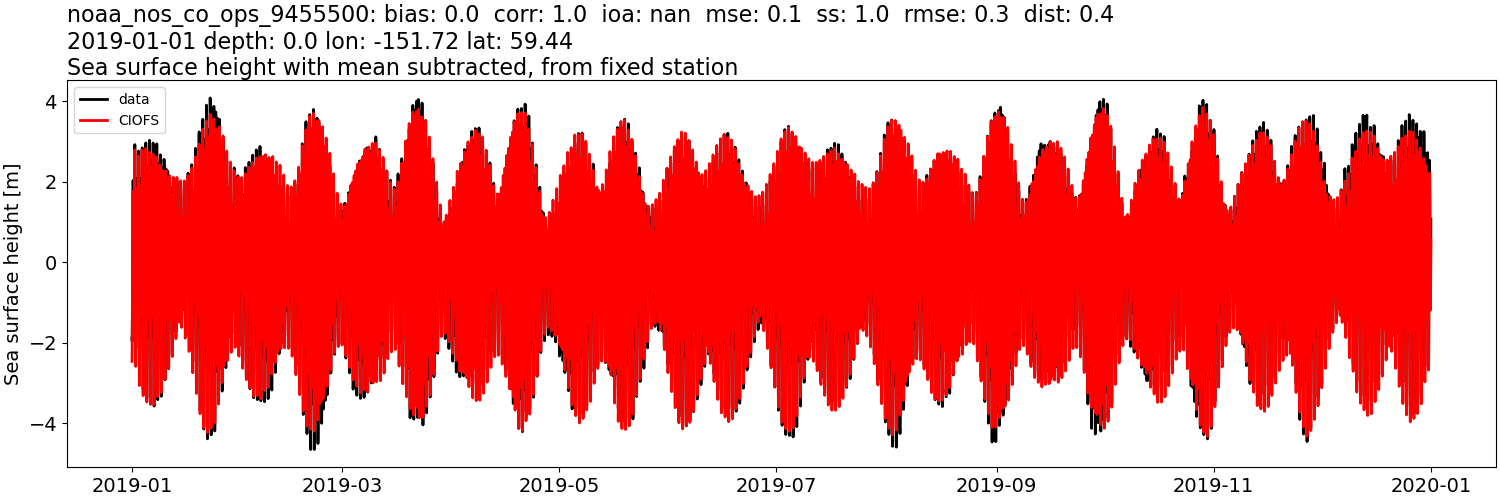
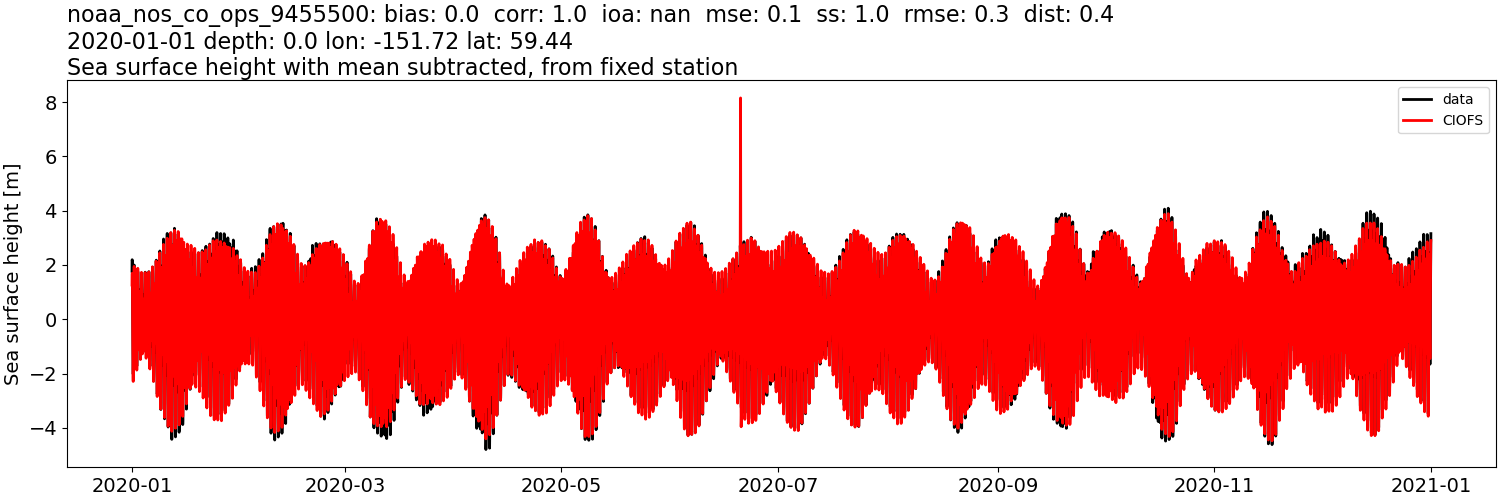
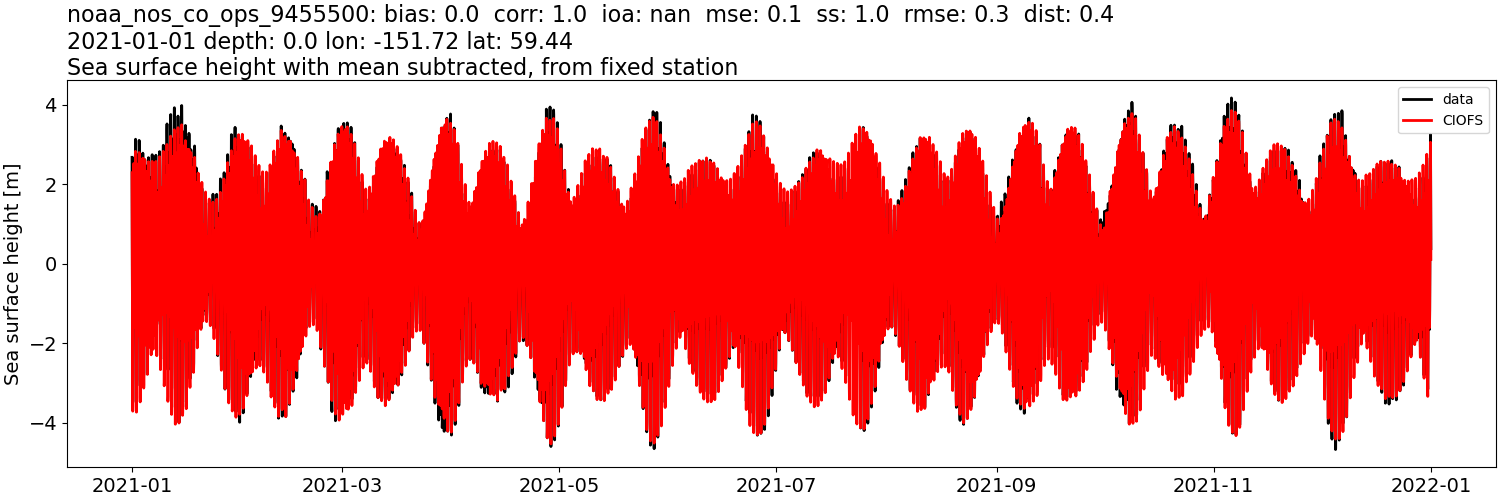
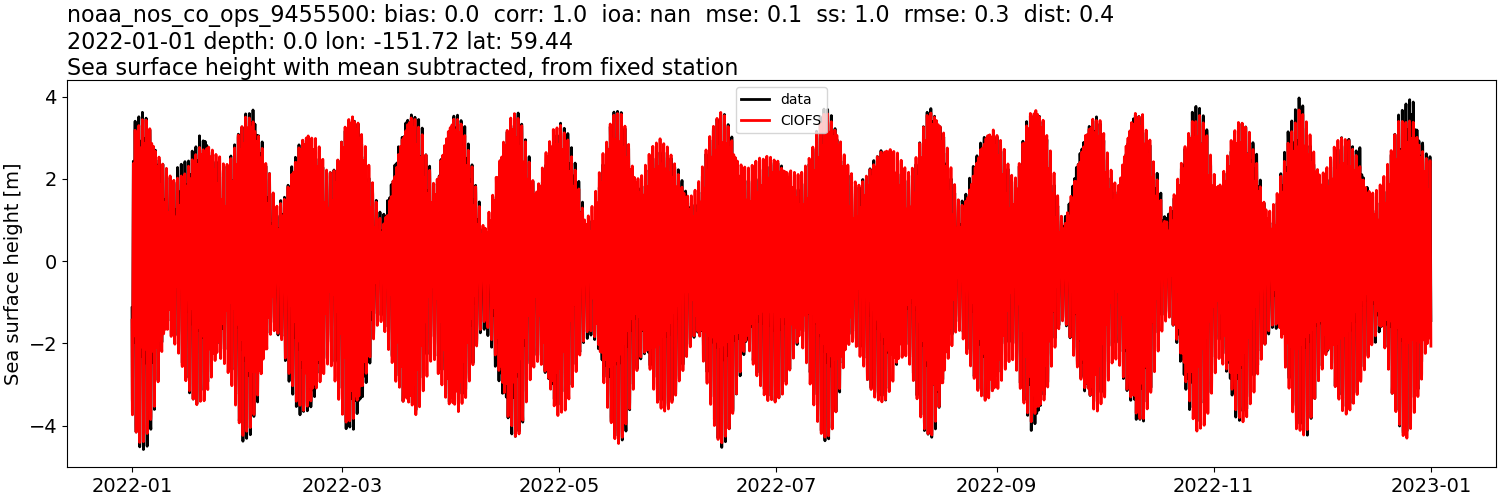
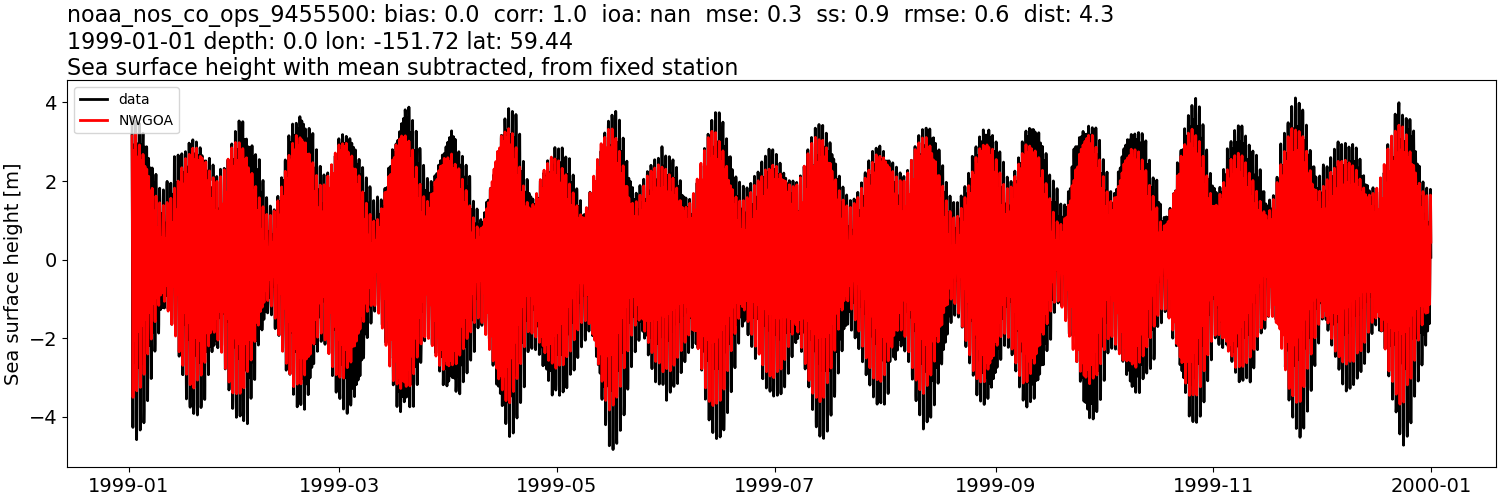
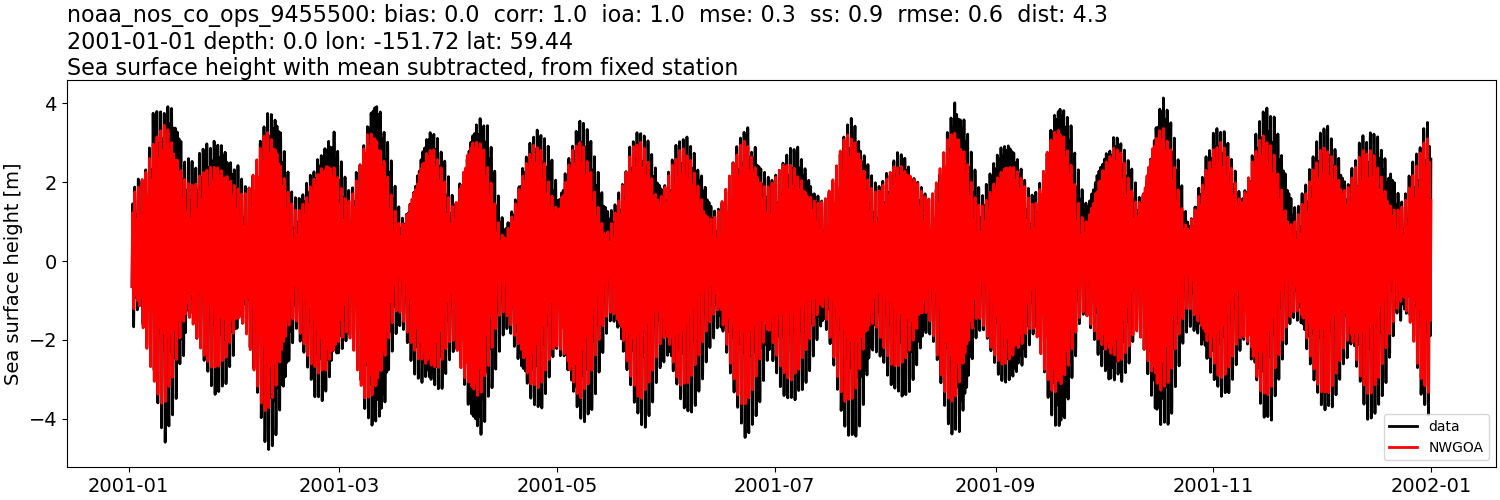
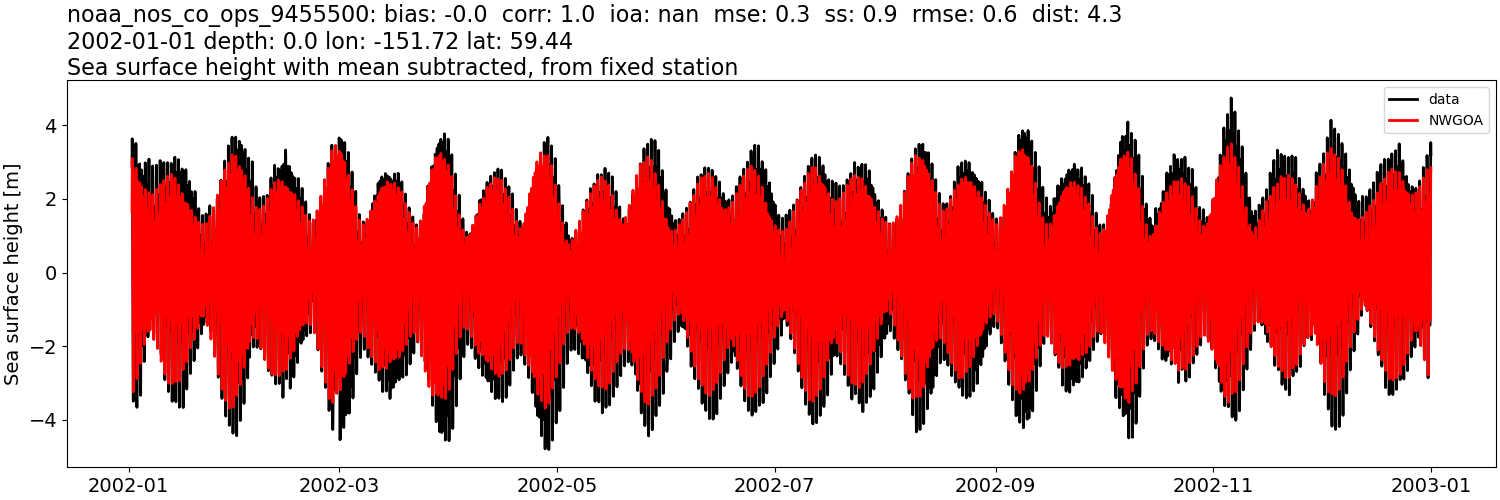
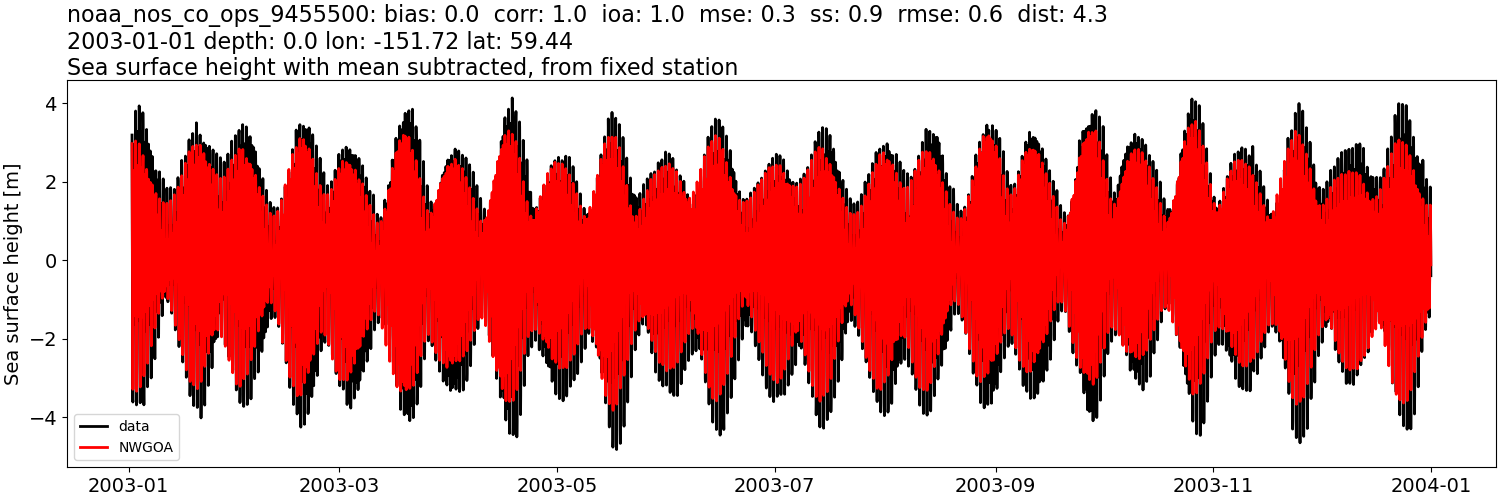
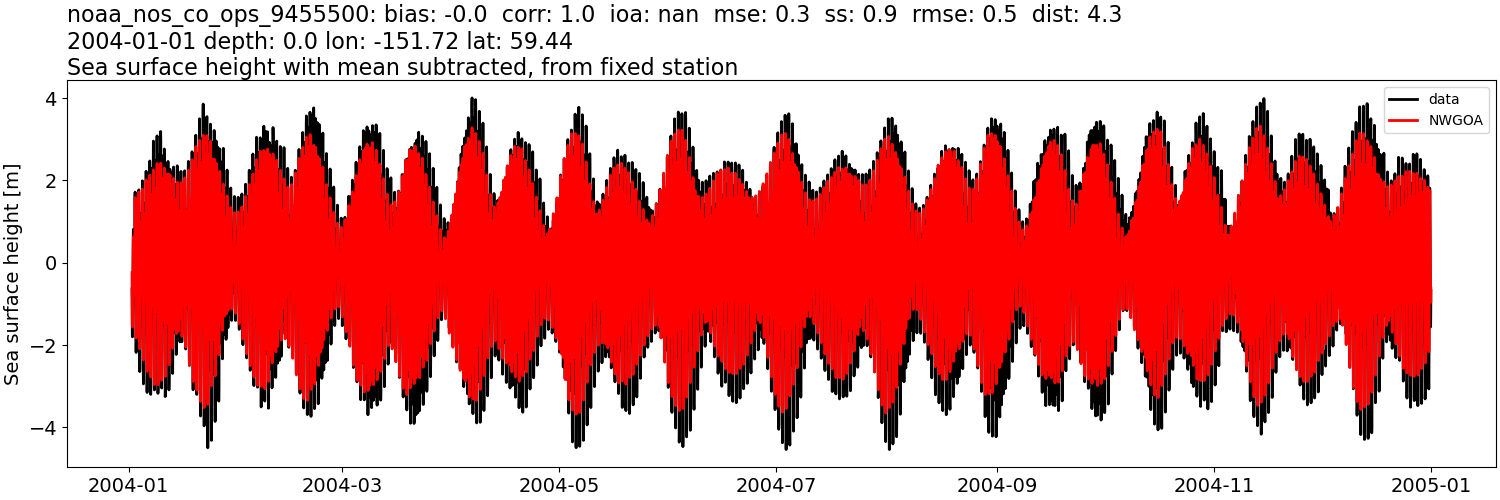
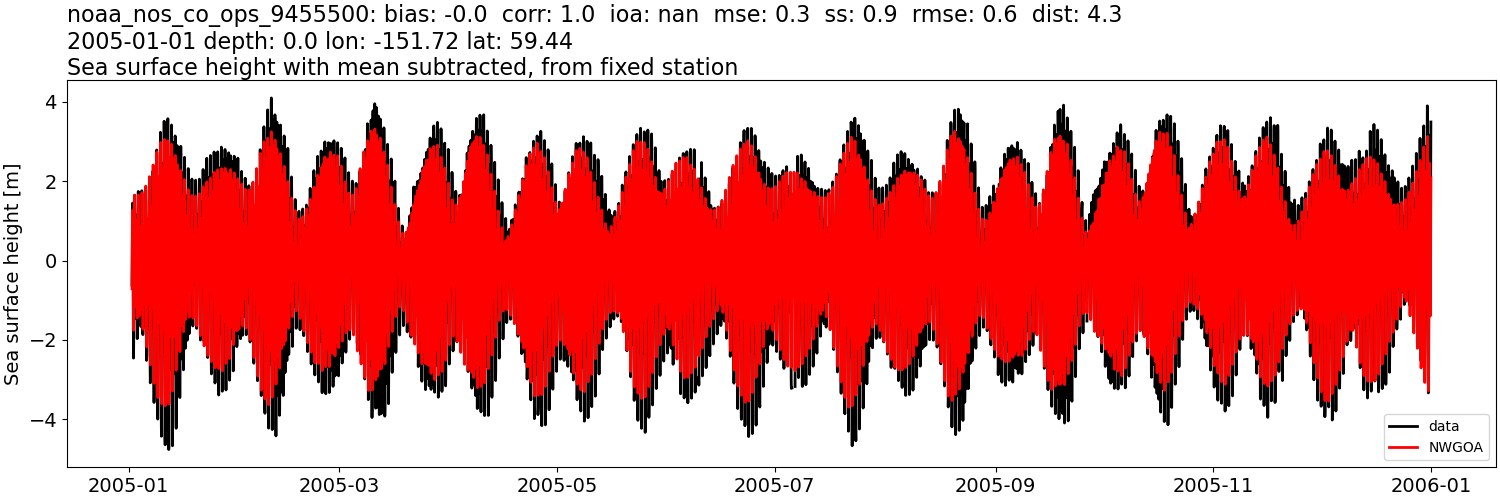
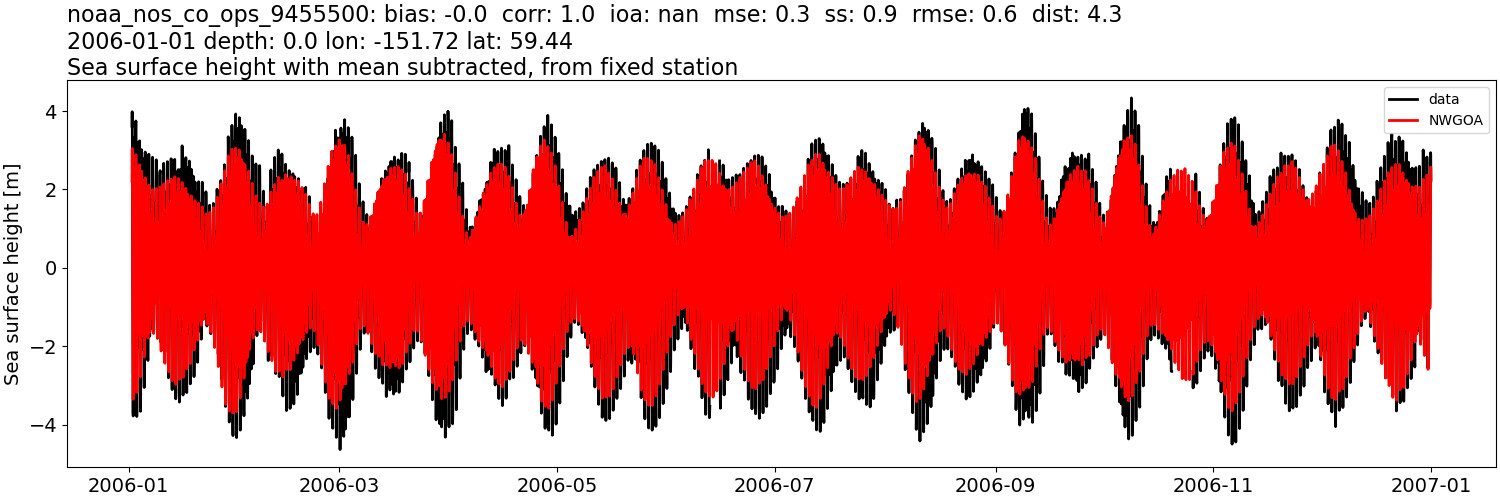
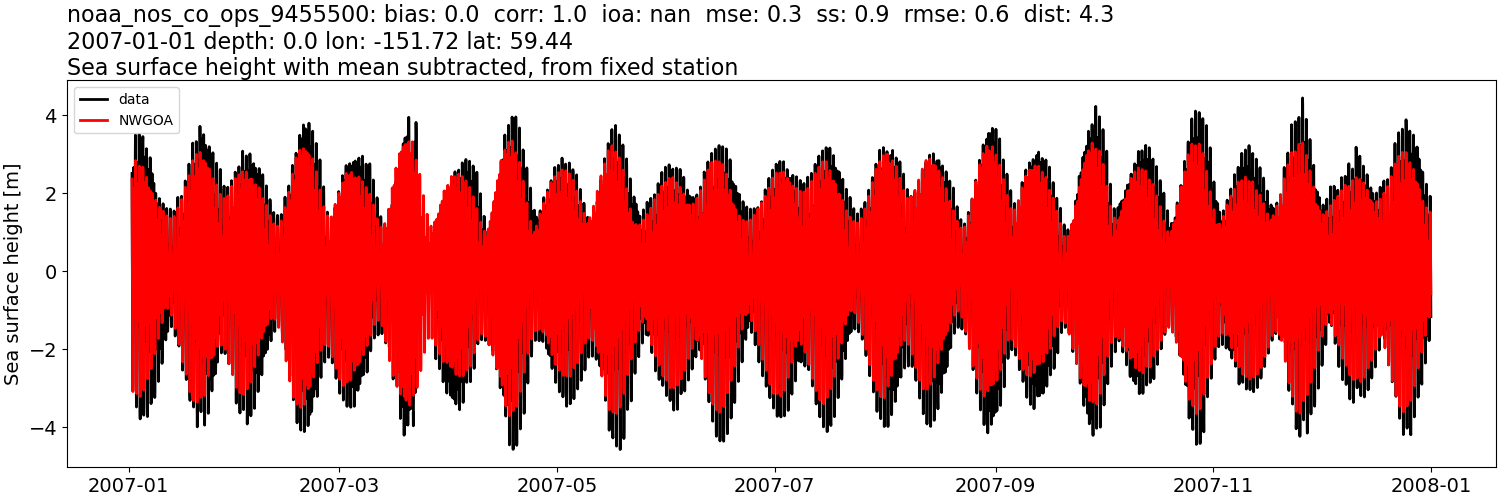
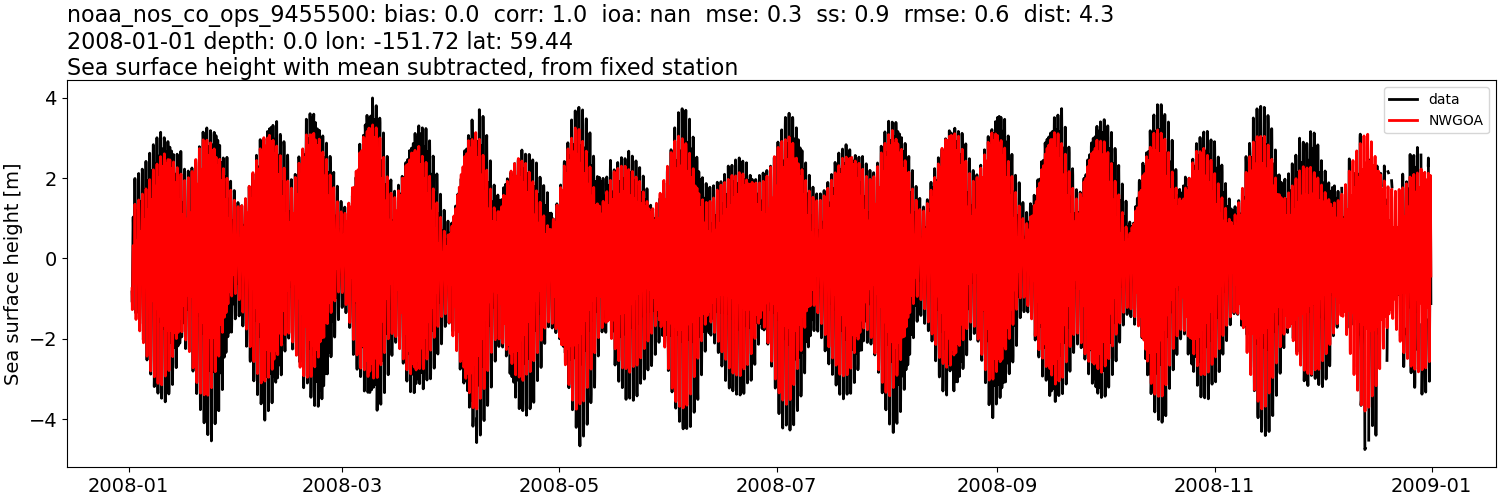
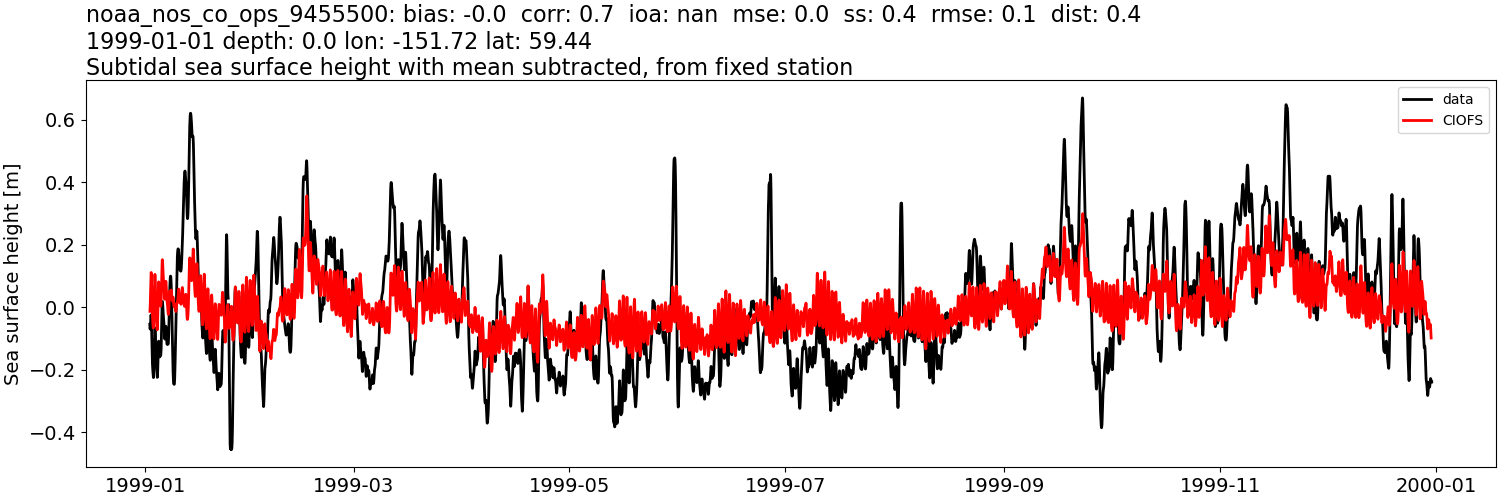
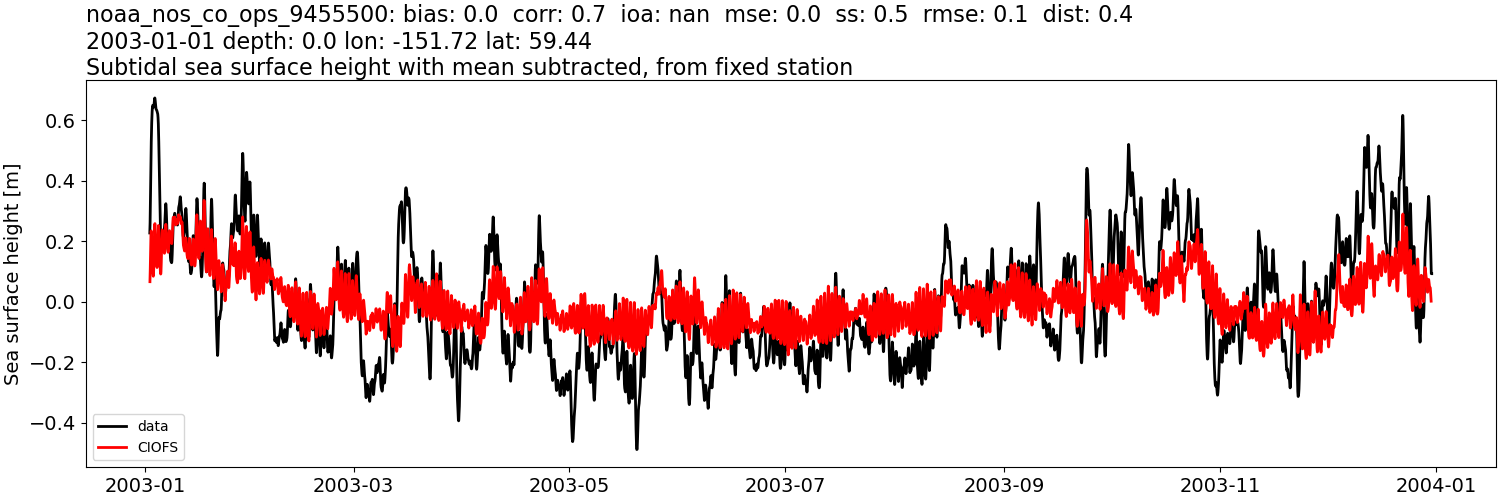
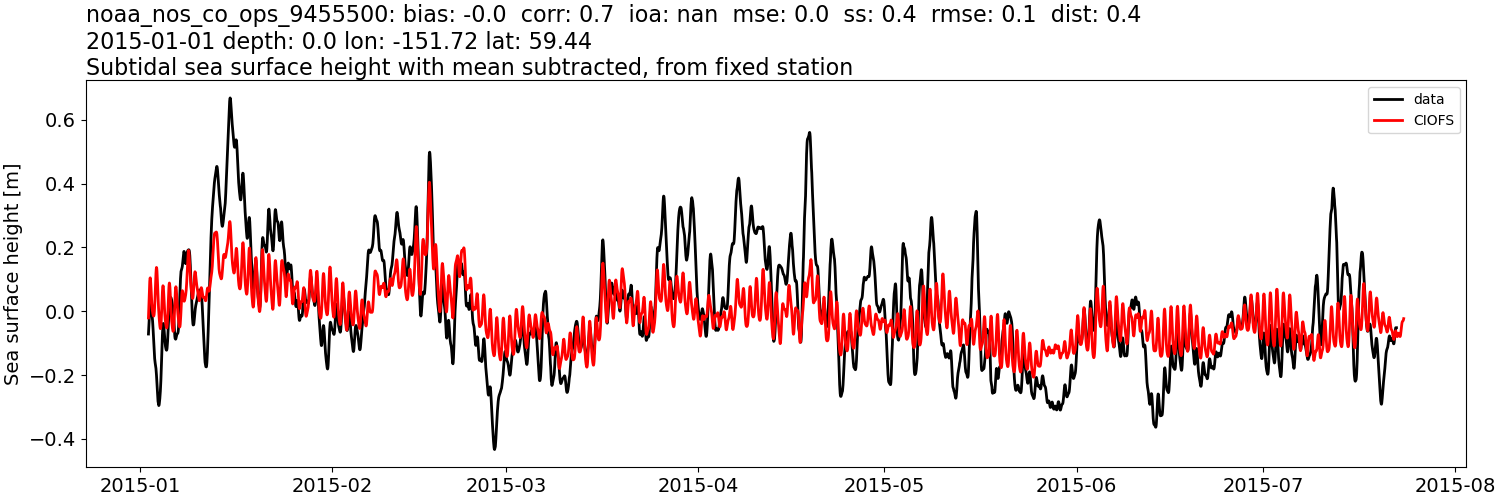
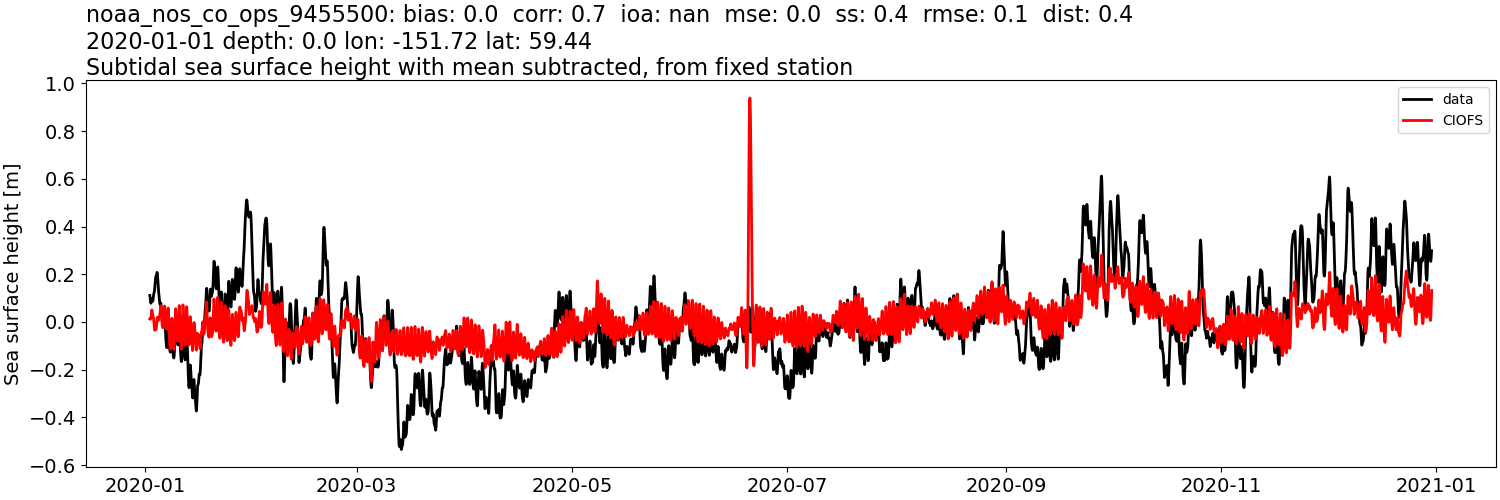
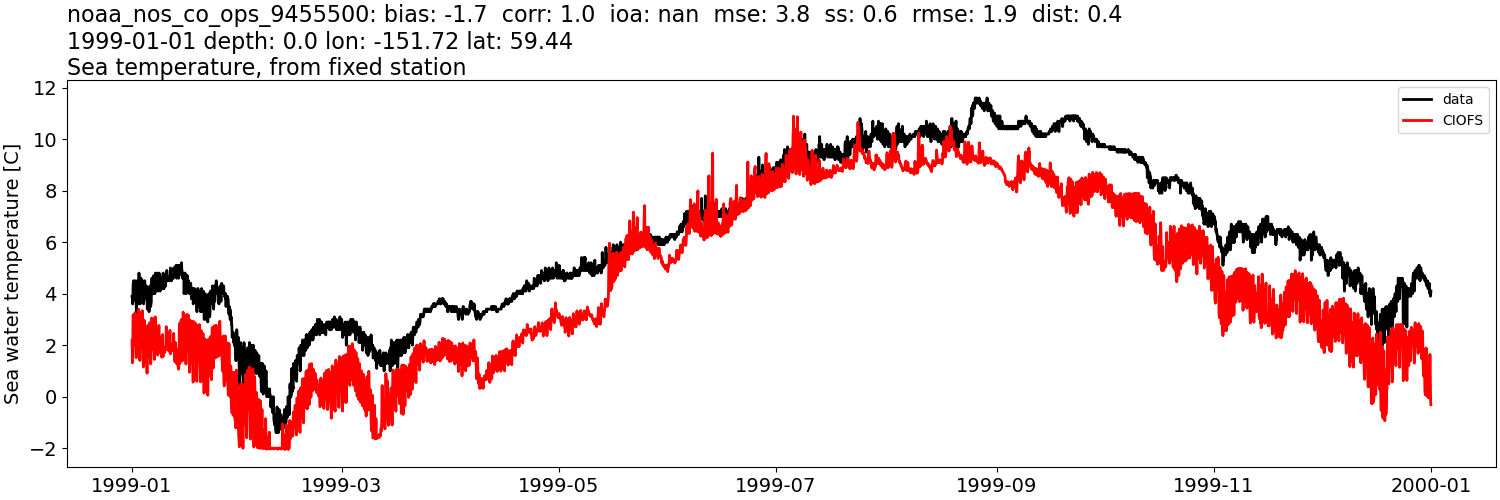
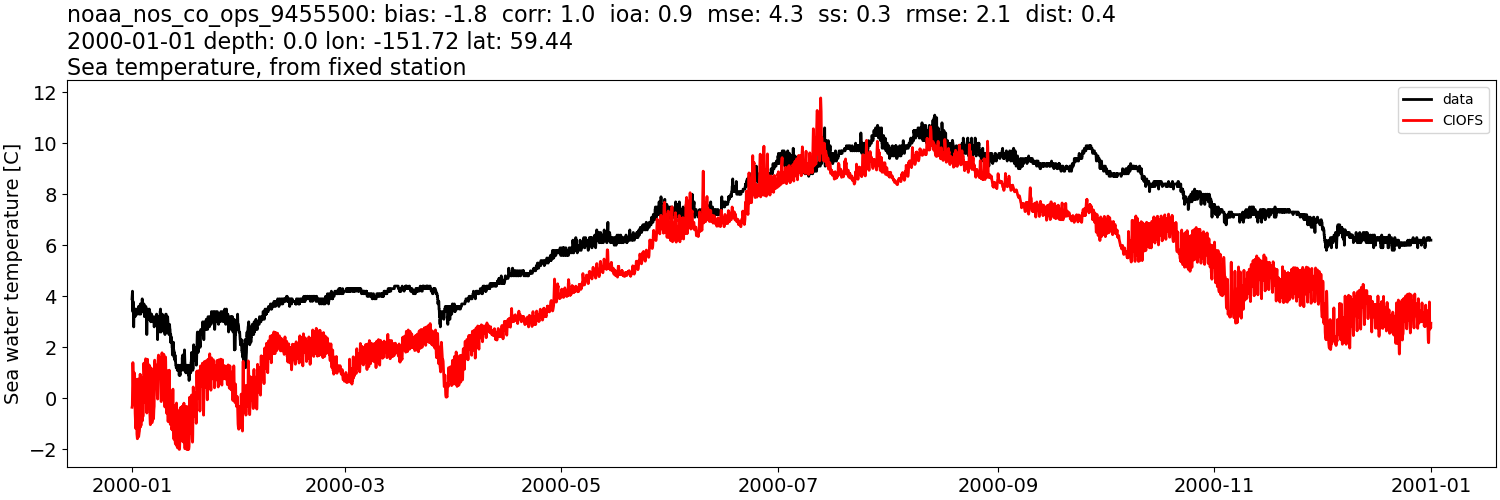
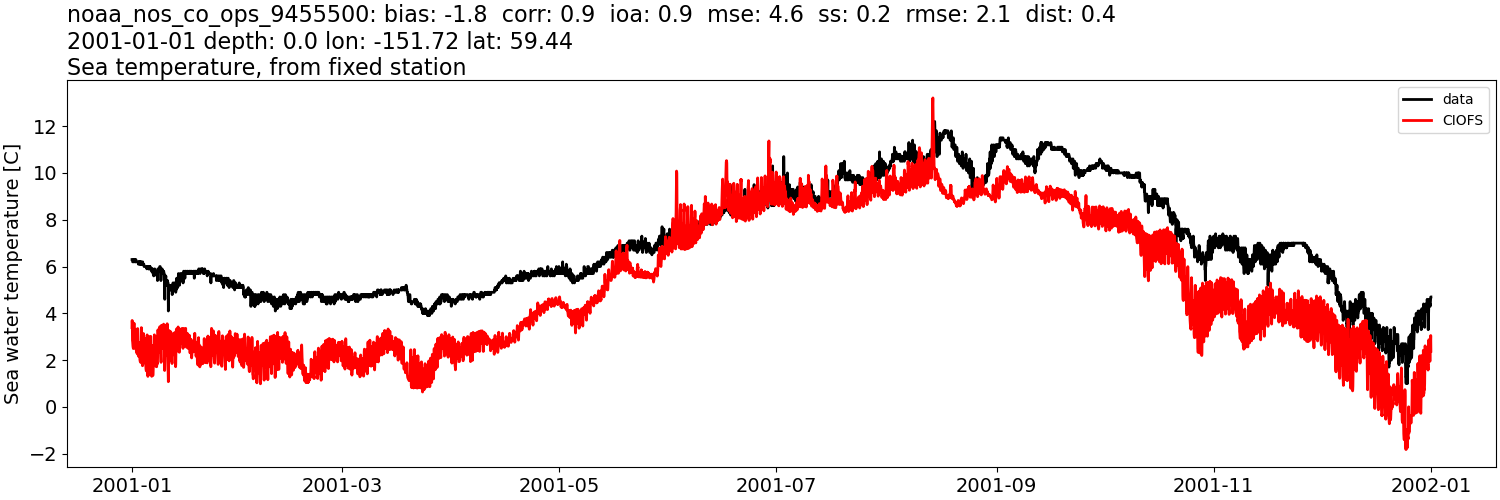
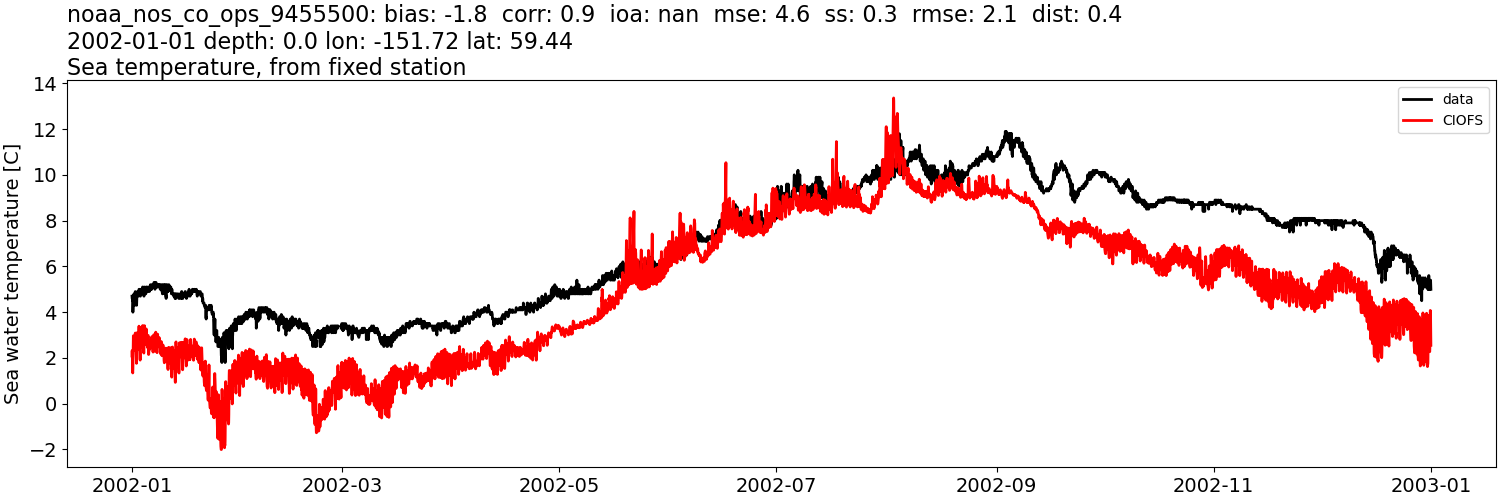
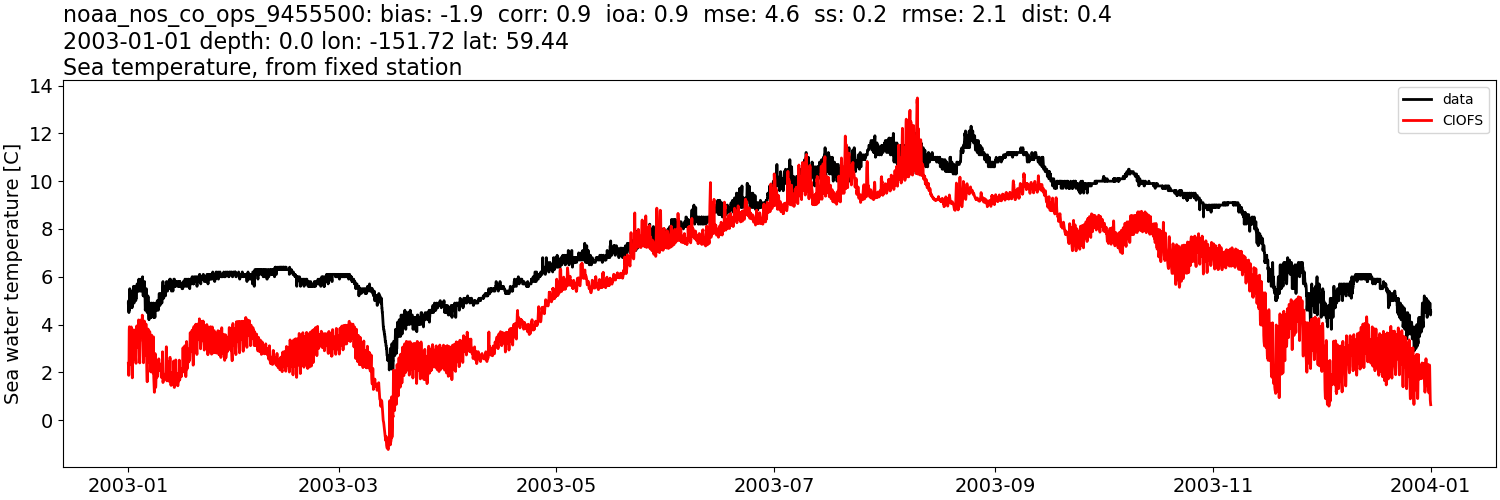
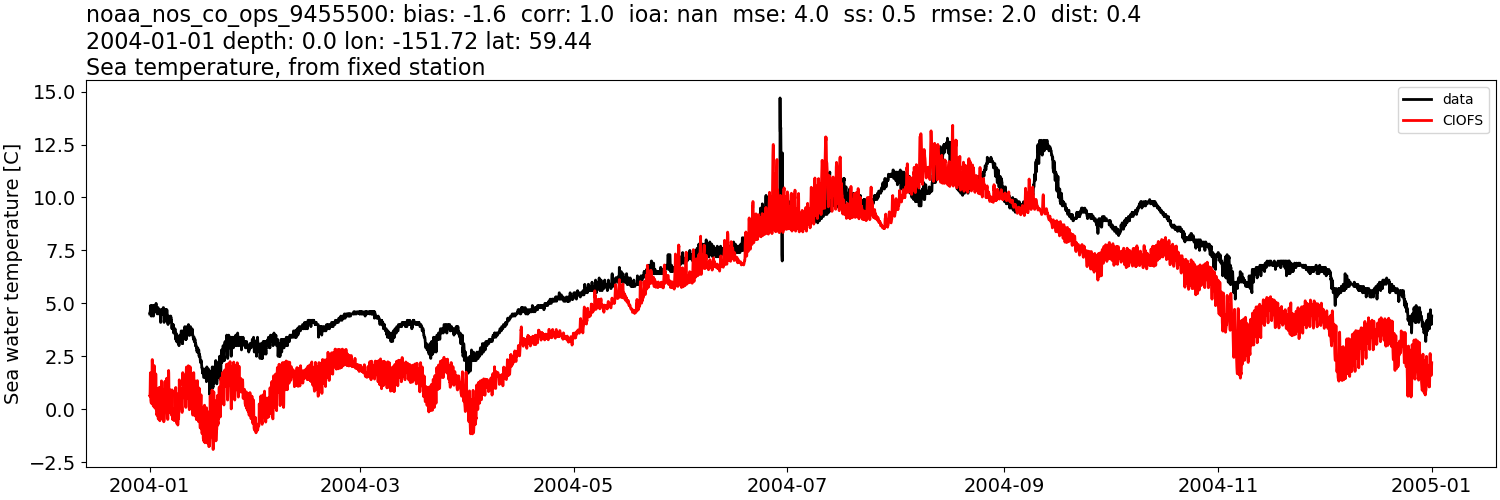
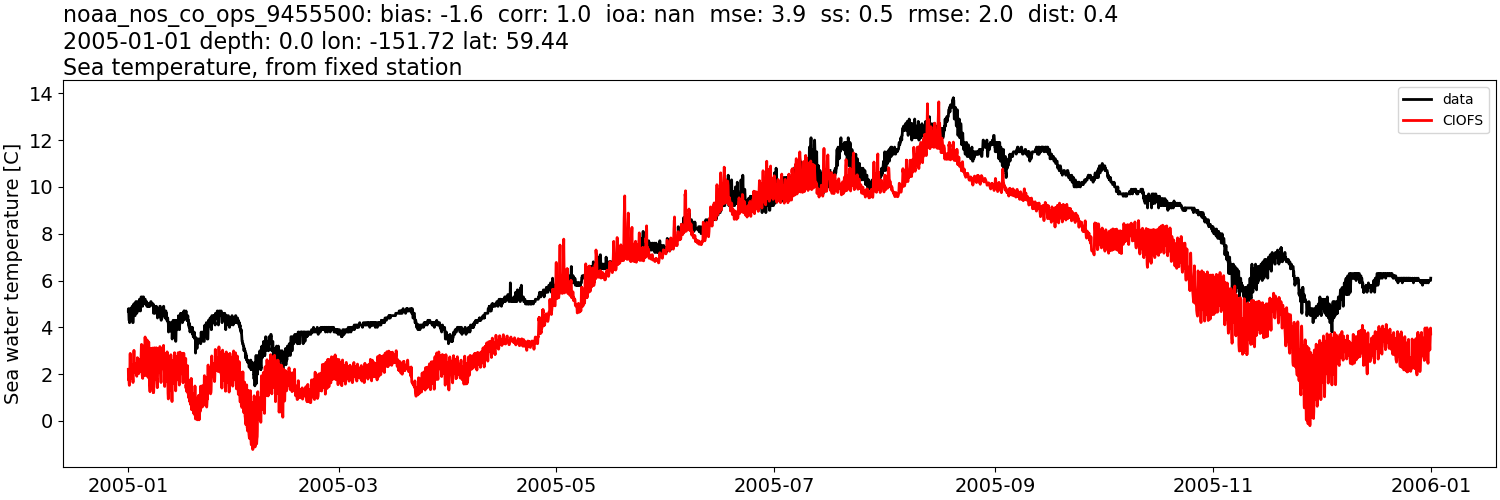
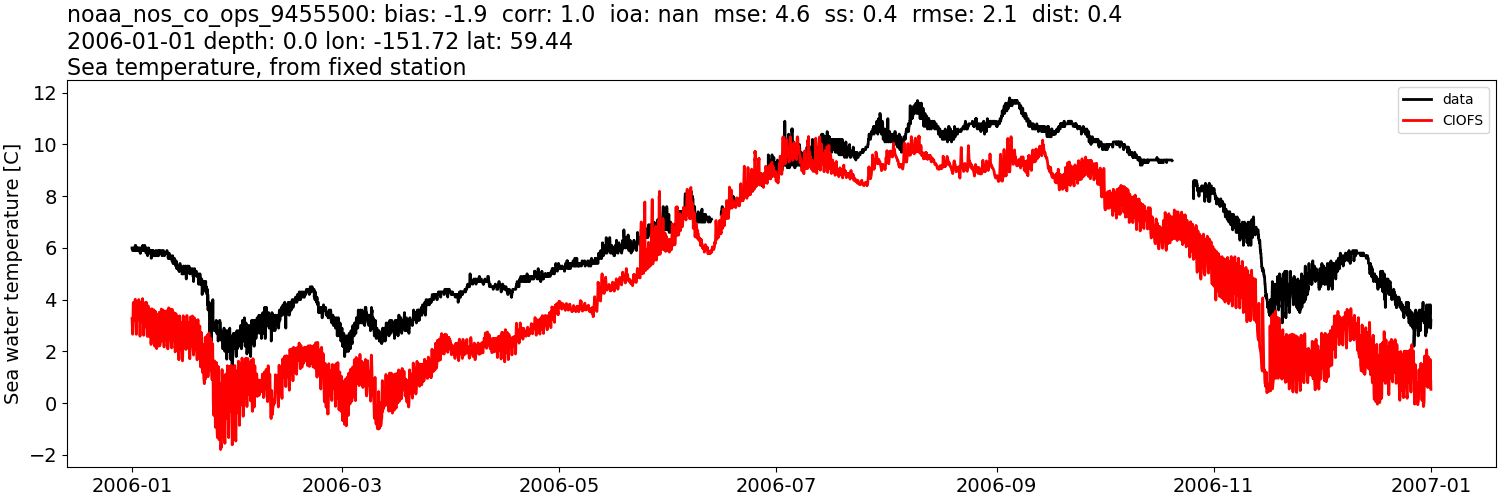
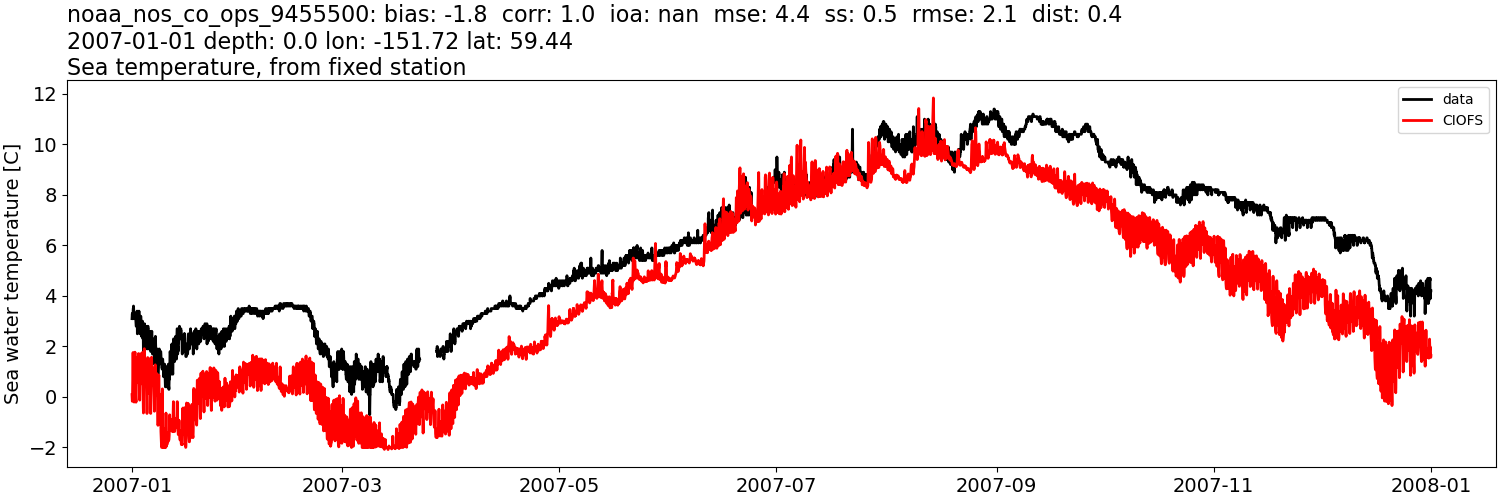
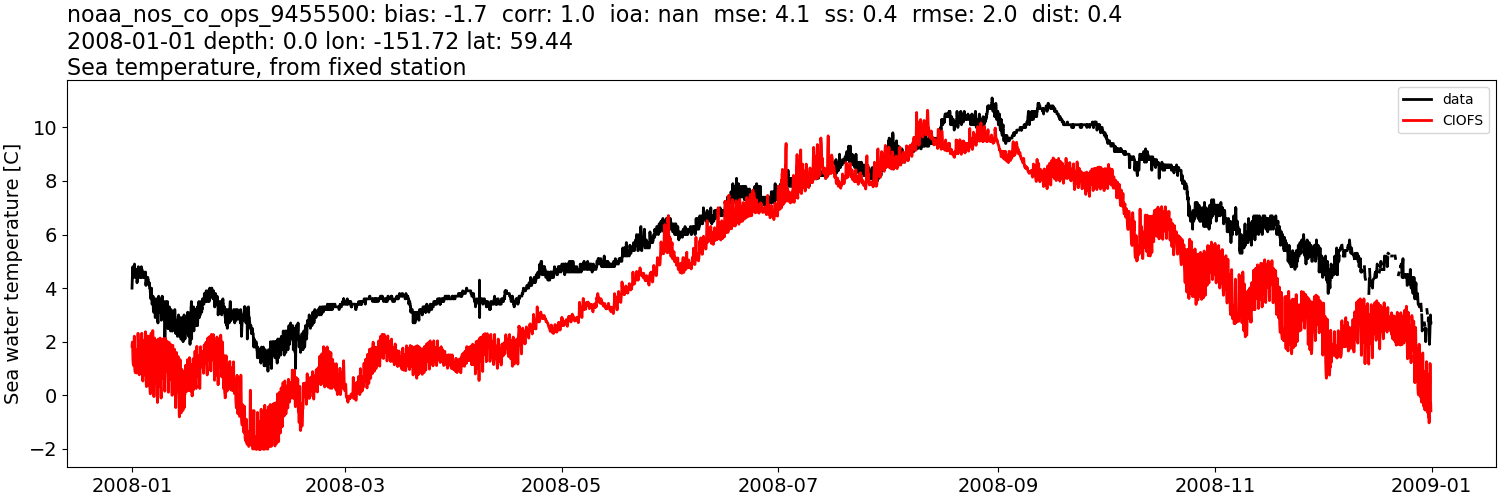
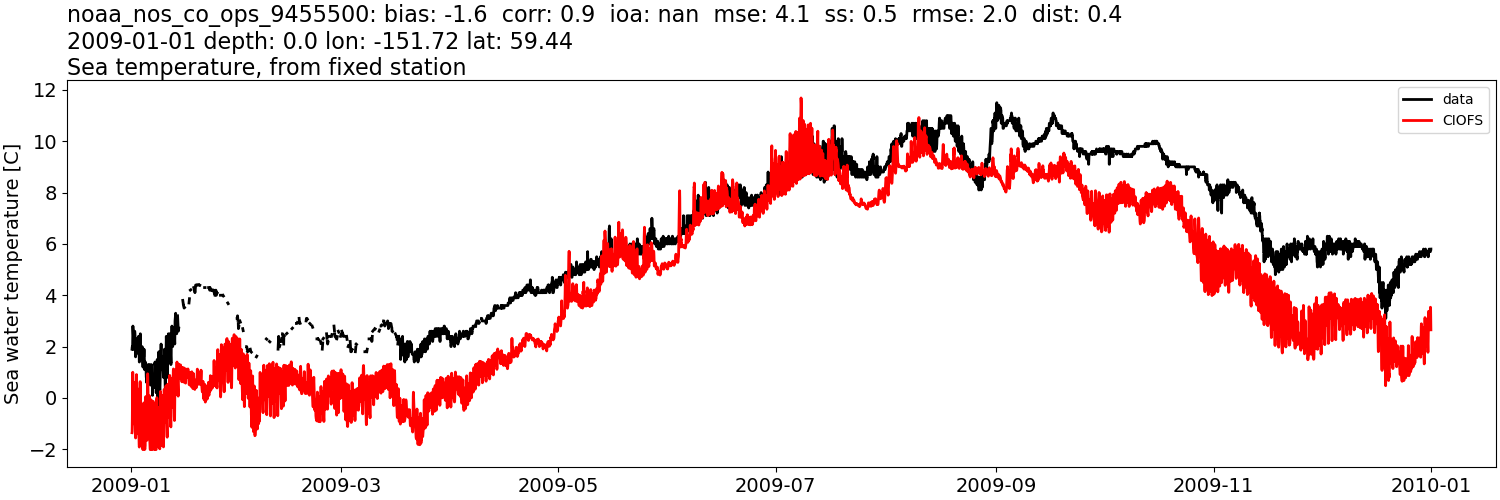
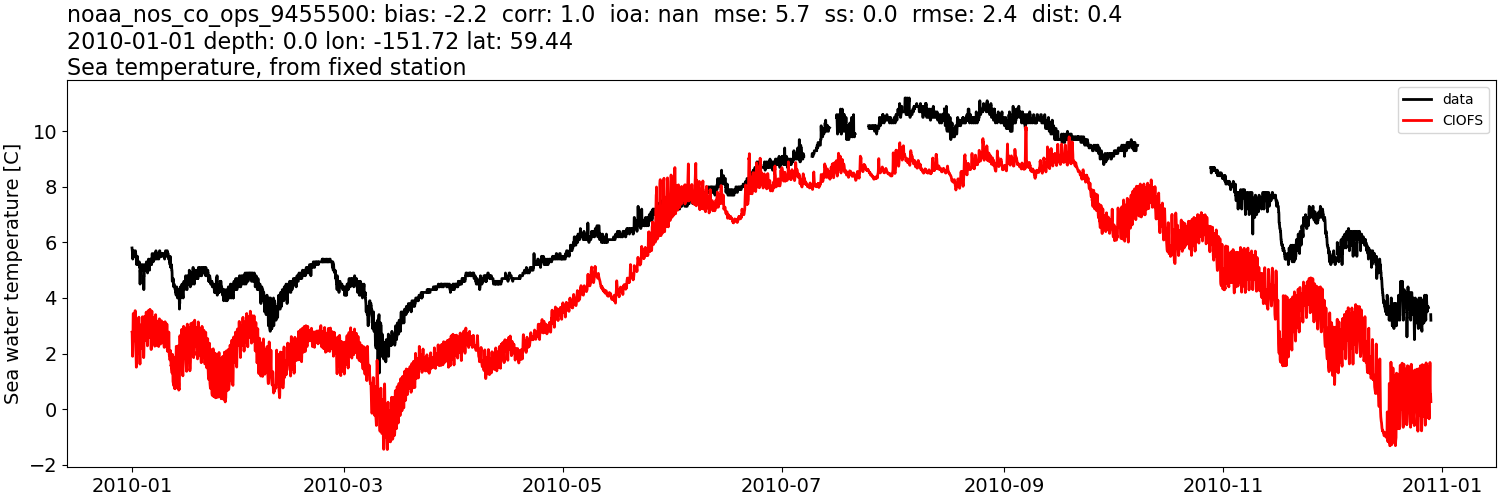
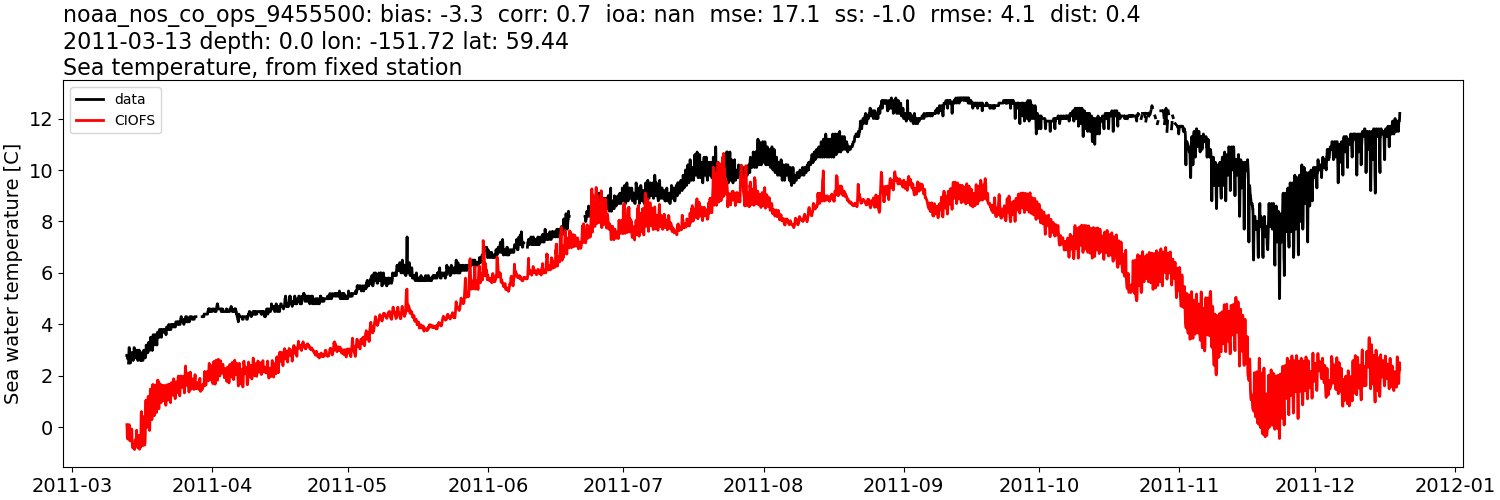
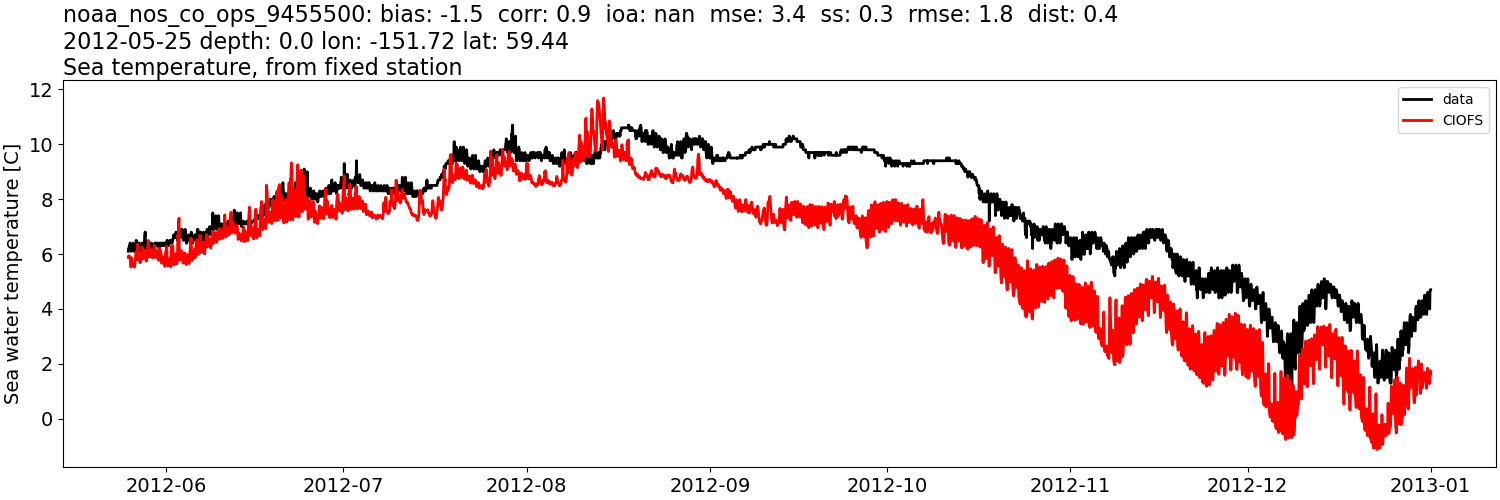
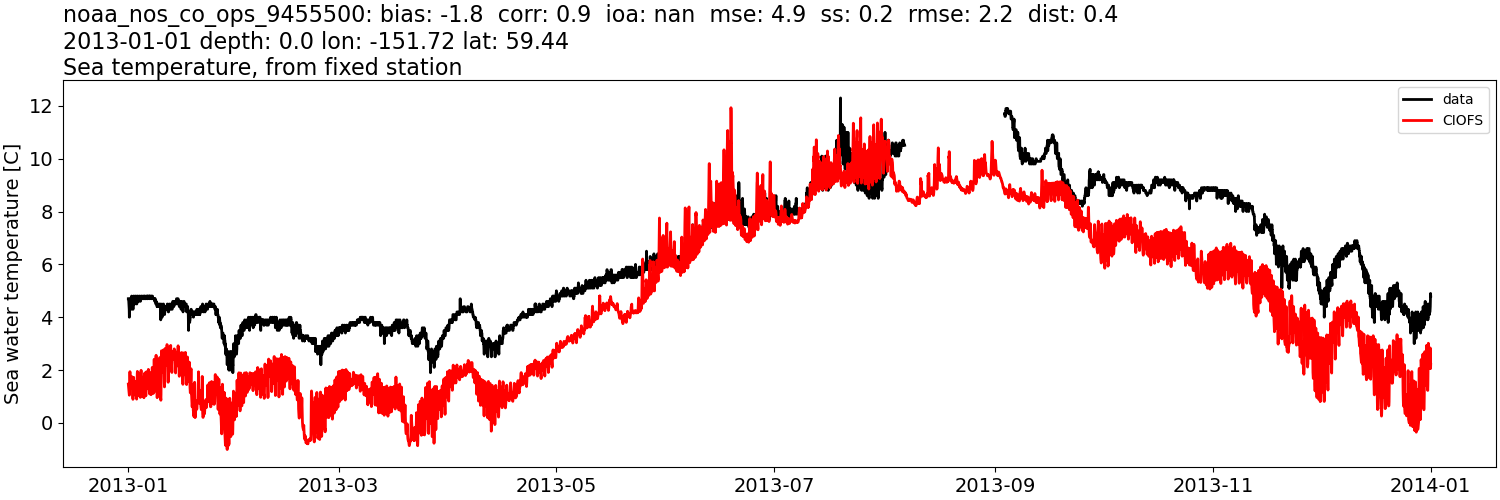
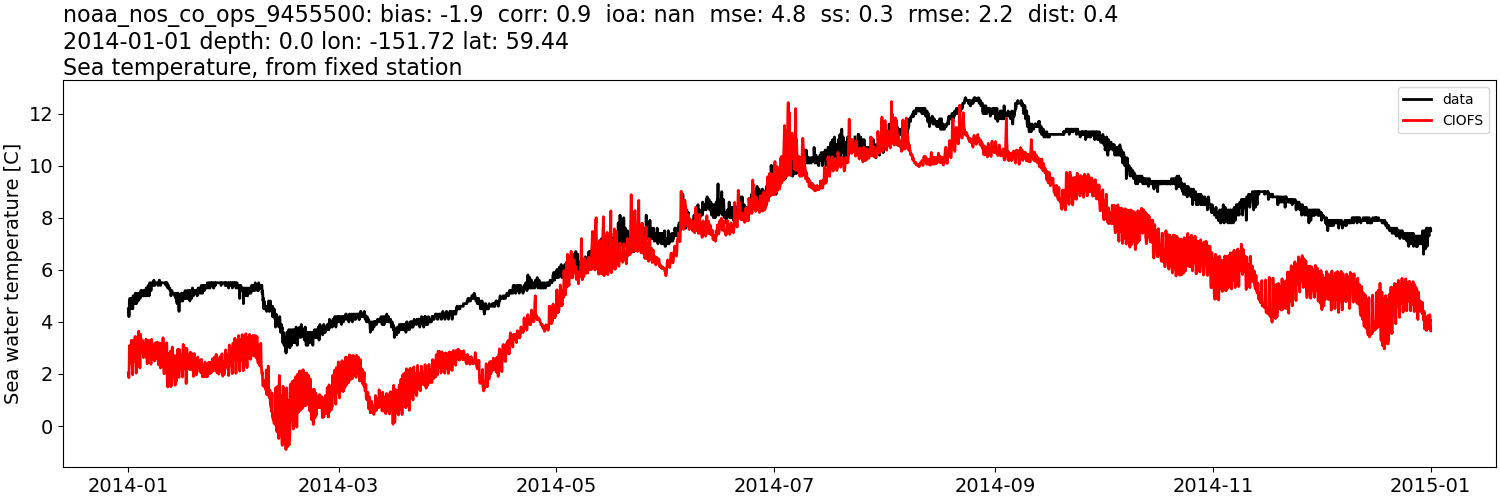
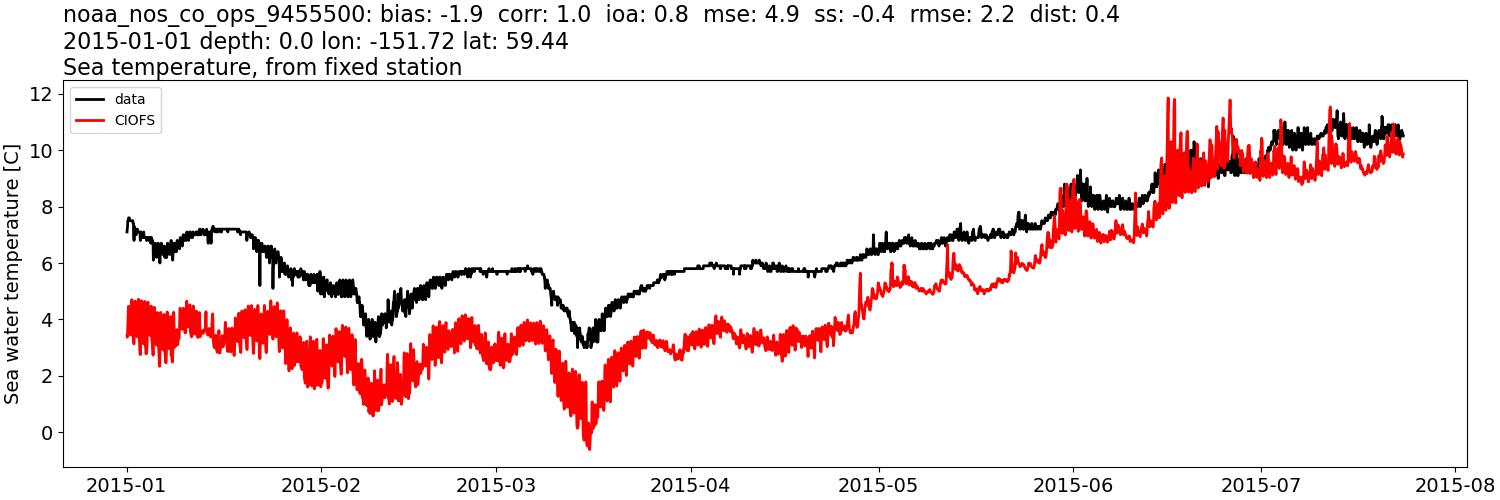
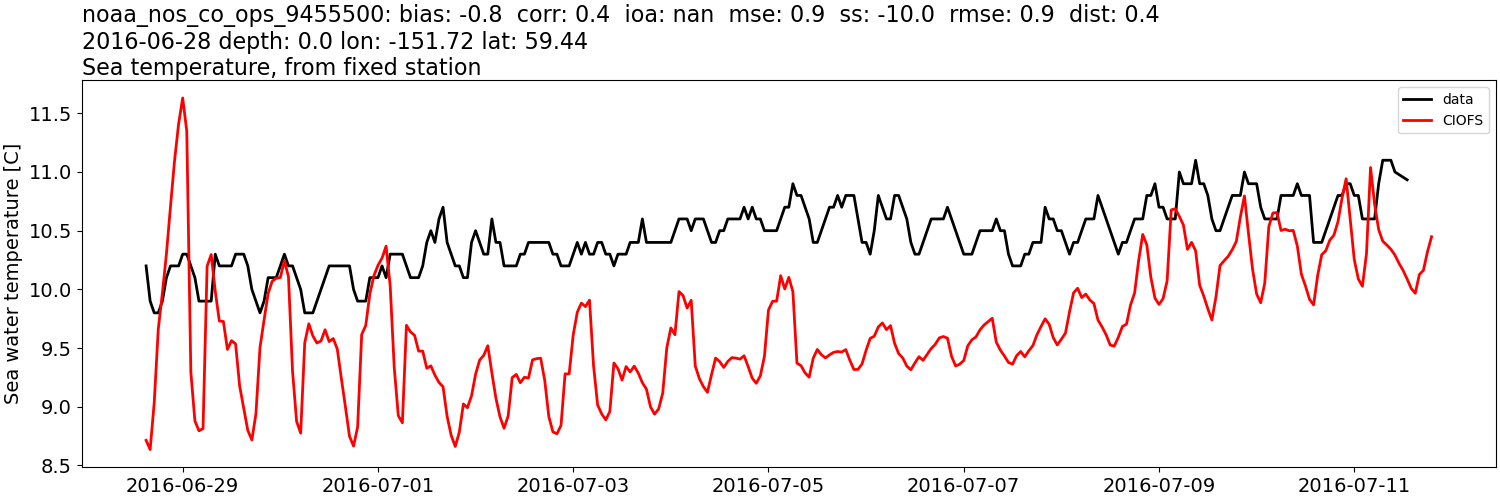
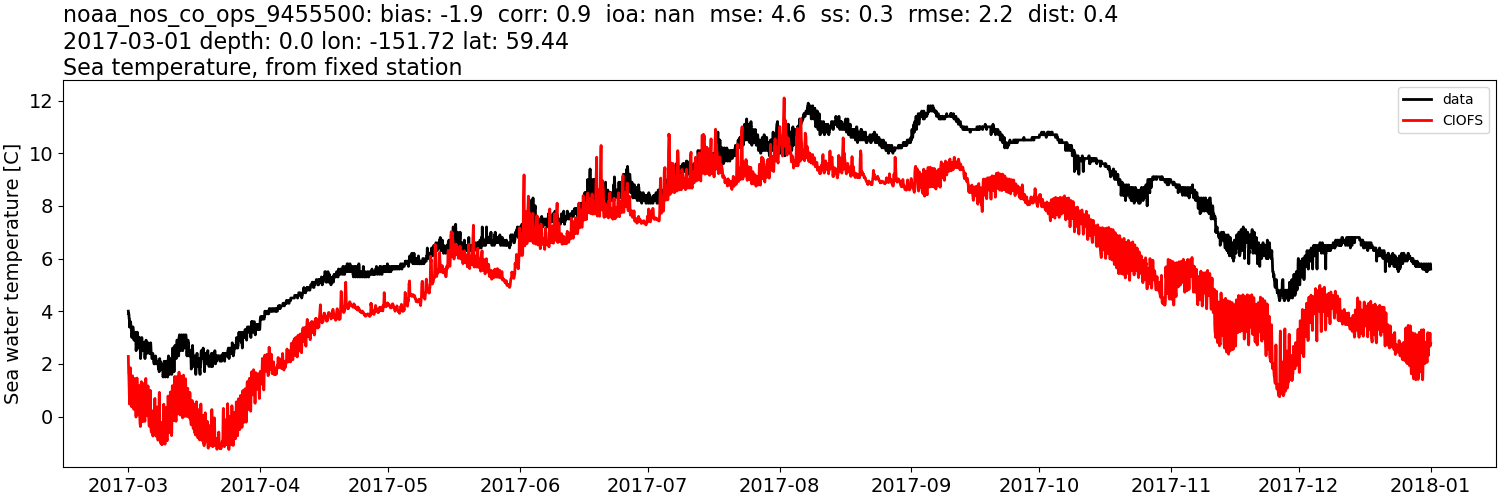
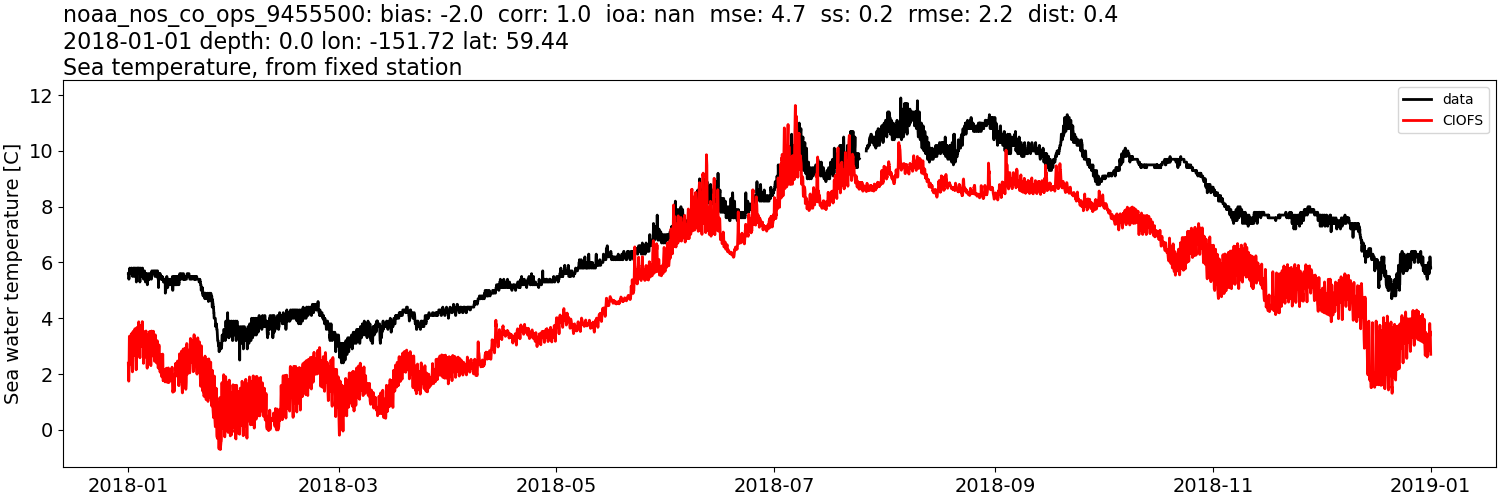
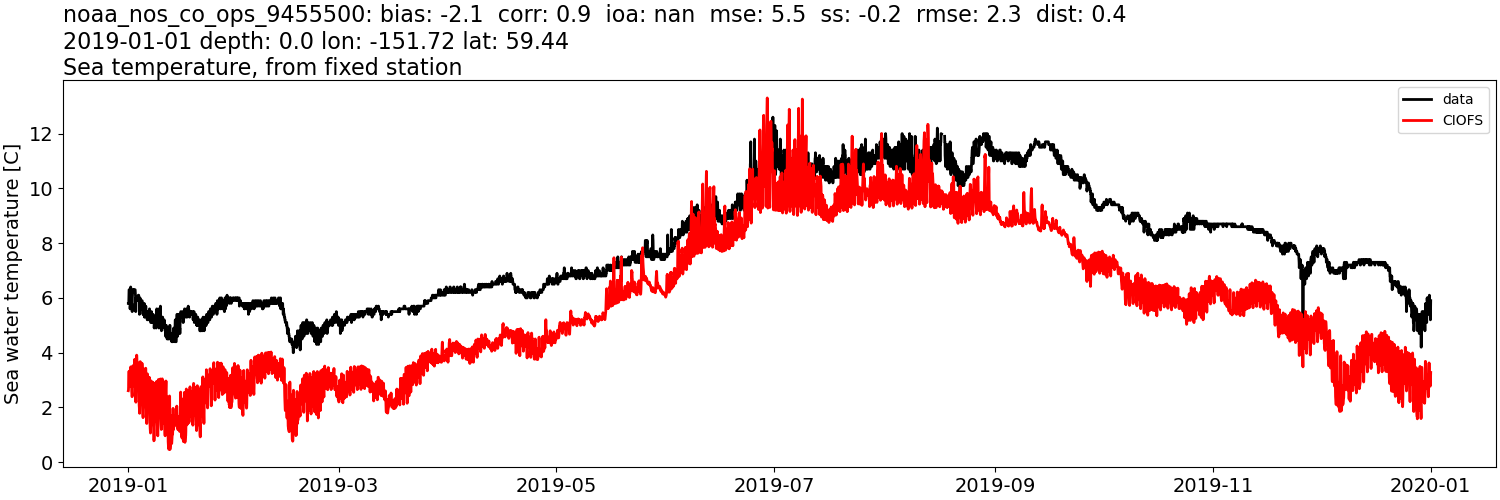
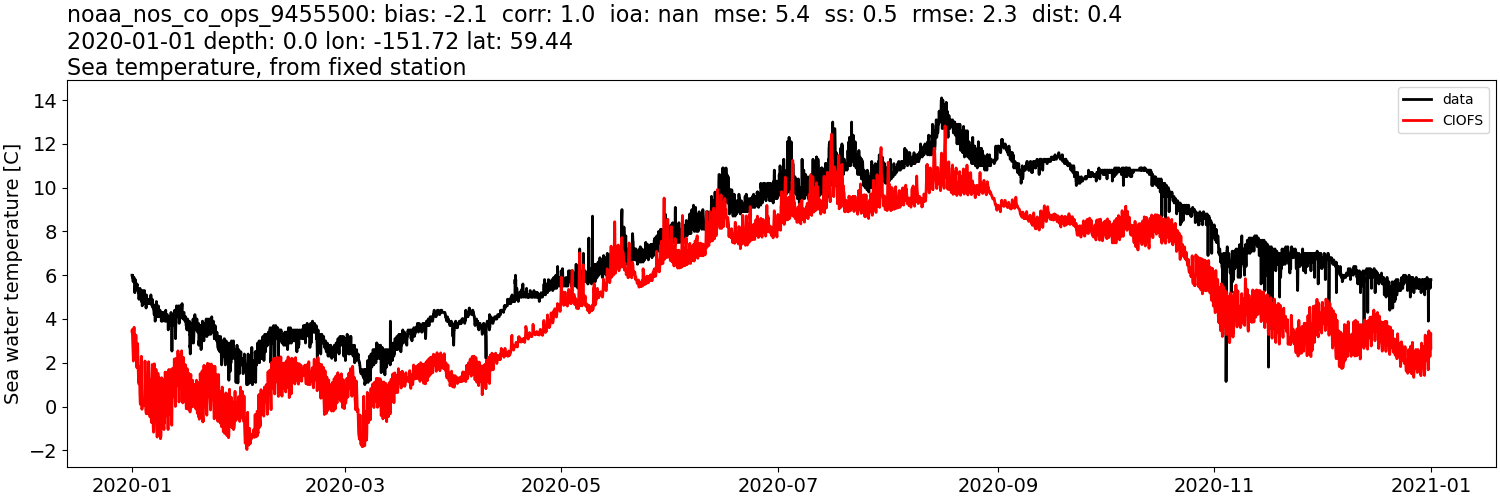
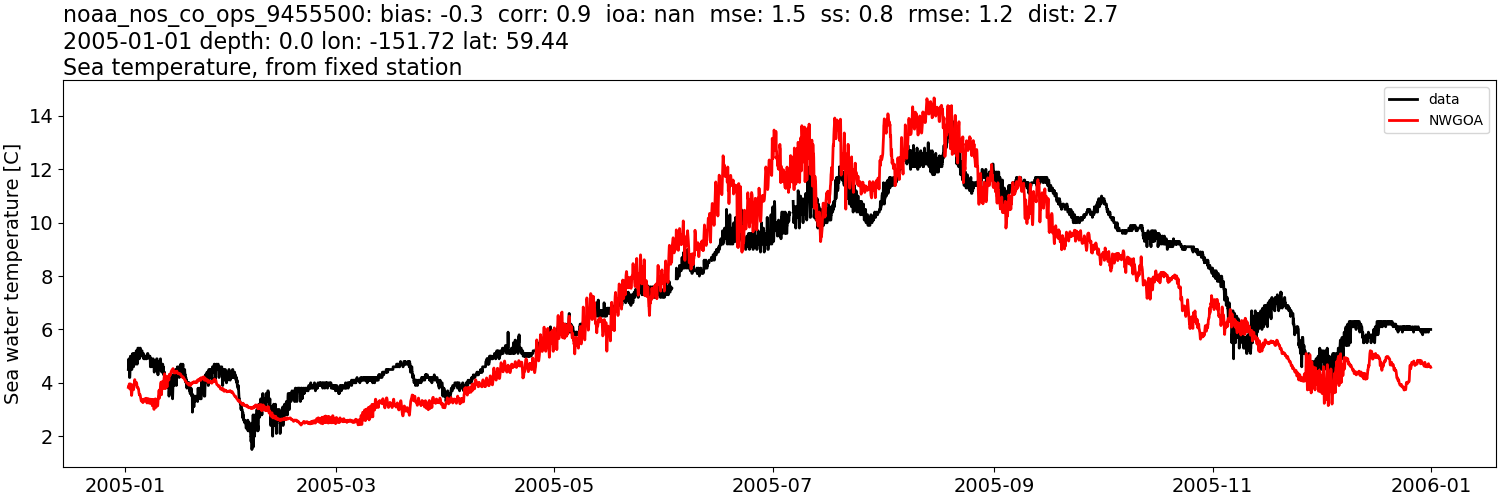
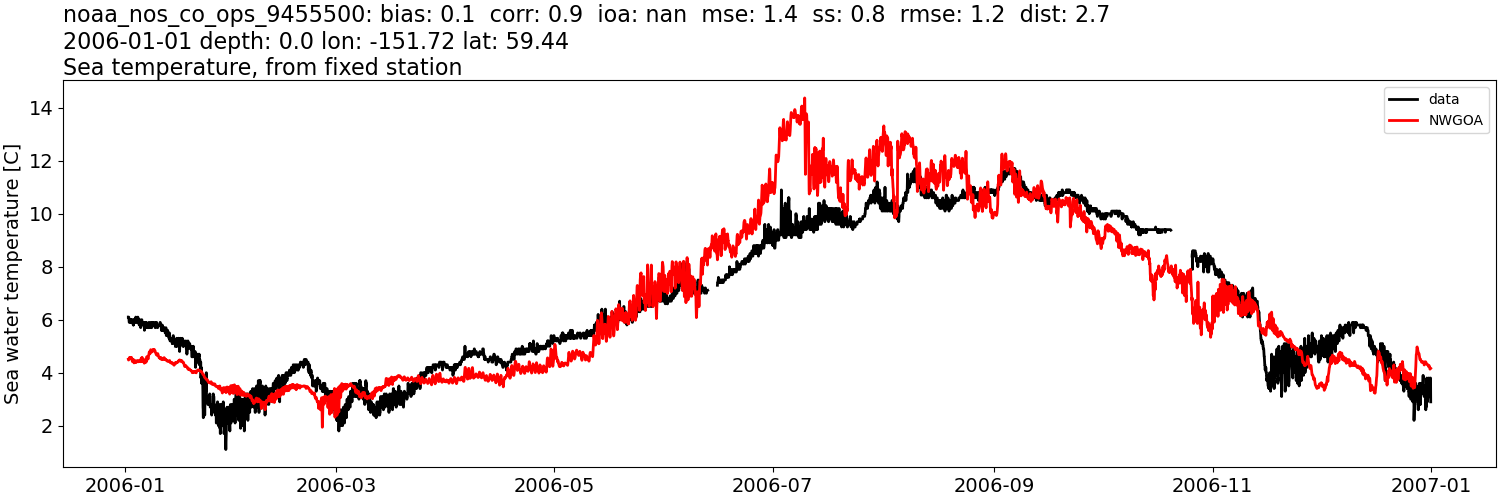
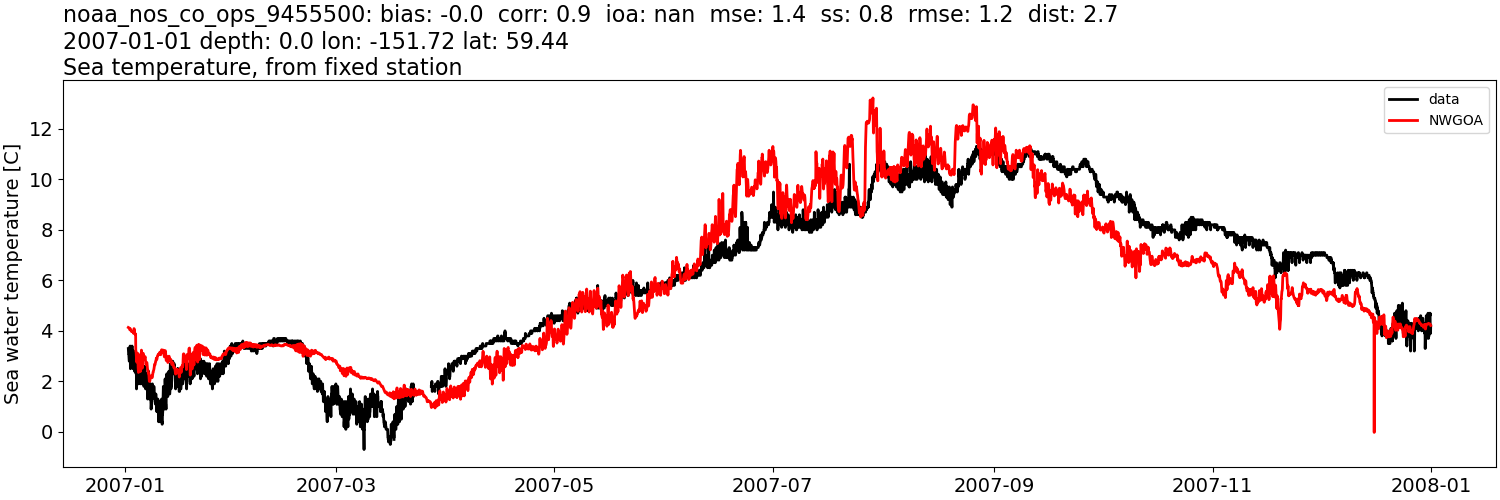
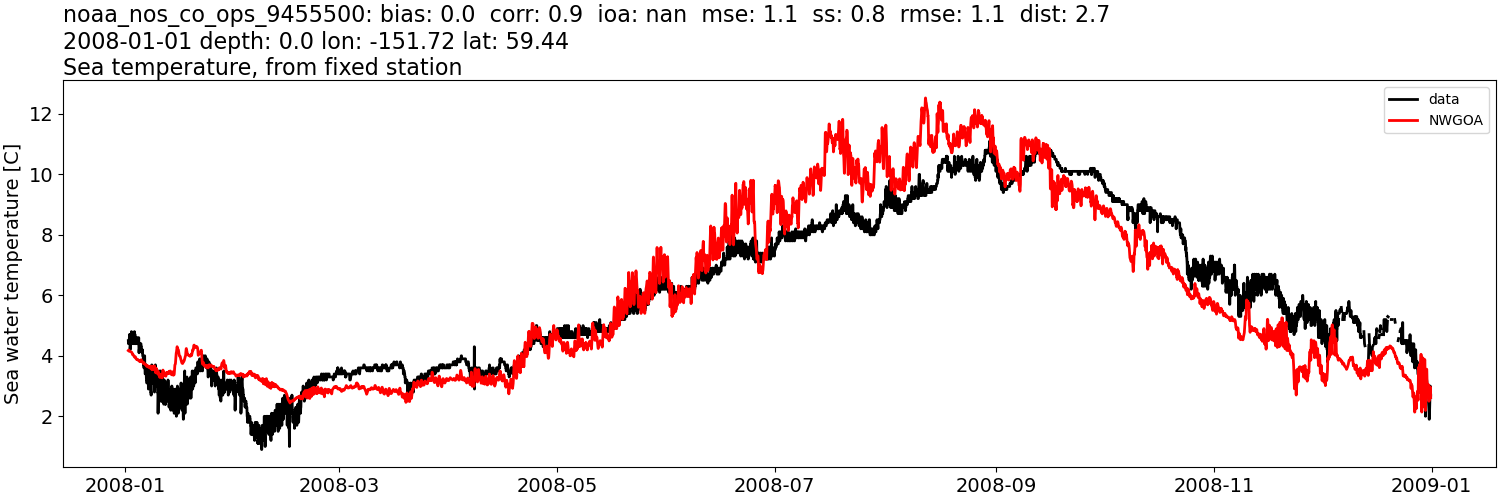
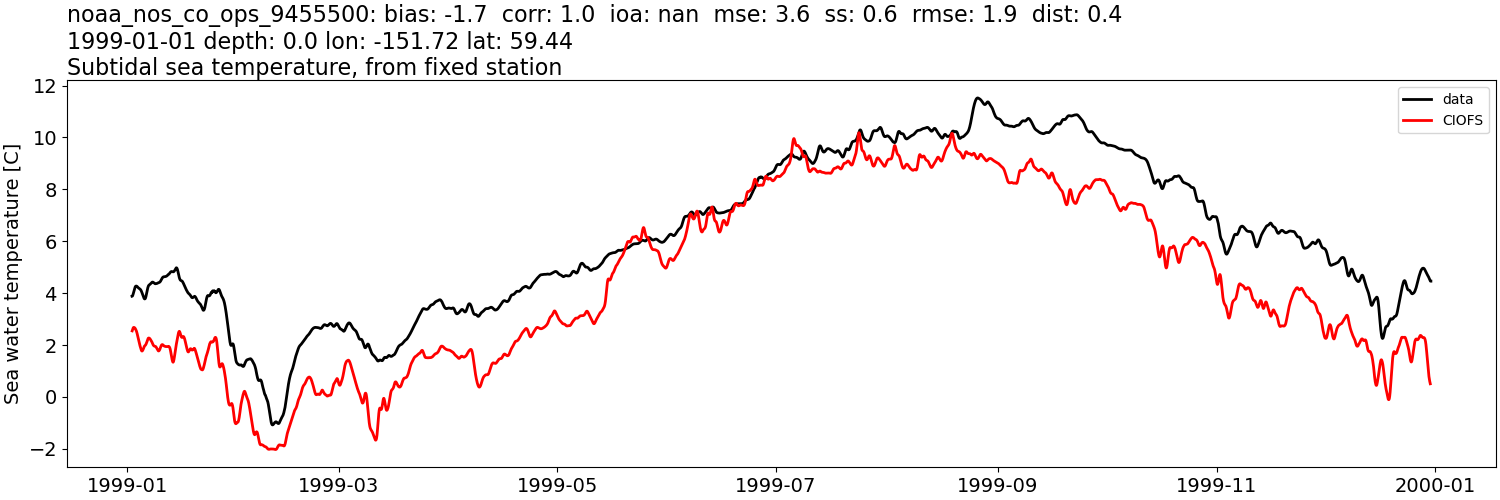
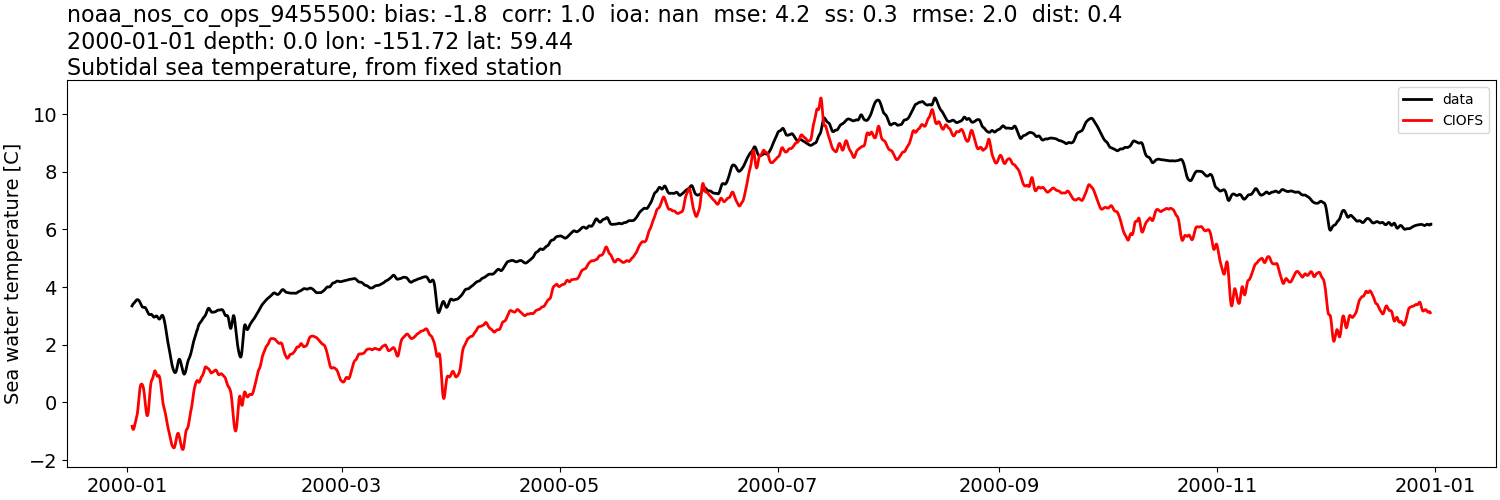
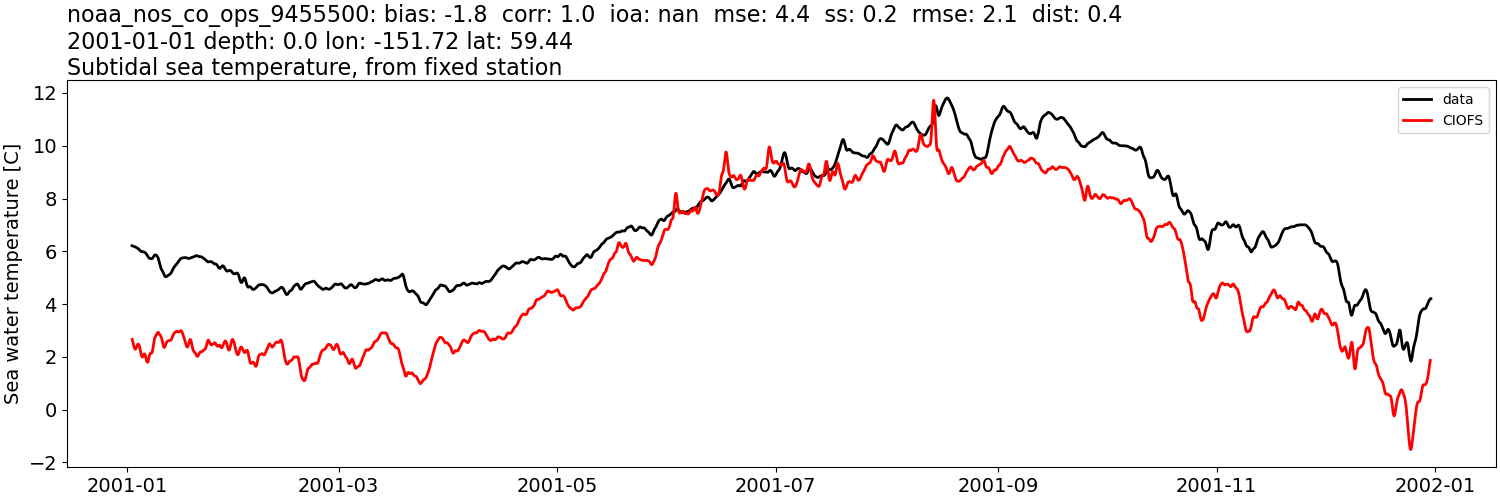
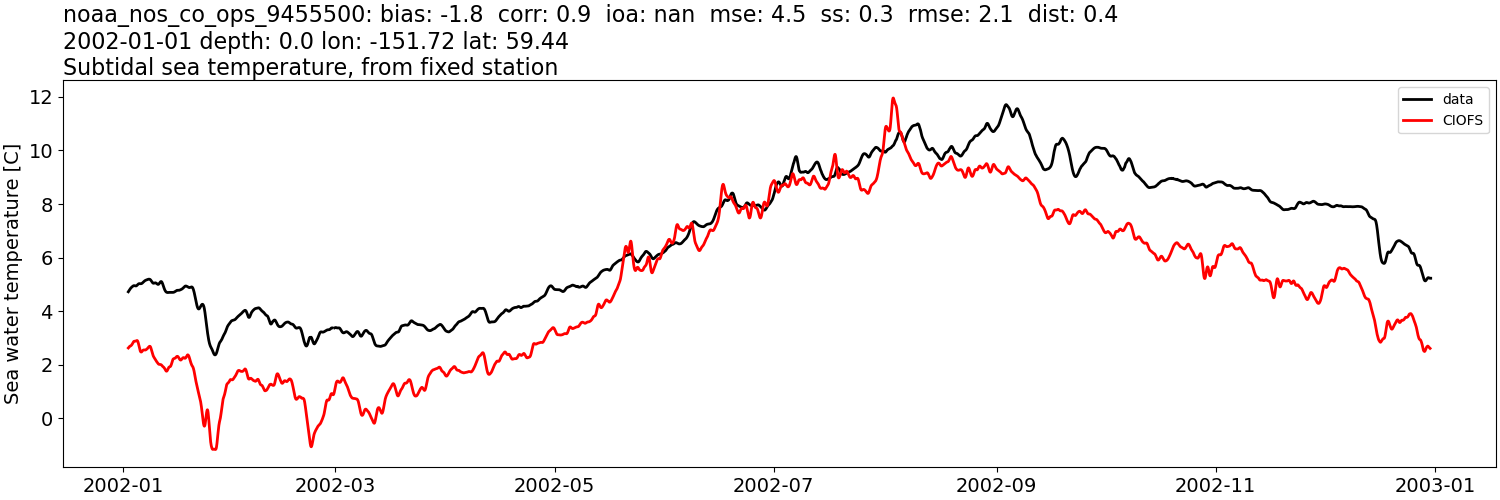
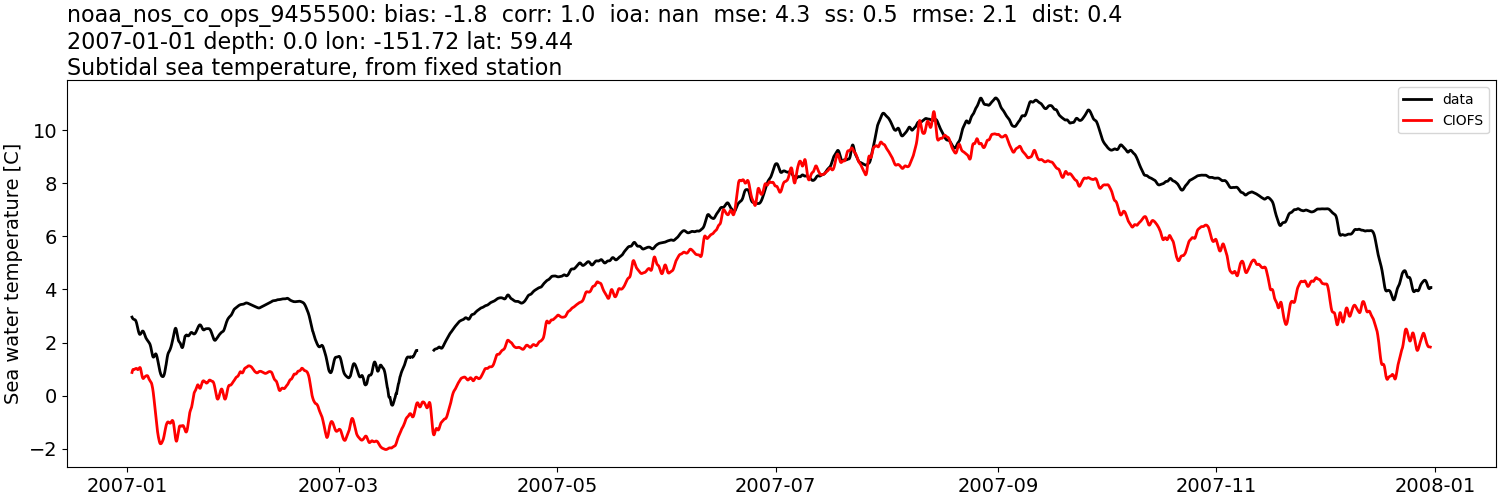
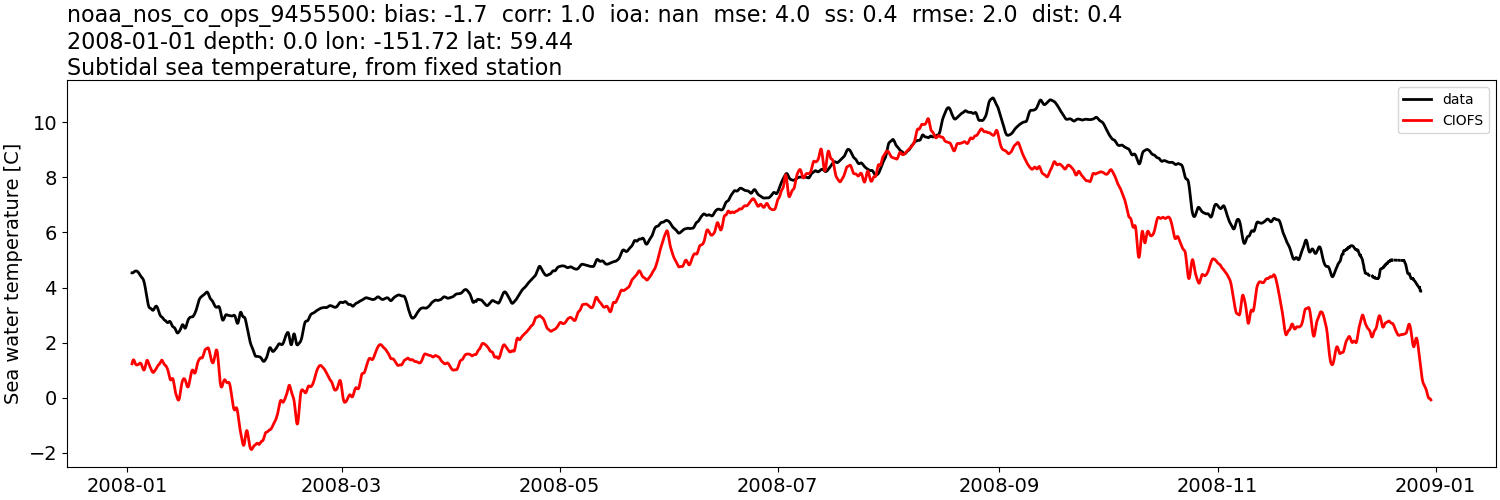
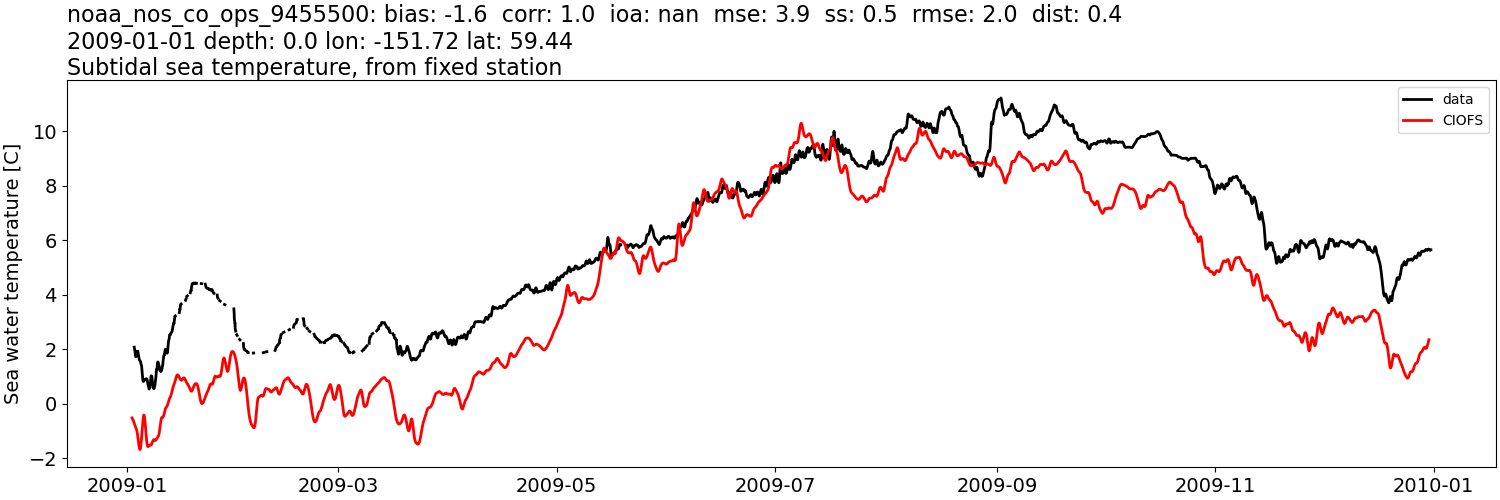
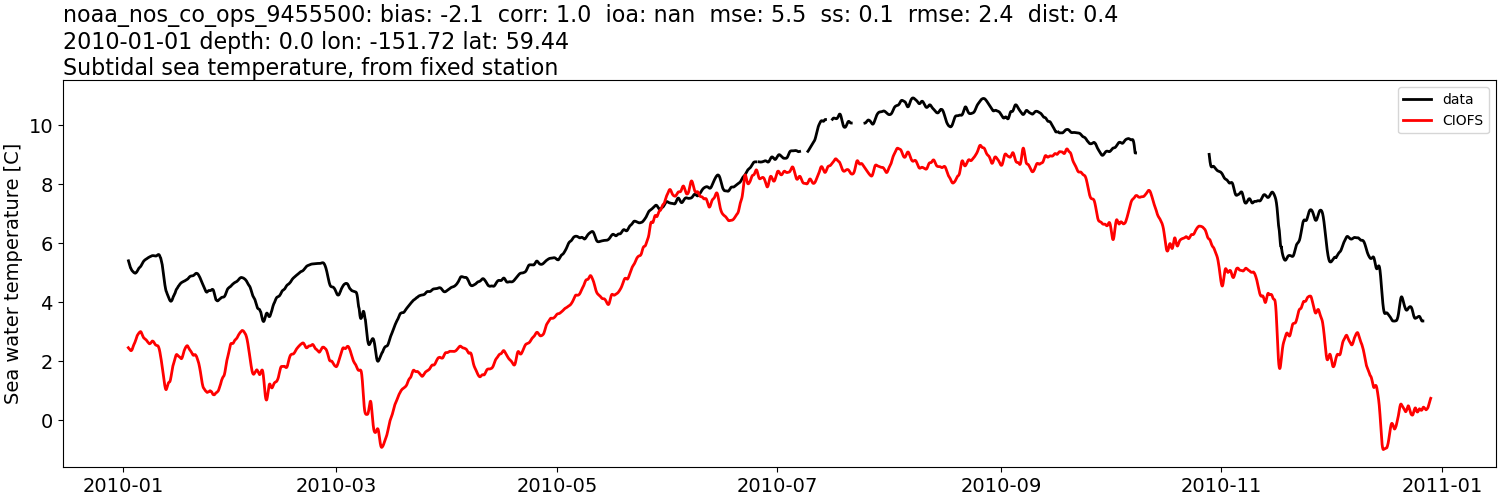
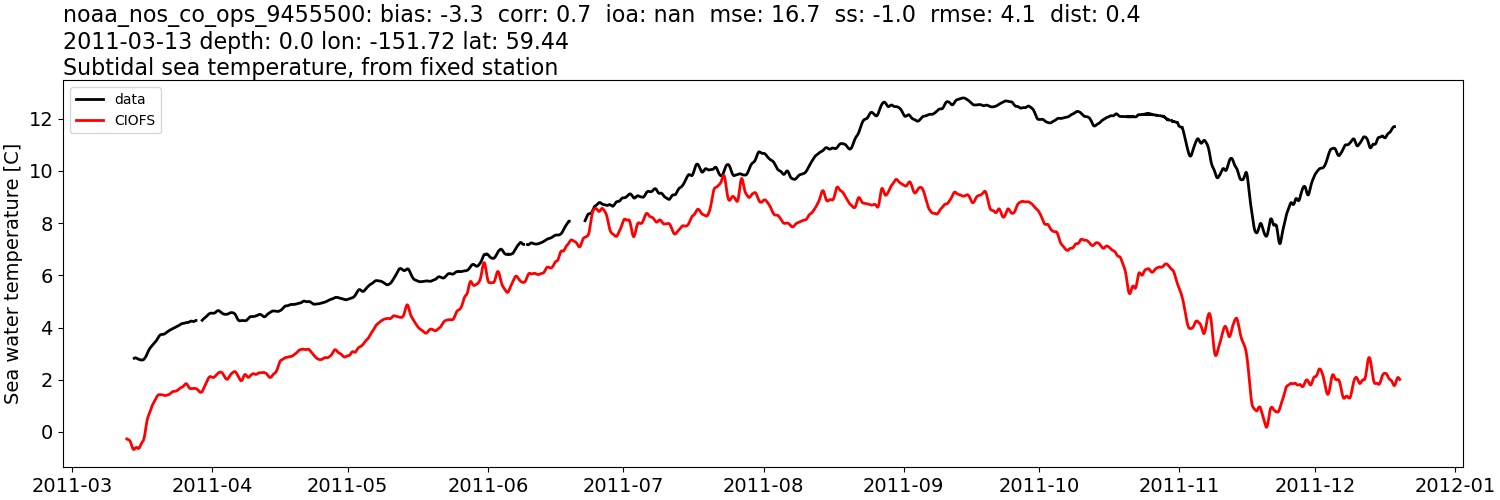
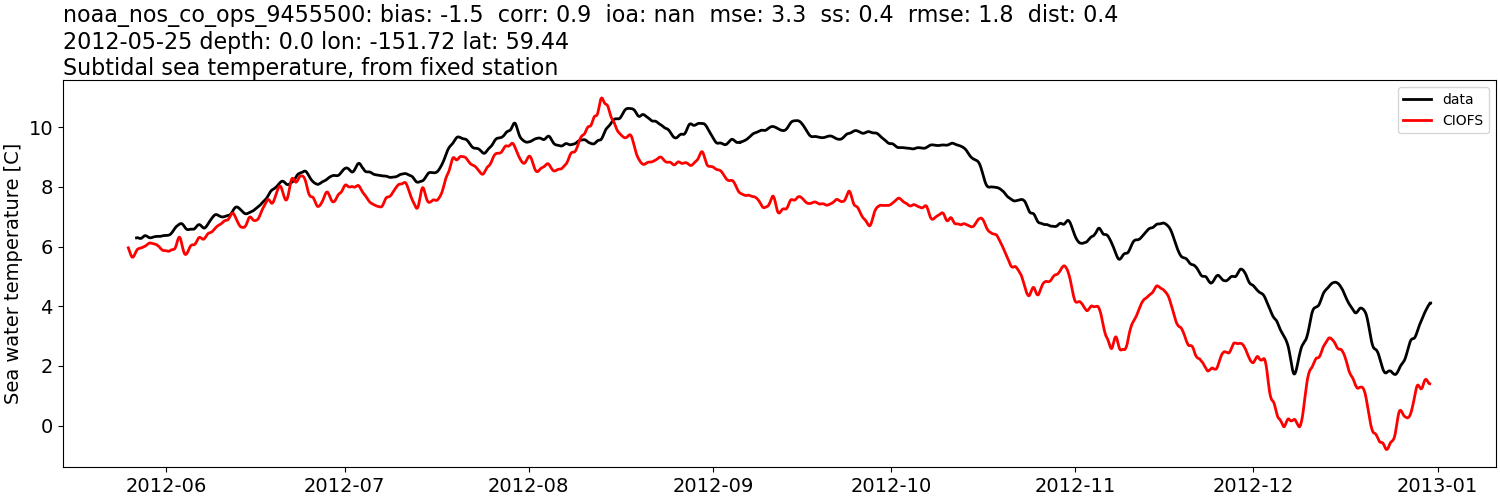
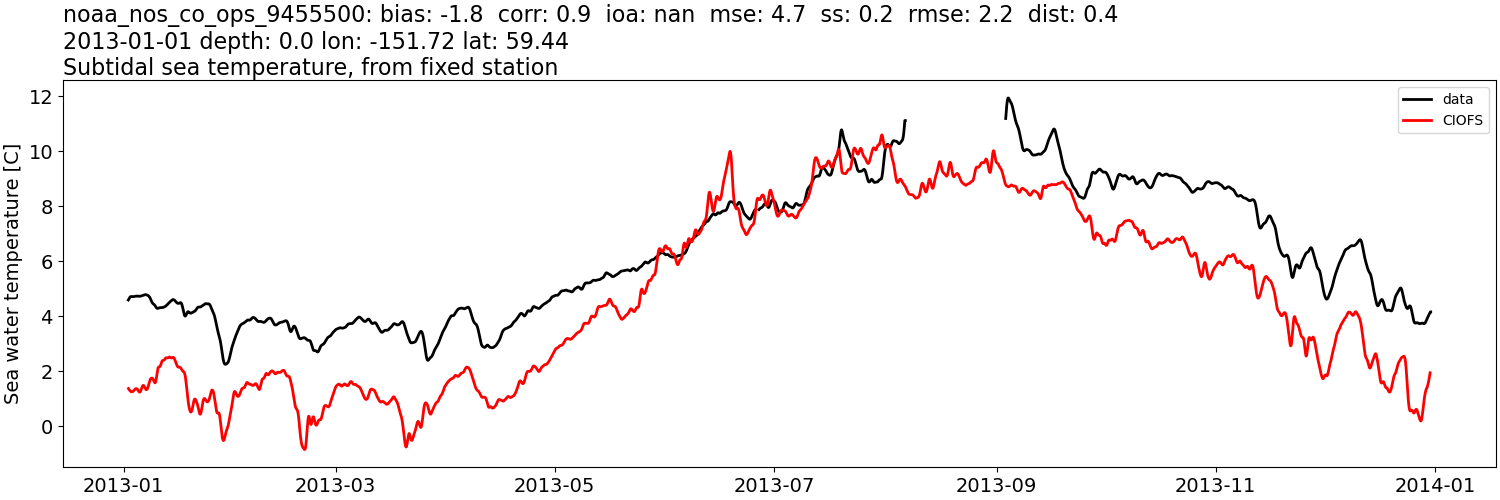
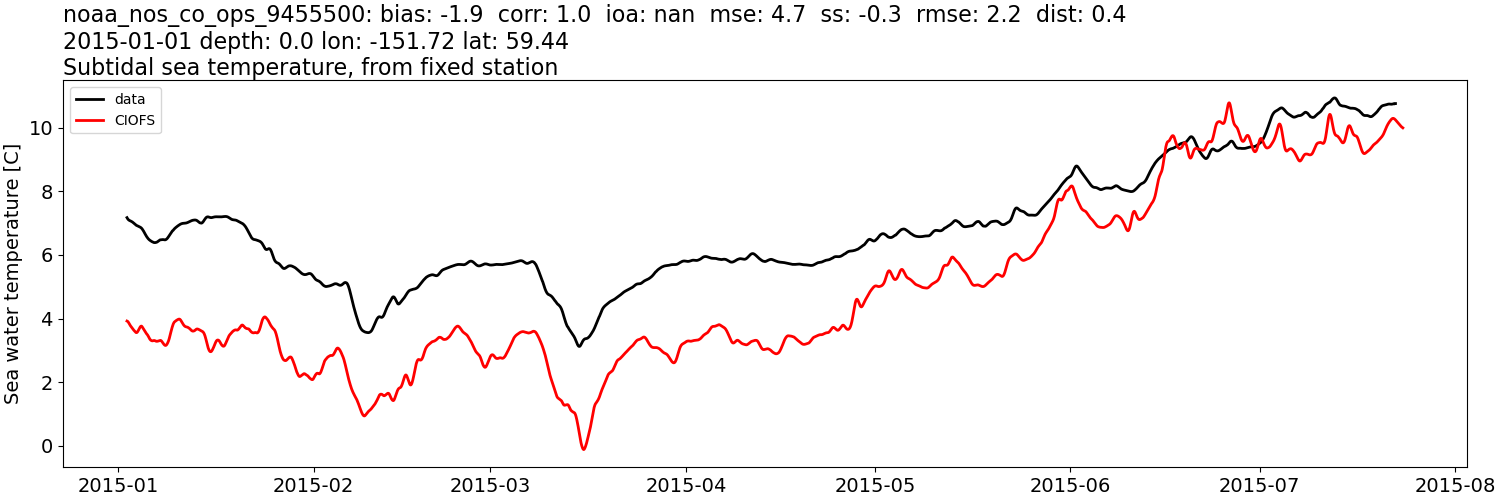
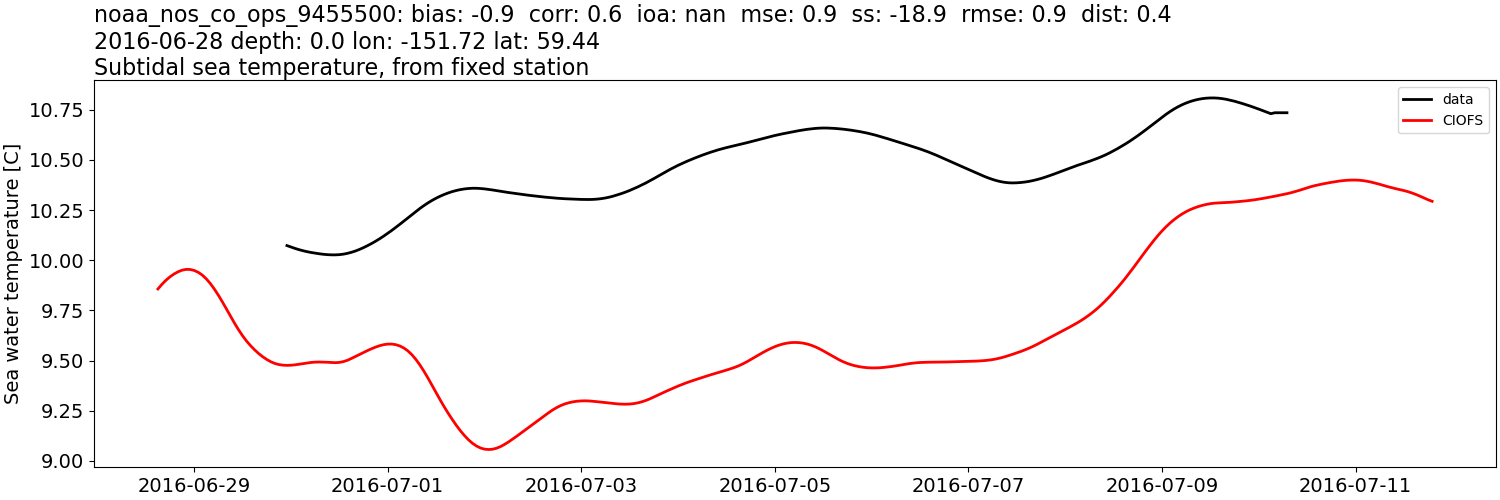
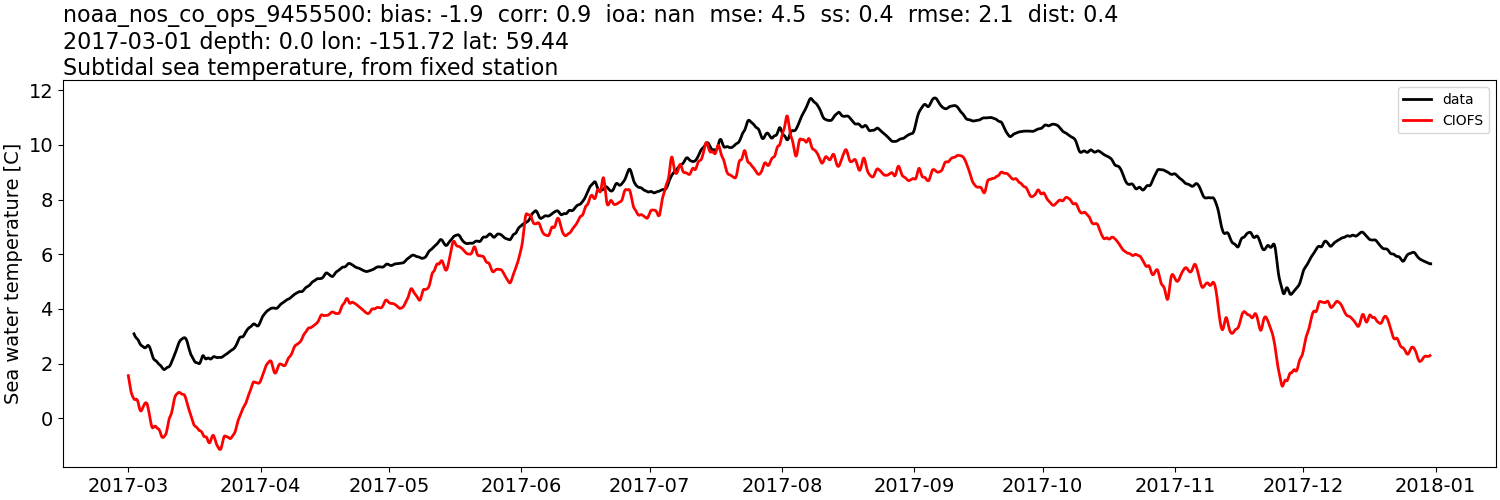
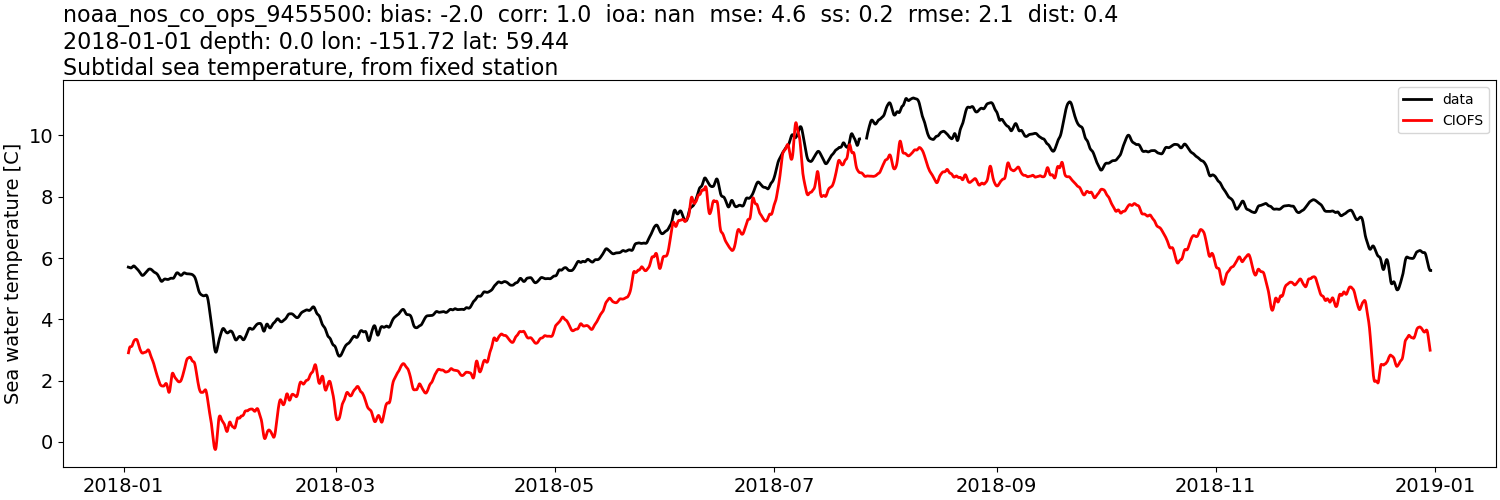
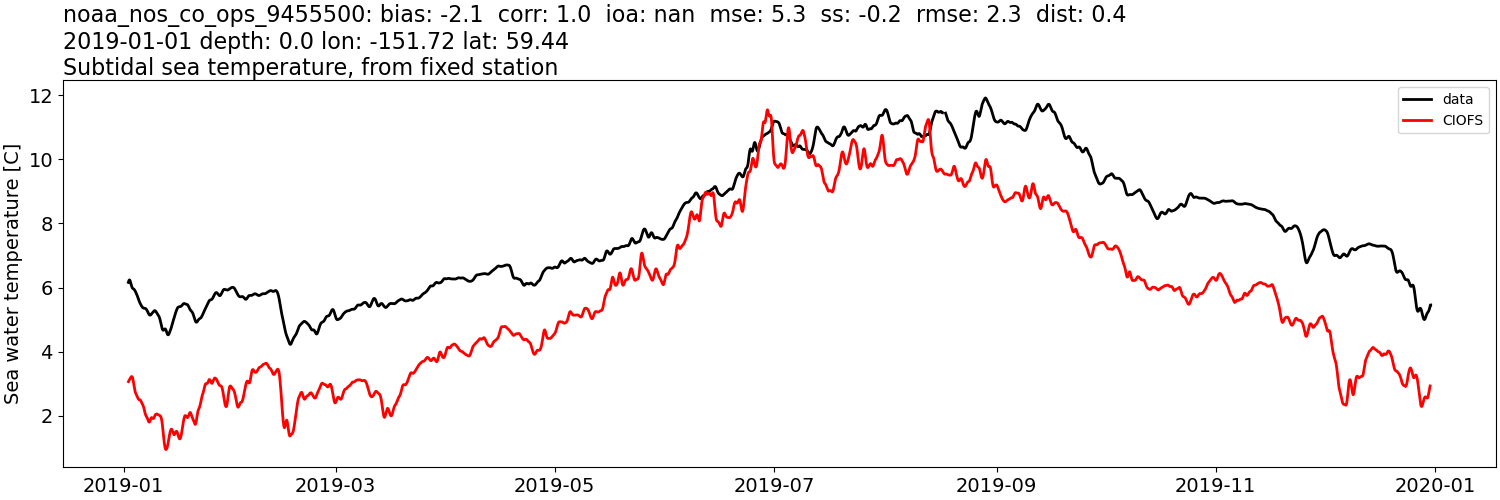
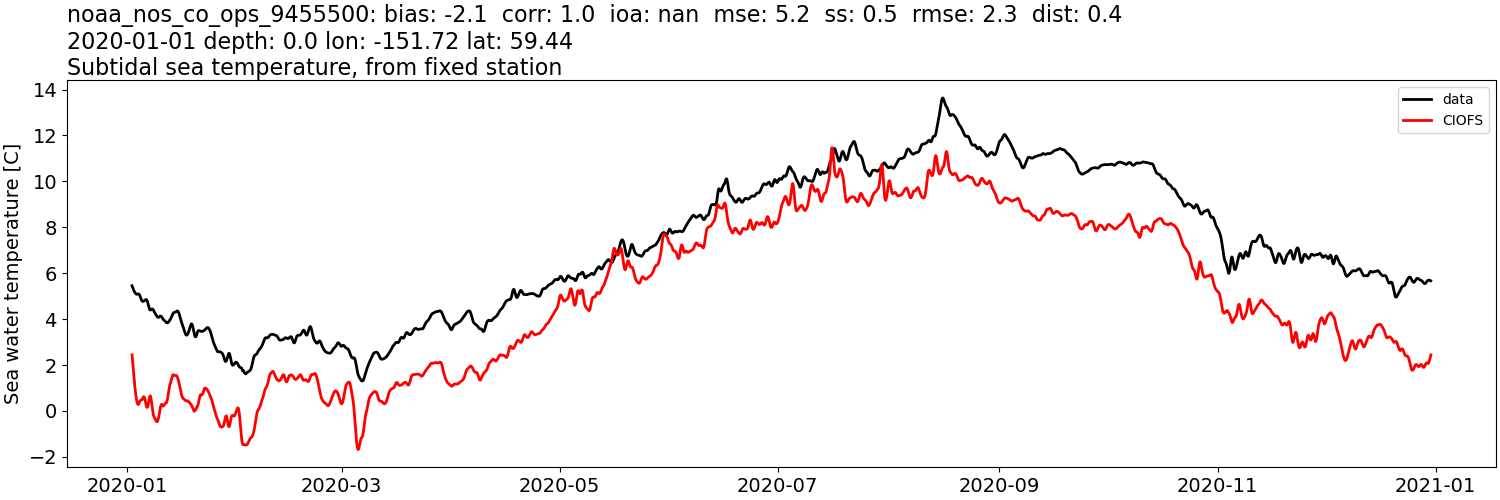
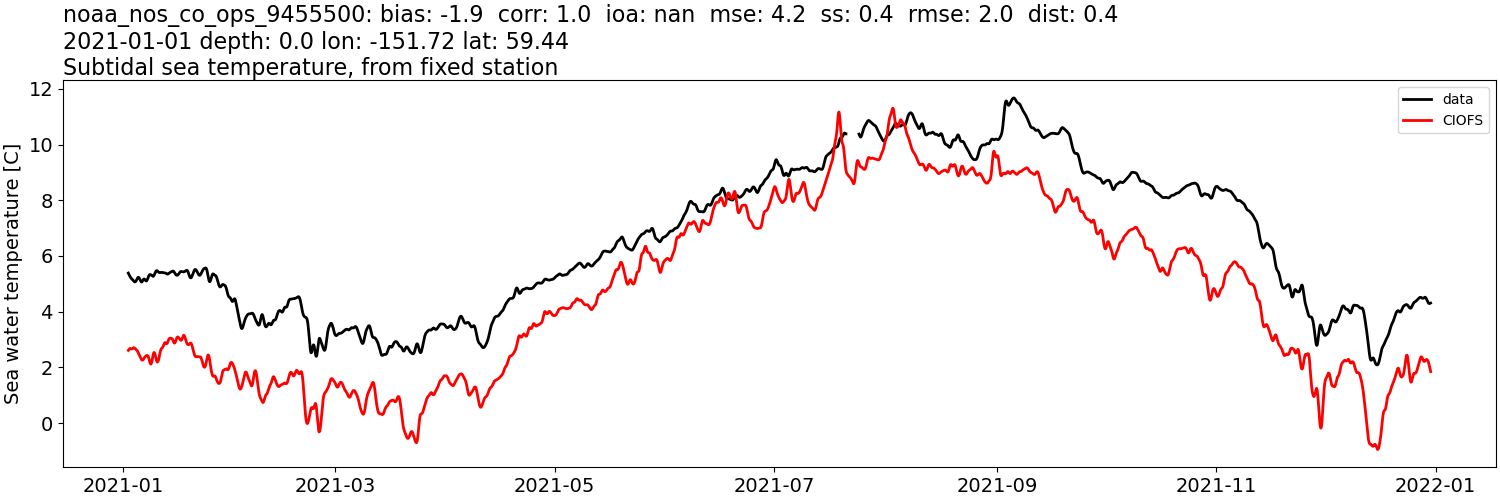
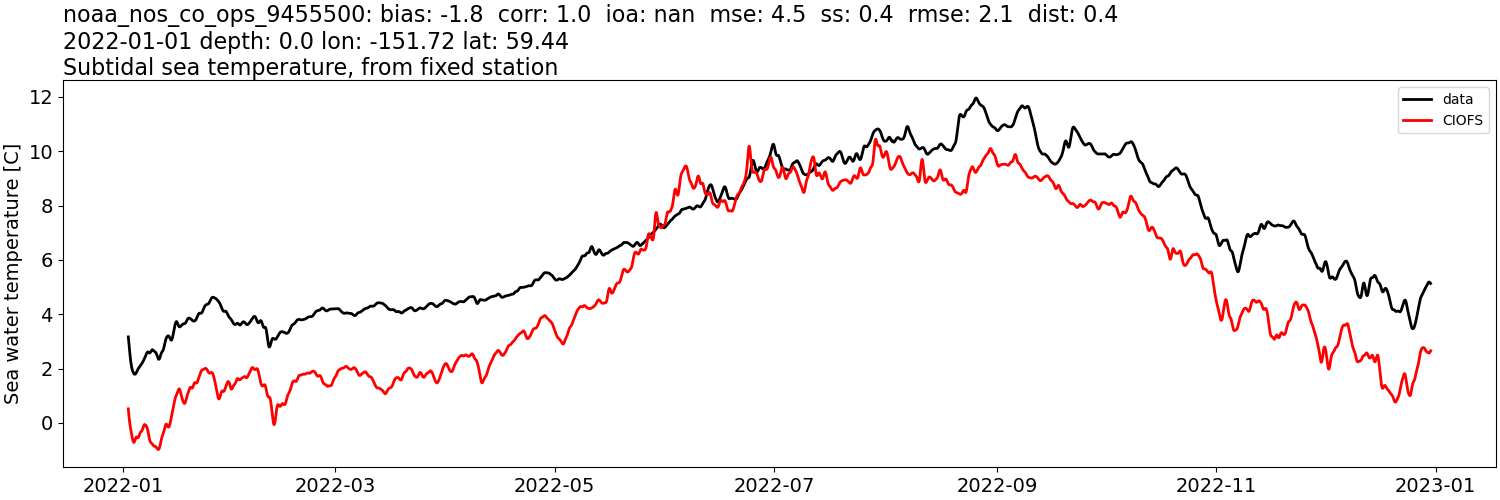
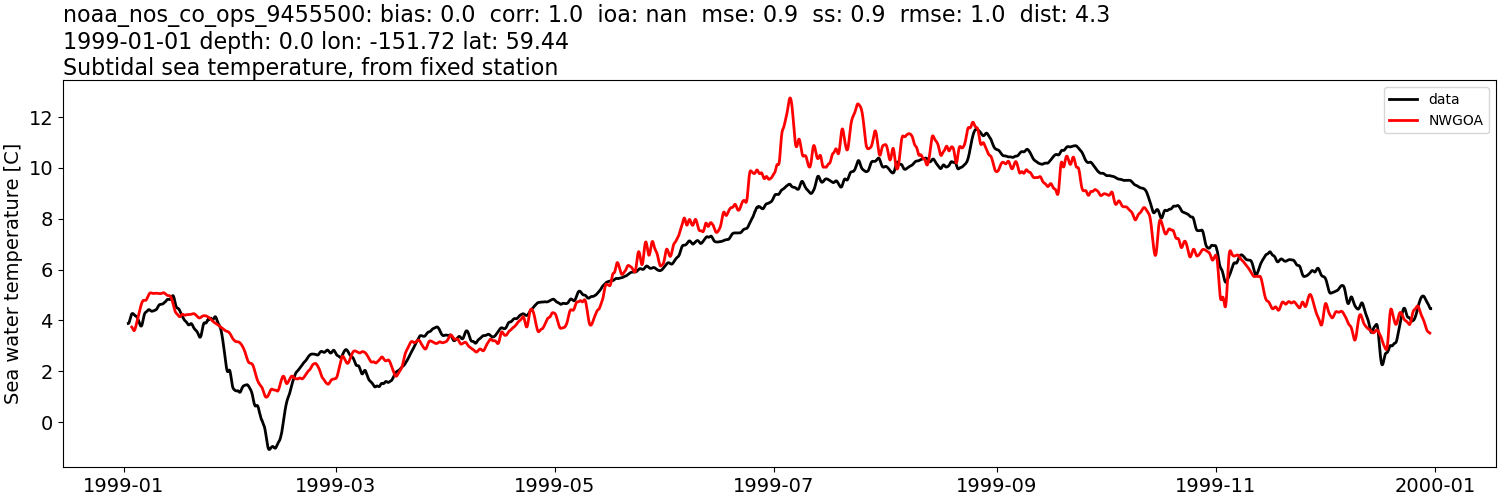
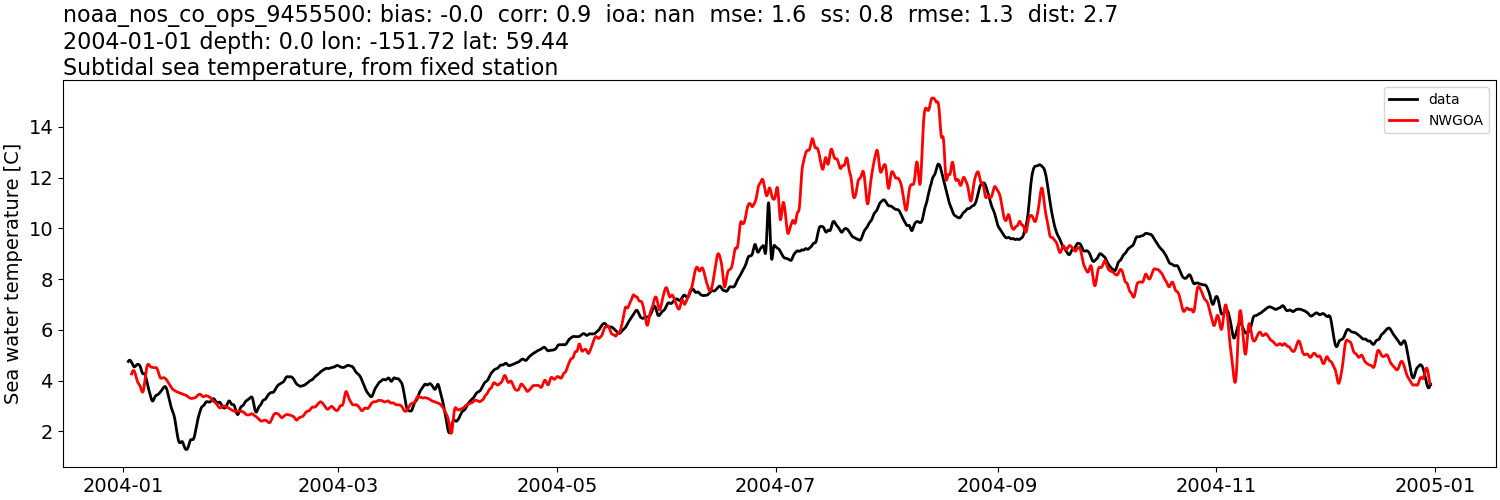
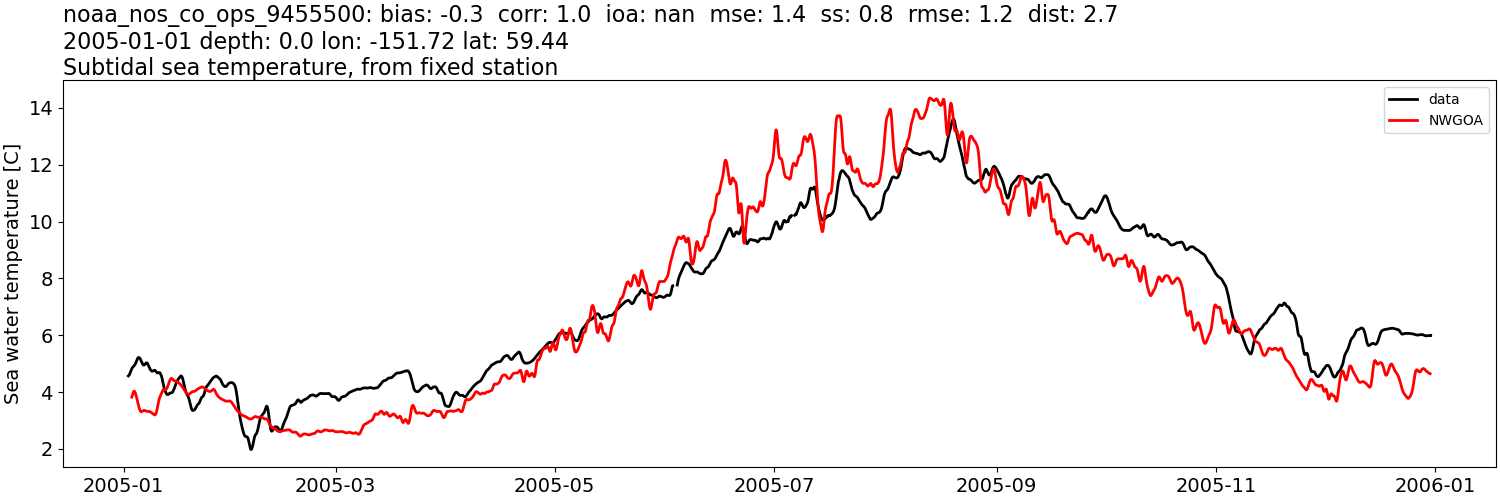
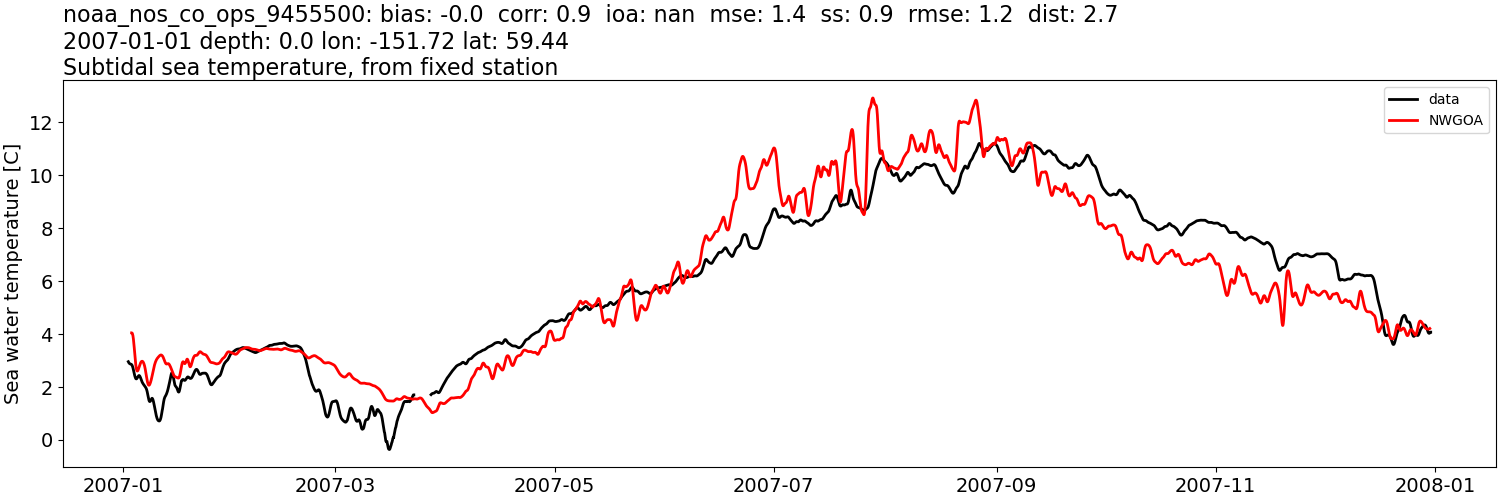
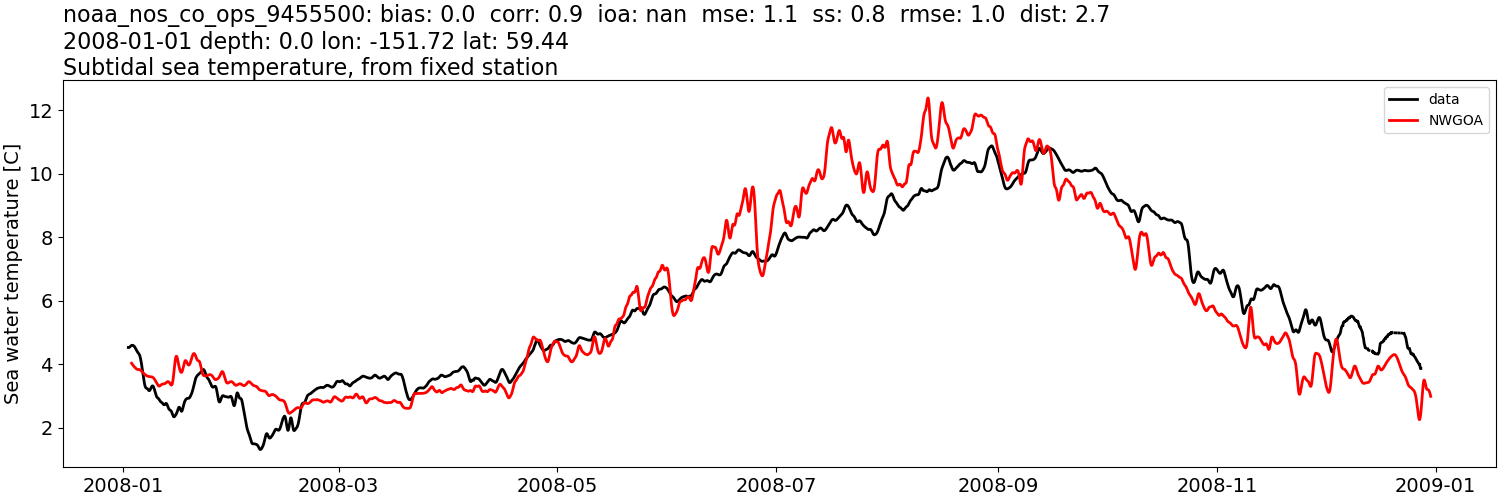
noaa_nos_co_ops_9455500#
Sea surface height: mean subtracted#
CIOFS#
Comparison plots by year
1999
2000
2001
2002
2003
2004
2005
2006
2007
2008
2009
2010
2011
2012
2013
2014
2015
2016
2017
2018
2019
2020
2021
2022
NWGOA#
Comparison plots by year
1999
2000

2001
2002
2003
2004
2005
2006
2007
2008
Sea surface height: mean subtracted, then tidally-filtered#
CIOFS#
Comparison plots by year
1999
2000

2001

2002

2003
2004

2005

2006

2007

2008

2009

2010

2011

2012

2013

2014

2015
2016

2017

2018

2019

2020
2021

2022

NWGOA#
Comparison plots by year
1999

2000

2001

2002

2003

2004

2005

2006

2007

2008

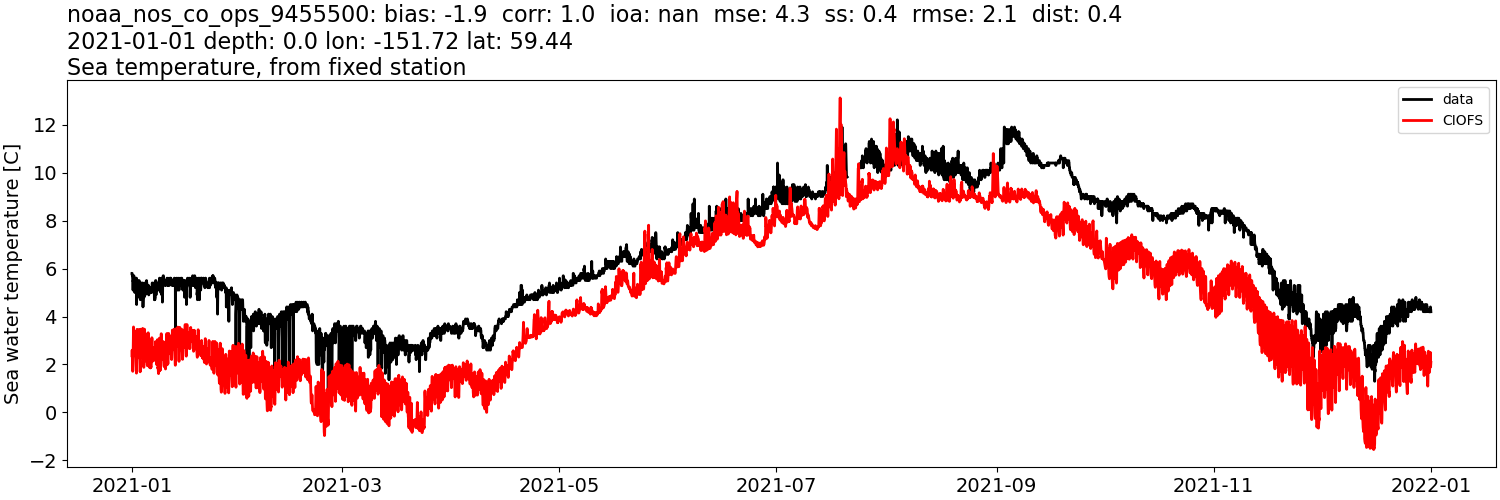
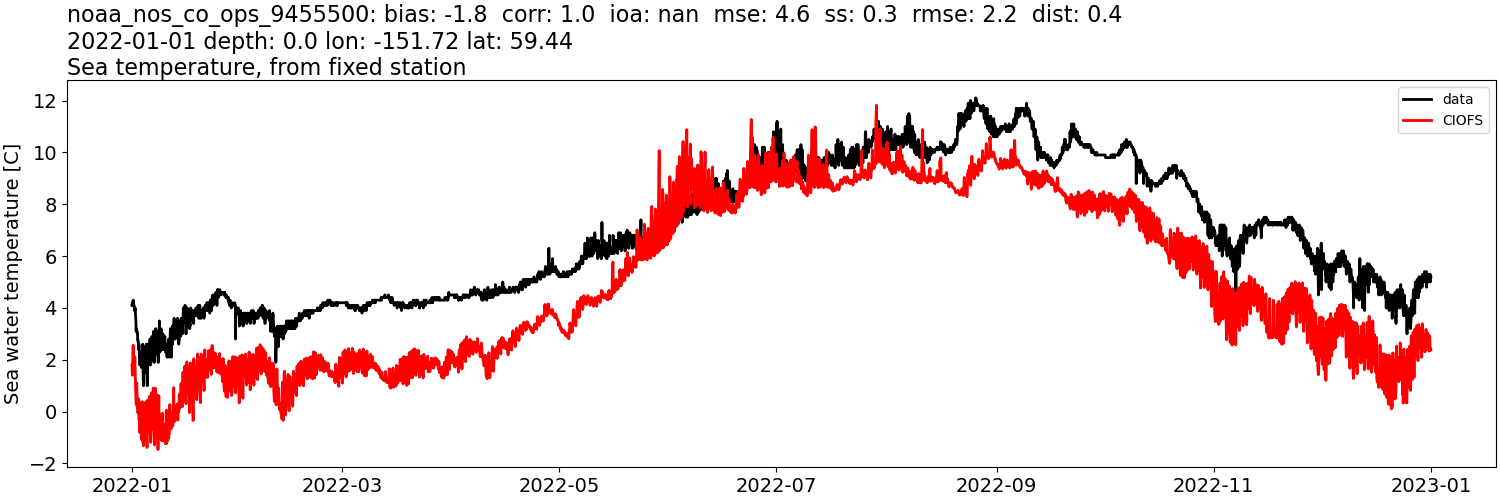
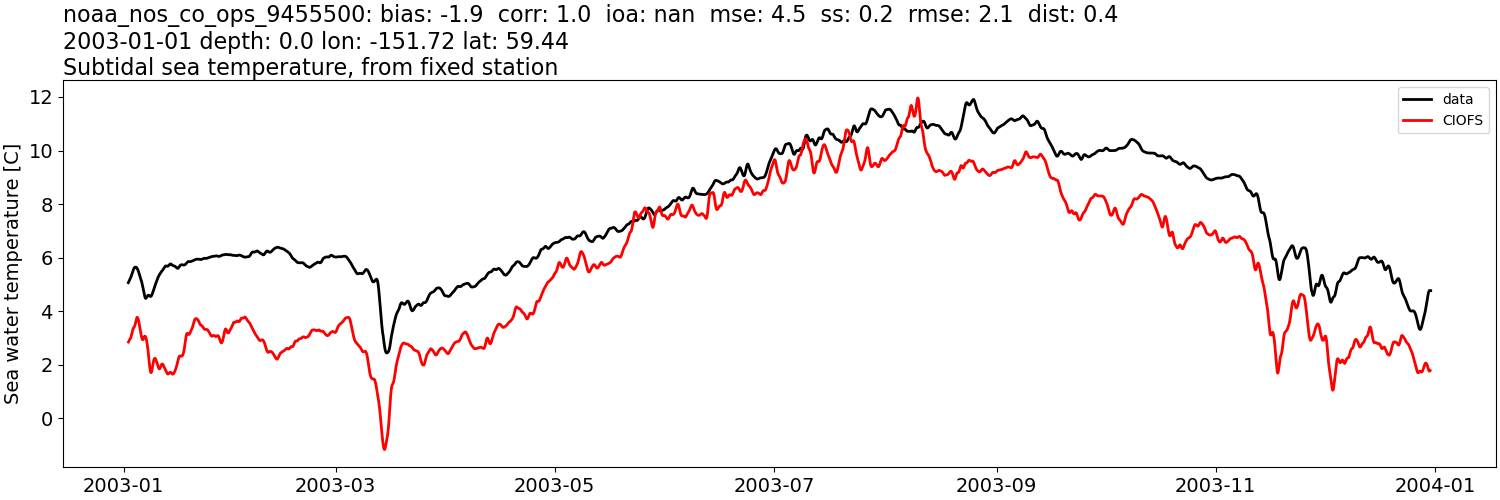
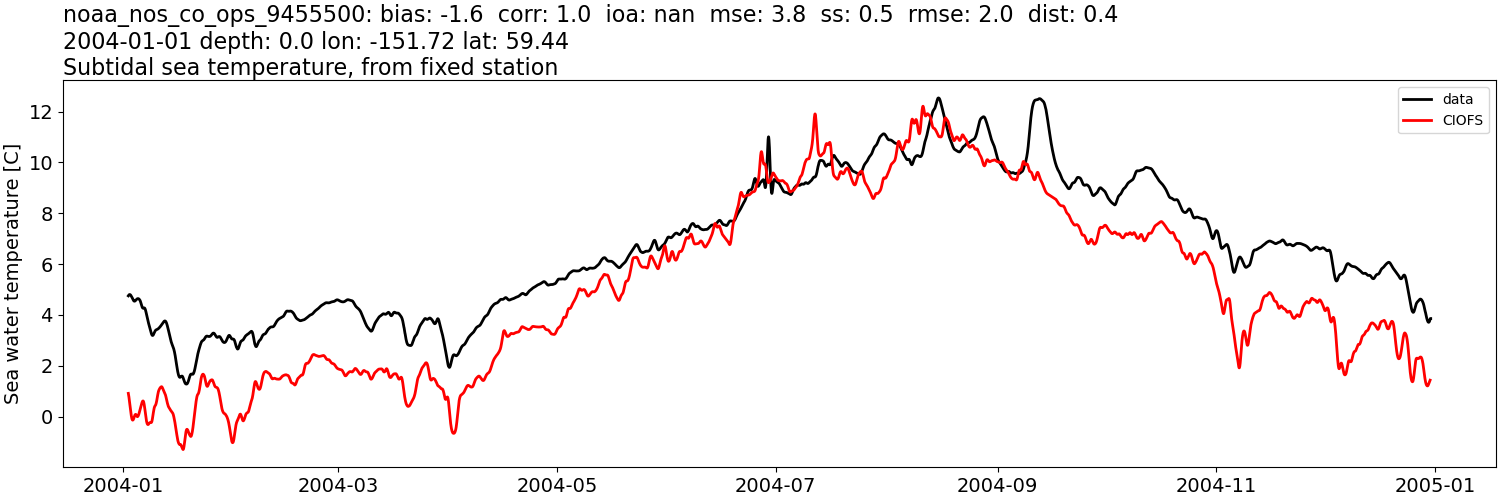
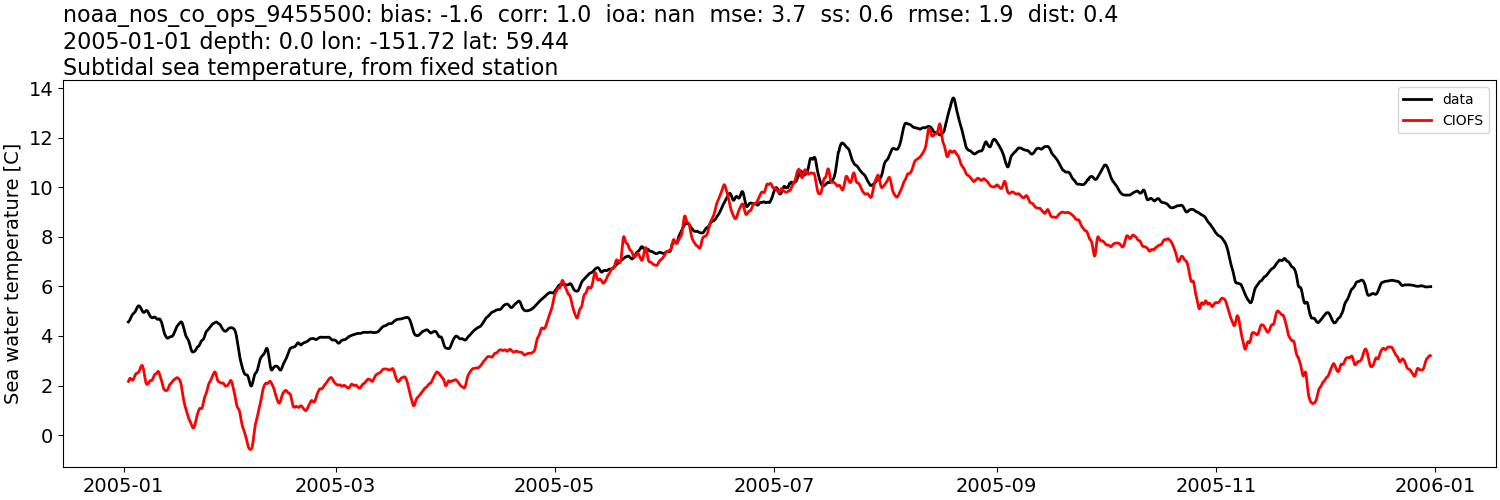
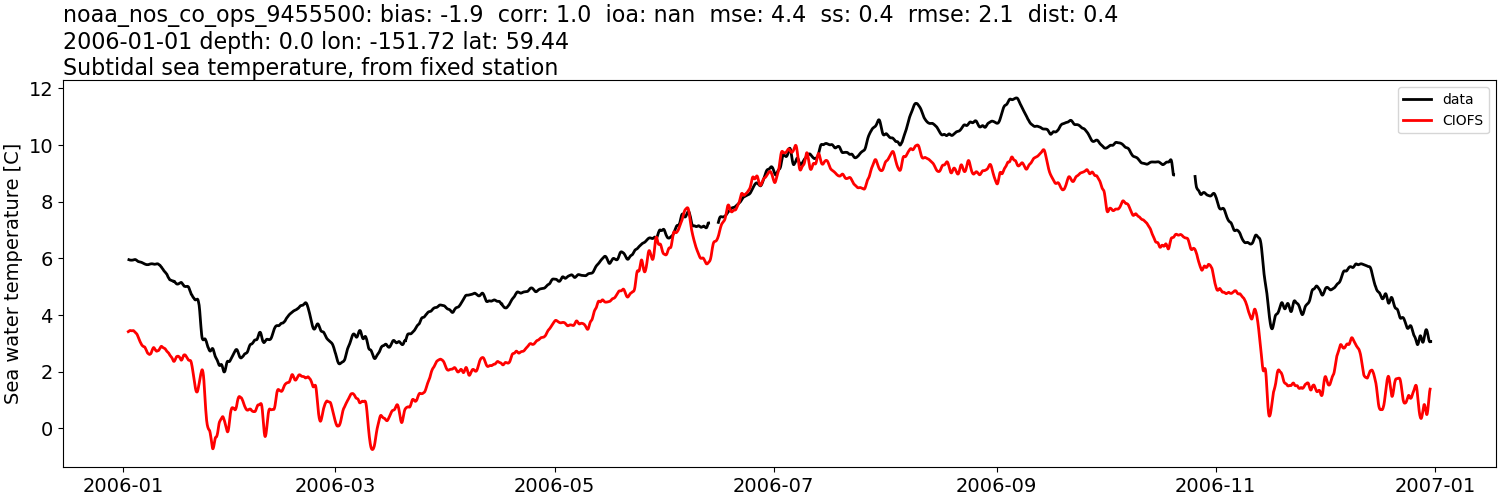
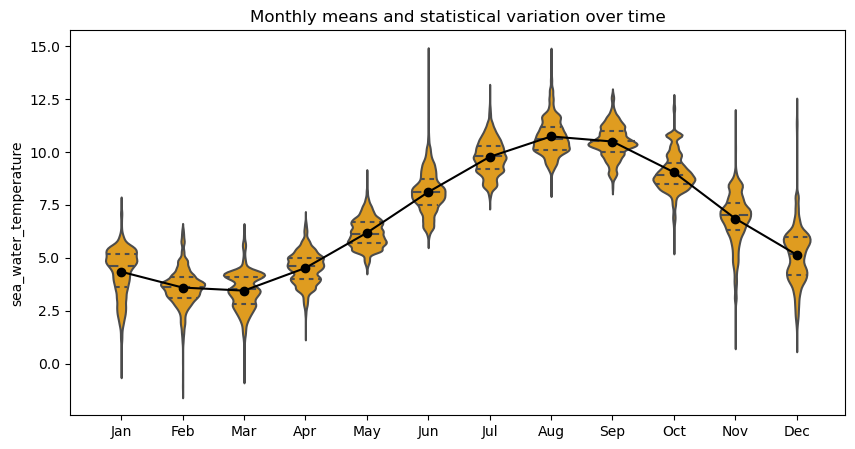
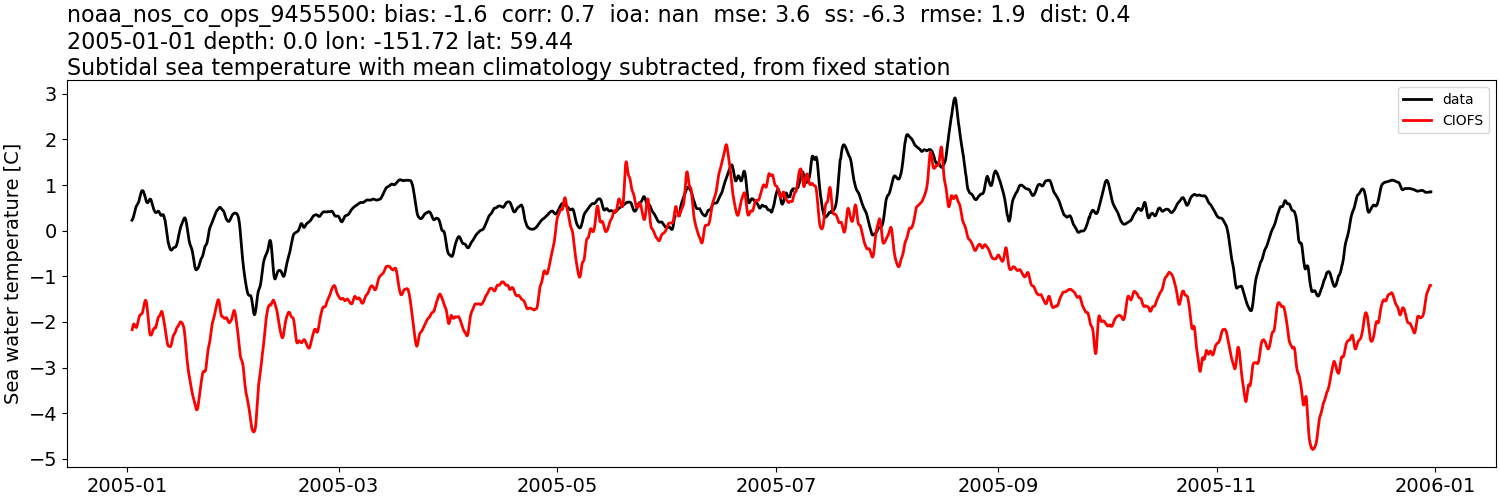
Sea water temperature:#
CIOFS#
Comparison plots by year
1999
2000
2001
2002
2003
2004
2005
2006
2007
2008
2009
2010
2011
2012
2013
2014
2015
2016
2017
2018
2019
2020
2021
2022
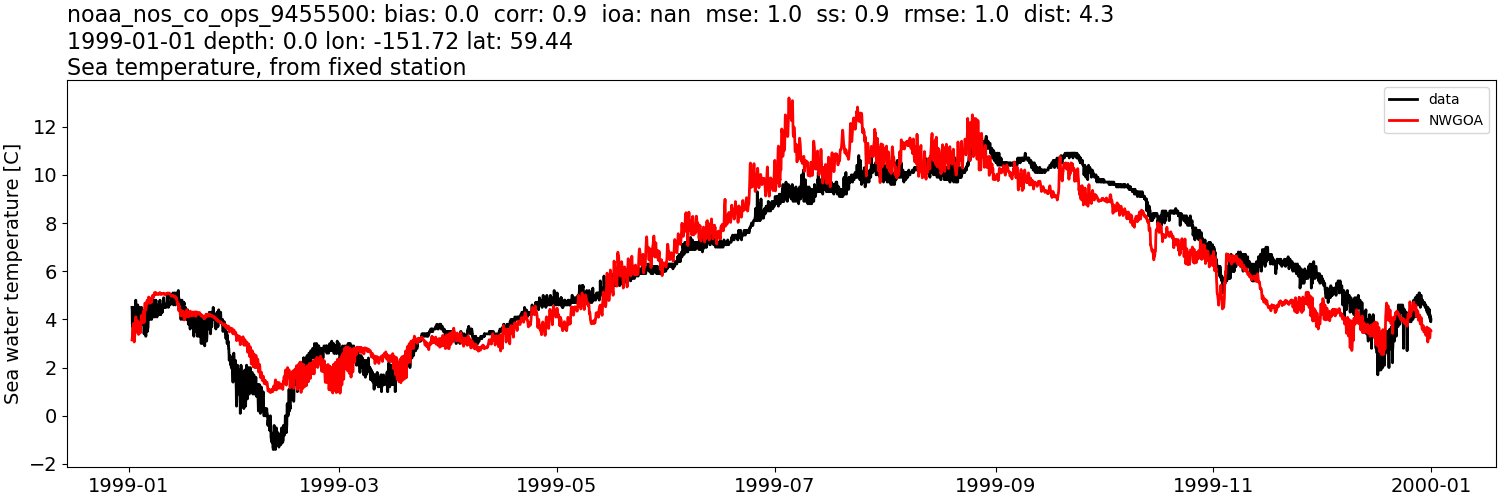
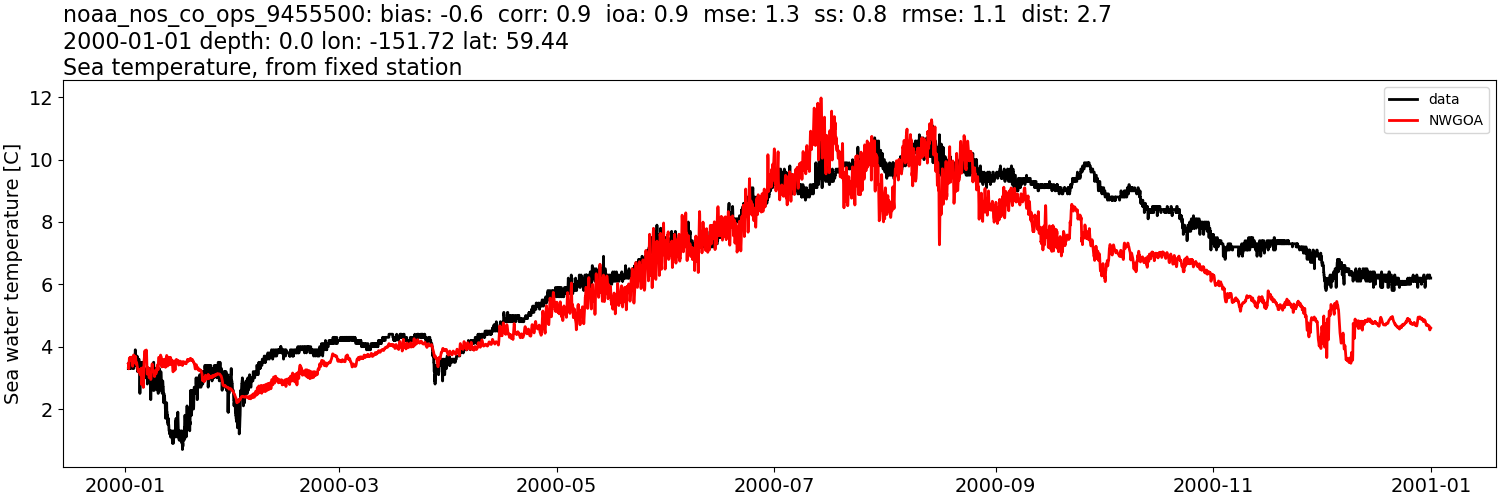
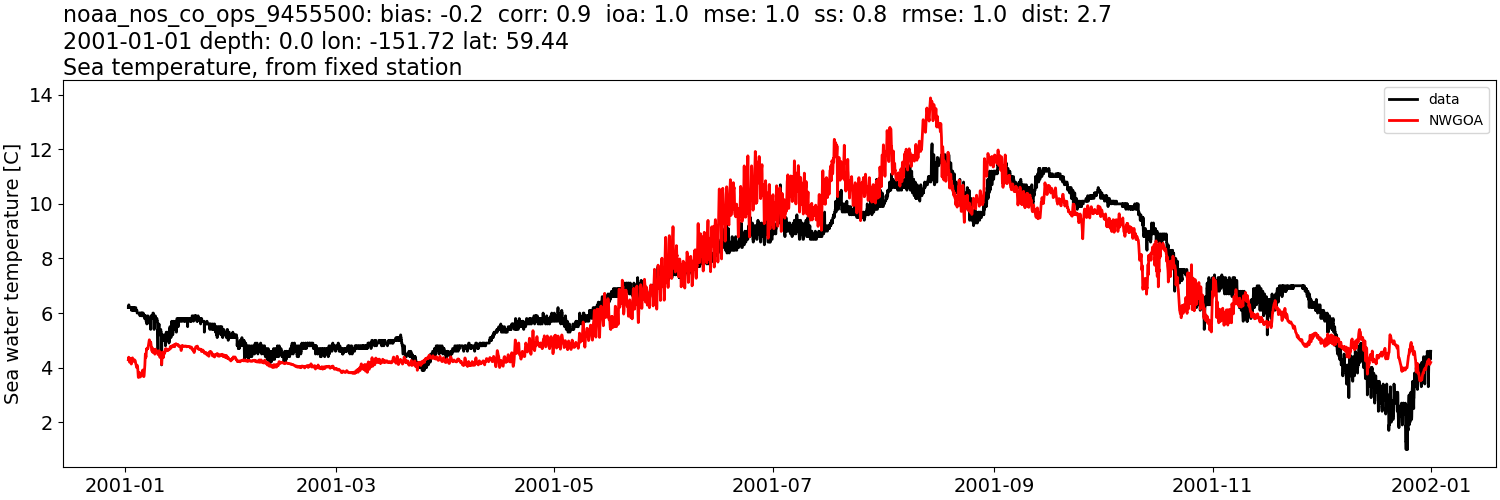
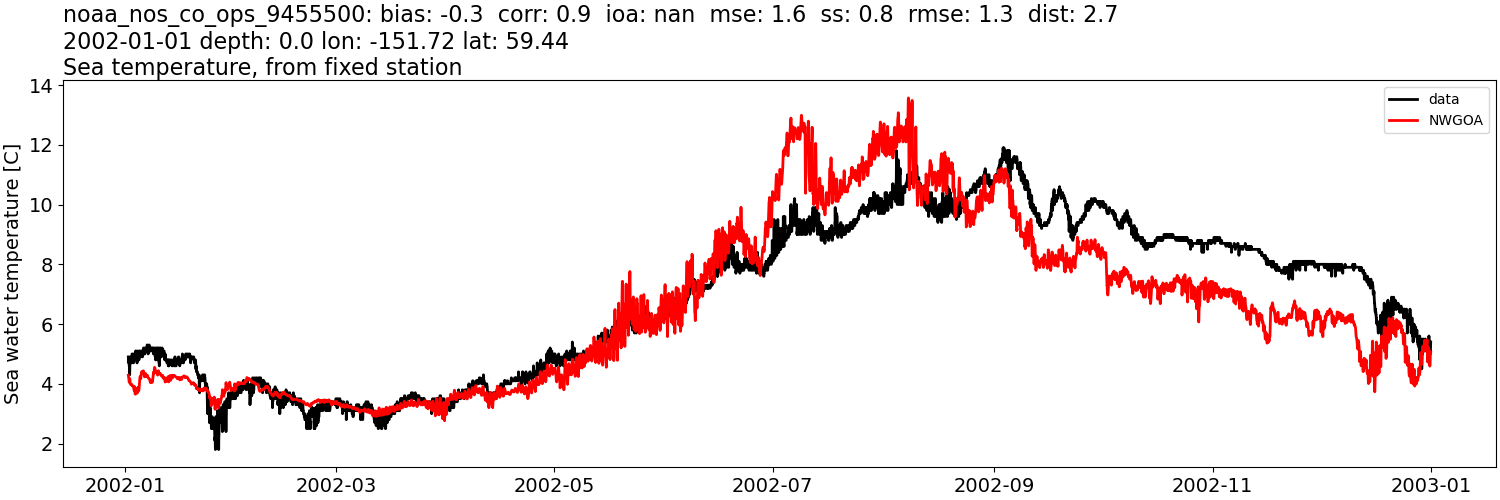
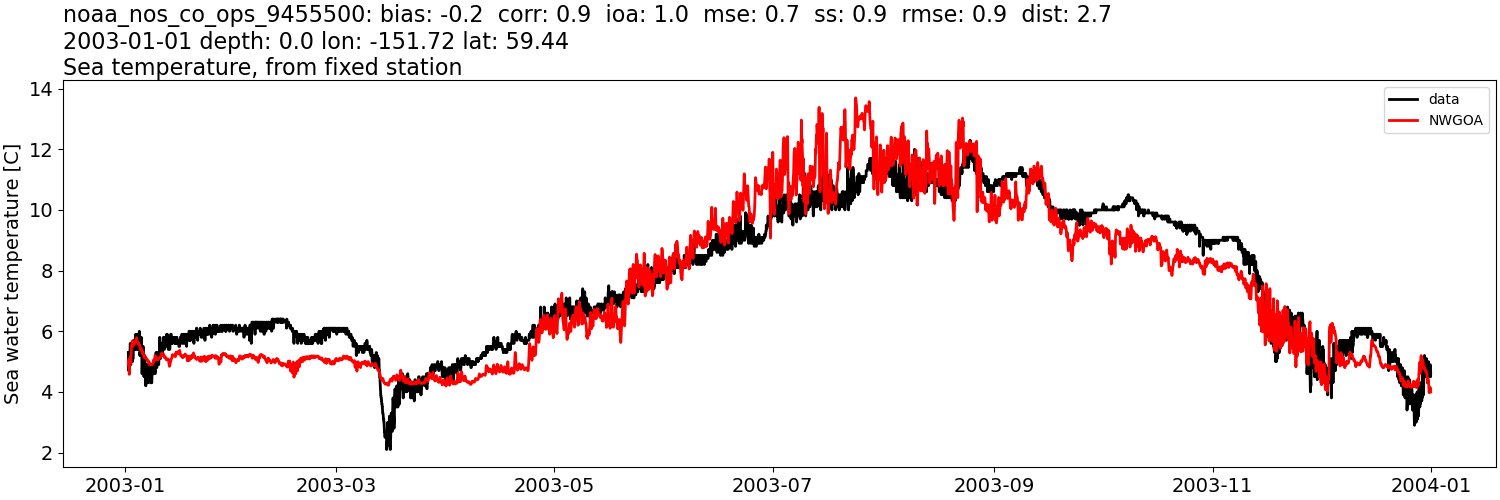
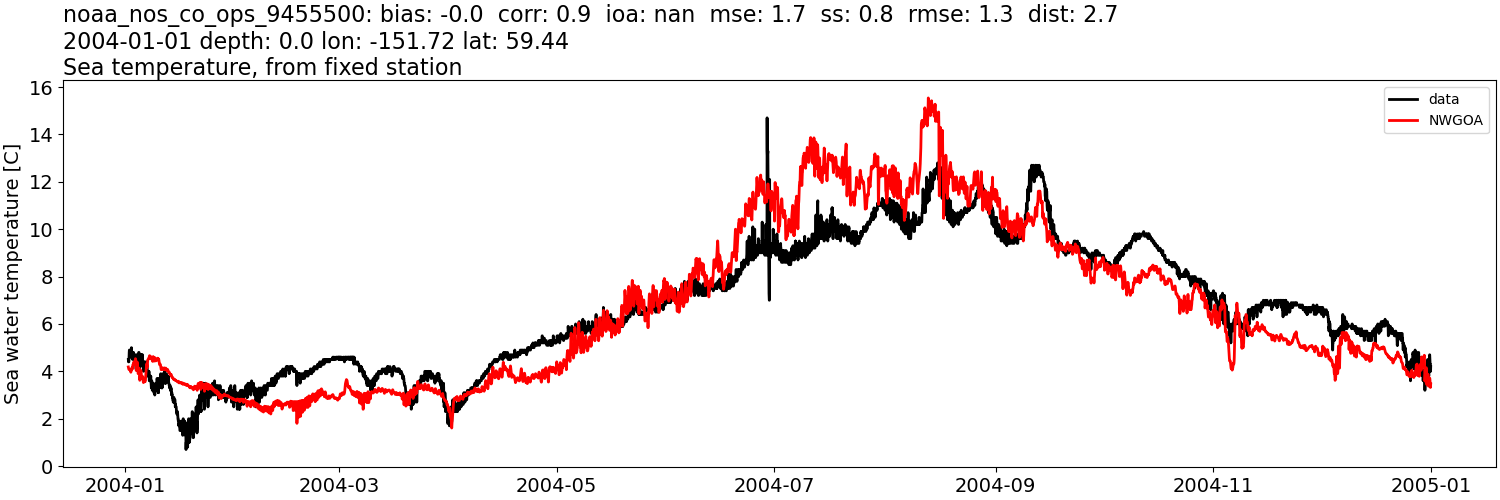
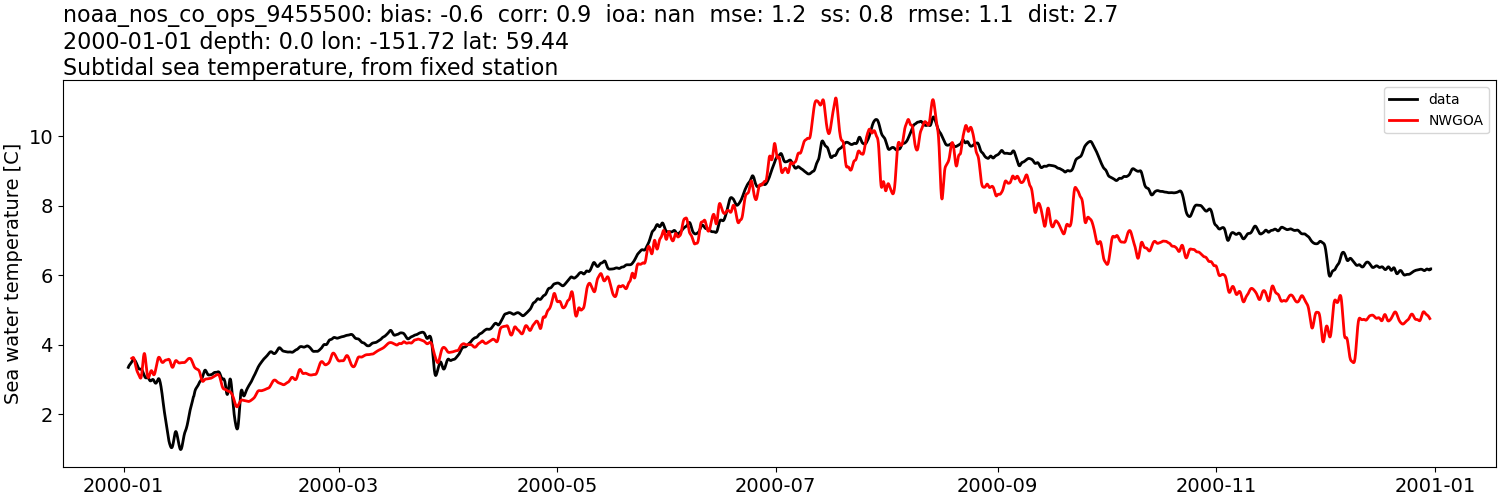
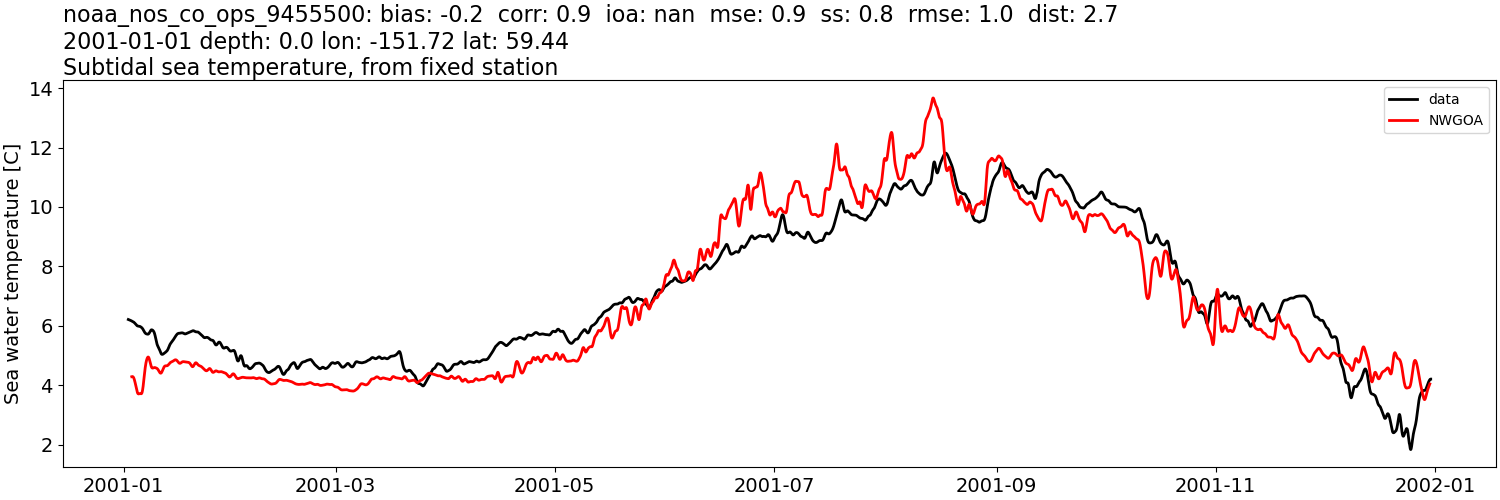
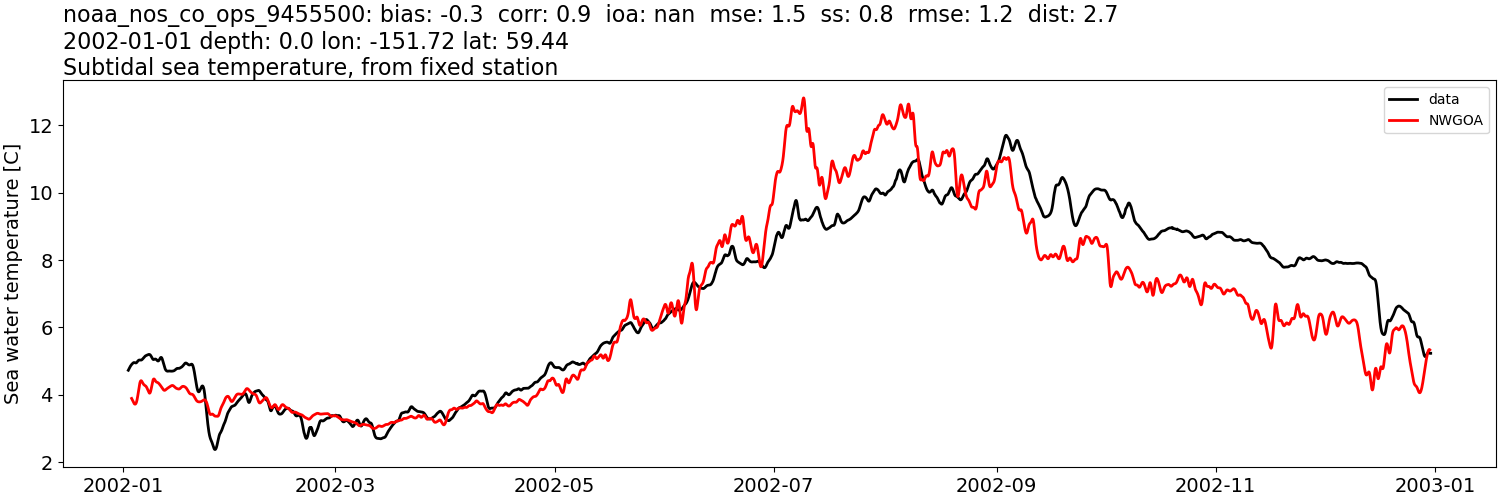
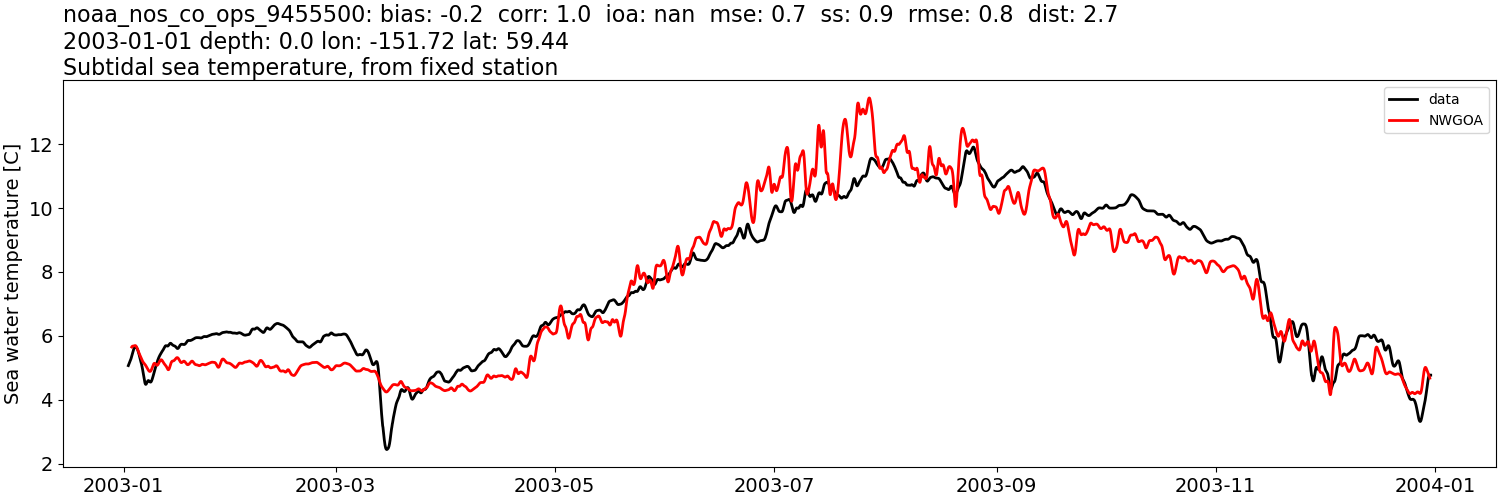
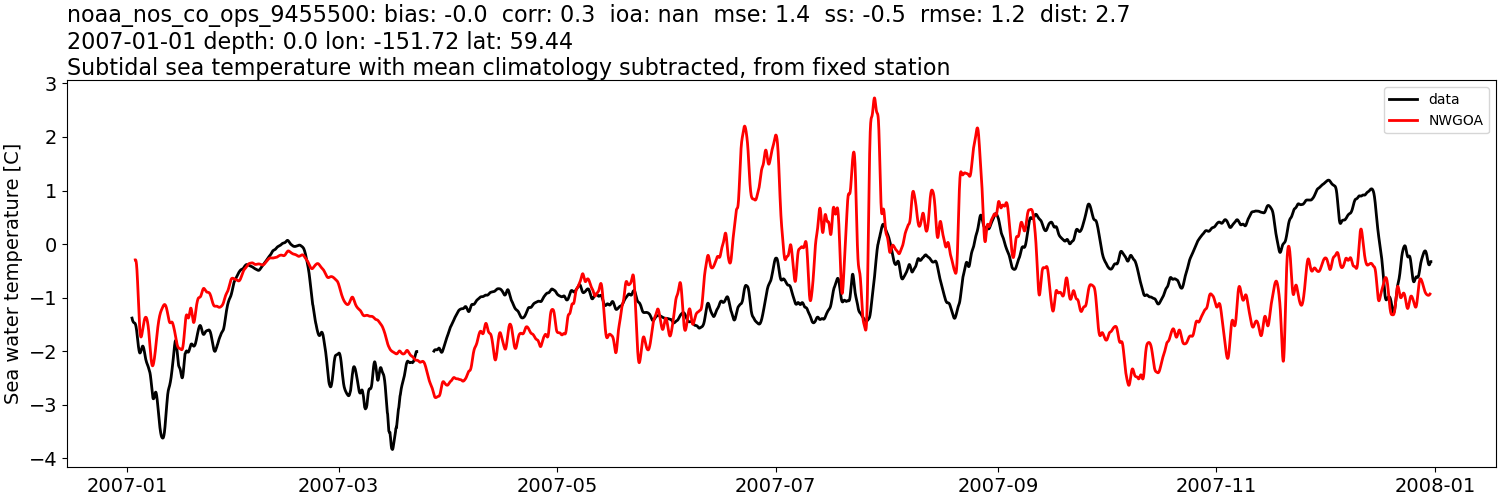
NWGOA#
Comparison plots by year
1999
2000
2001
2002
2003
2004
2005
2006
2007
2008
Sea water temperature: tidally-filtered#
CIOFS#
Comparison plots by year
1999
2000
2001
2002
2003
2004
2005
2006
2007
2008
2009
2010
2011
2012
2013
2014

2015
2016
2017
2018
2019
2020
2021
2022
NWGOA#
Comparison plots by year
1999
2000
2001
2002
2003
2004
2005
2006

2007
2008
Sea water temperature: tidally-filtered, then monthly mean from data subtracted#
CIOFS#
Comparison plots by year
1999

2000

2001

2002

2003

2004

2005
2006

2007

2008

2009

2010

2011

2012

2013

2014

2015

2016

2017

2018

2019

2020

2021

2022

NWGOA#
Comparison plots by year
1999

2000

2001

2002

2003

2004

2005

2006

2007
2008

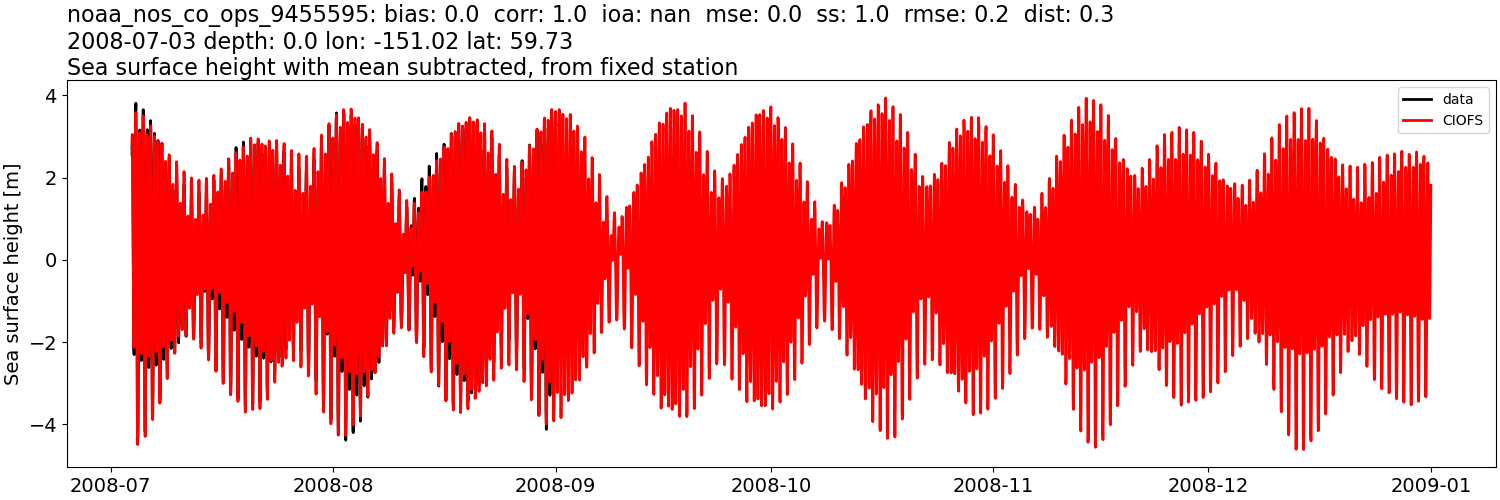
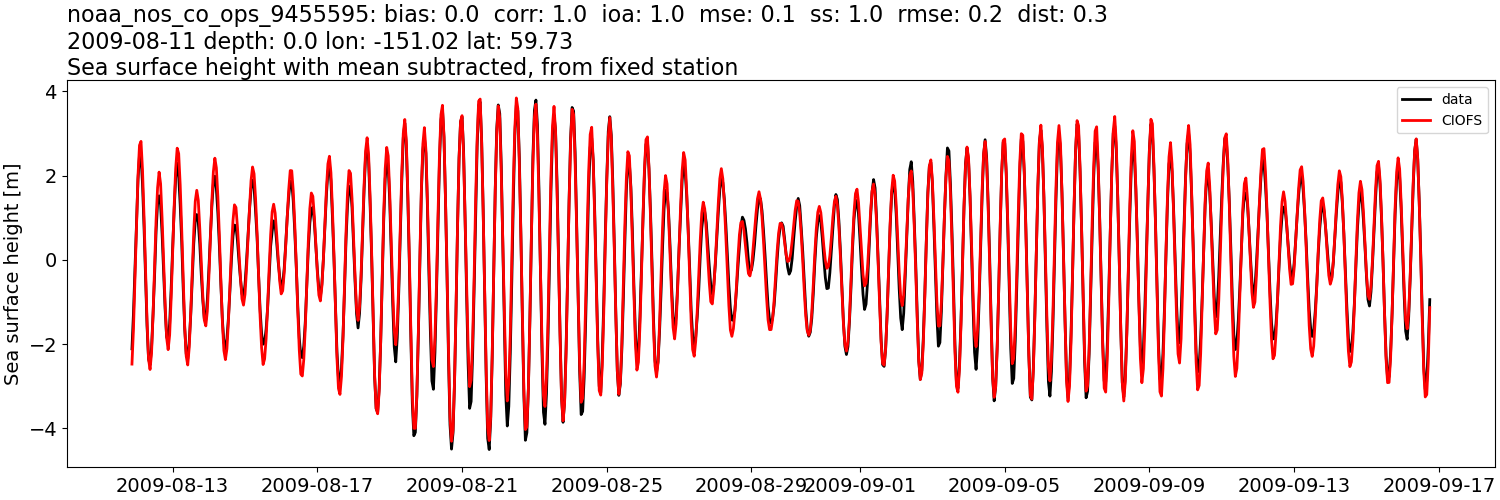
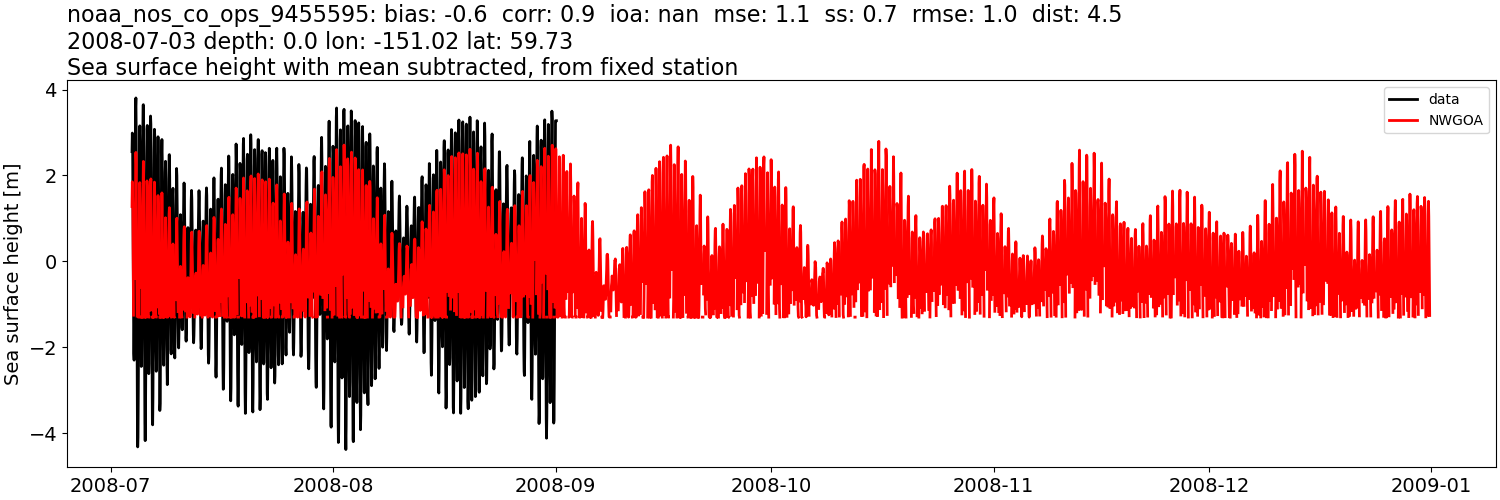
noaa_nos_co_ops_9455595#
Sea surface height: mean subtracted#
CIOFS#
Comparison plots by year
2008
2009
NWGOA#
Comparison plots by year
2008
Sea surface height: mean subtracted, then tidally-filtered#
CIOFS#
Comparison plots by year
2008

2009

NWGOA#
Comparison plots by year
2008

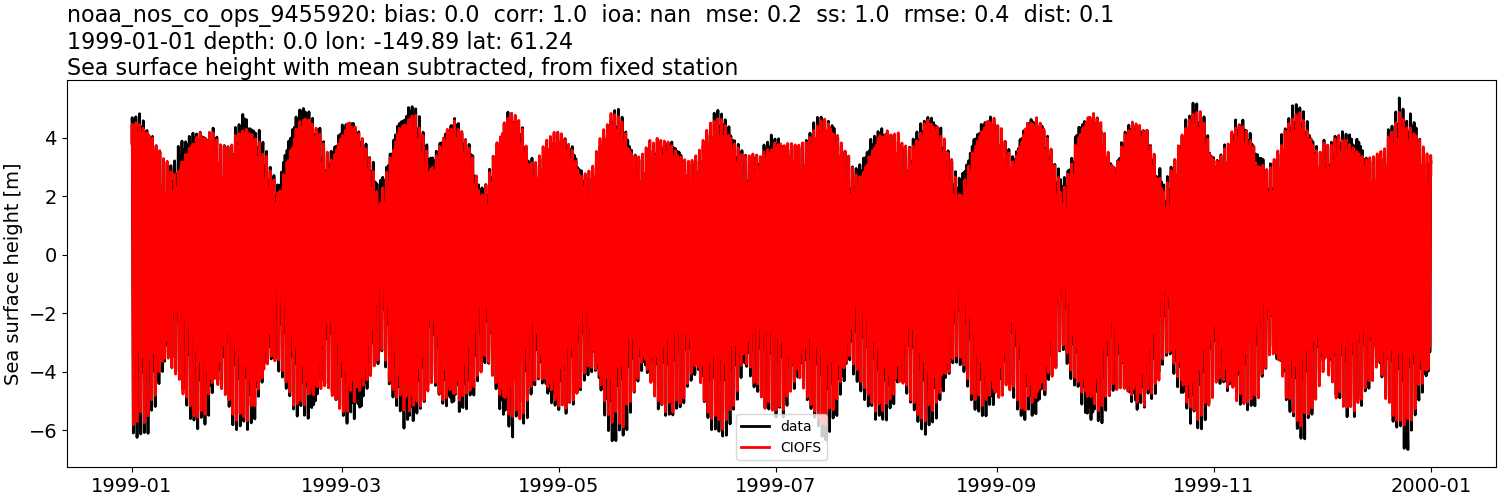
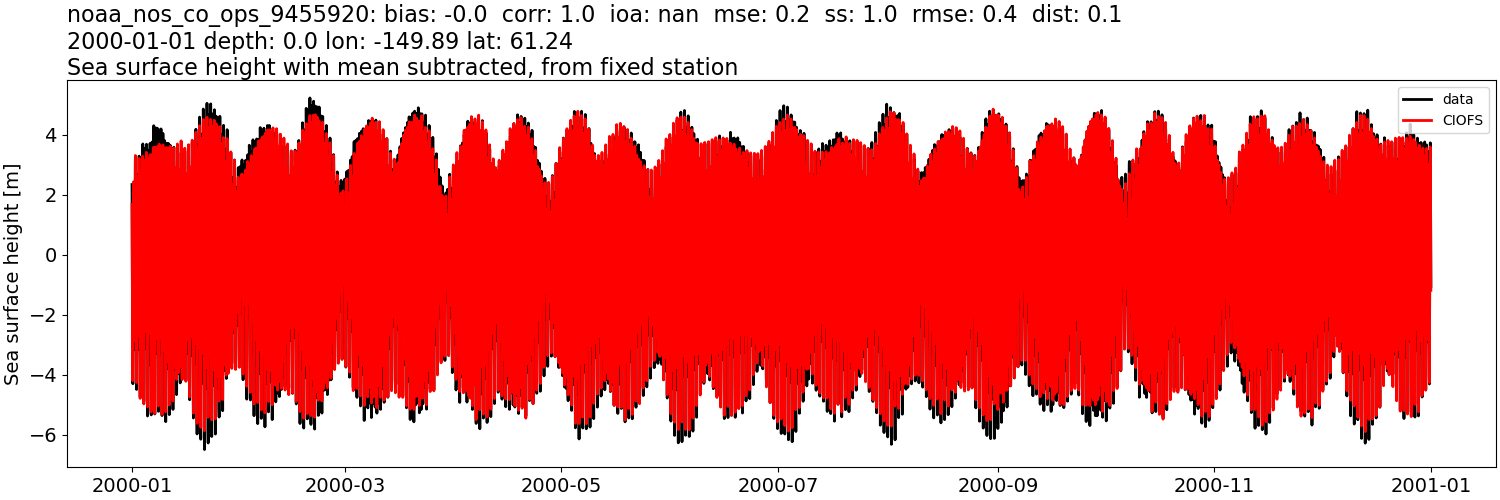
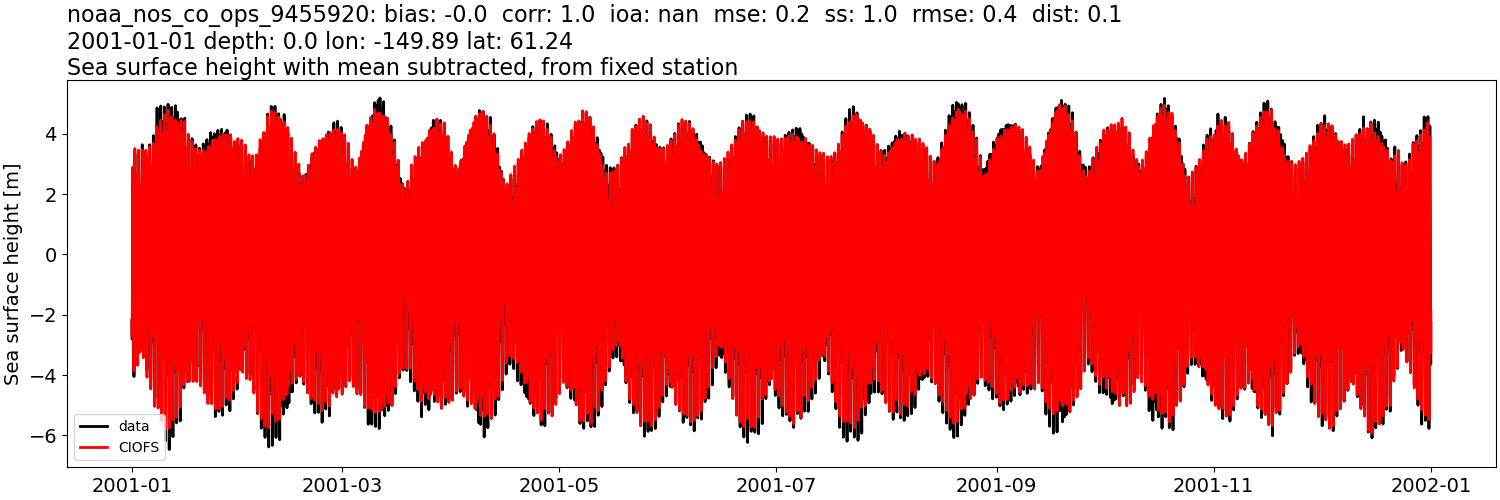
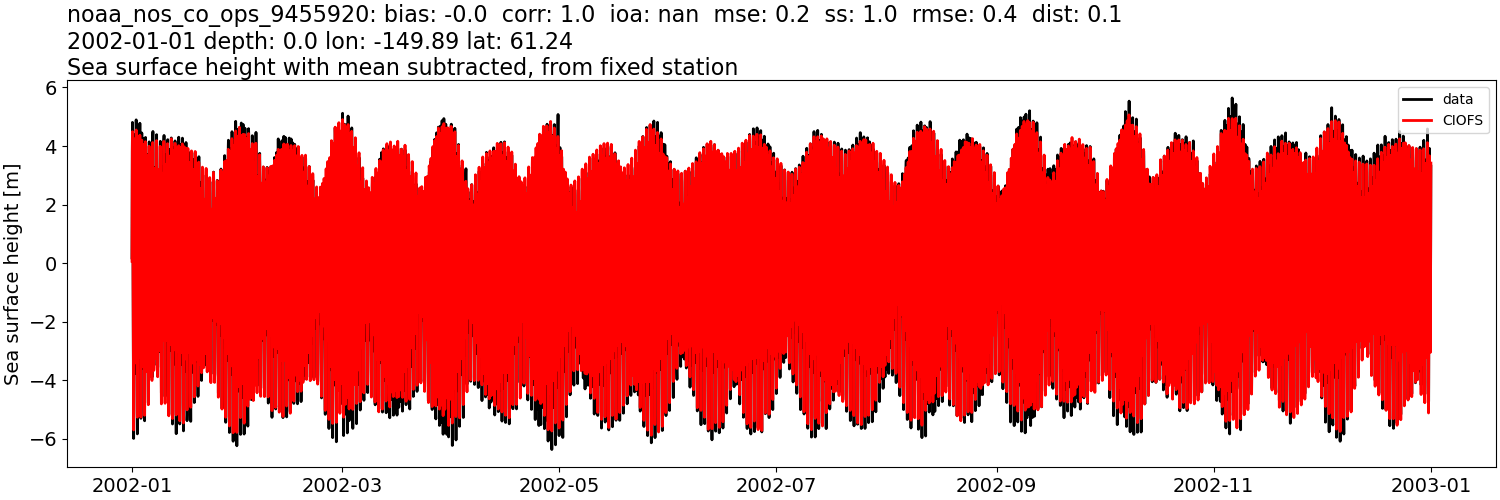
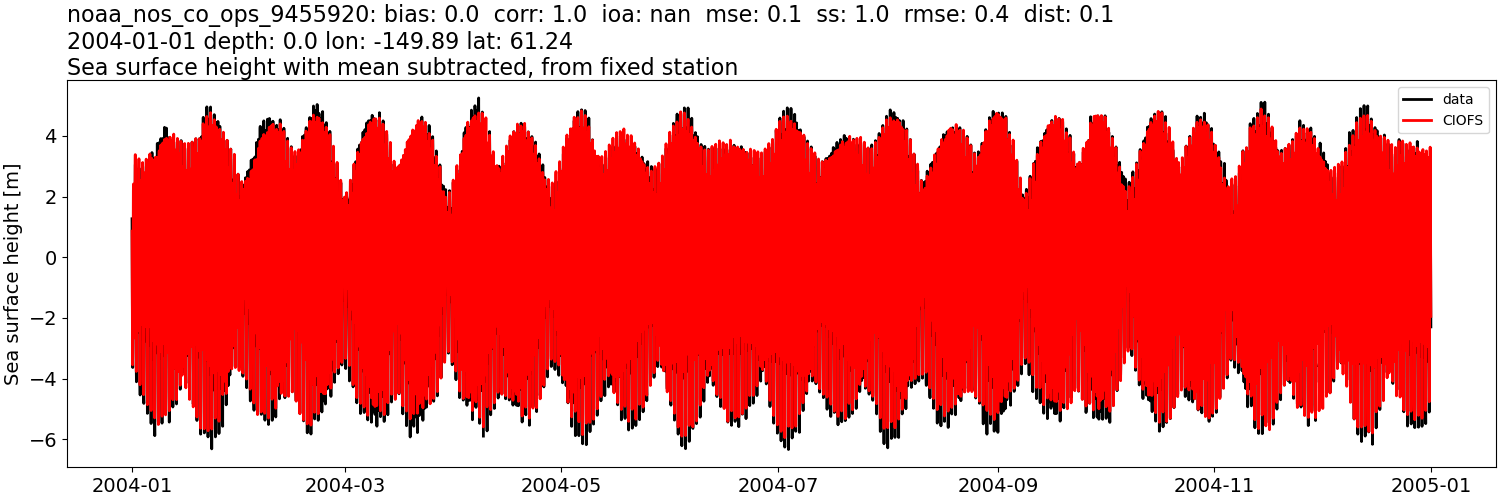
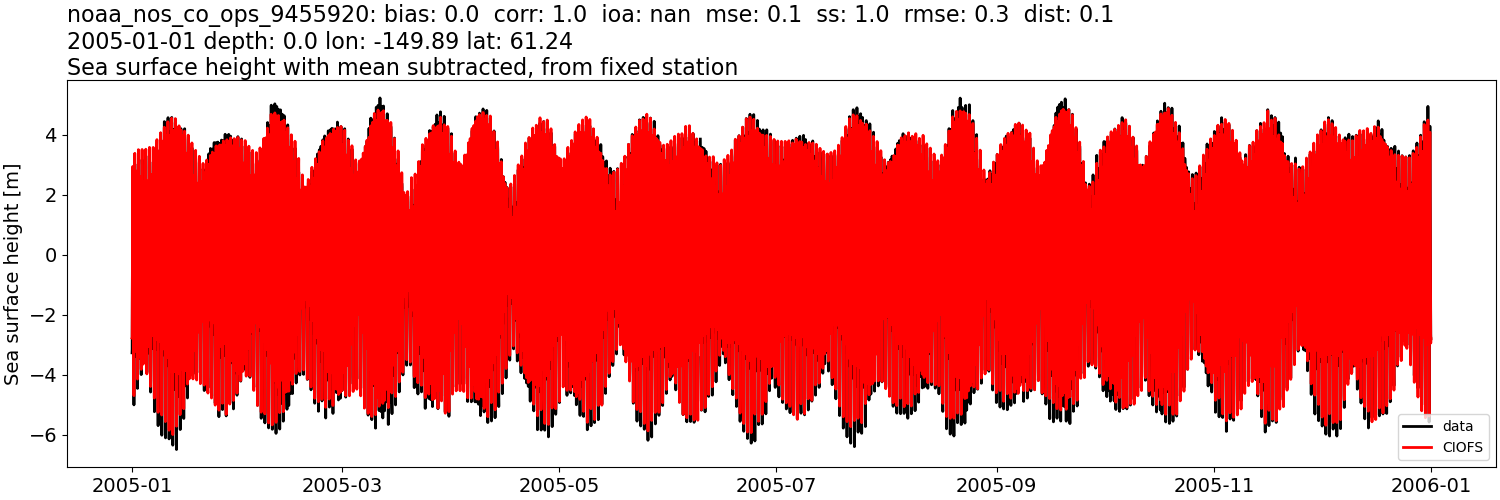
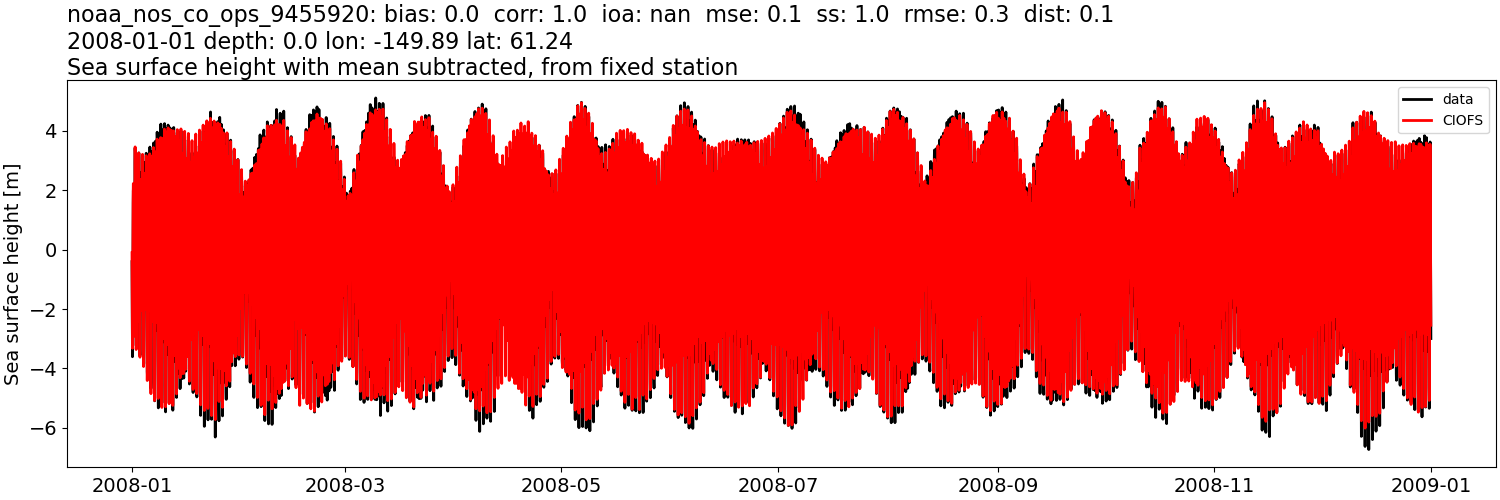
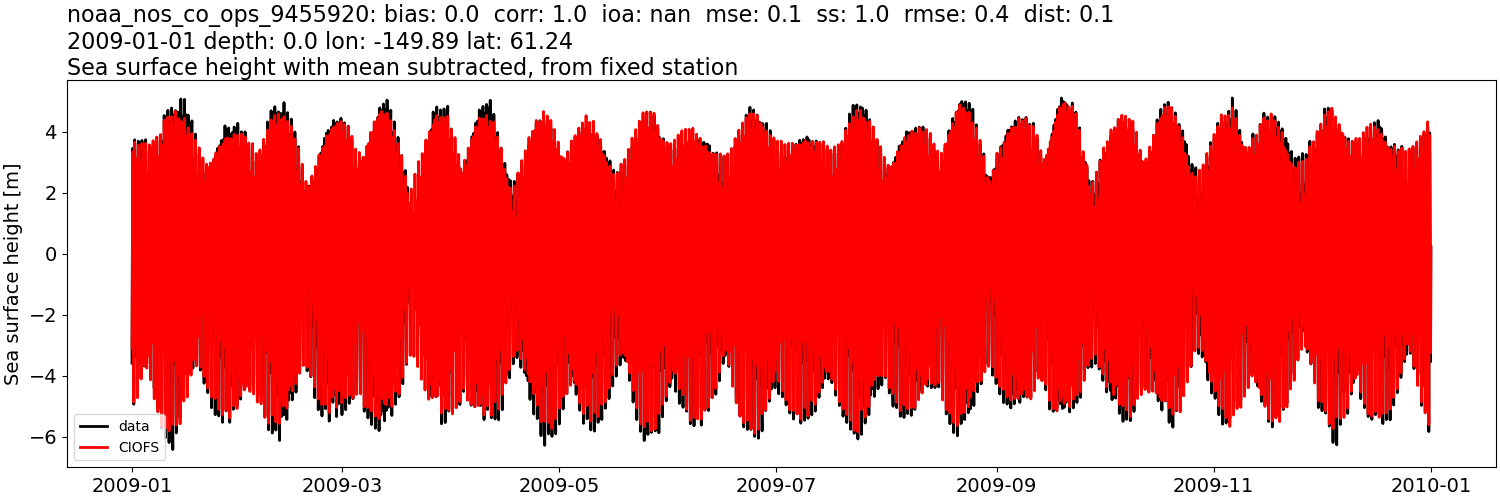
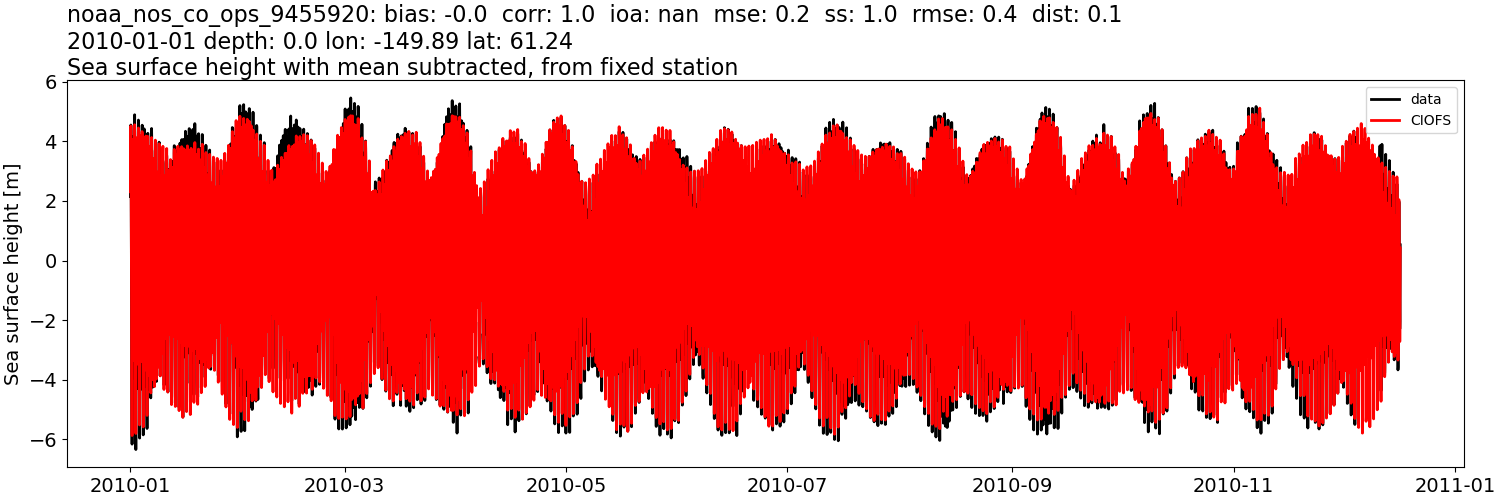
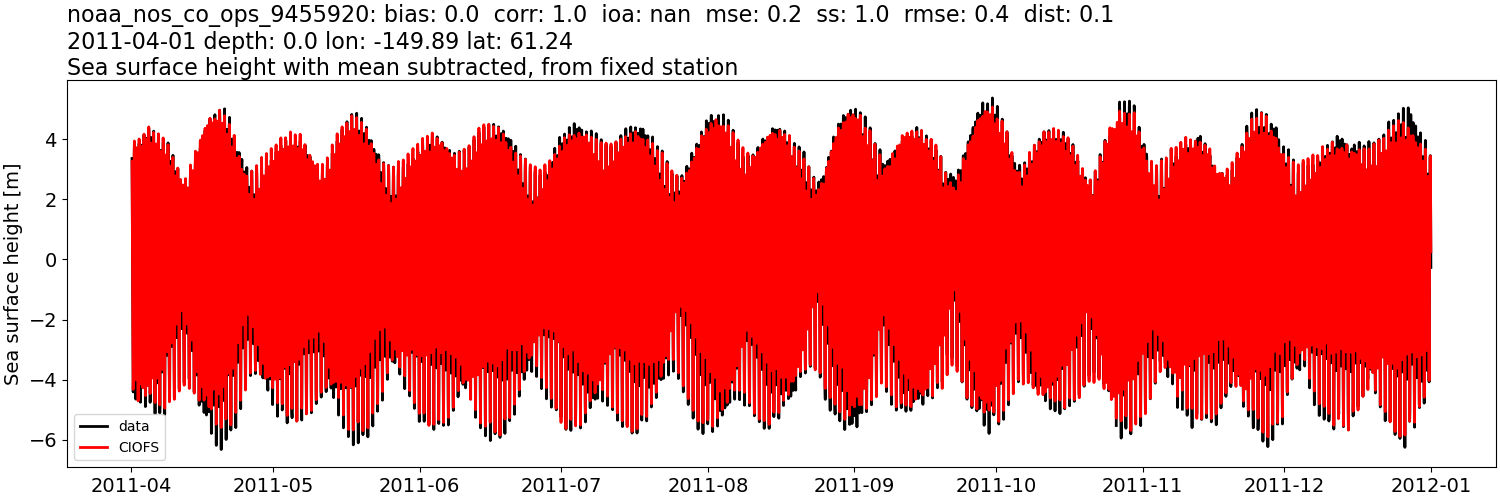
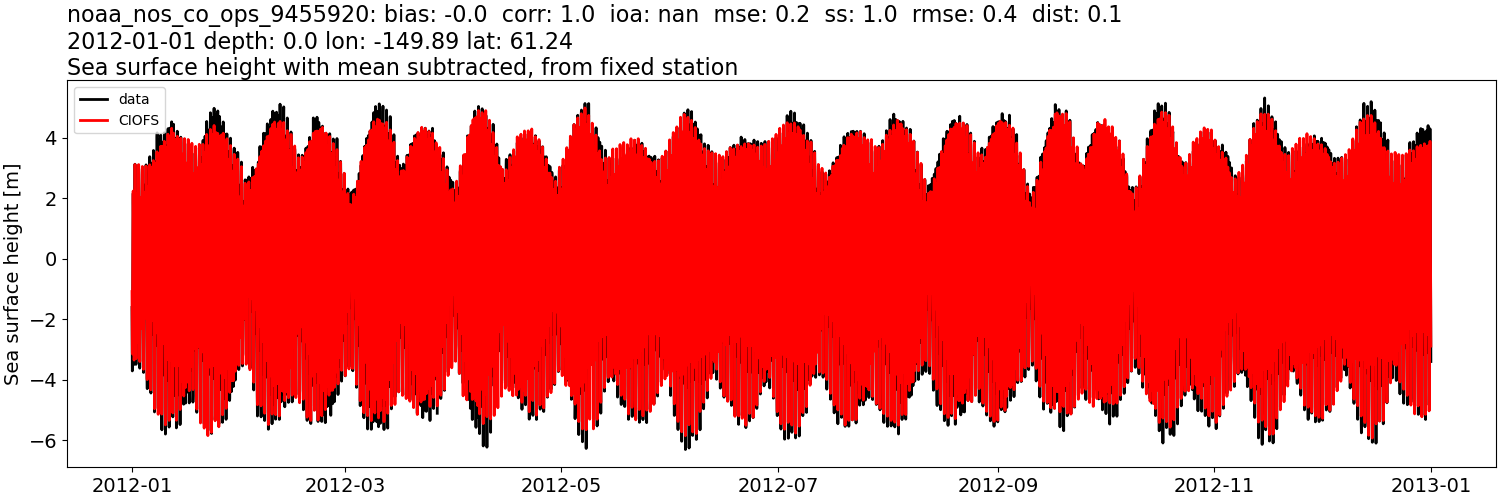
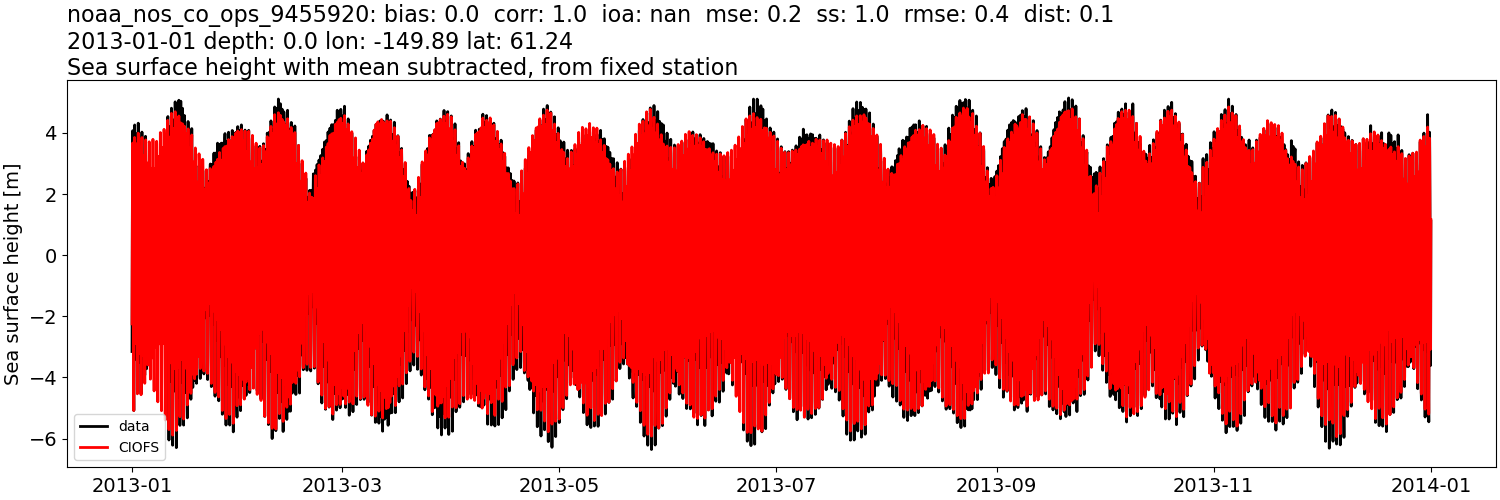
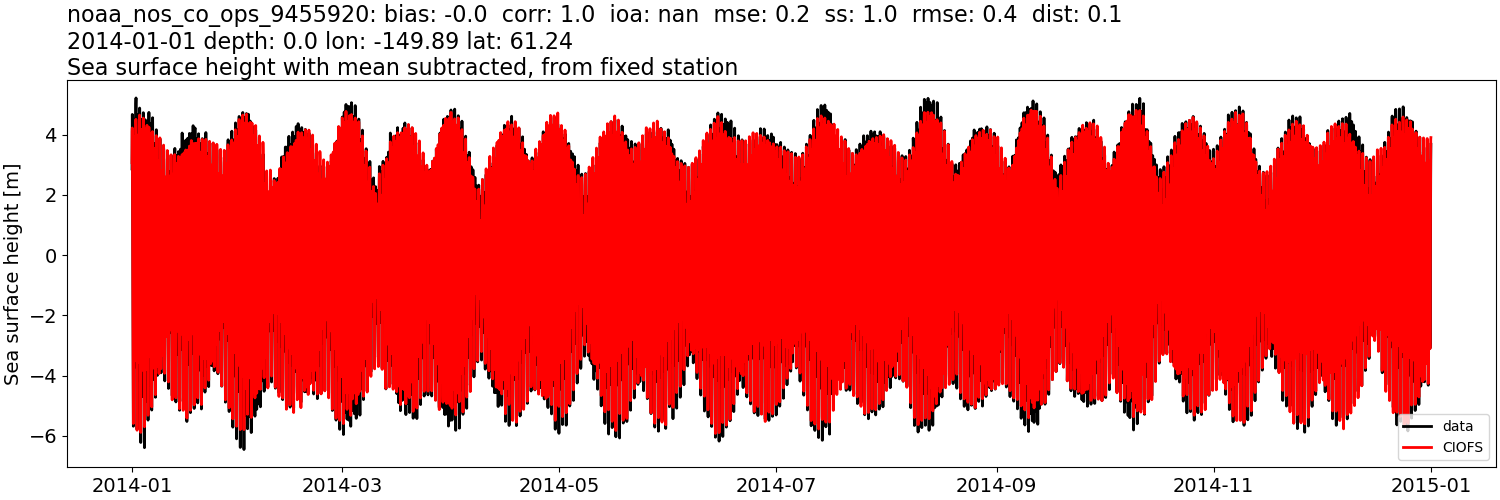
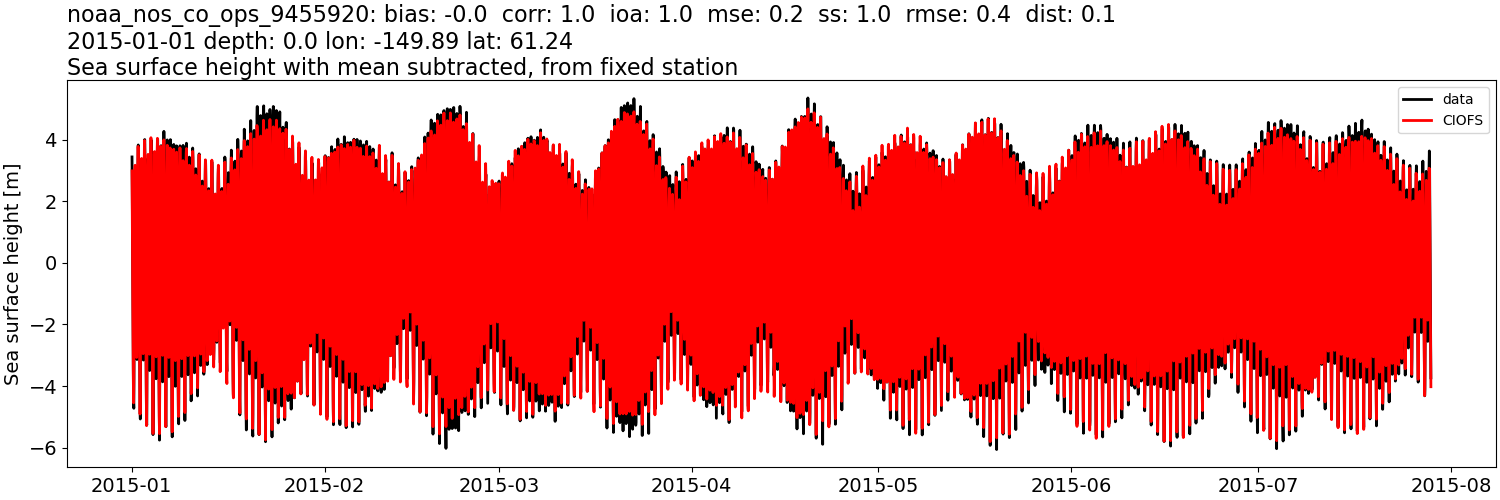
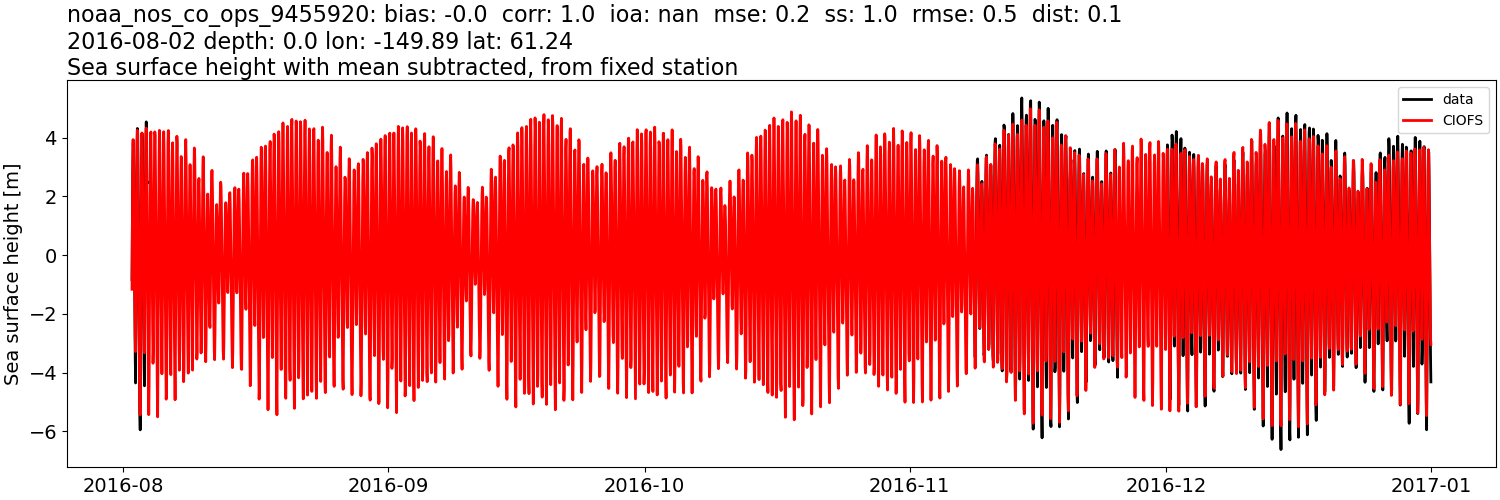
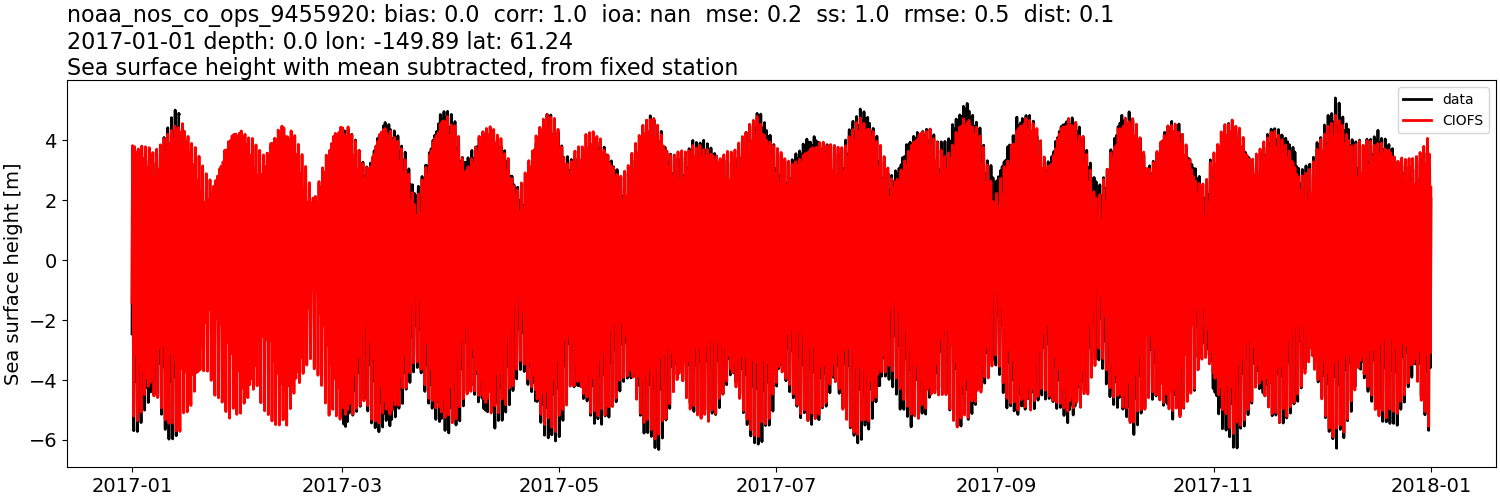
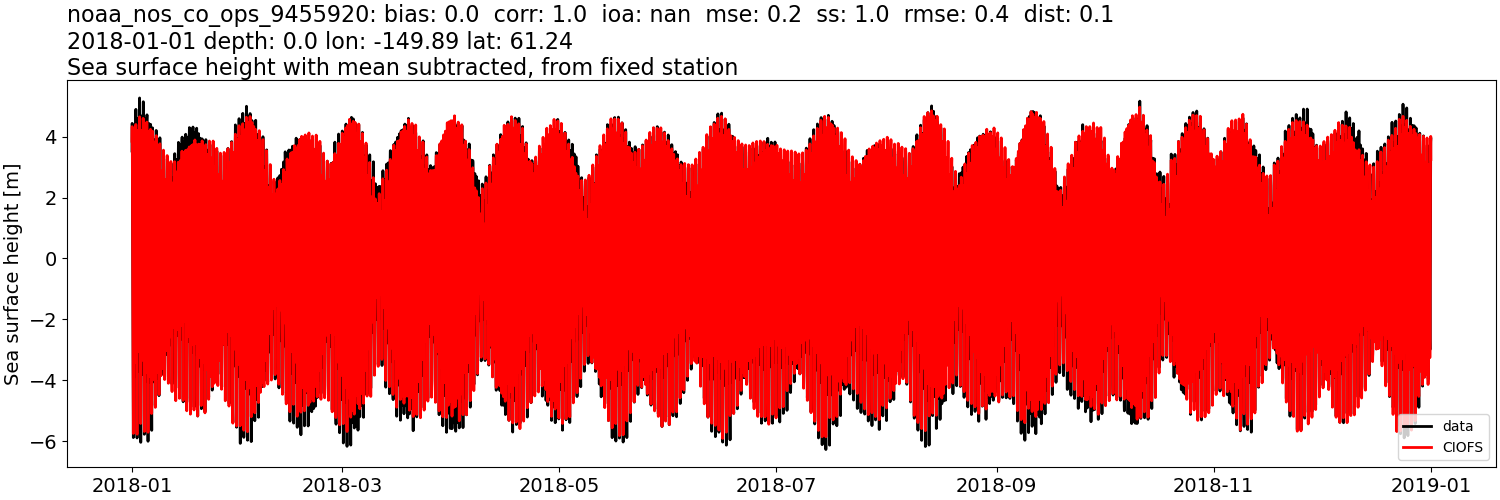
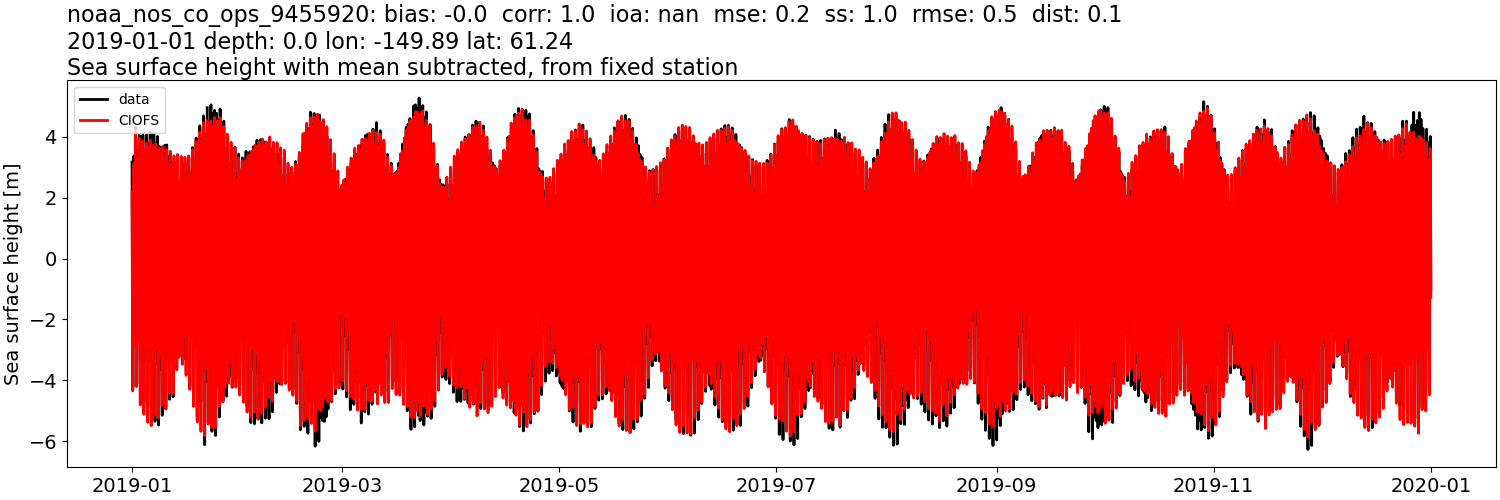
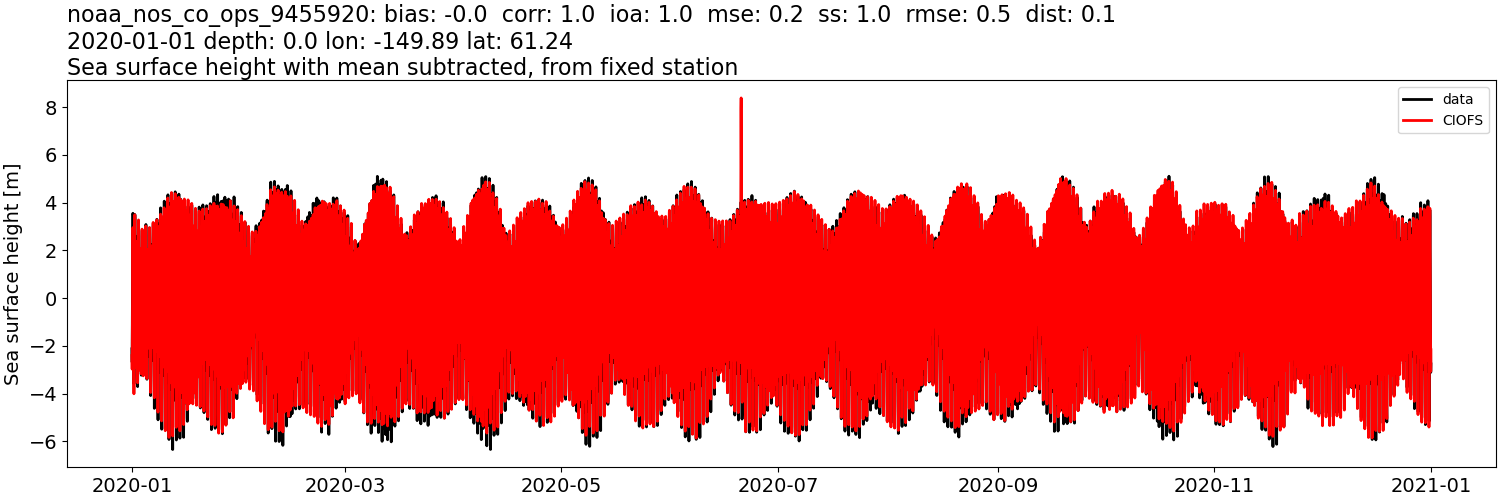
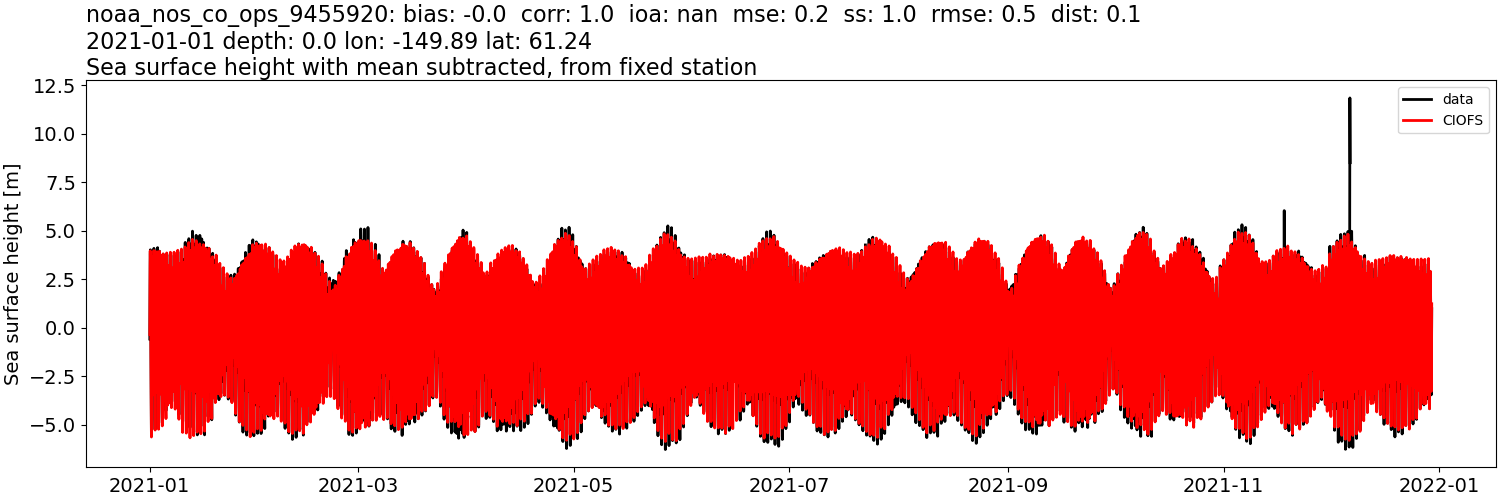
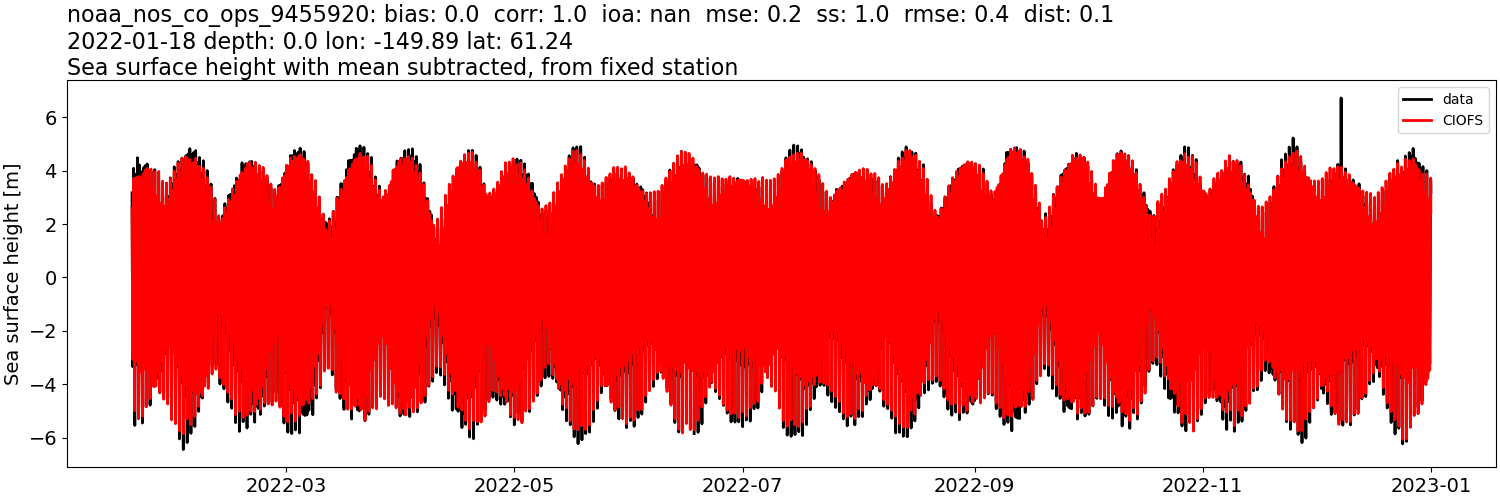
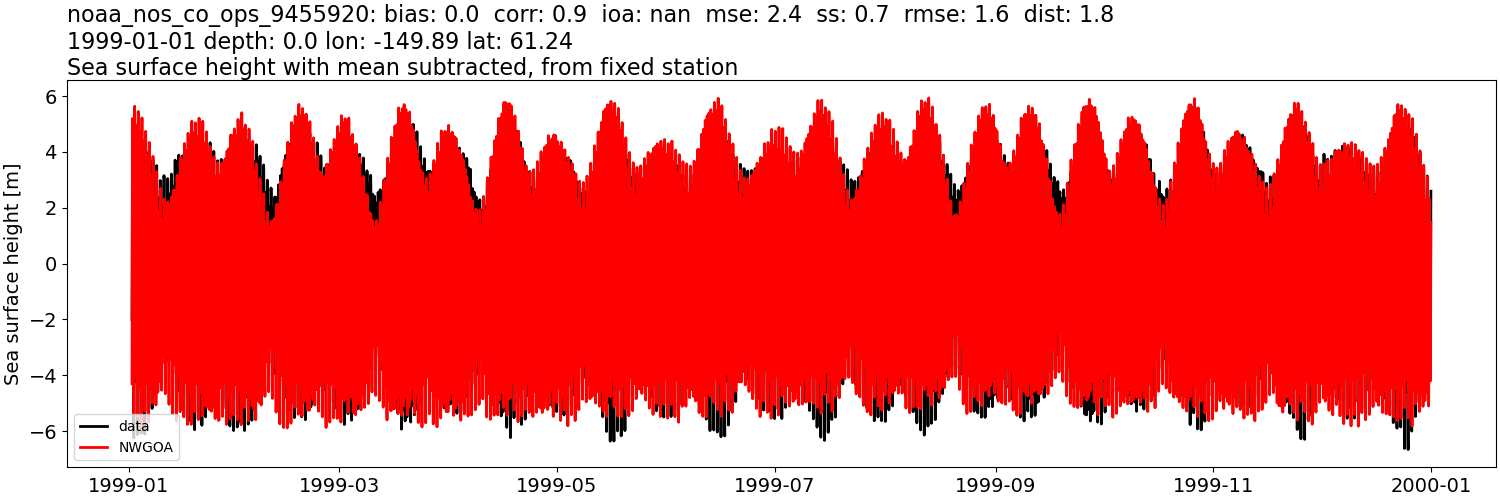
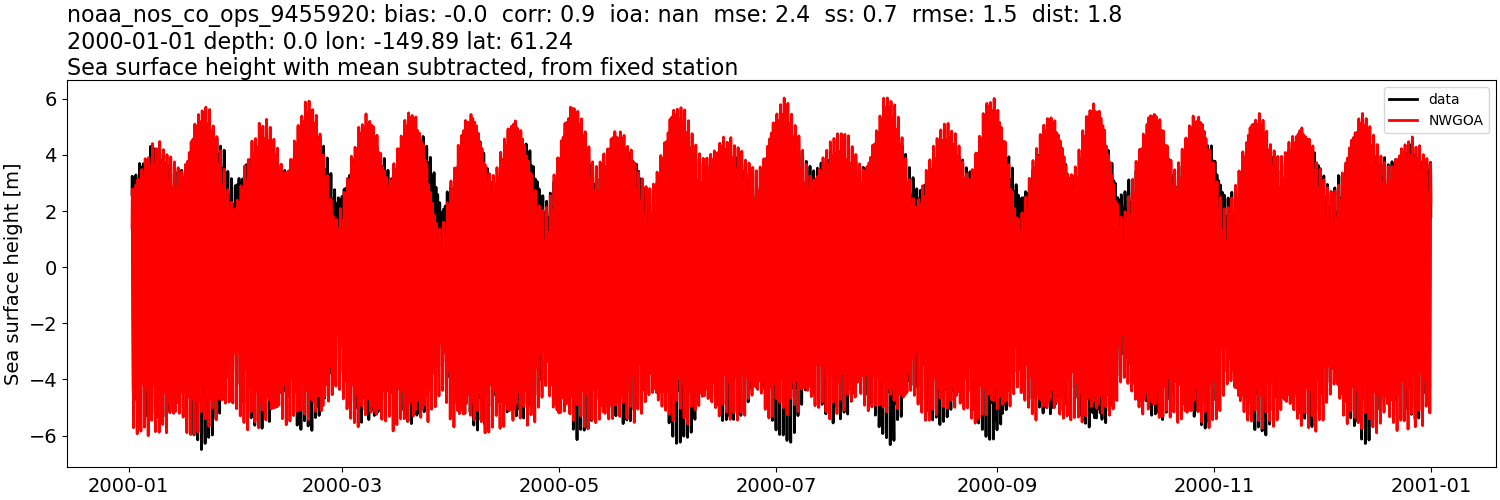
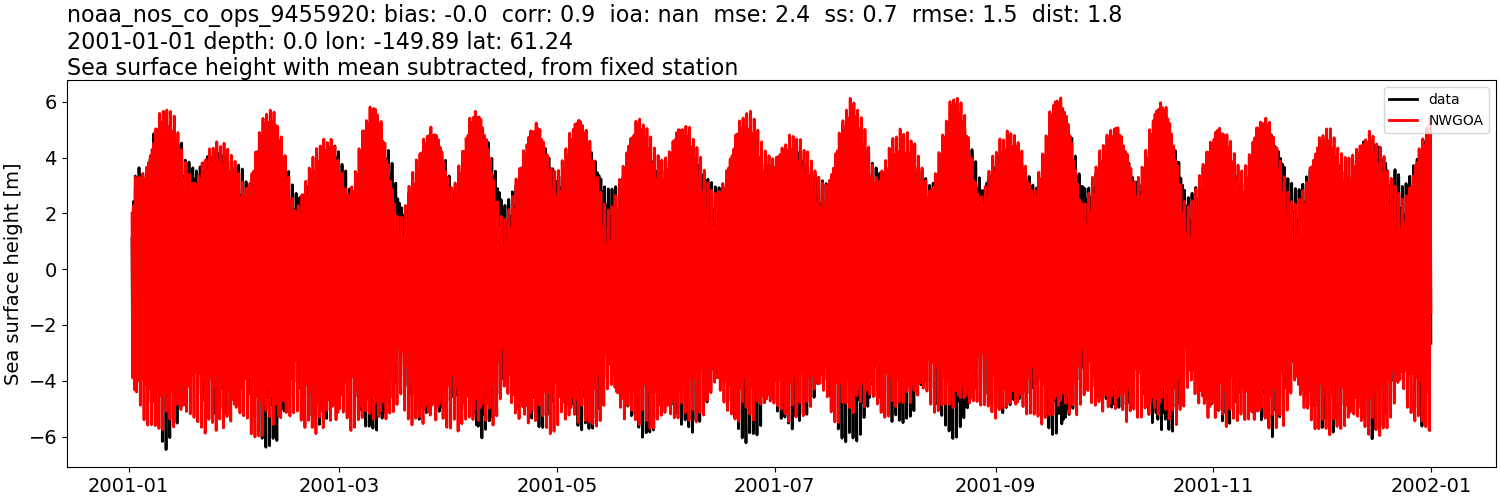
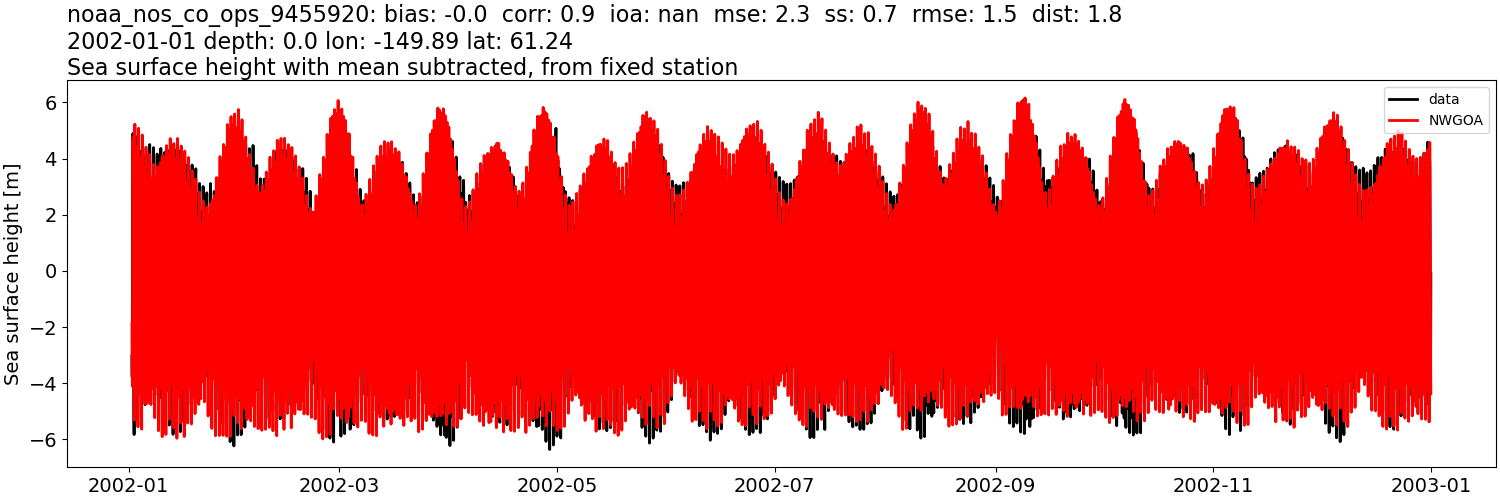
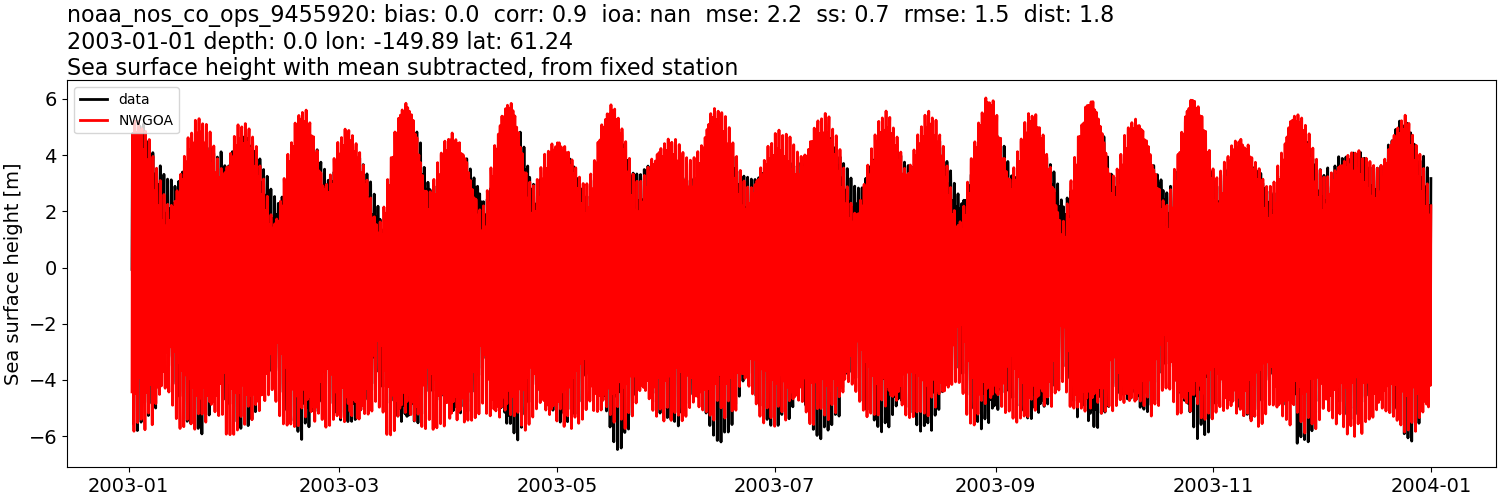
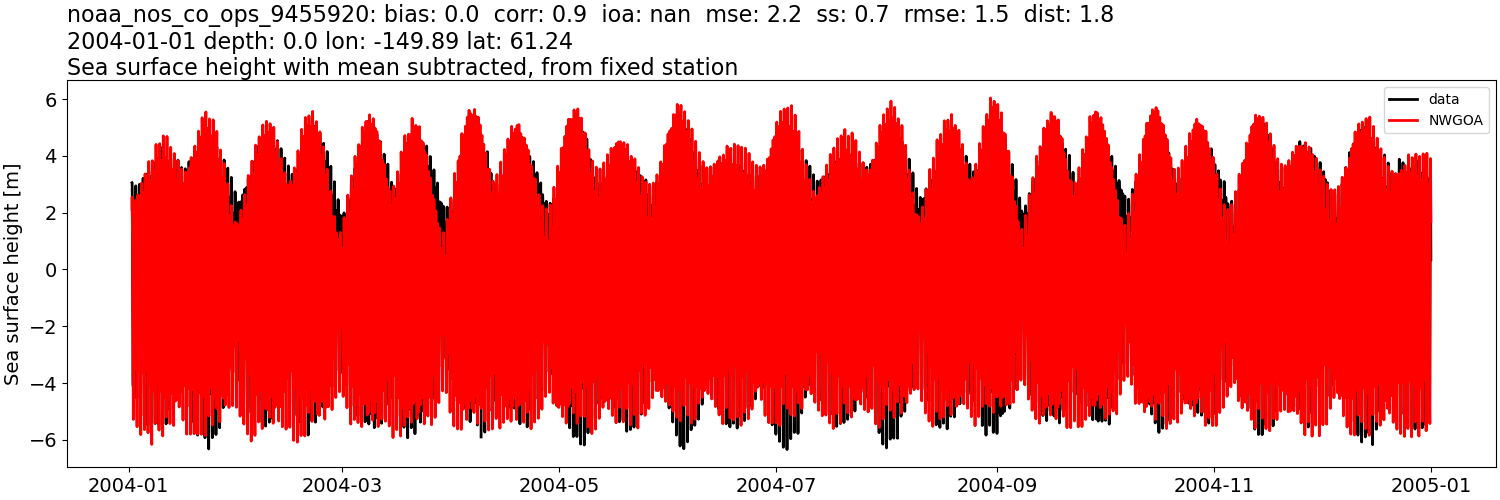
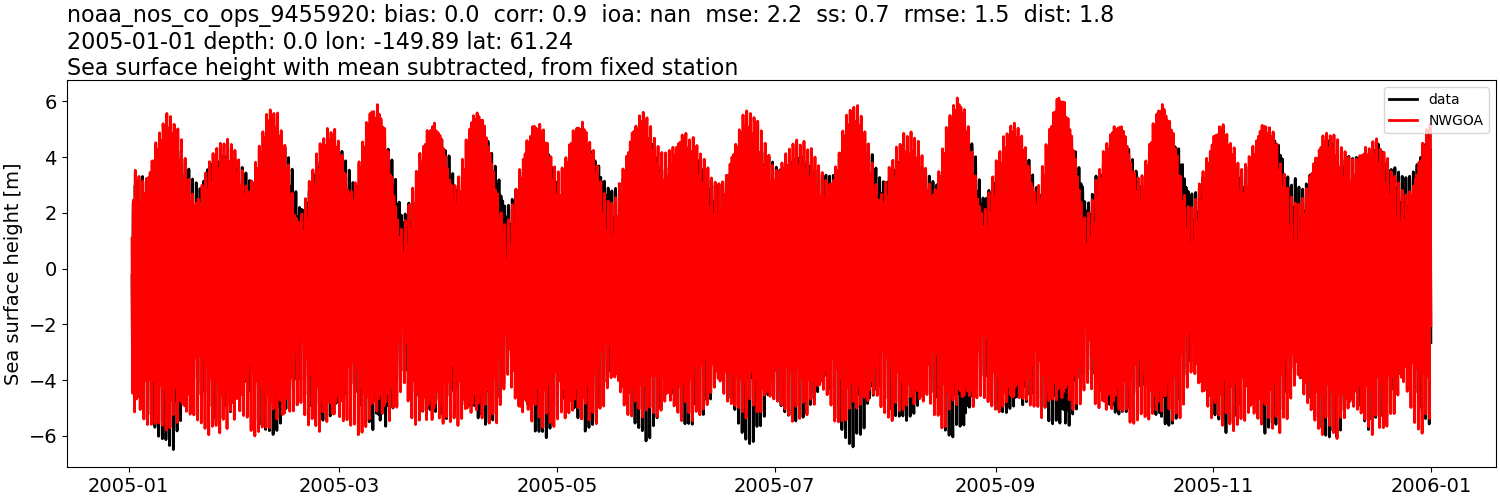
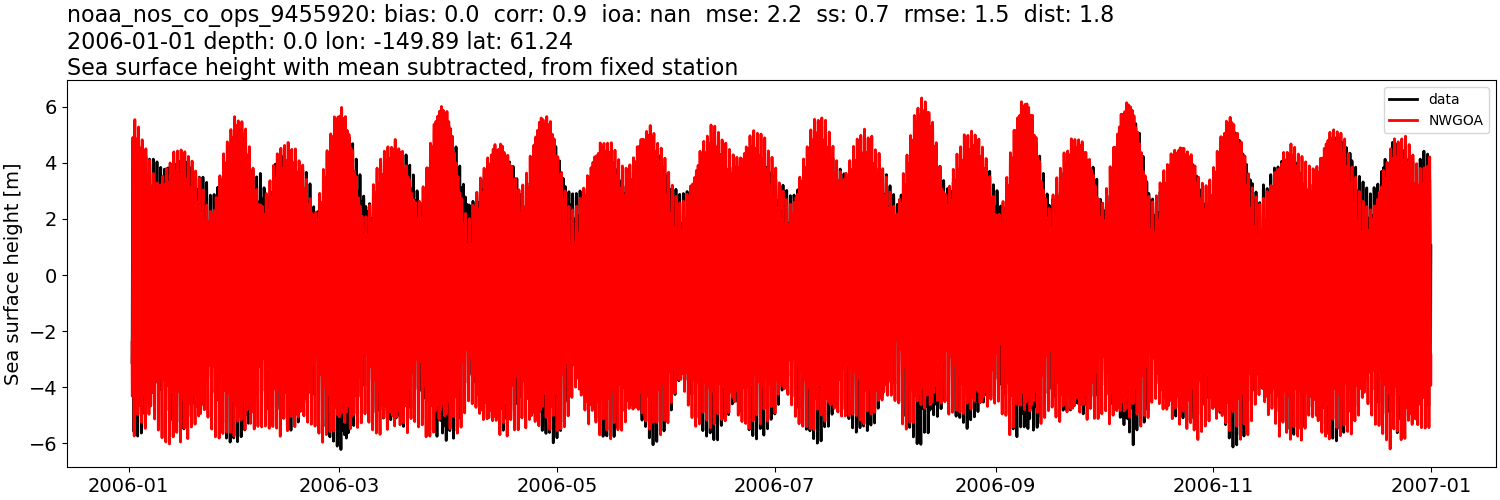
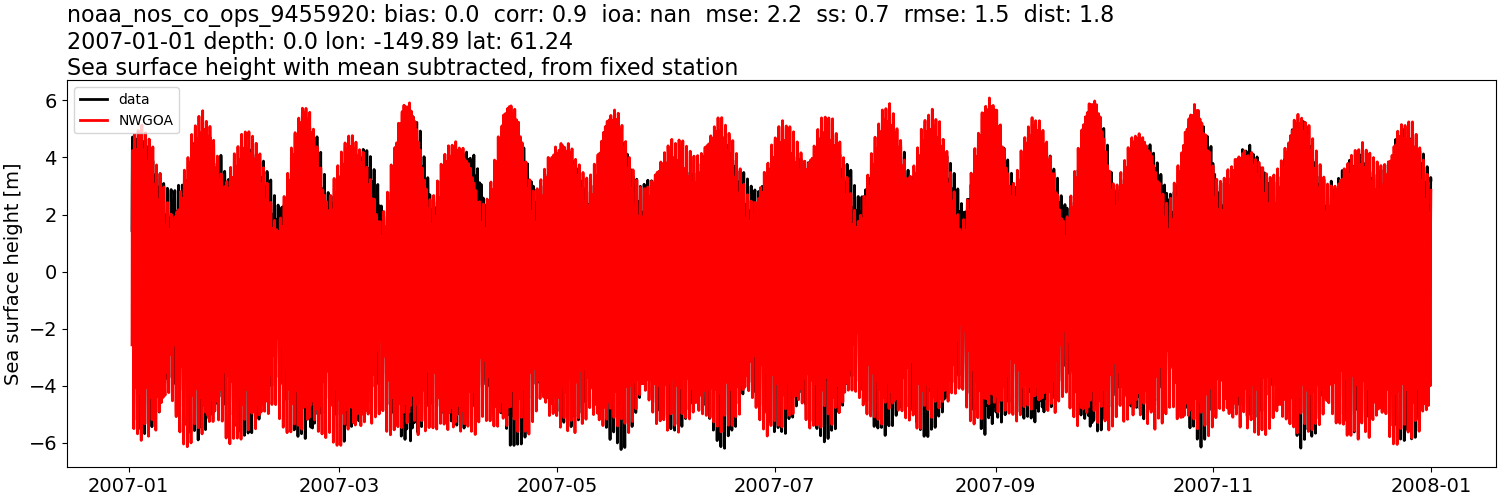
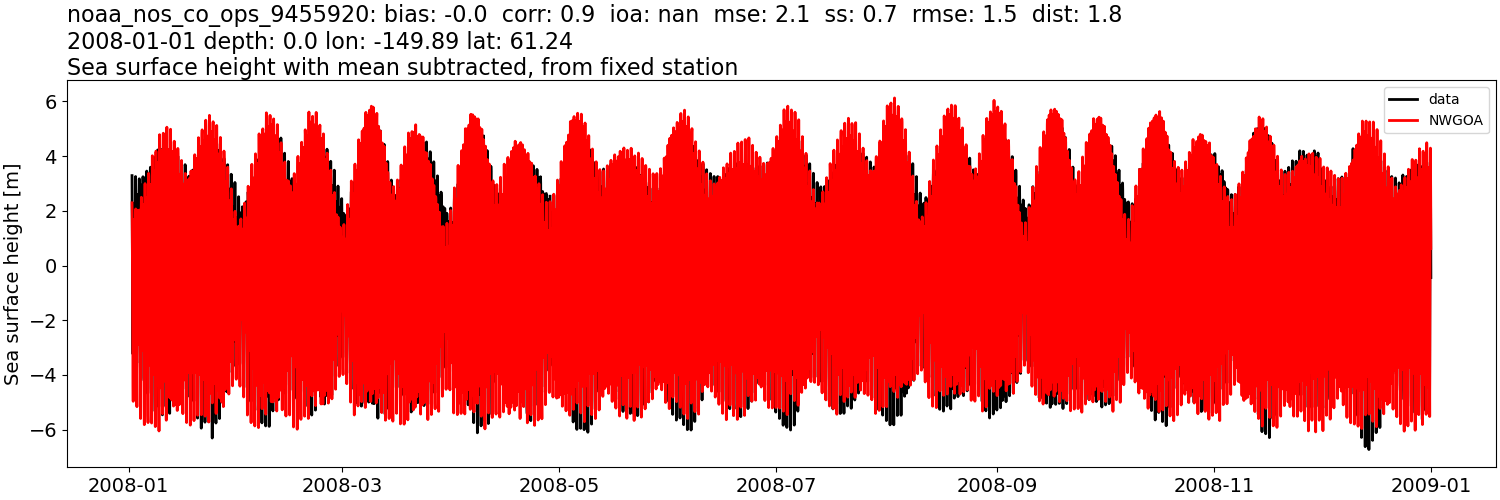
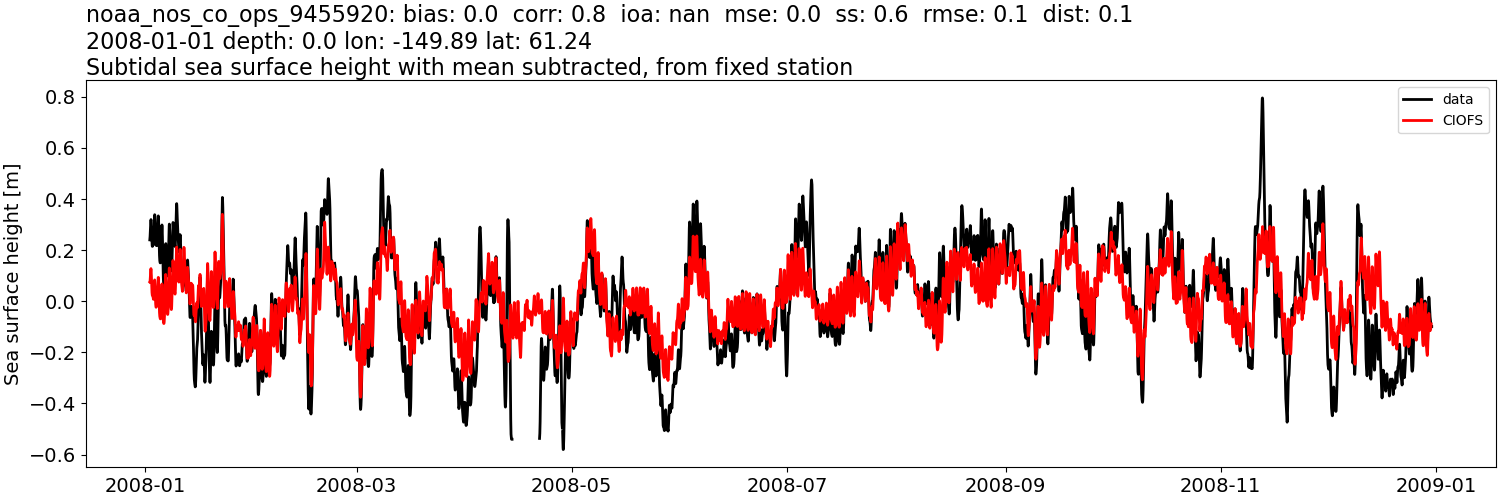
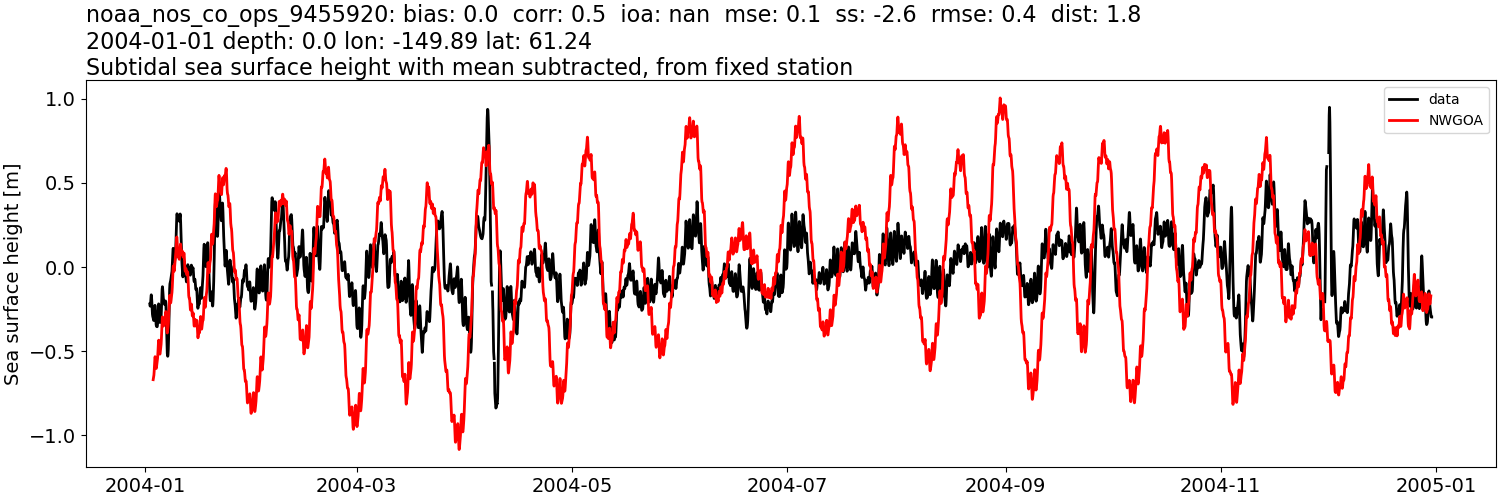
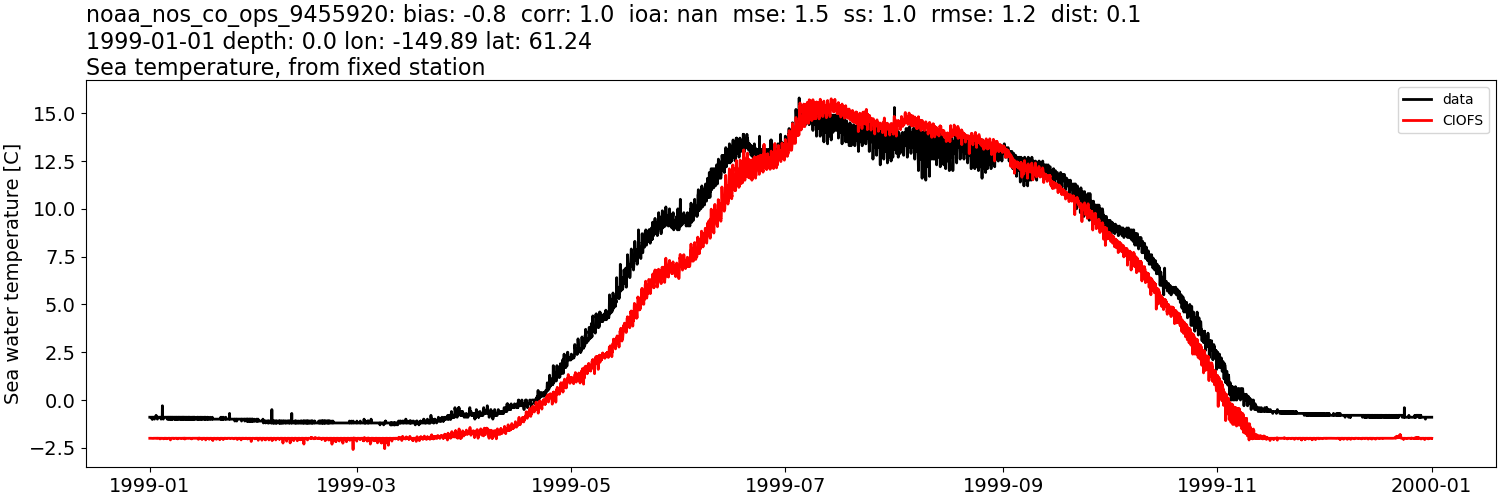
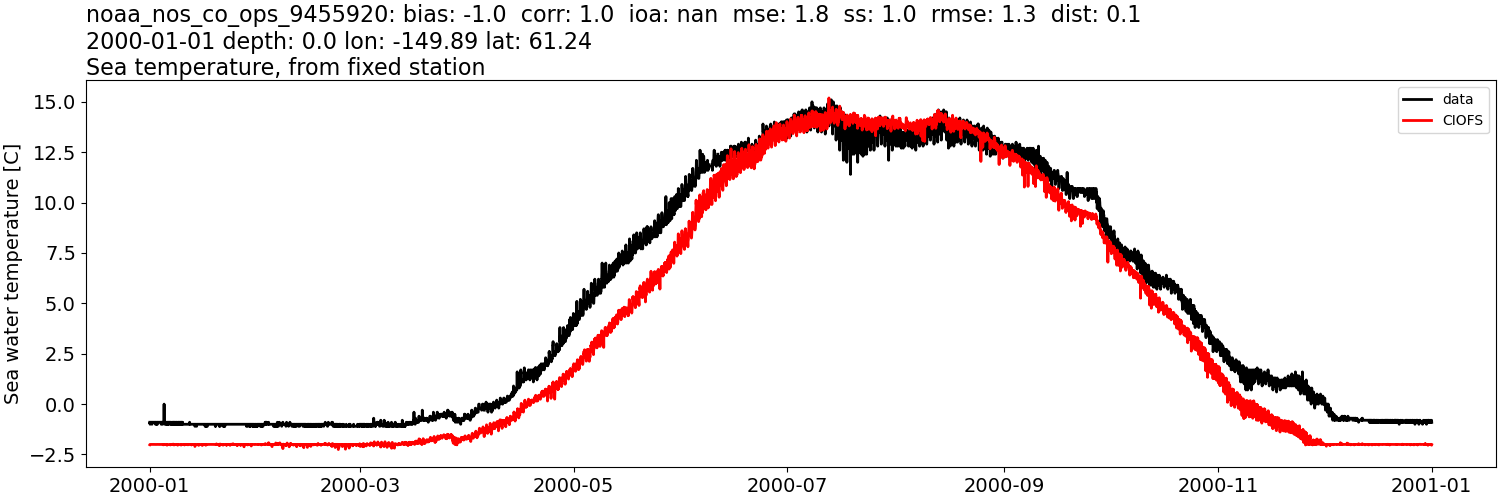
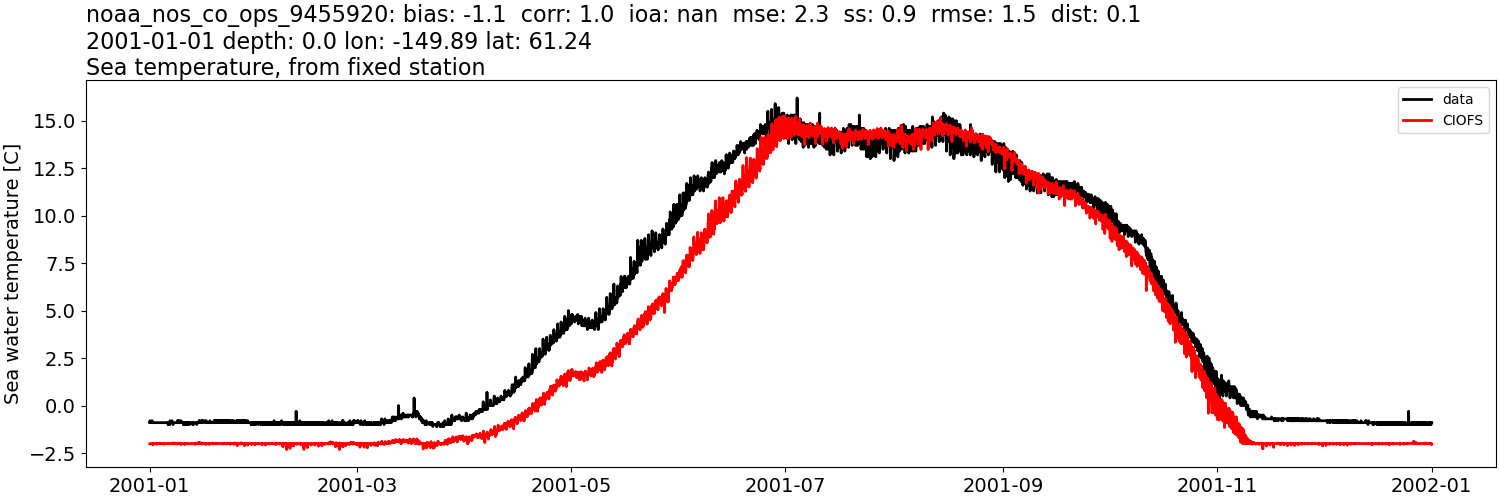
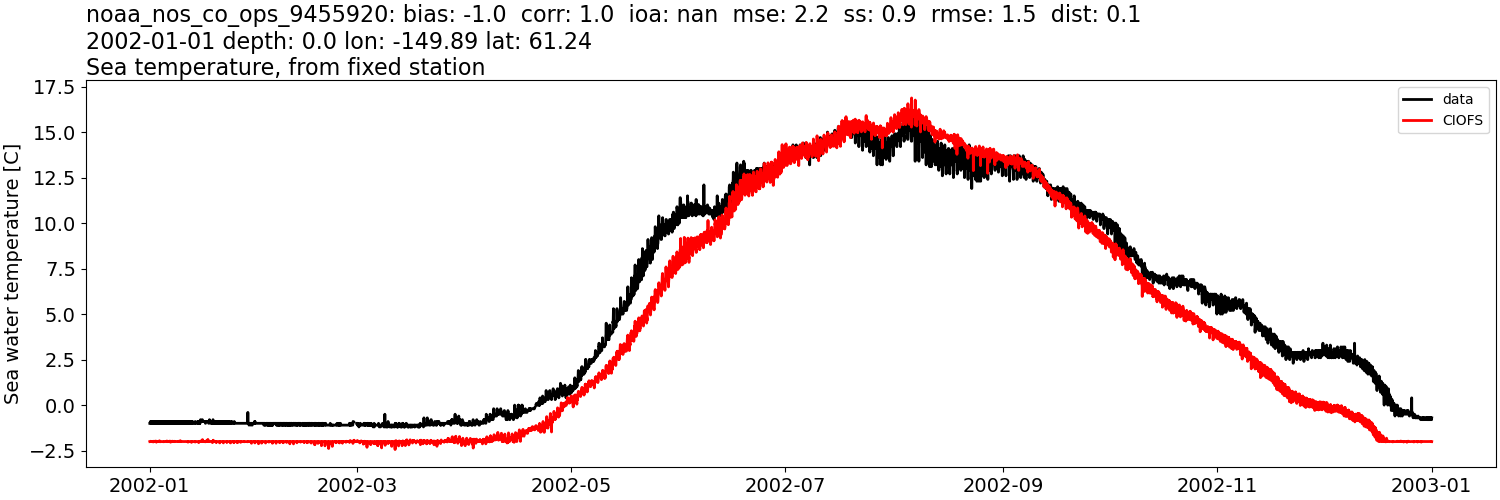
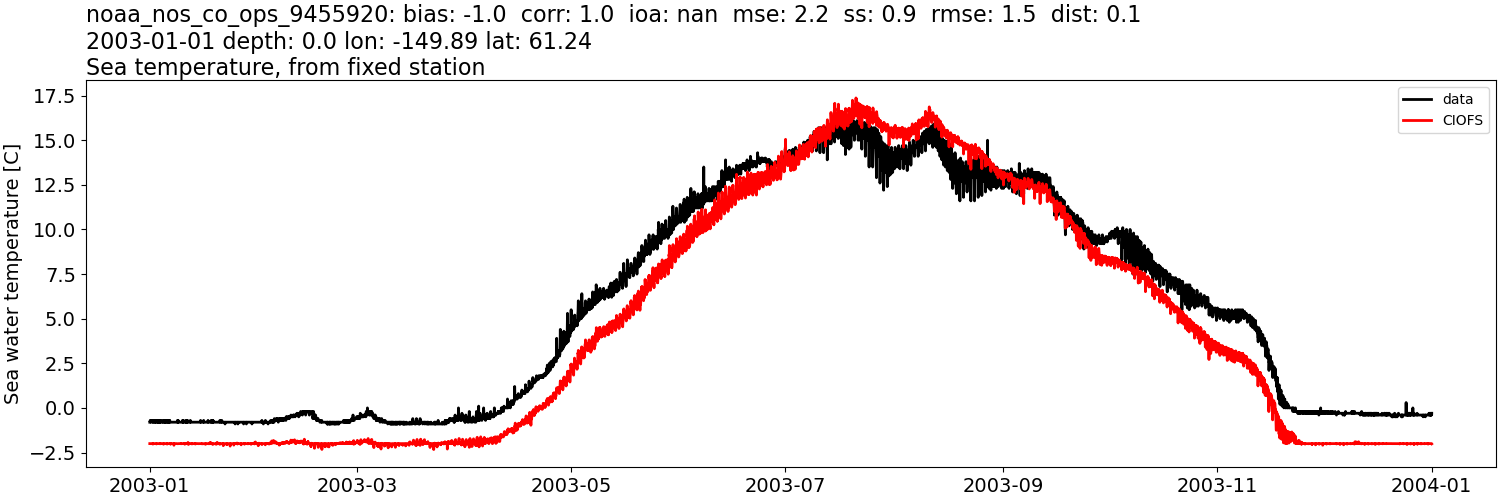
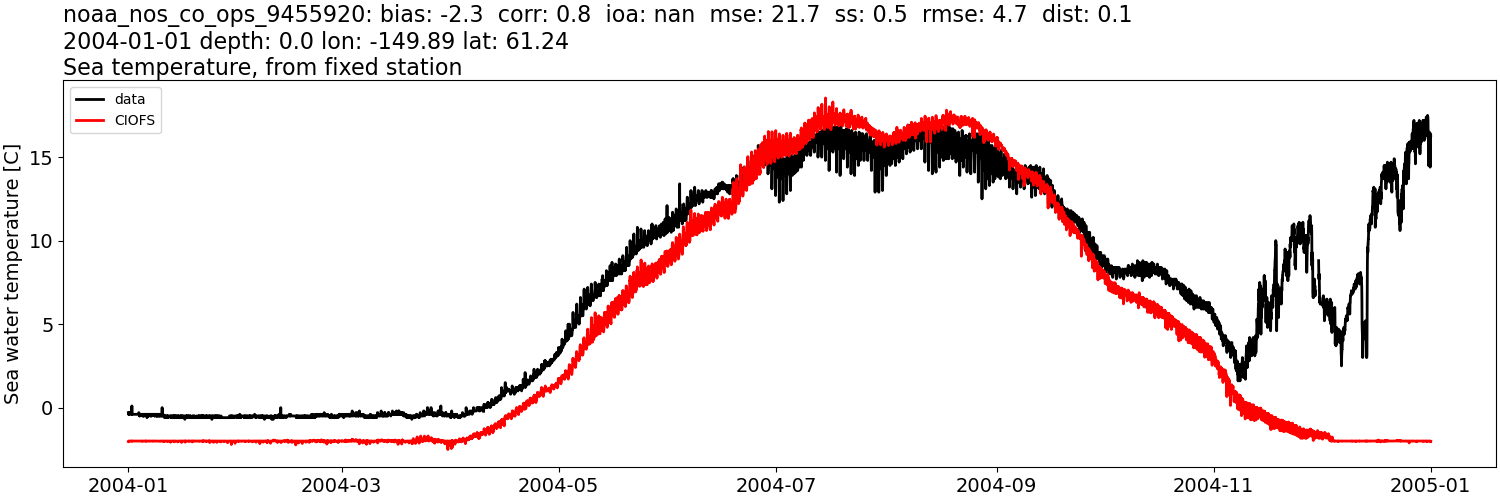
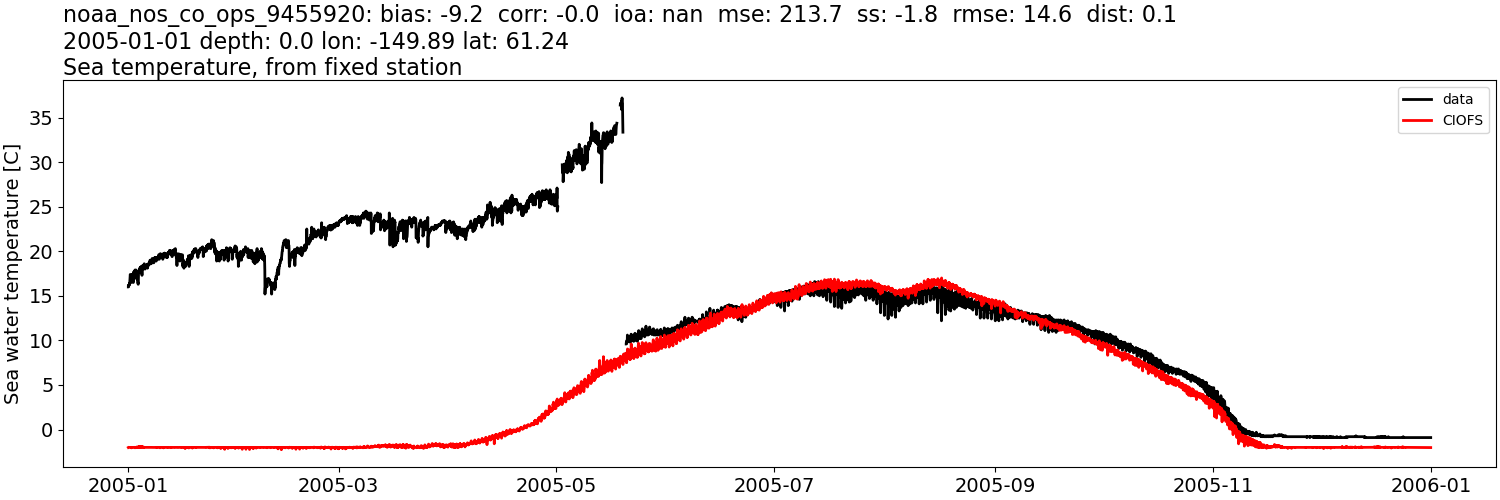
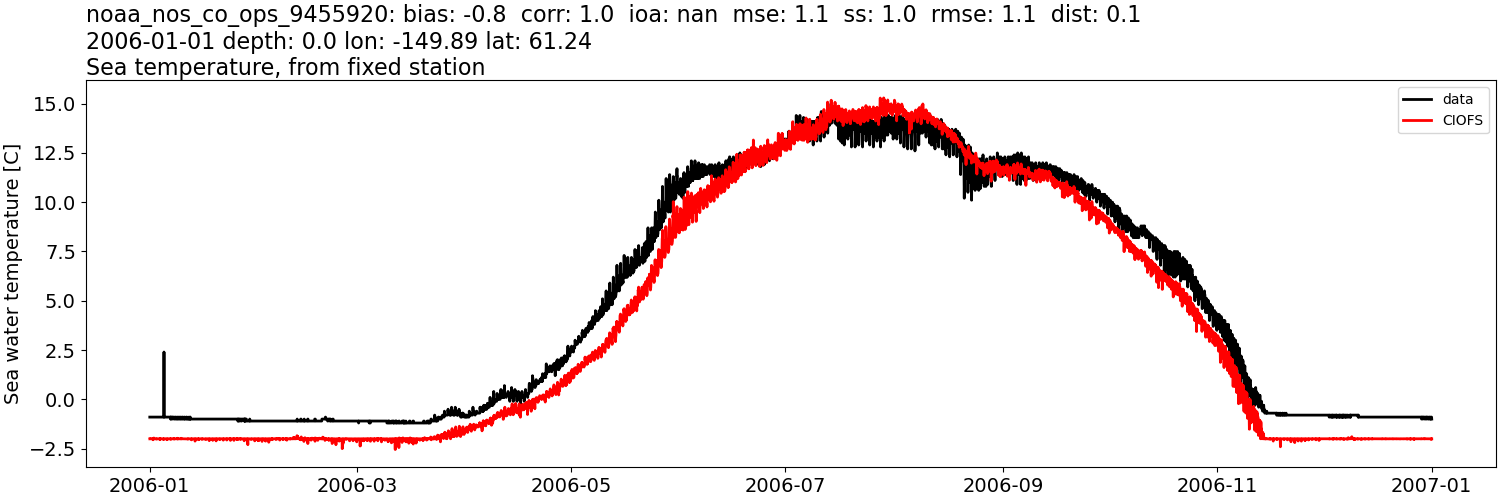
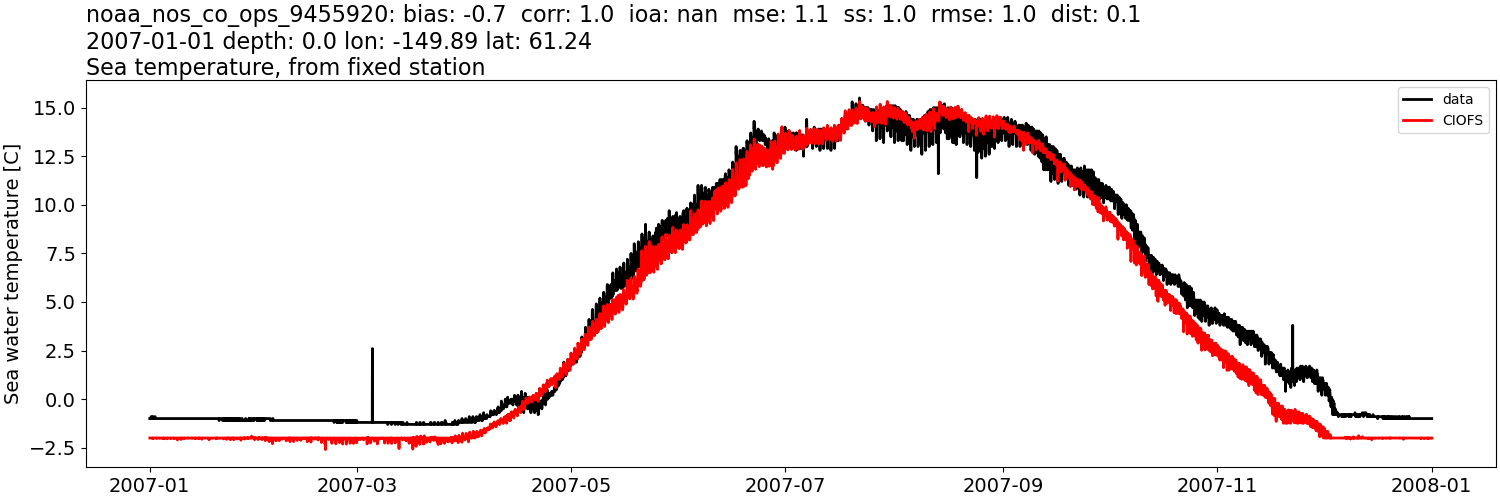
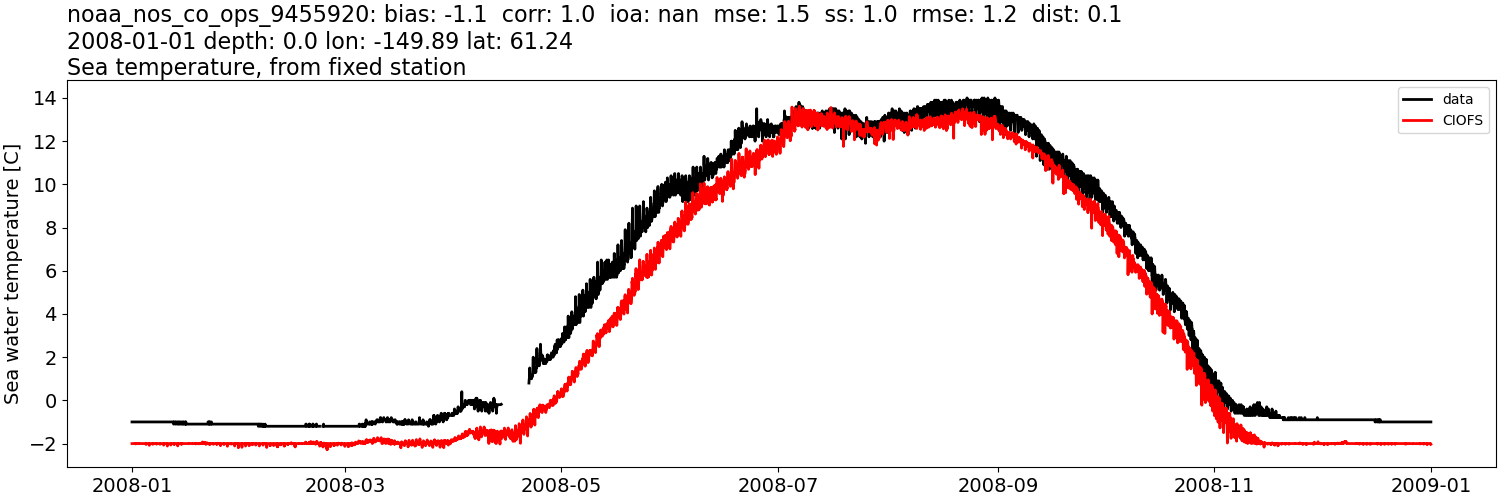
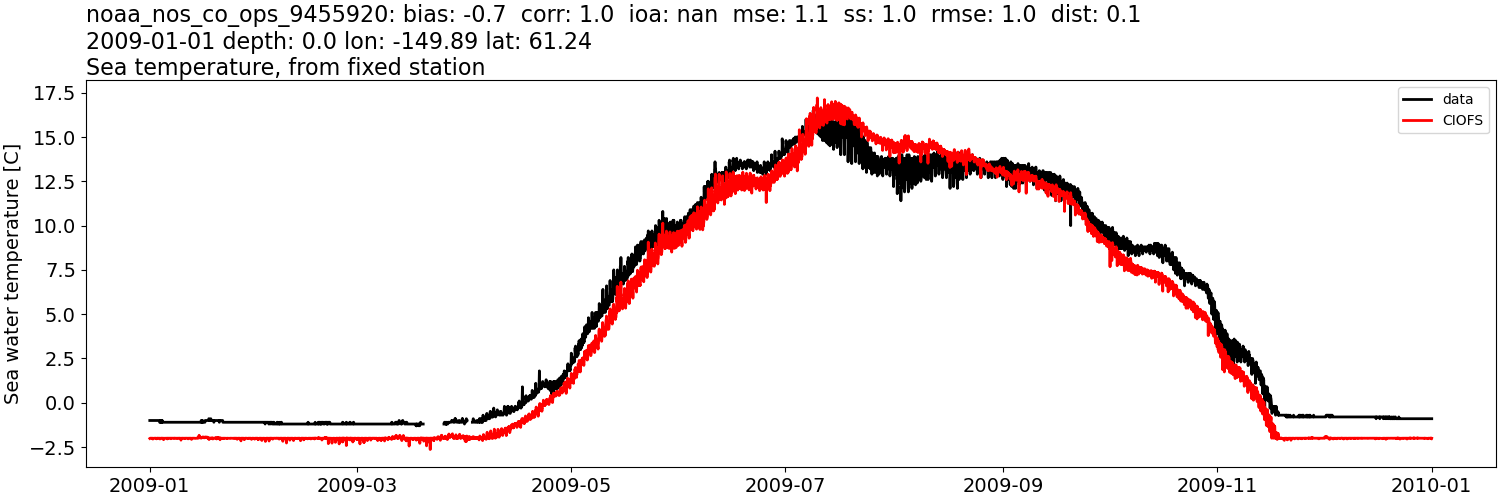
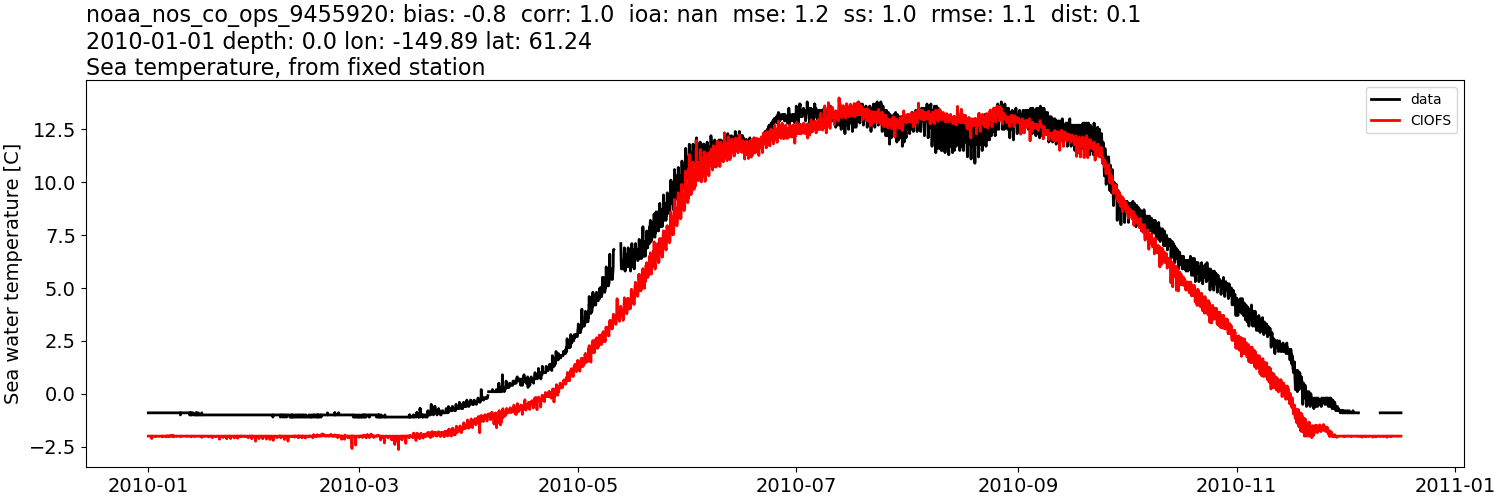
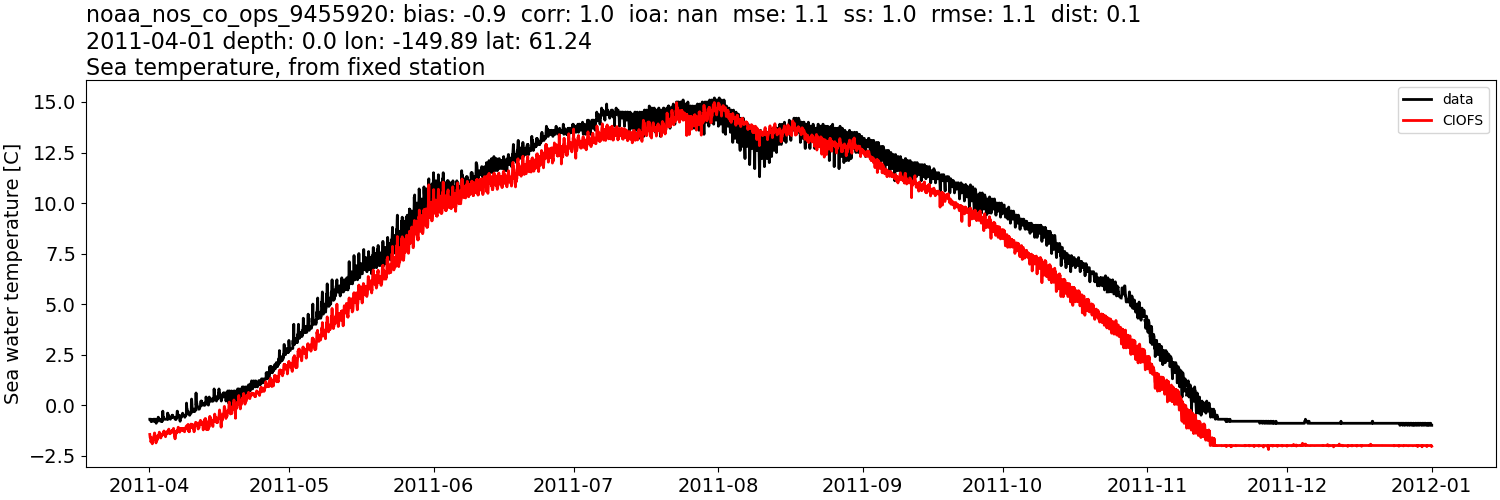
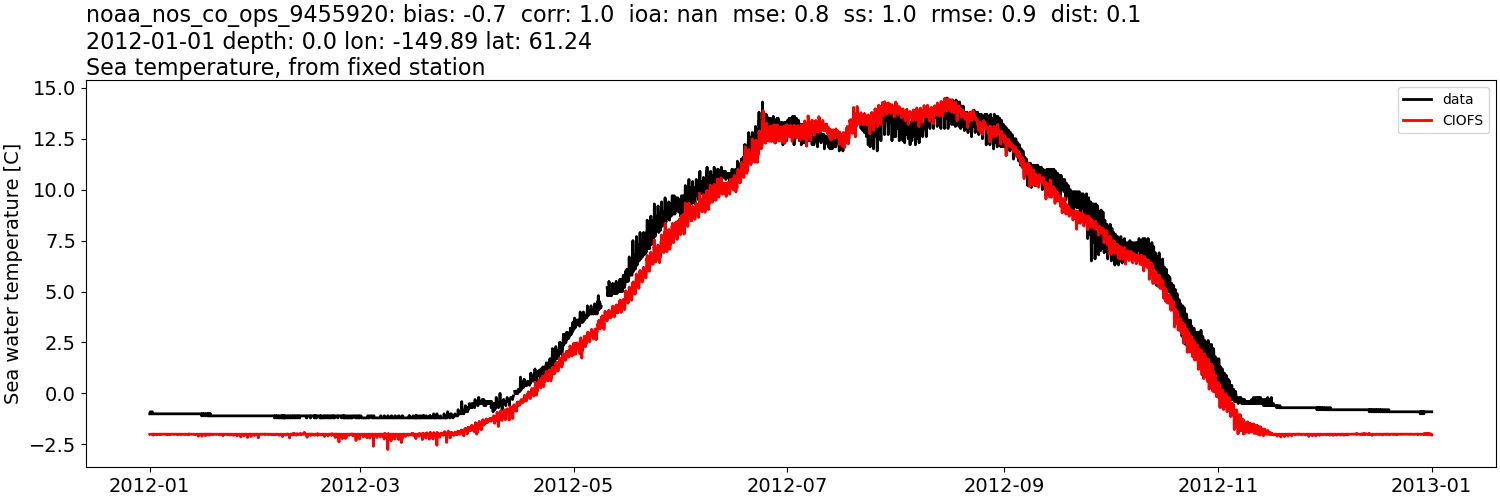
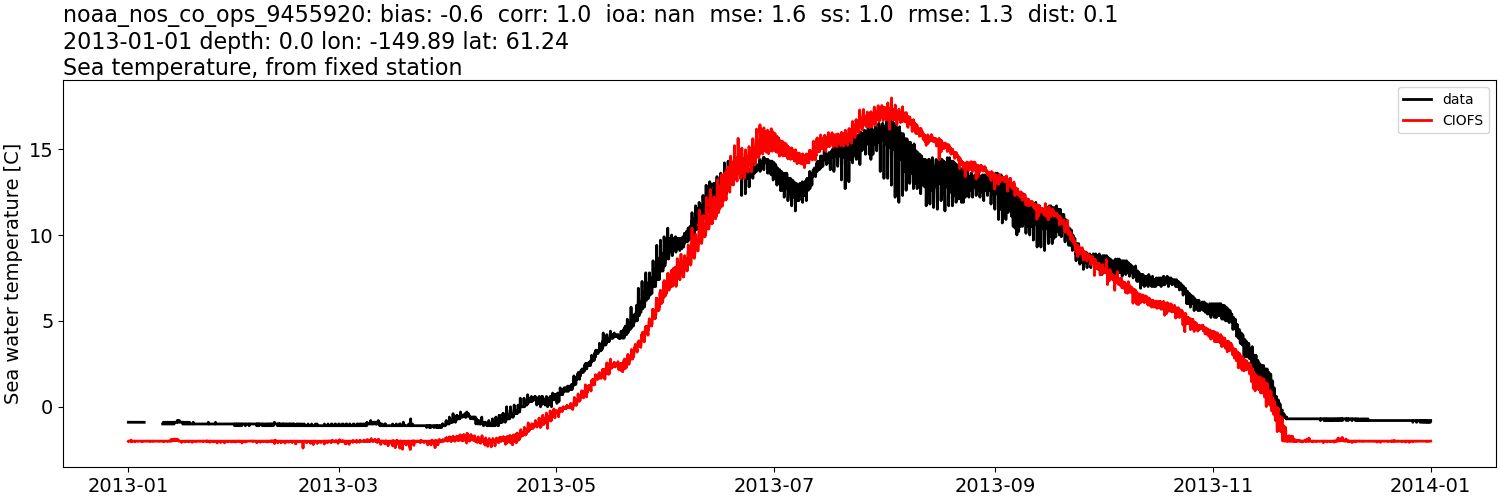
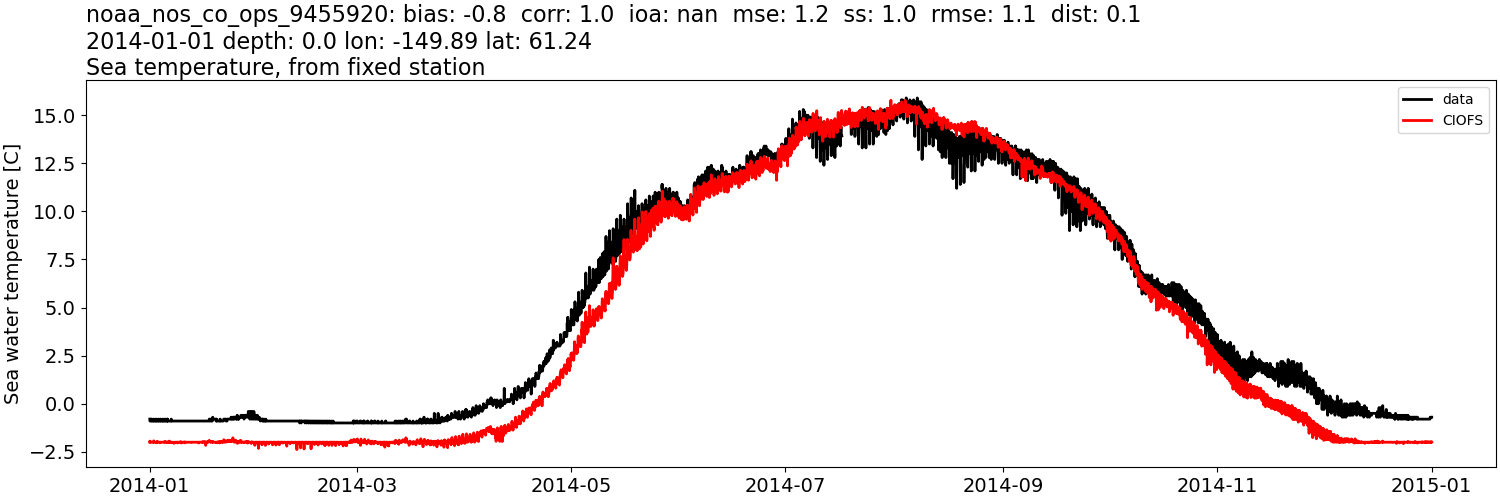
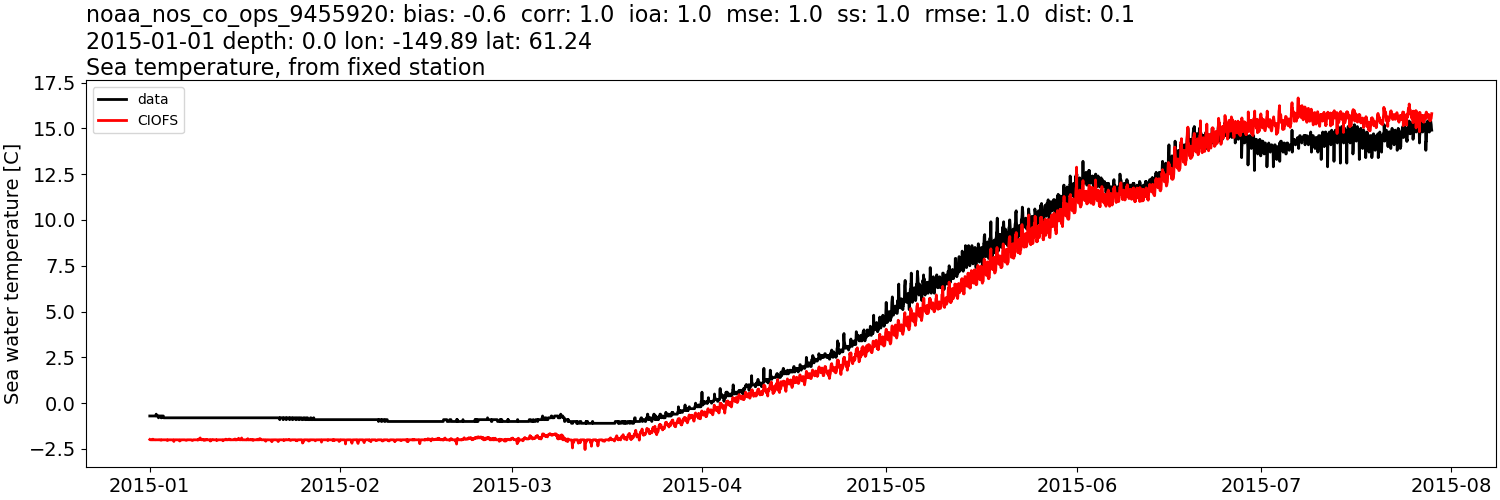
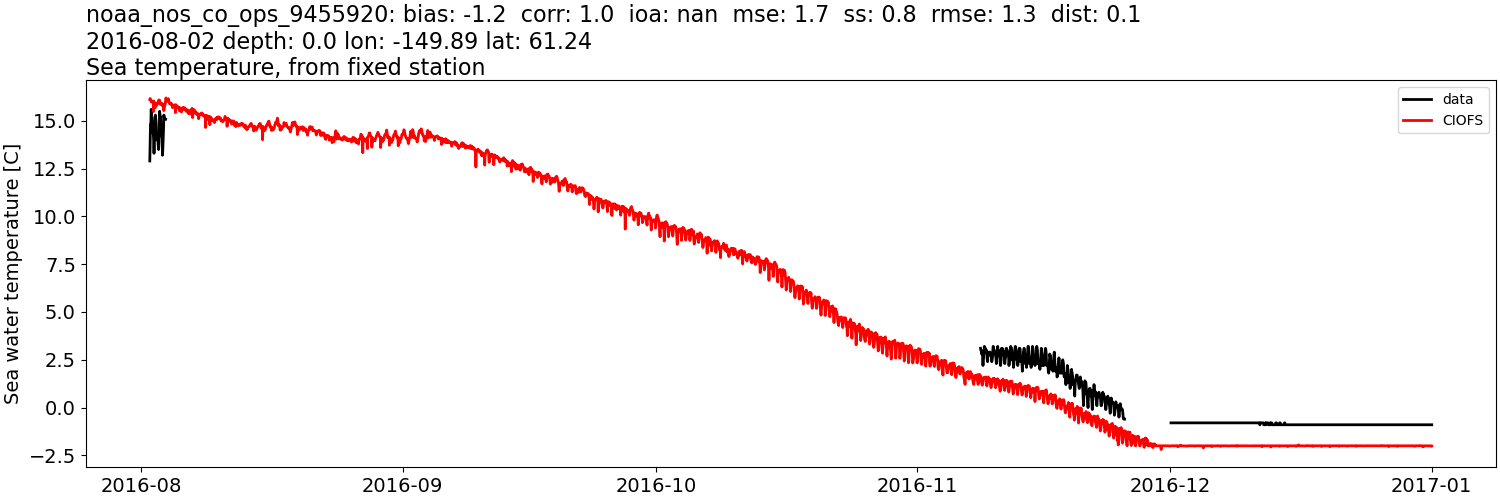
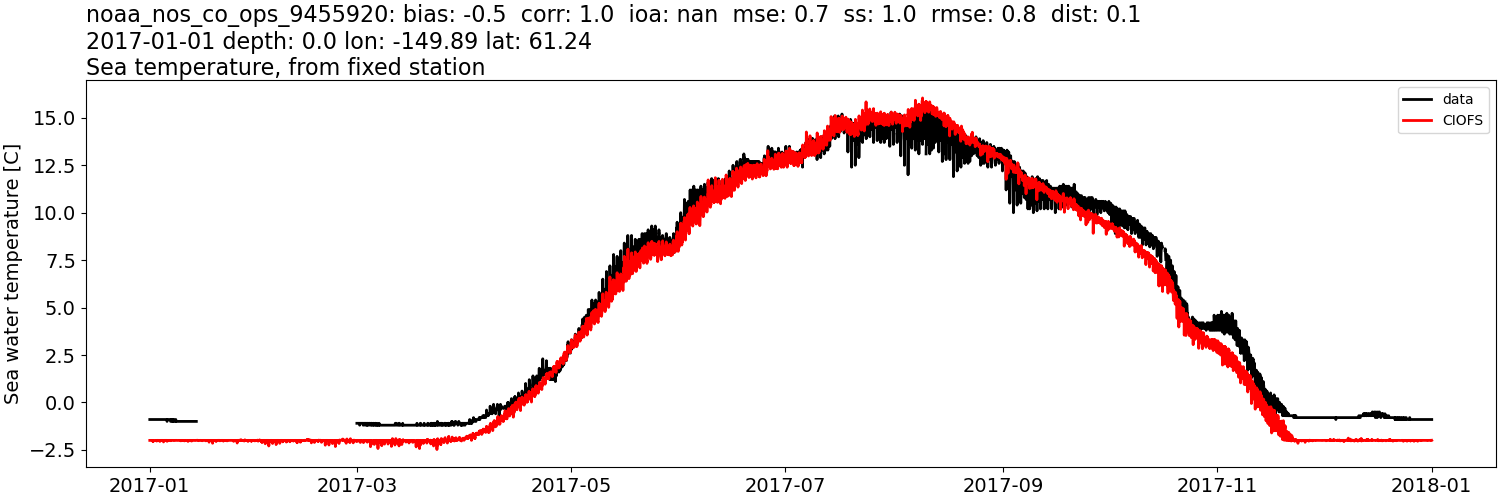
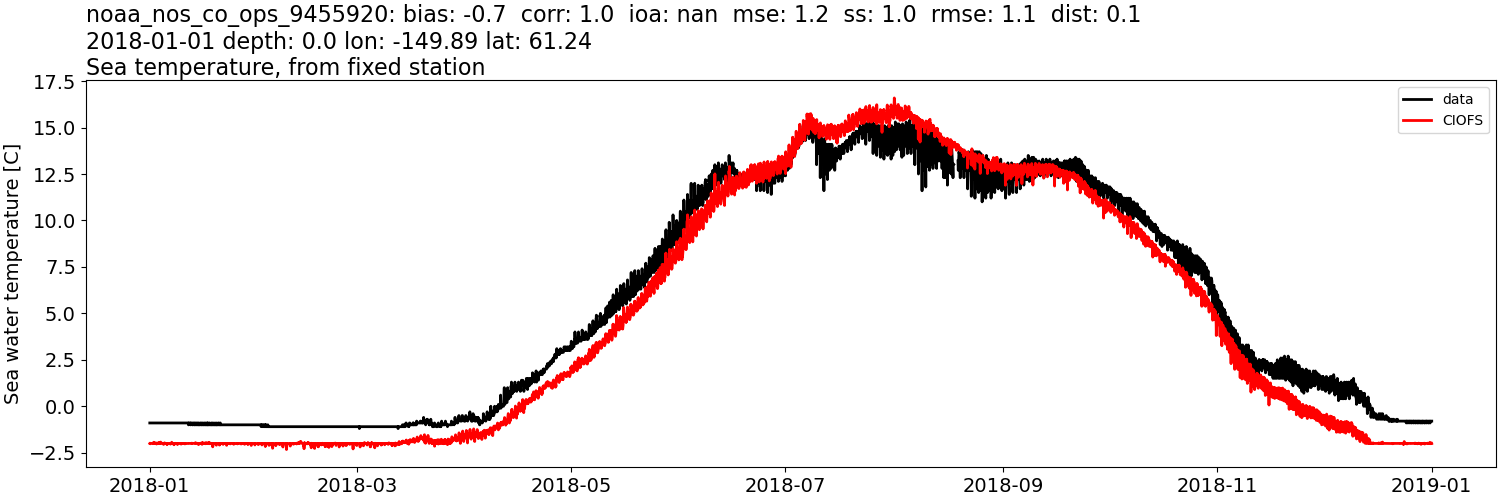
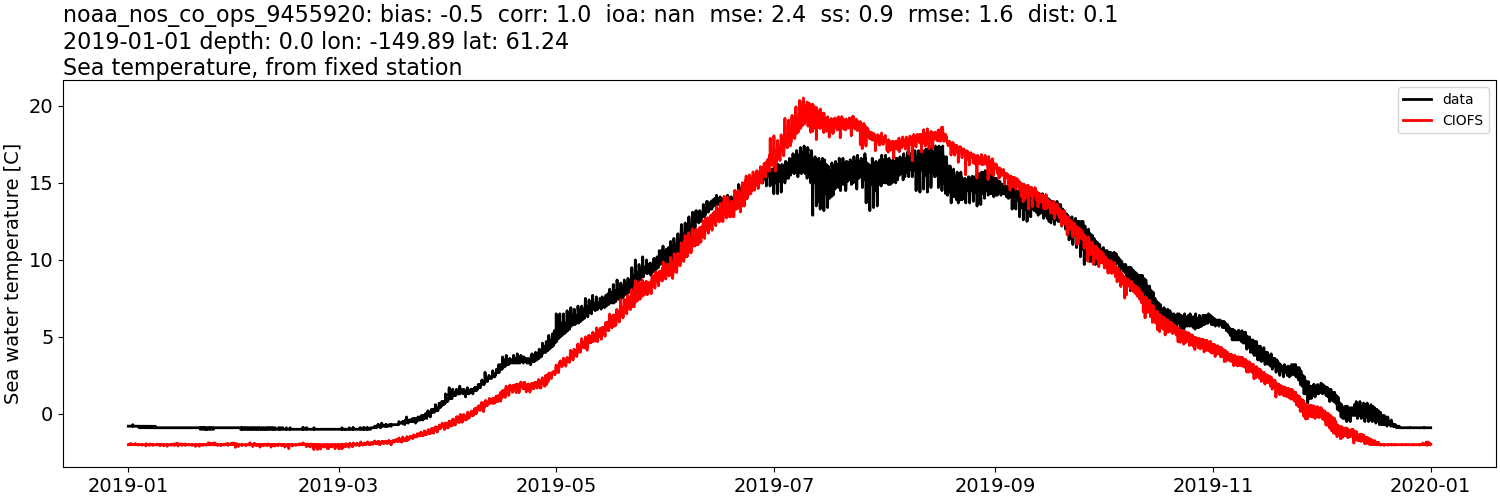
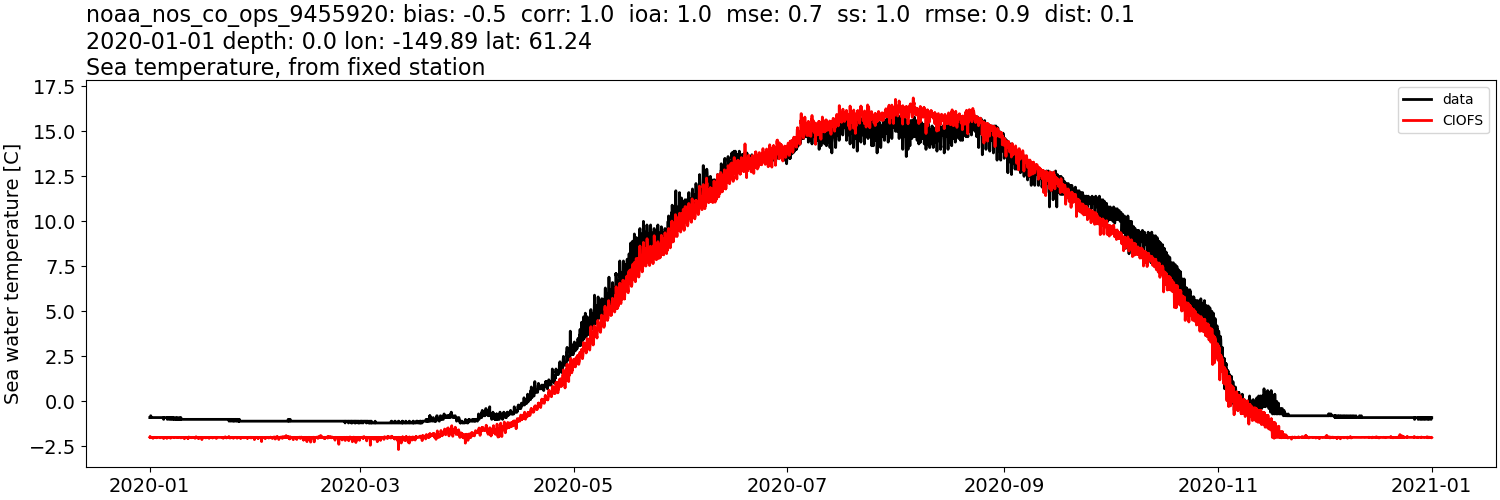
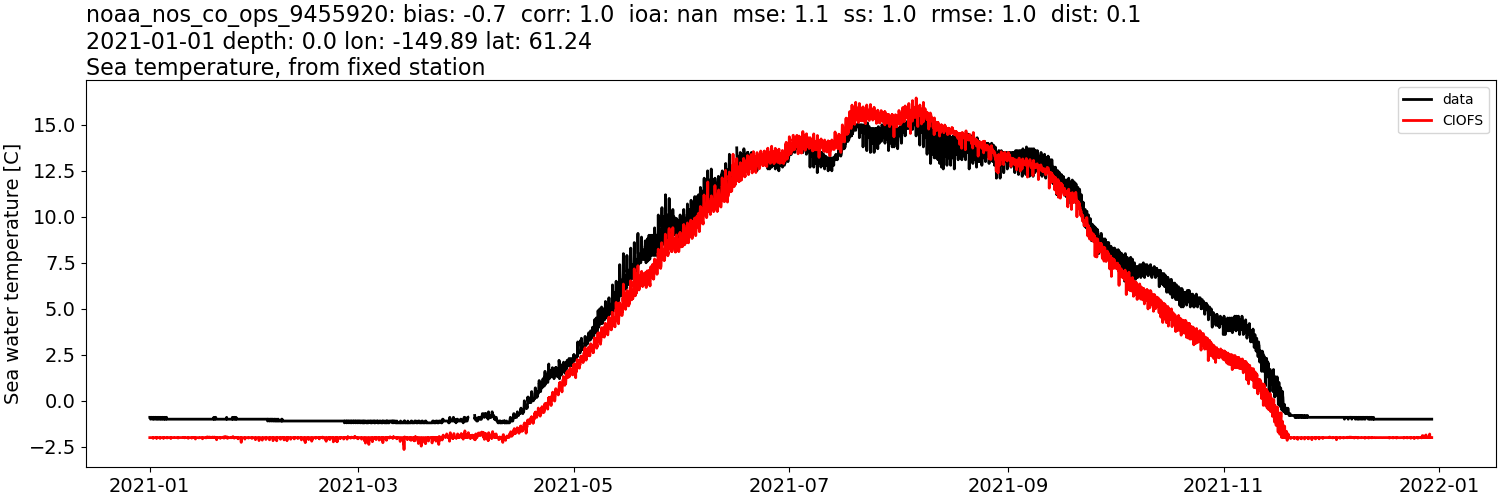
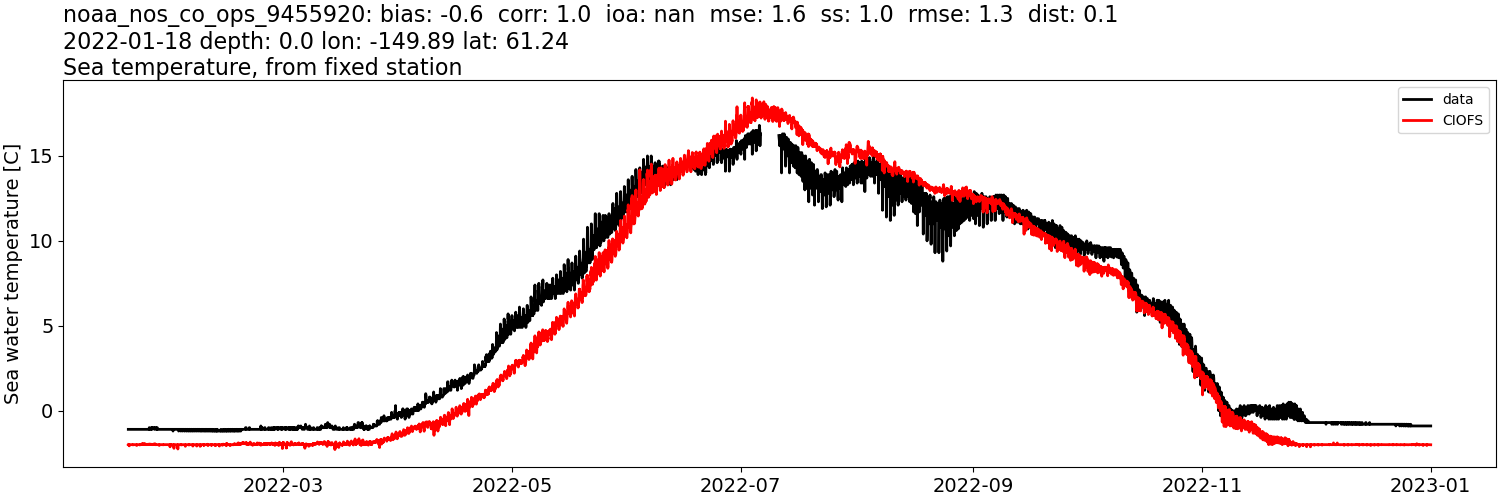
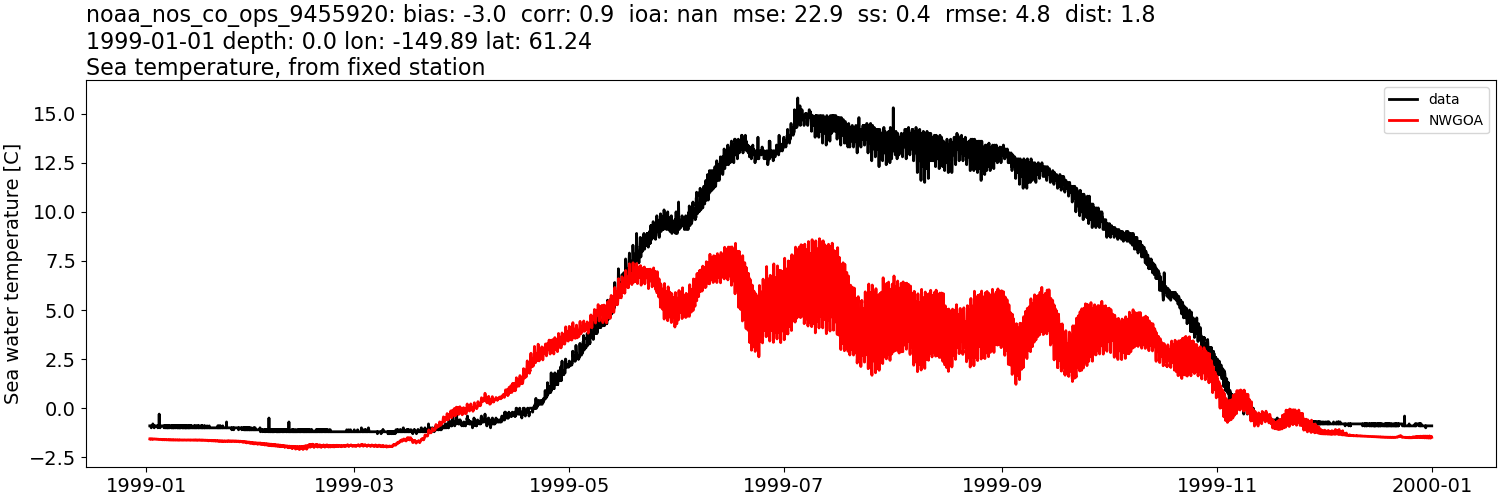
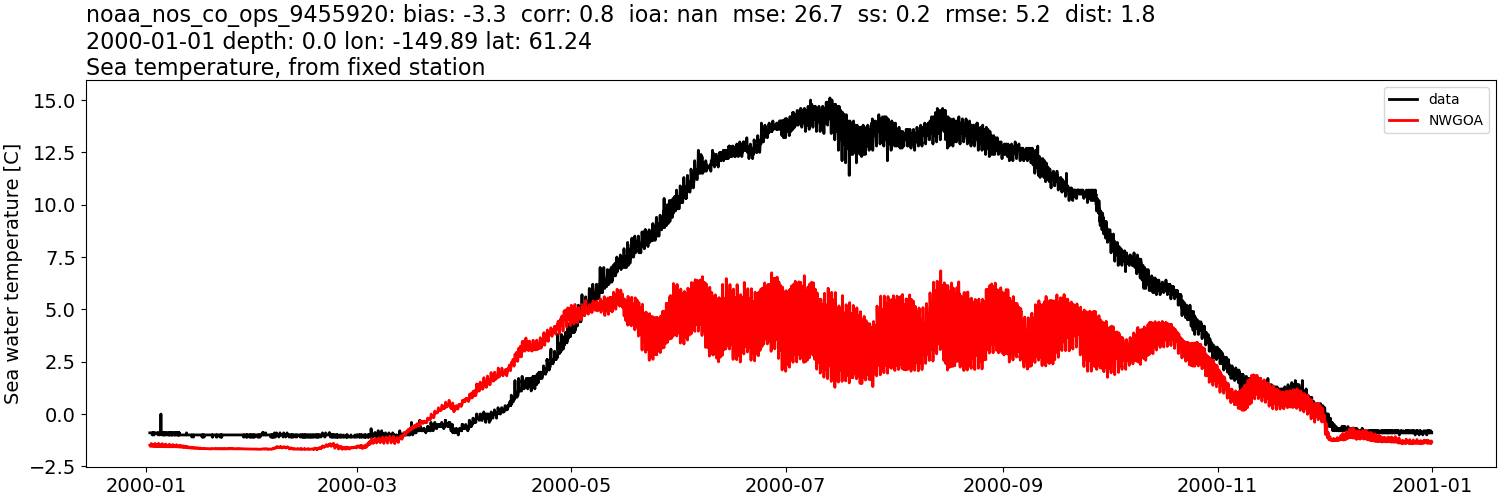
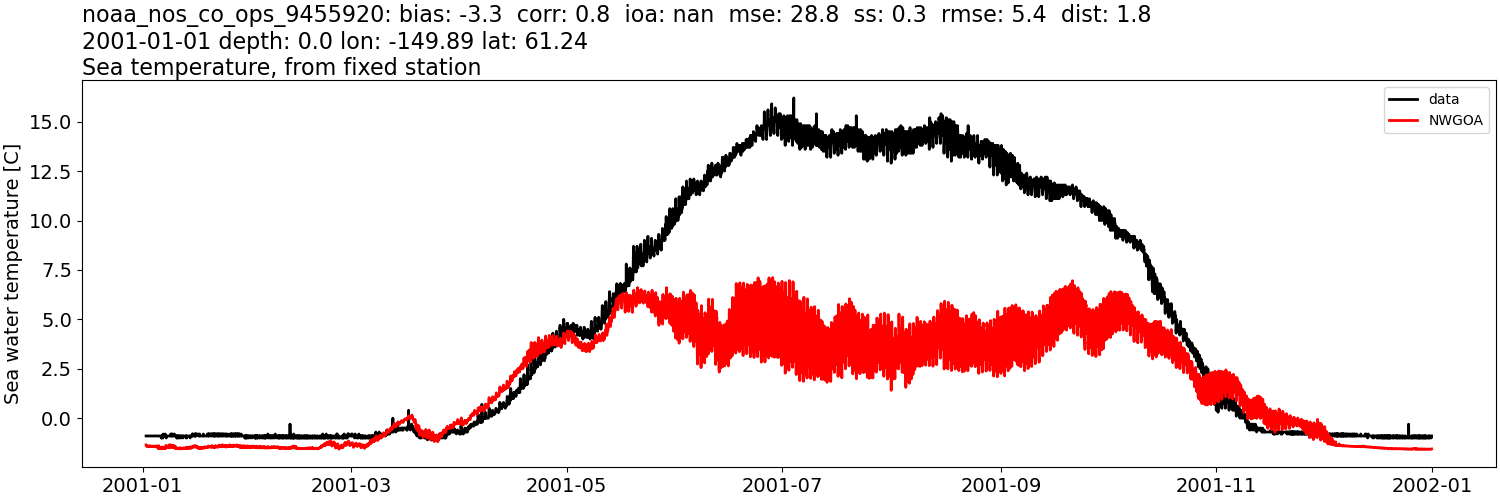
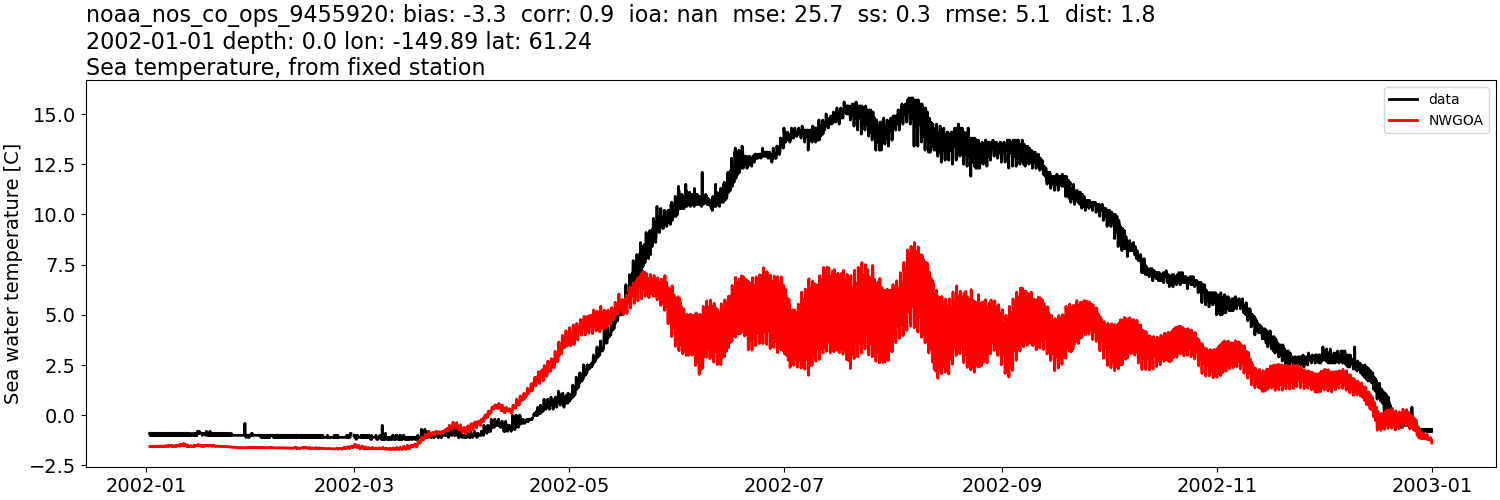
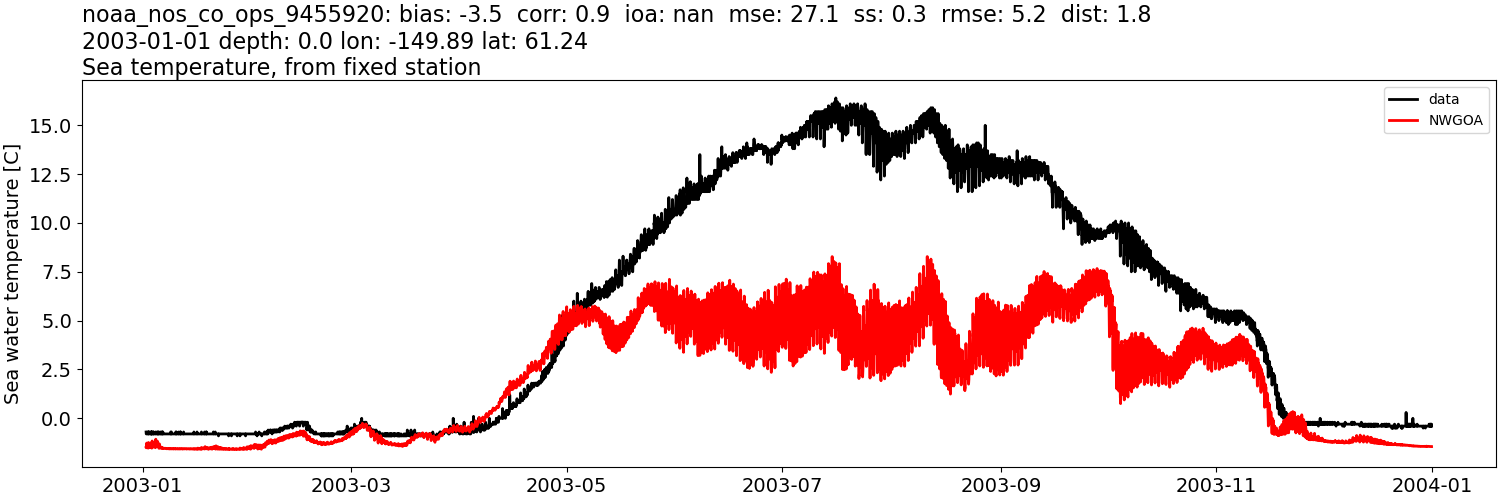
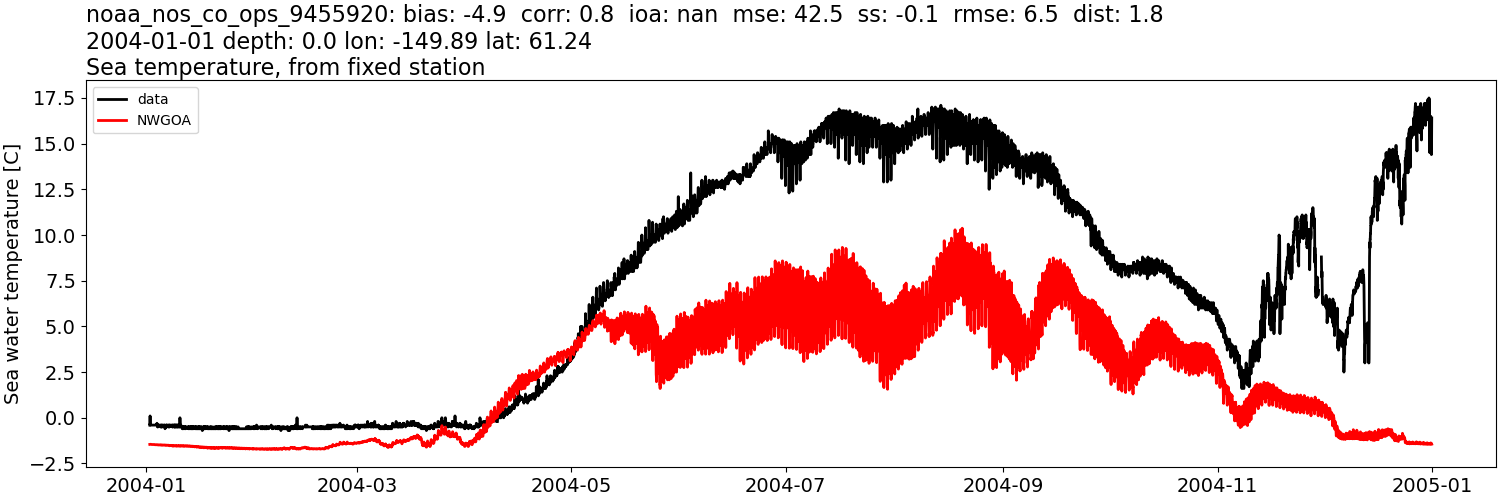
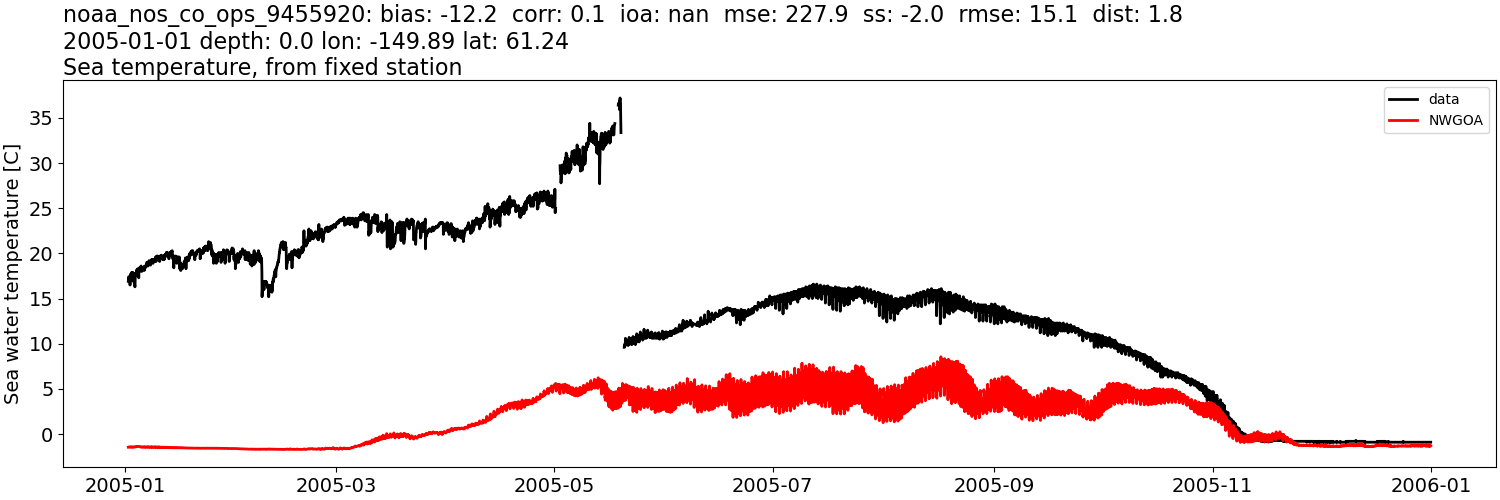
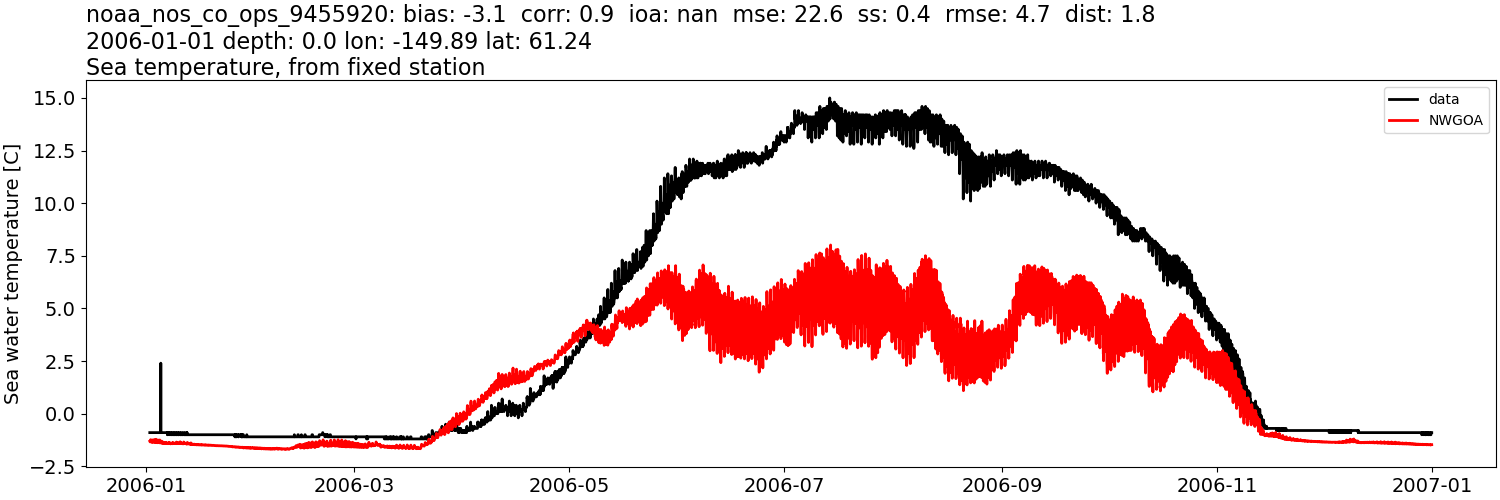
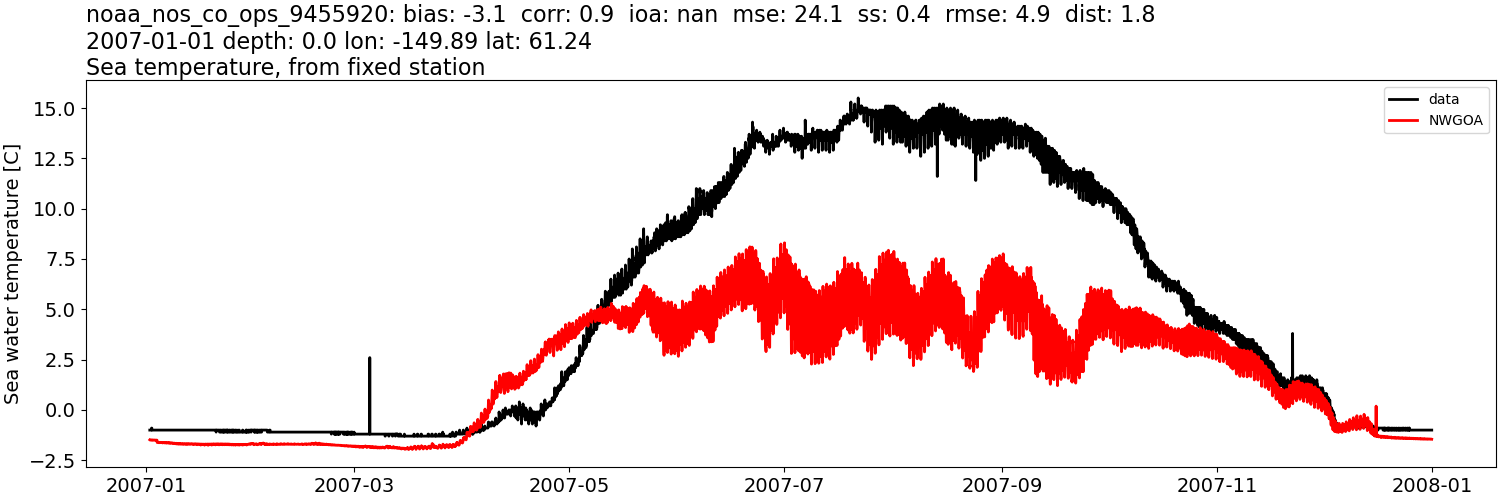
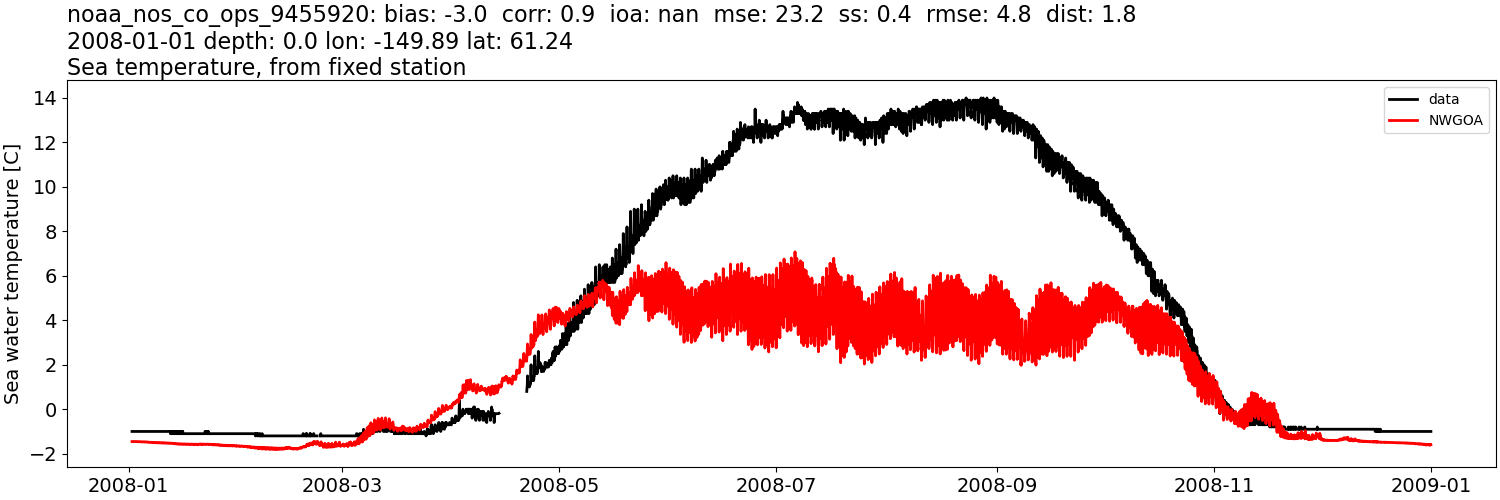
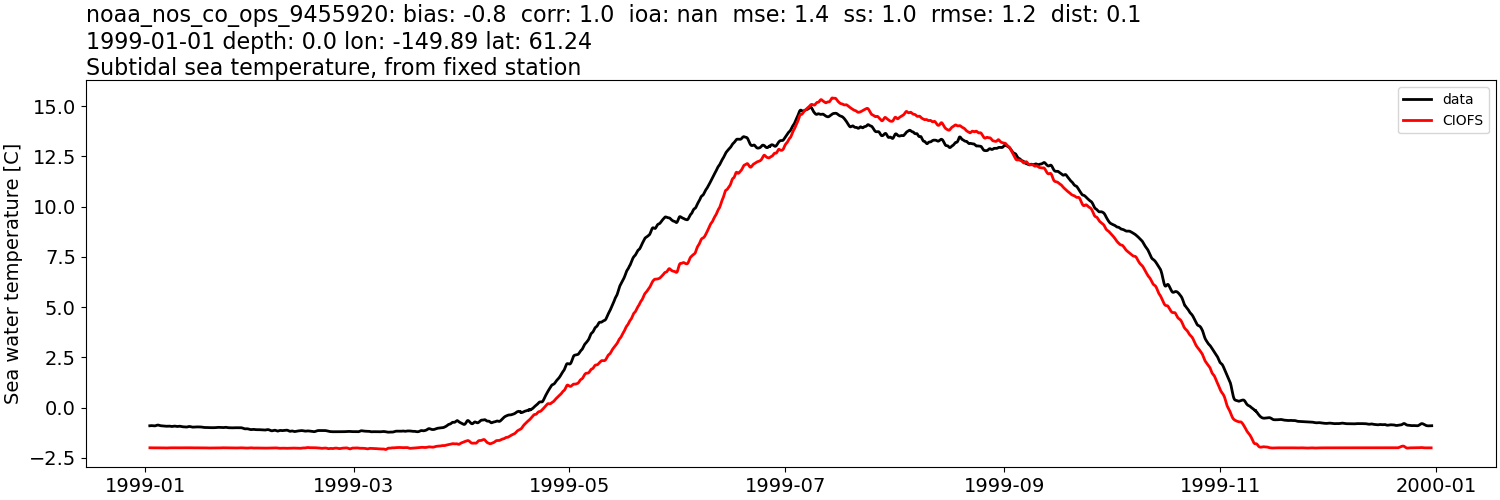
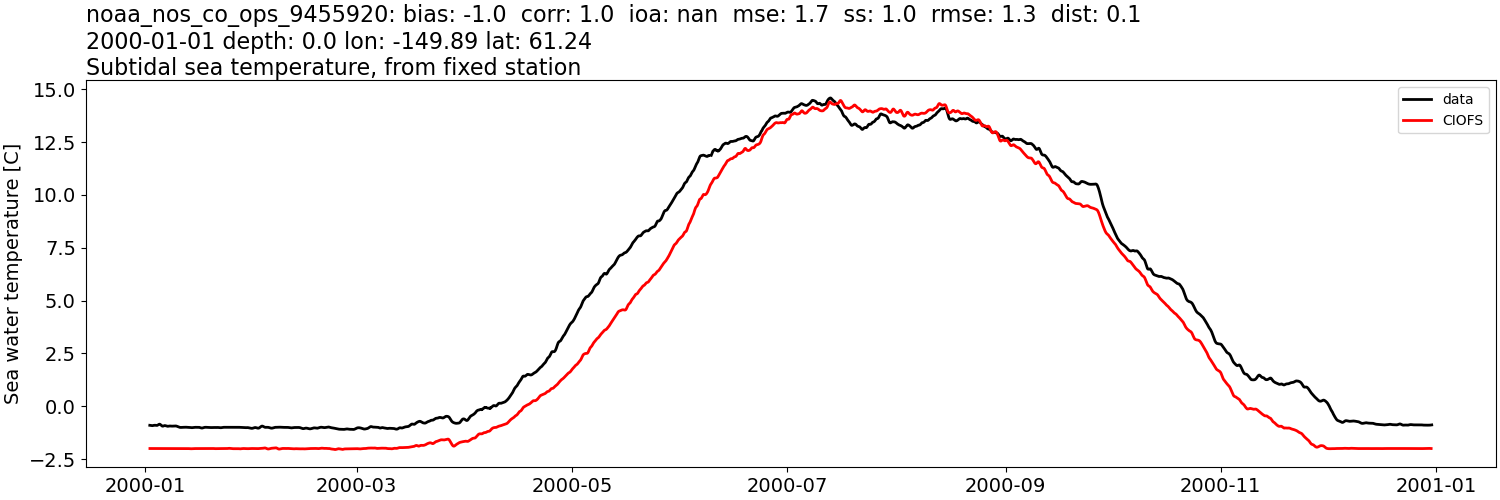
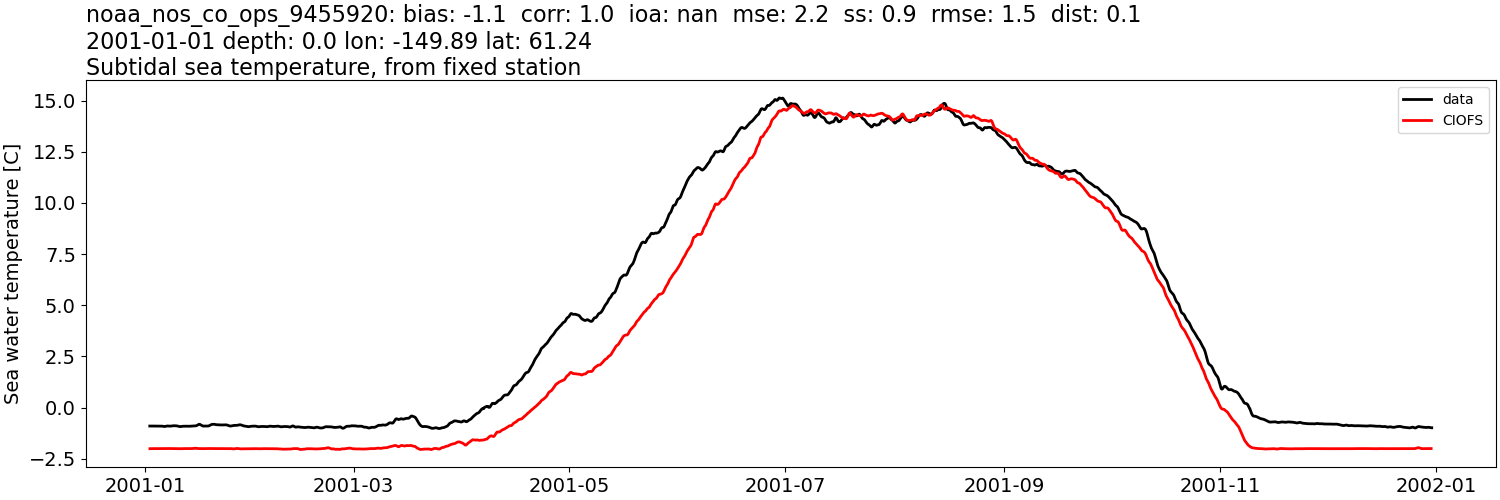
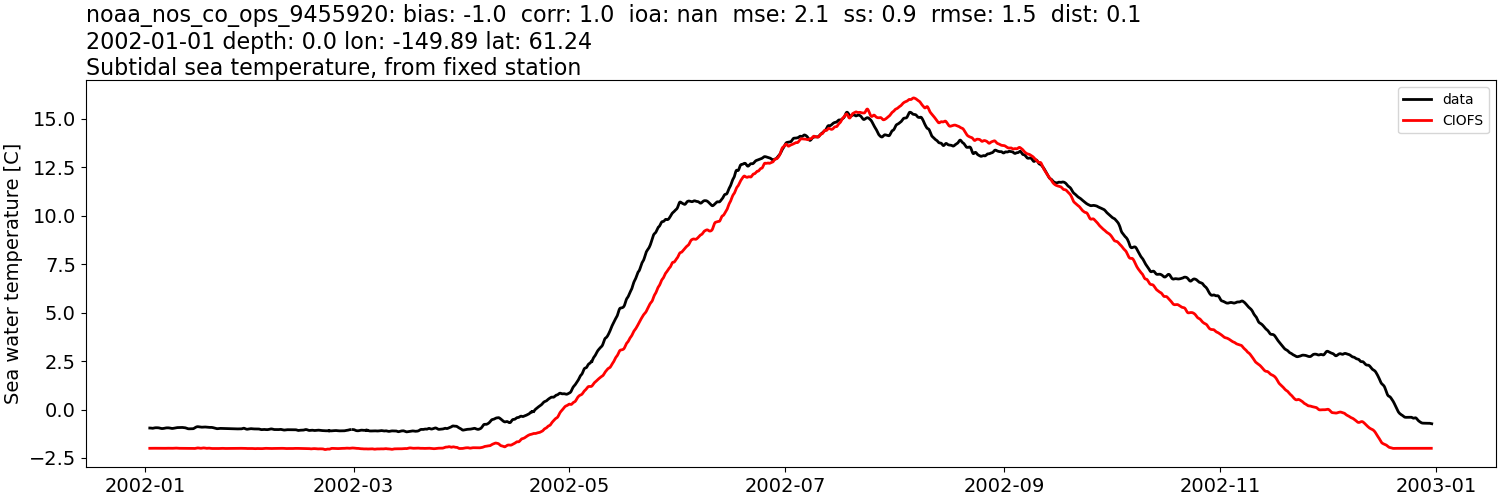
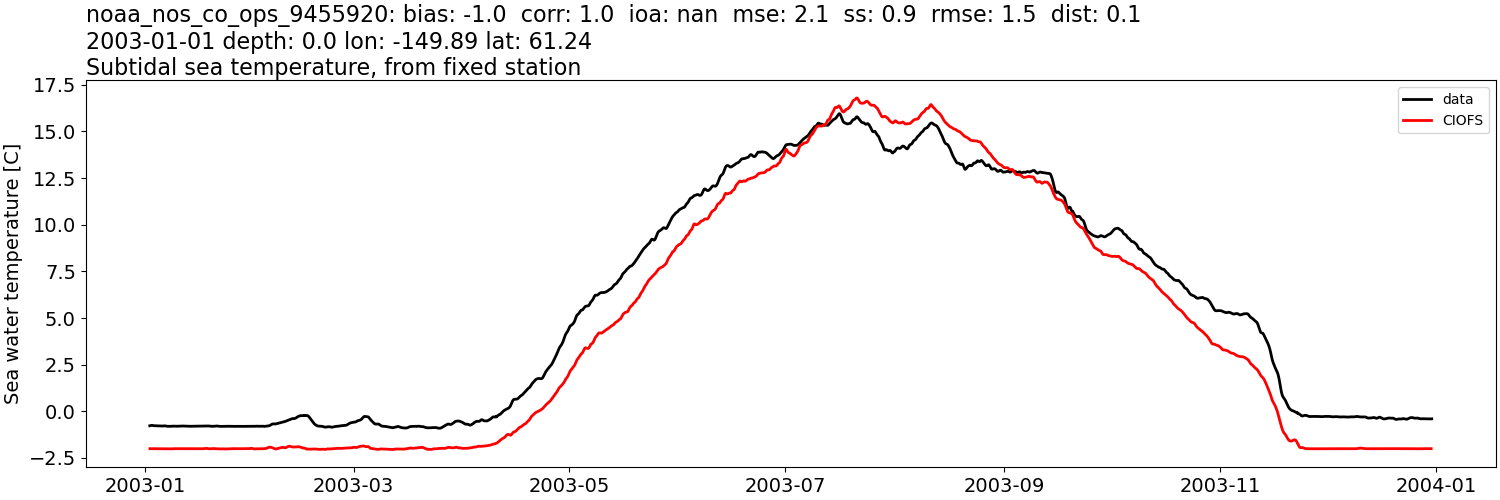
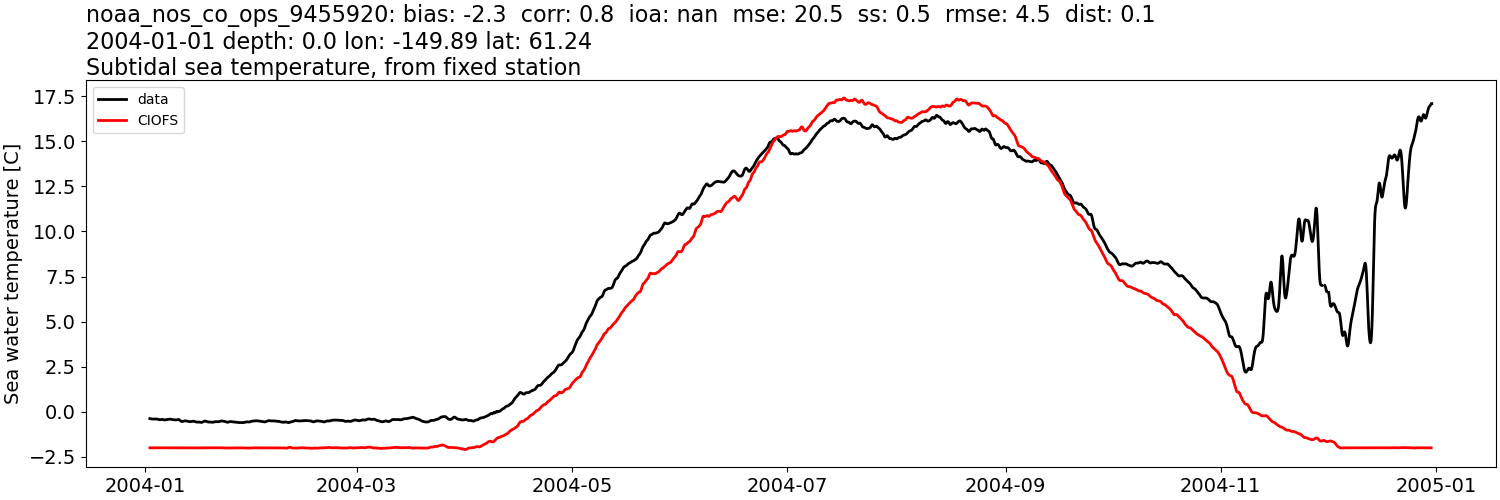
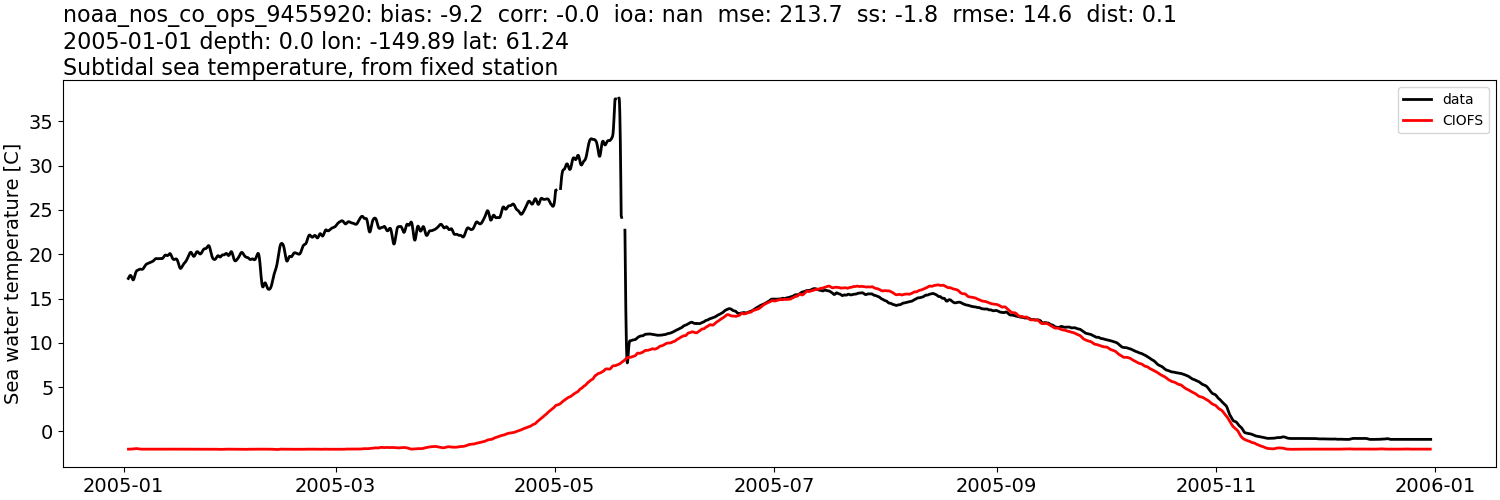
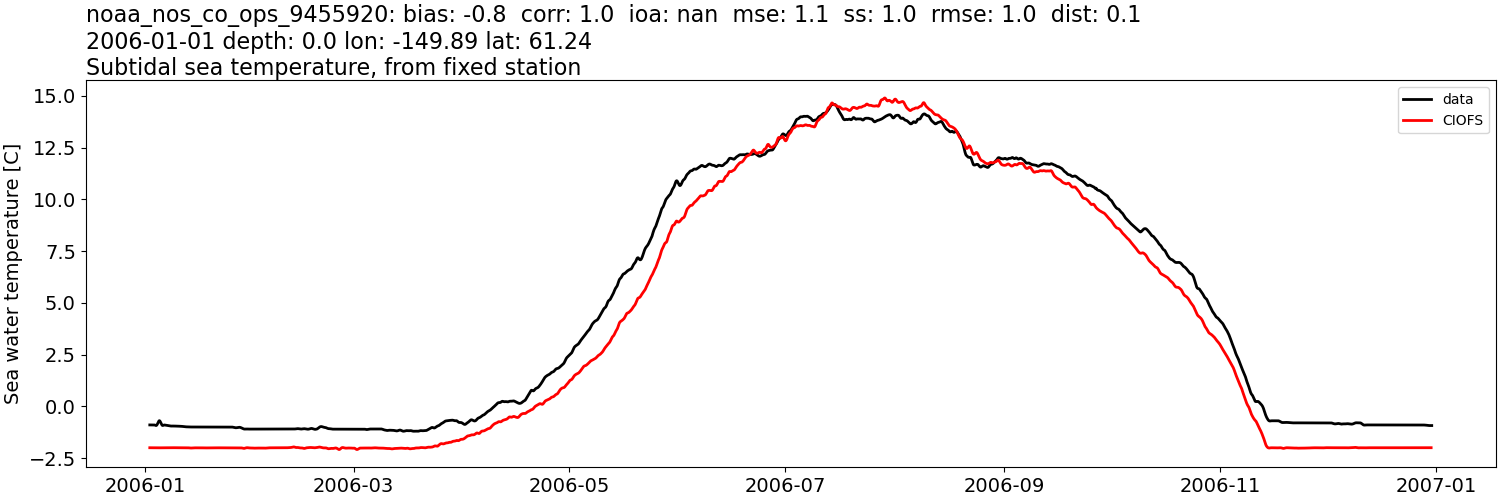
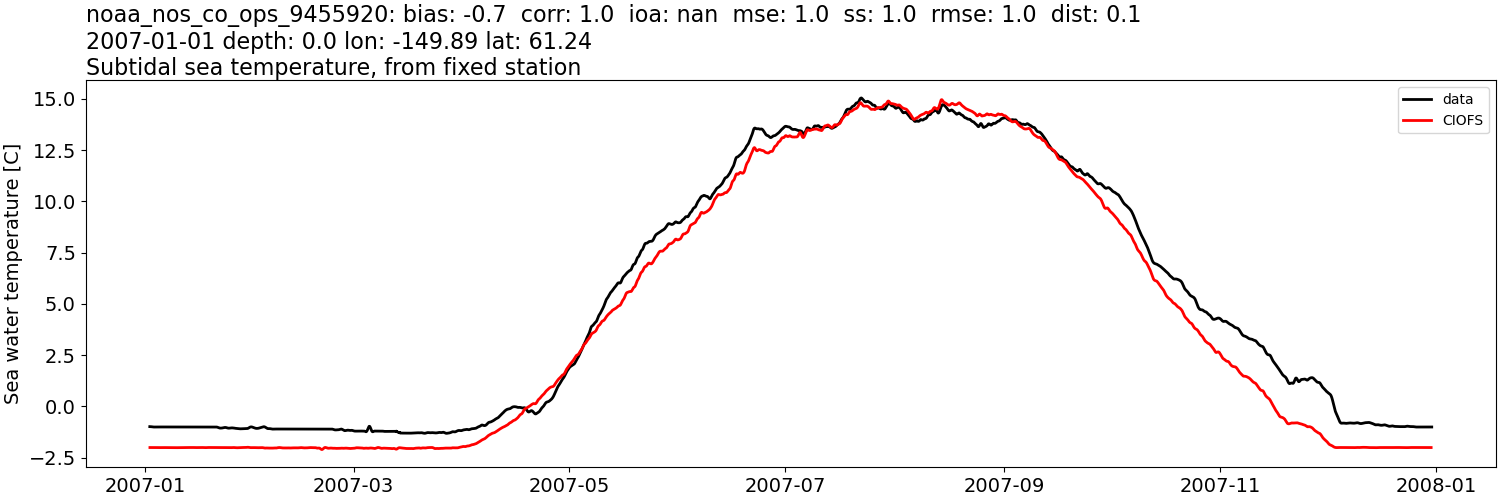
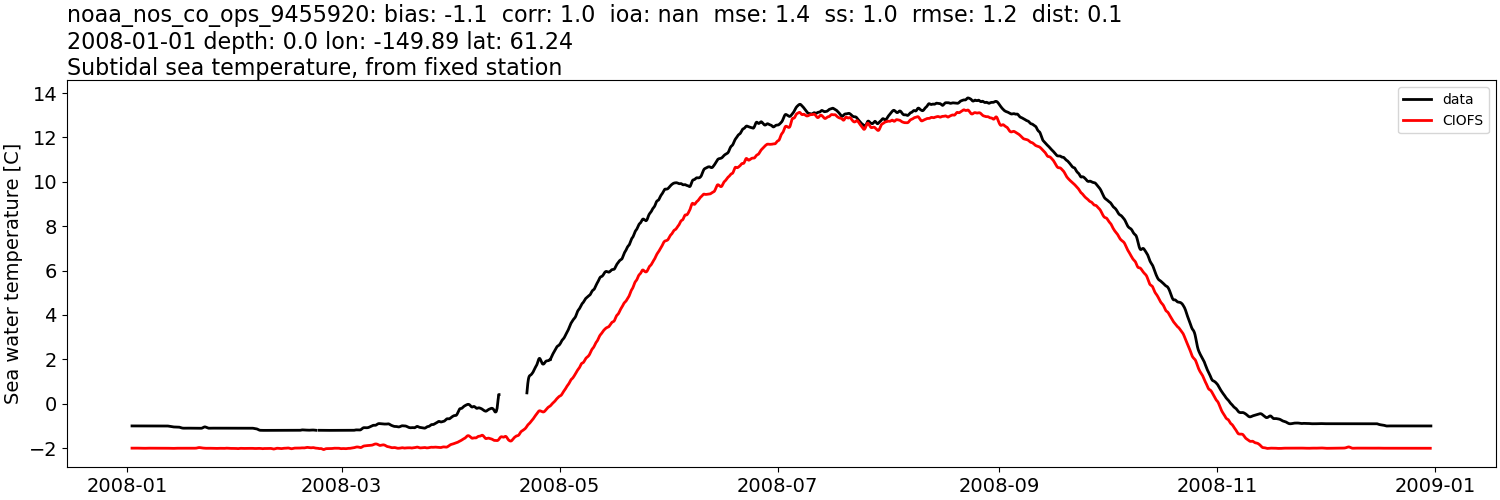
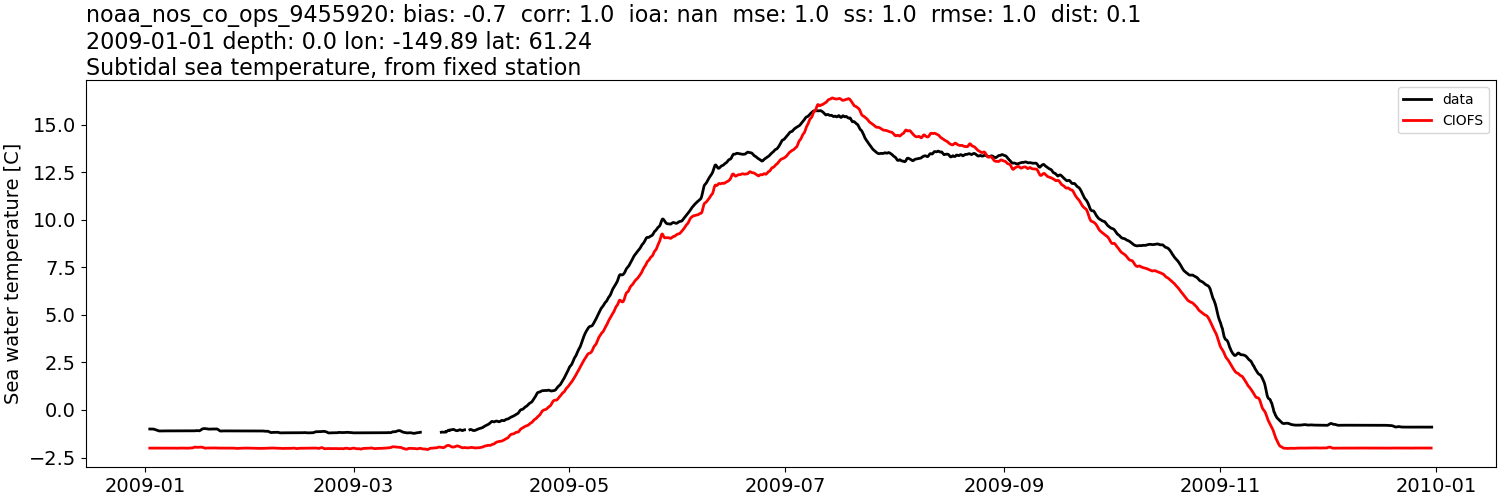
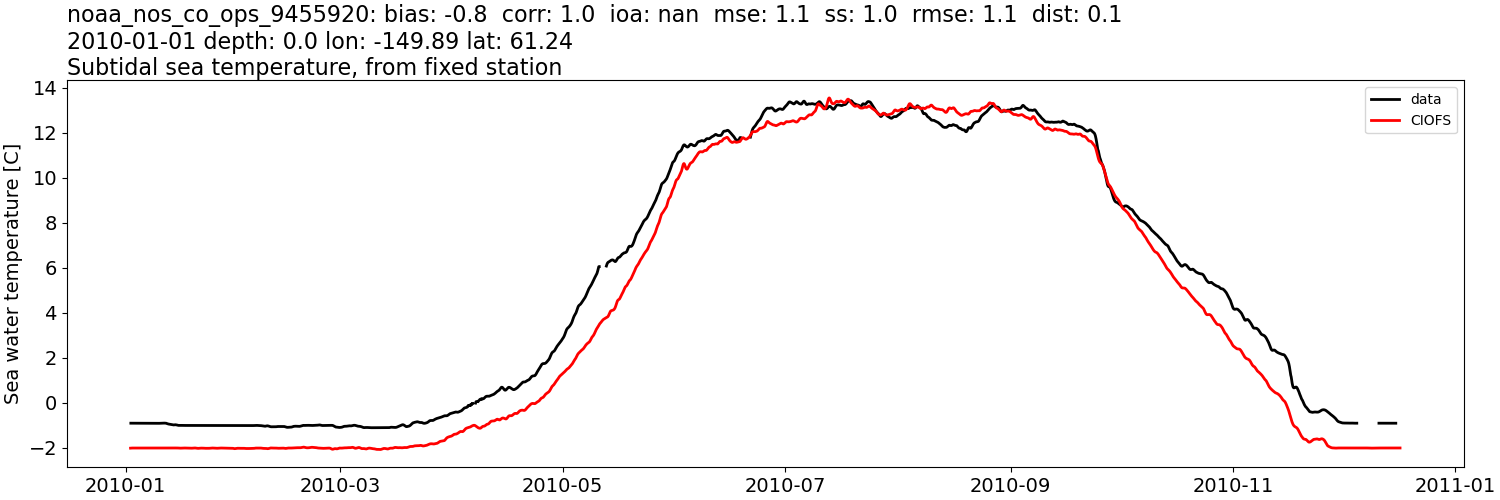
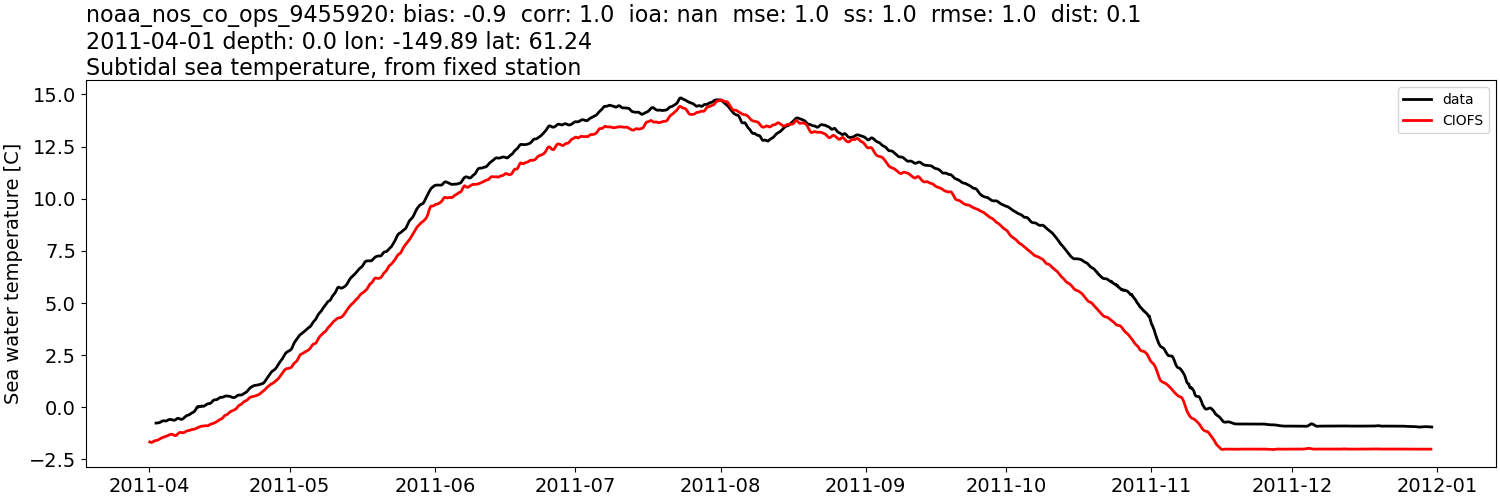
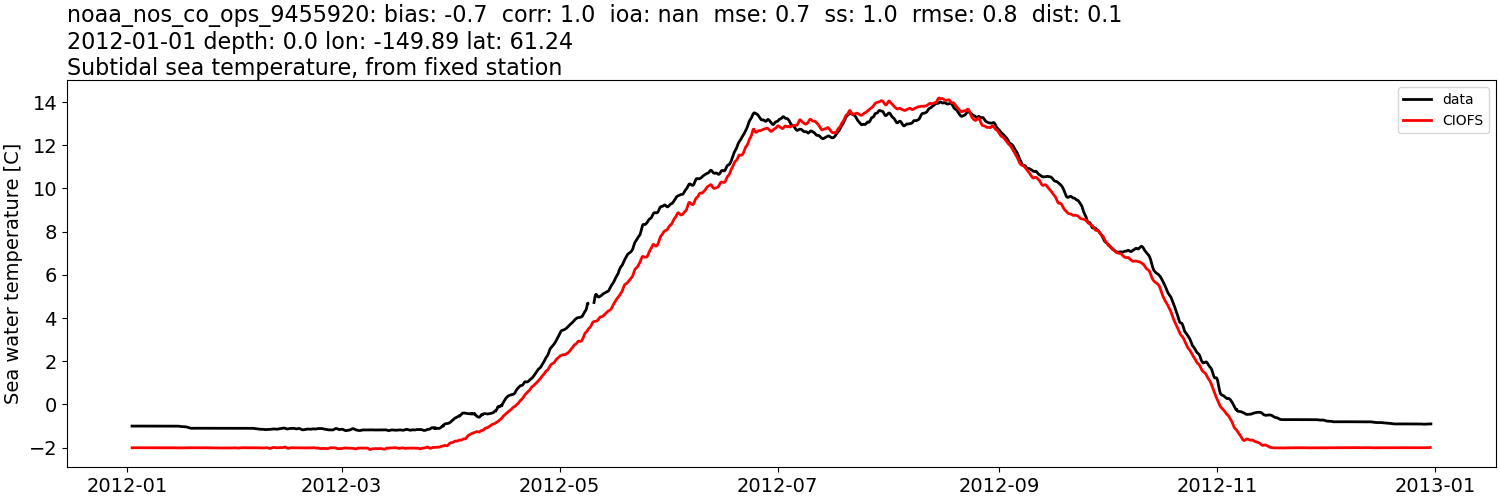
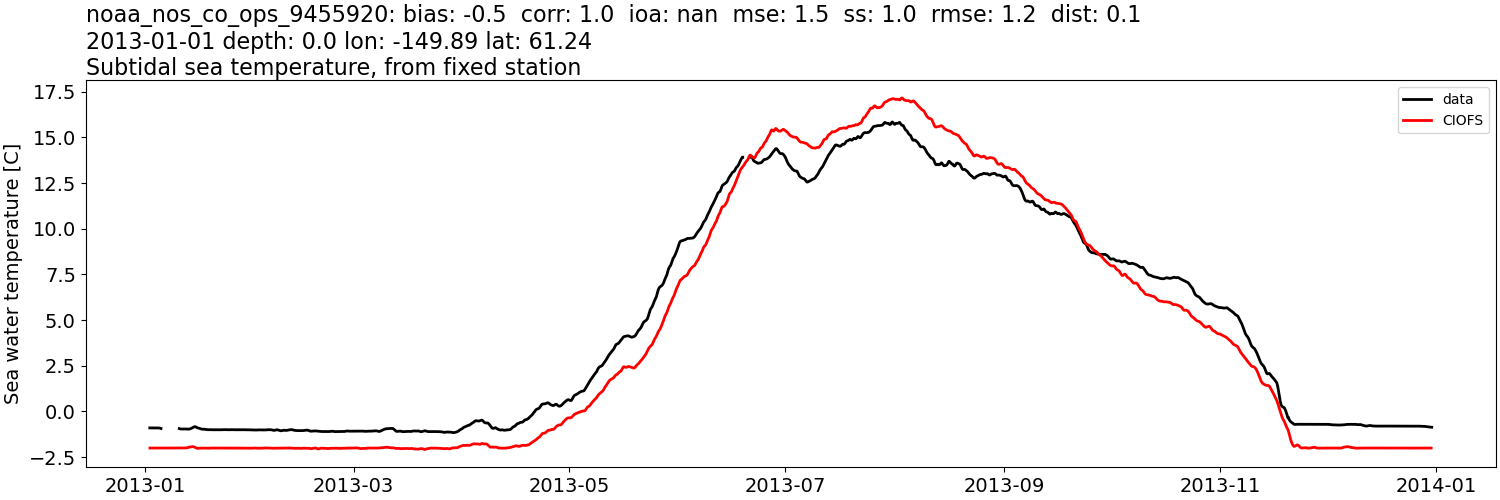
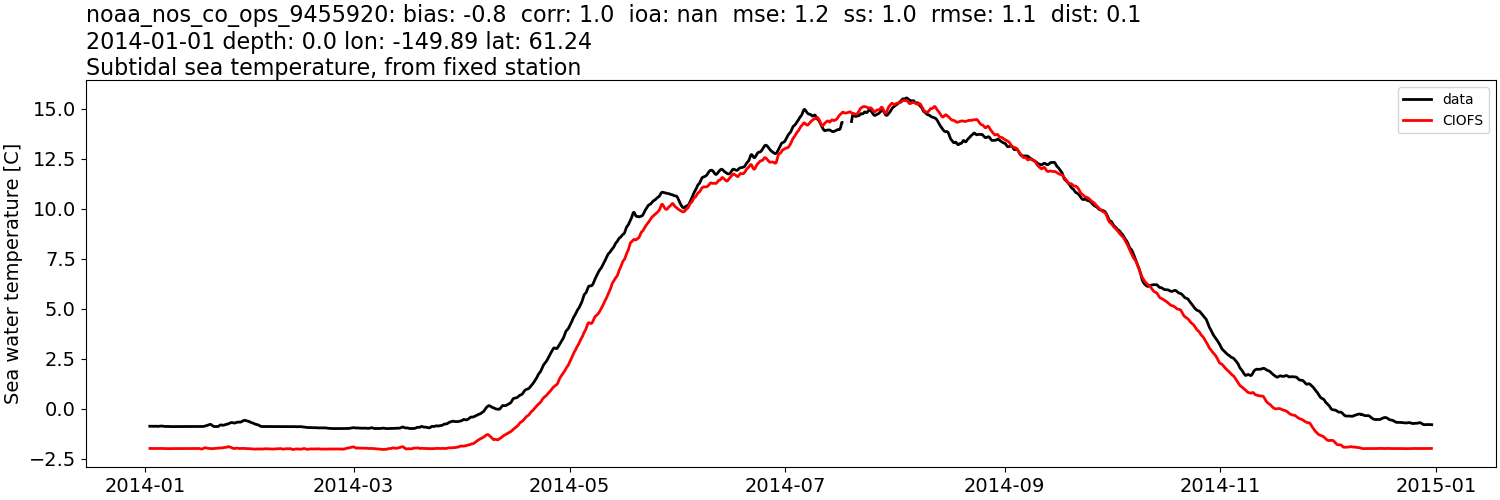
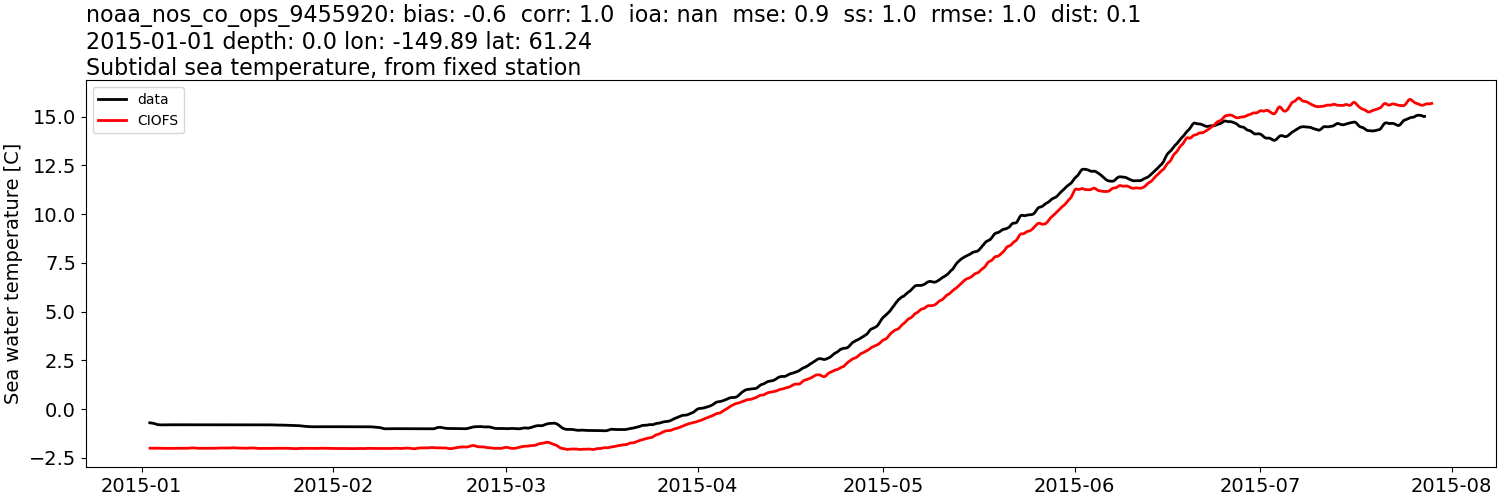
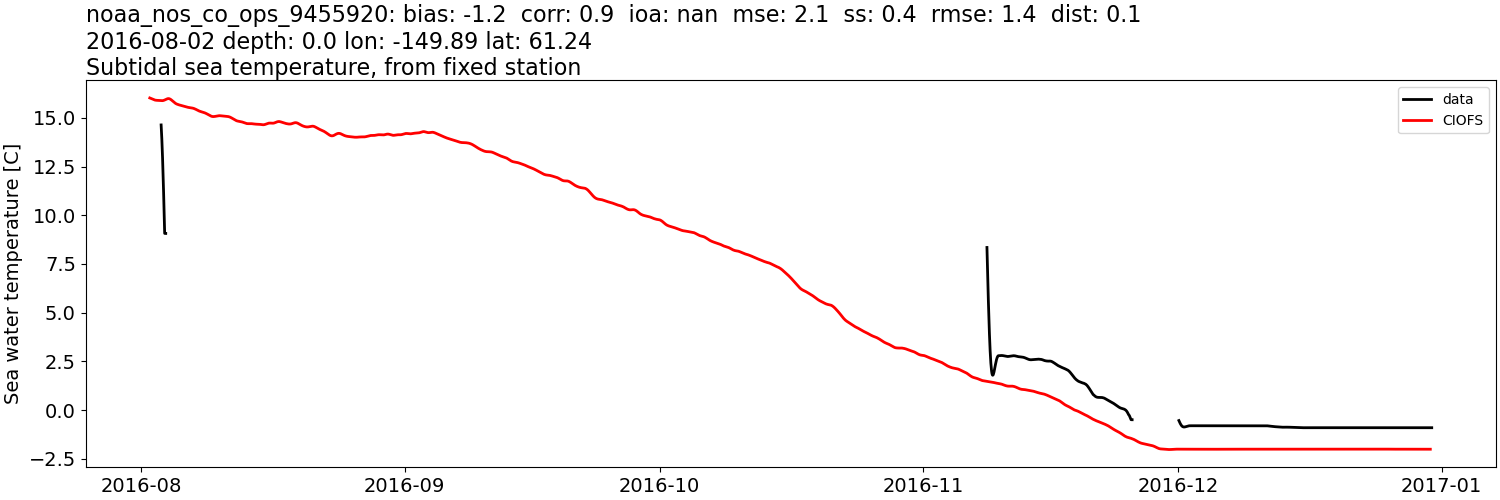
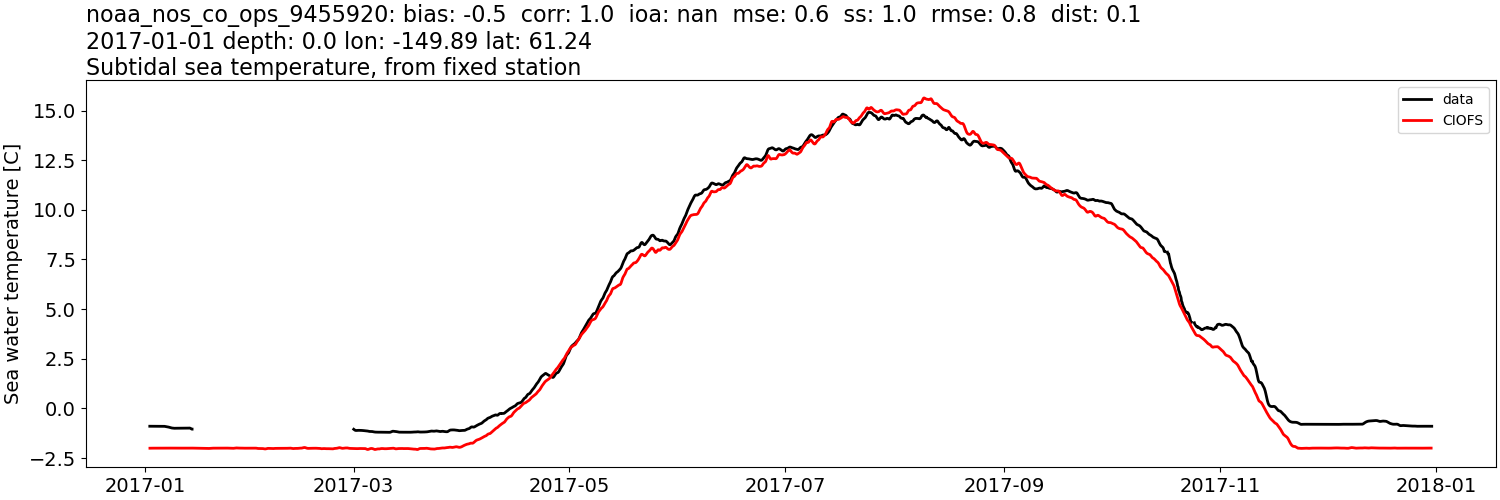
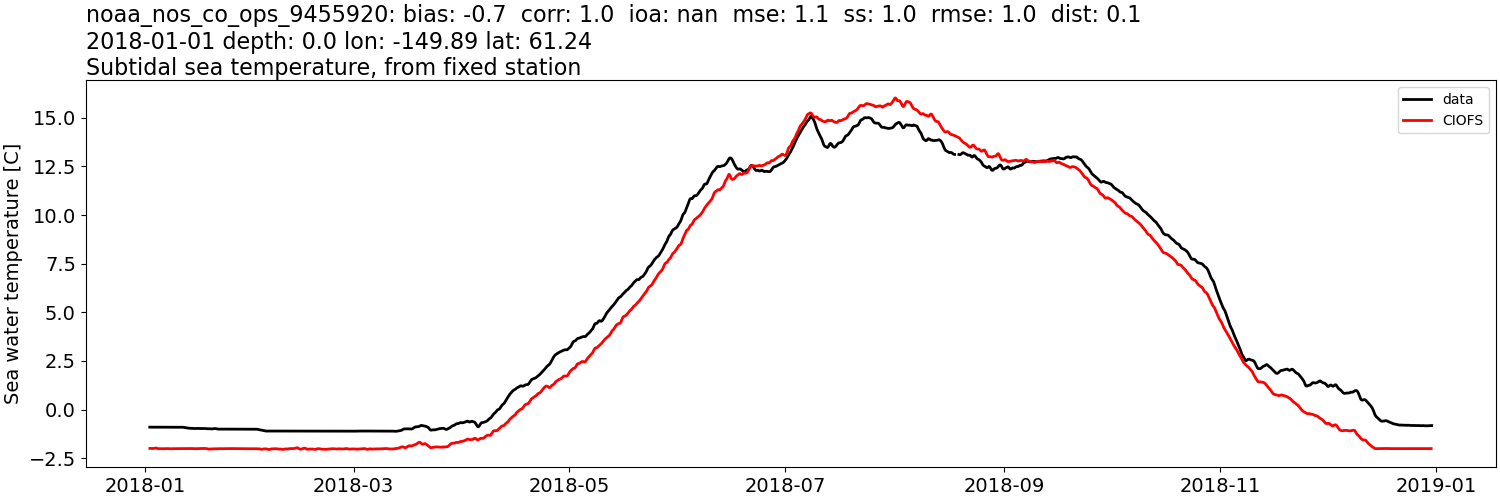
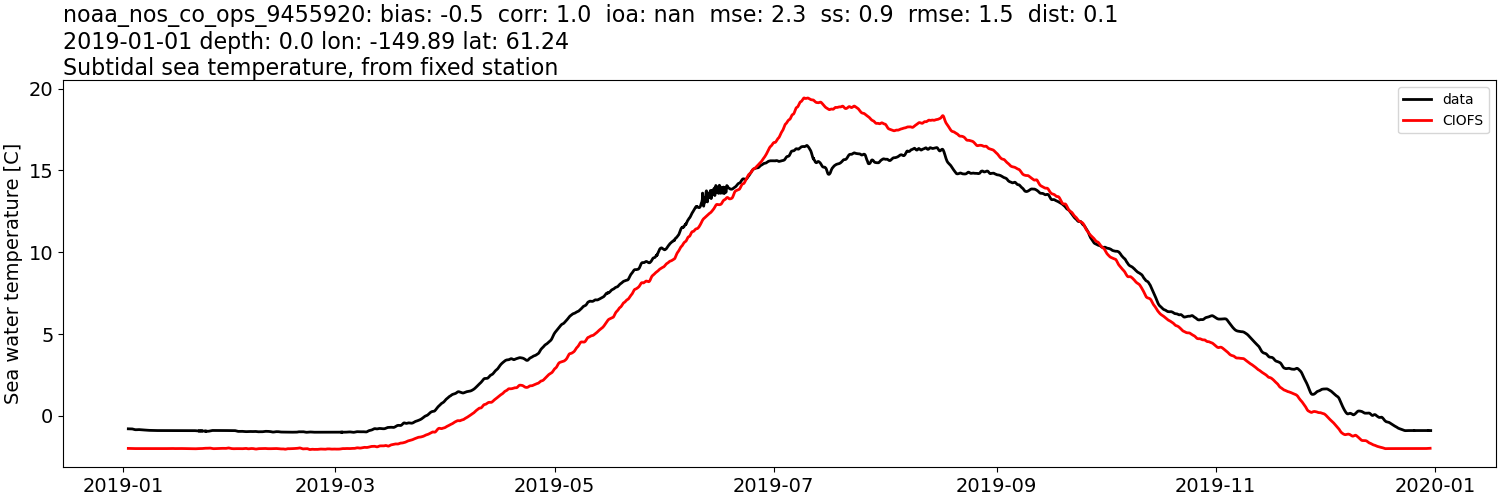
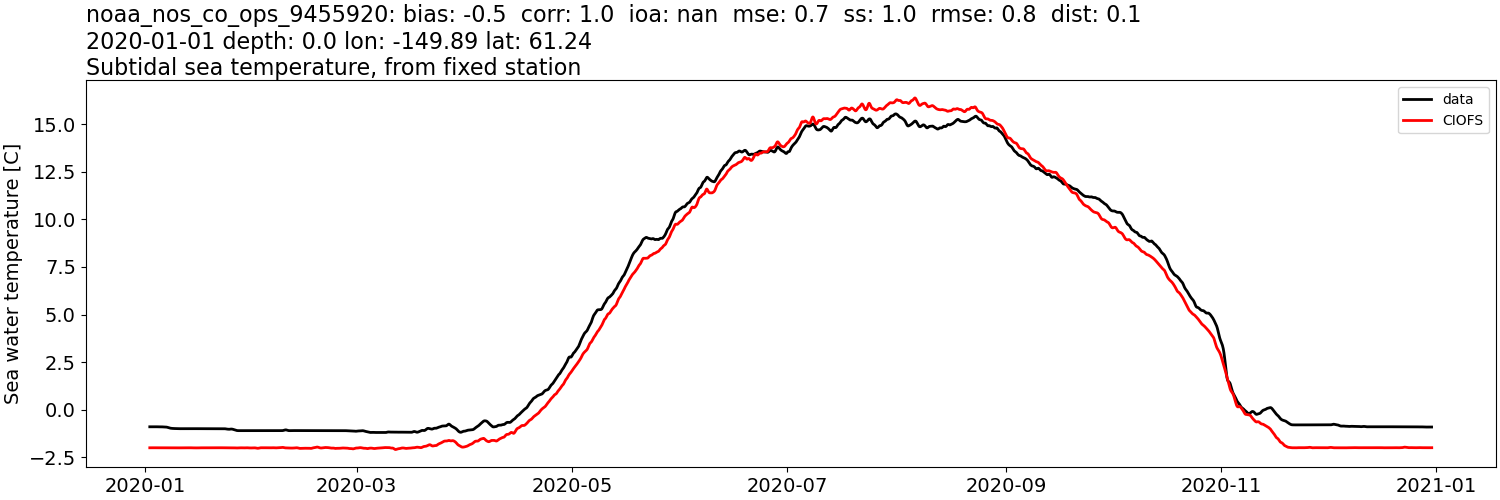
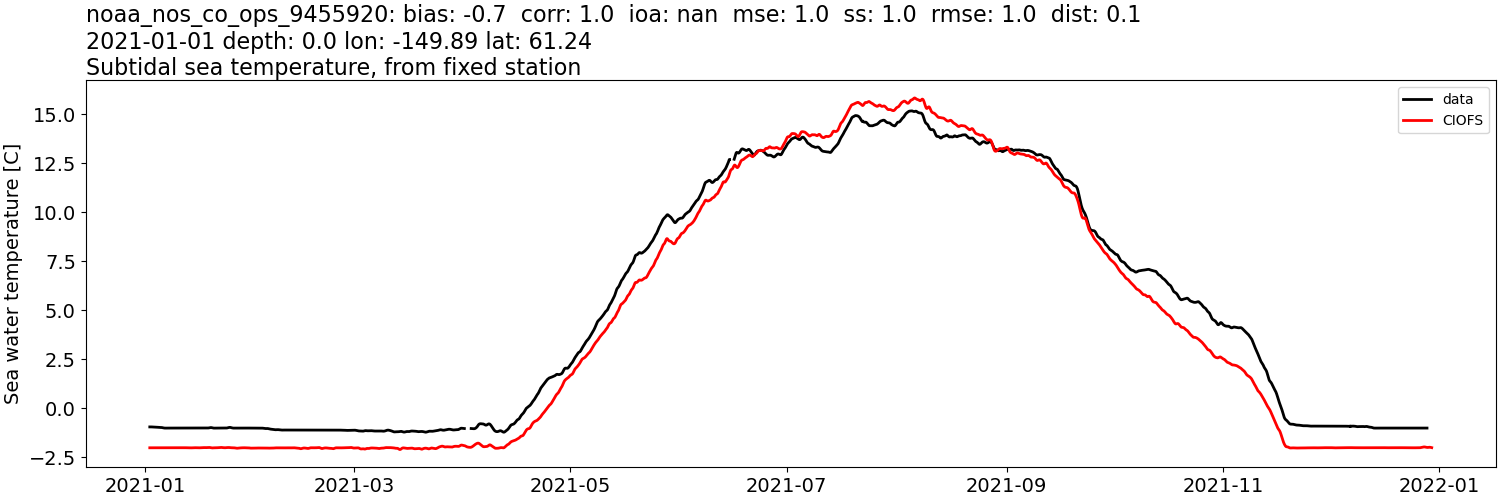
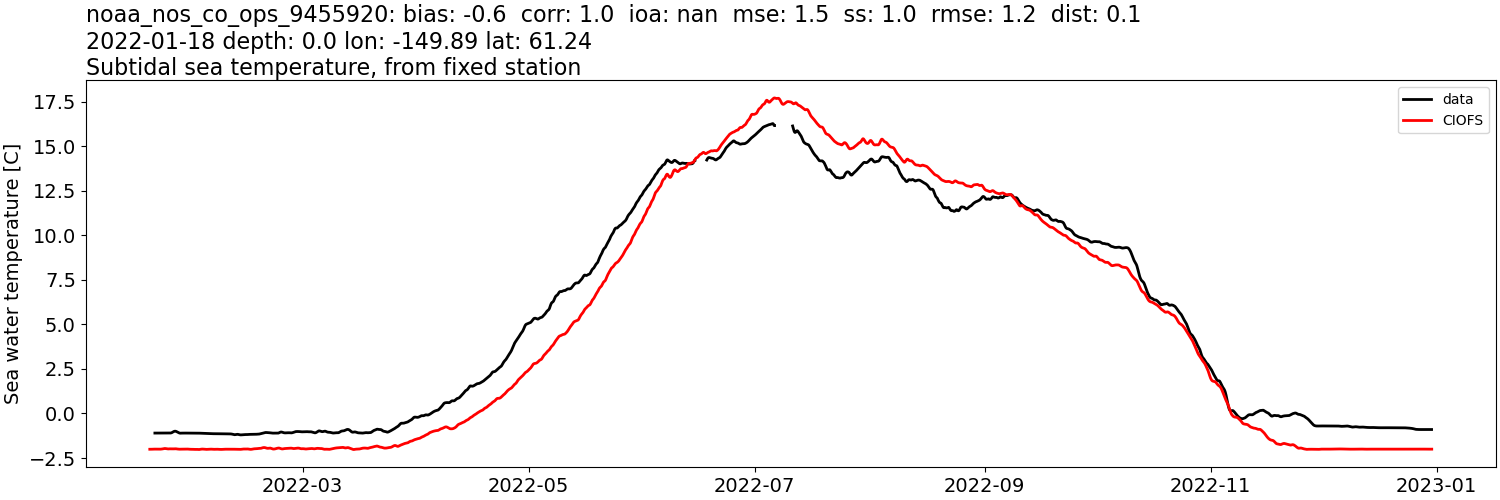
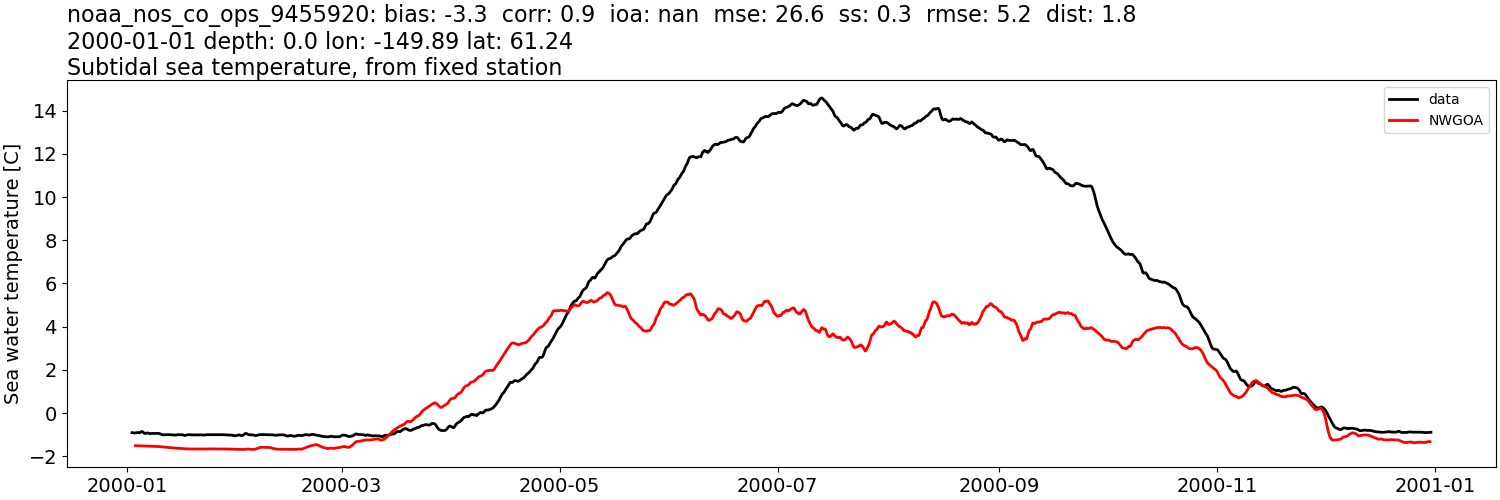
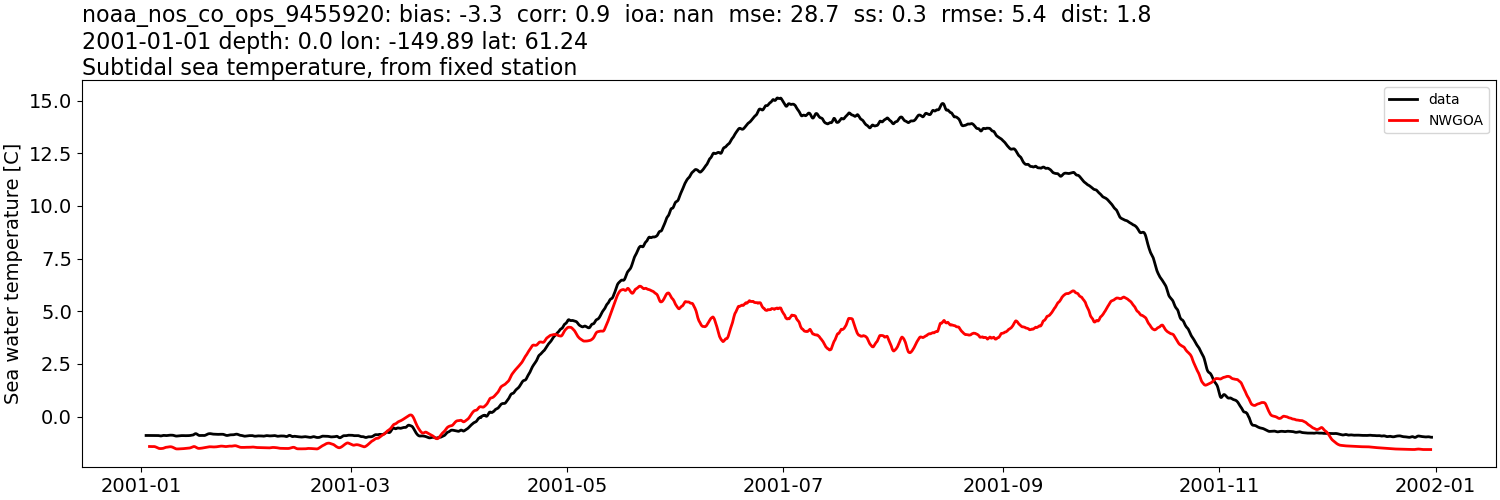
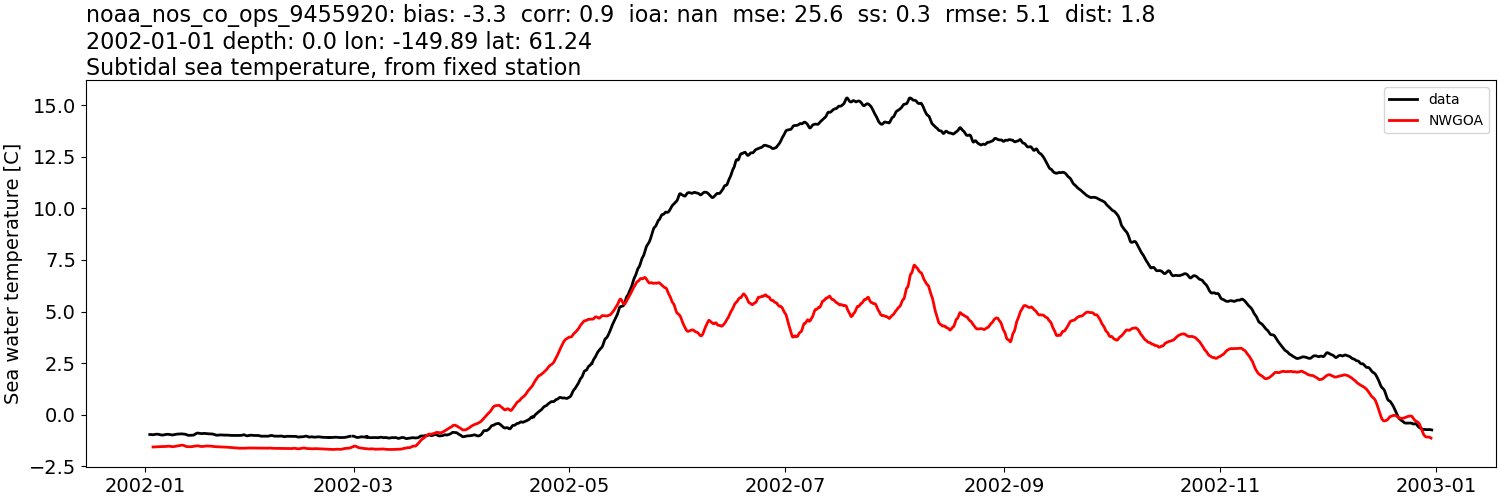
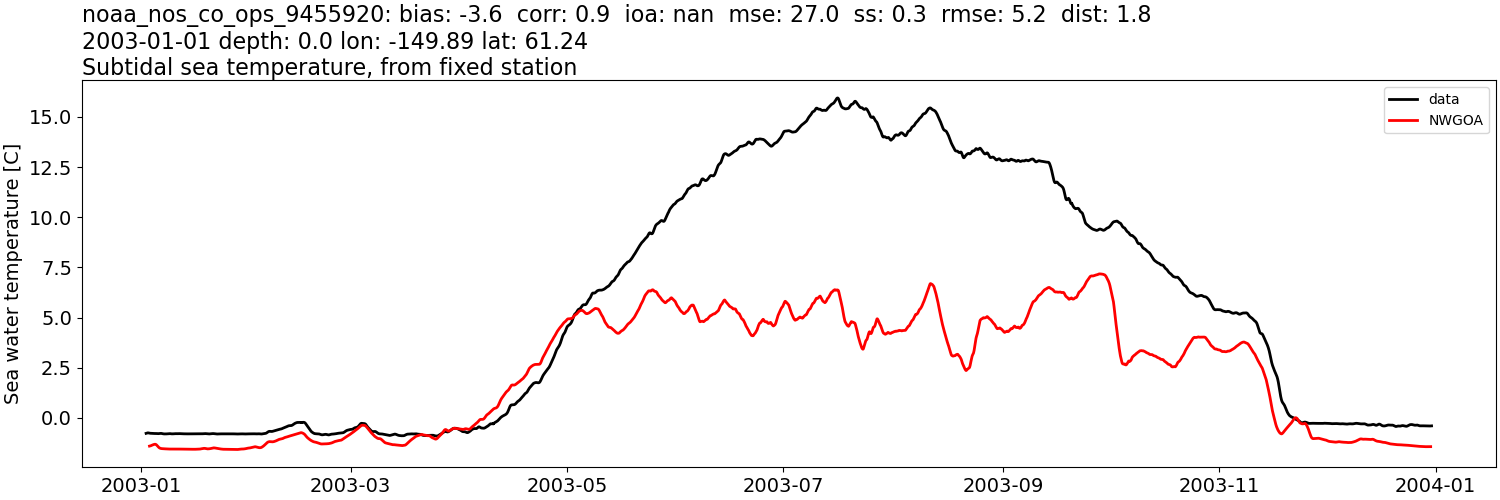
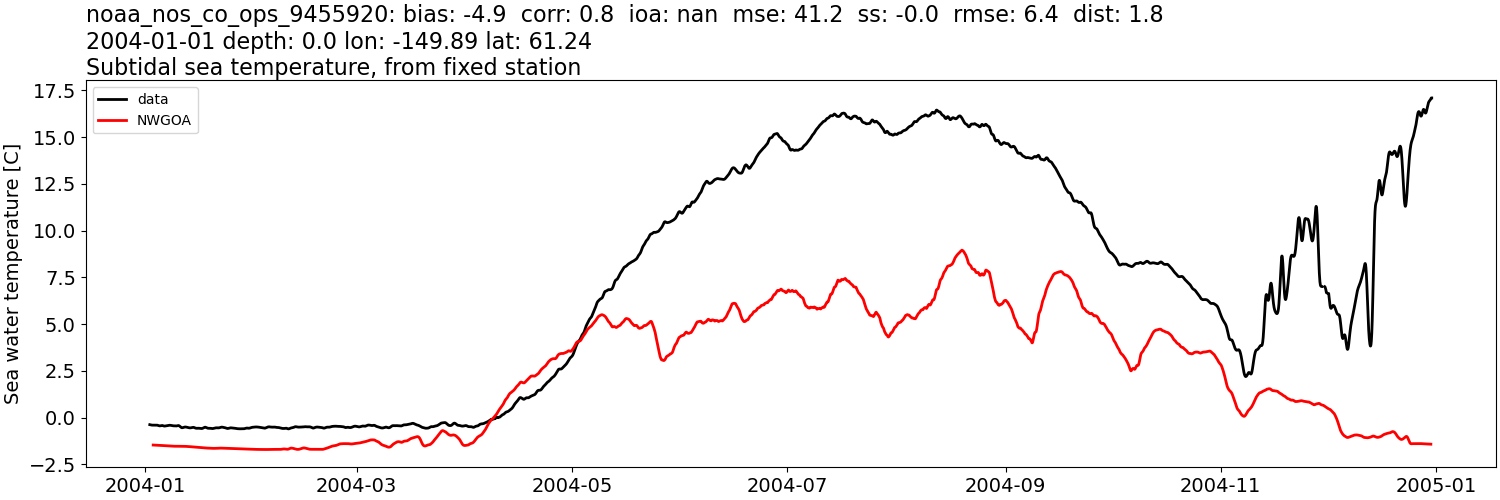
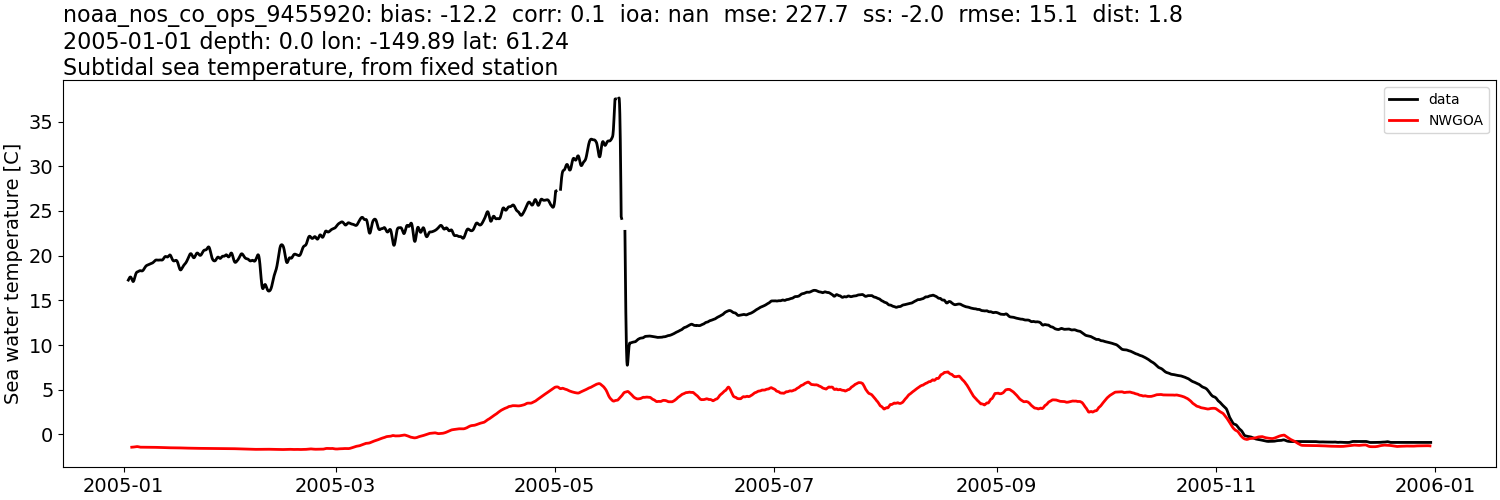
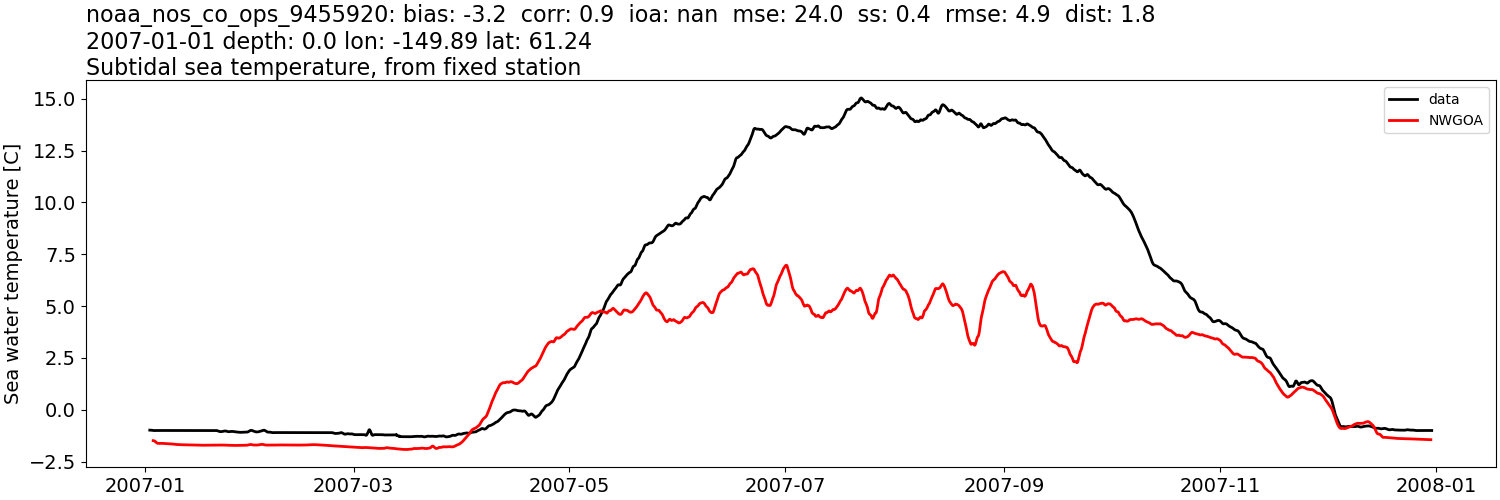
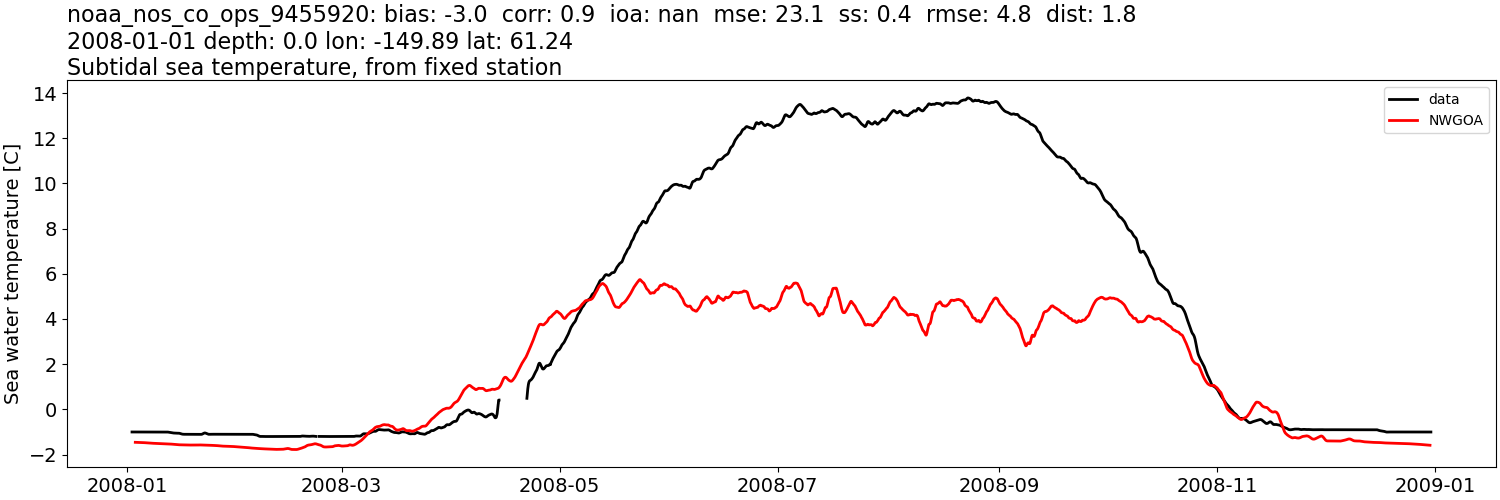
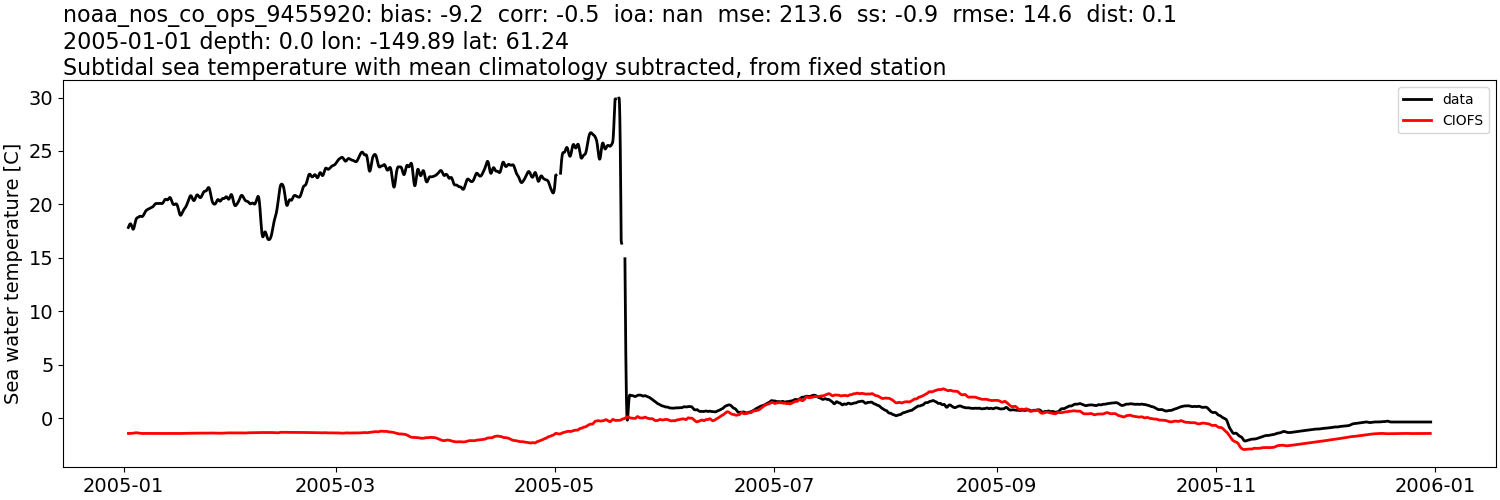
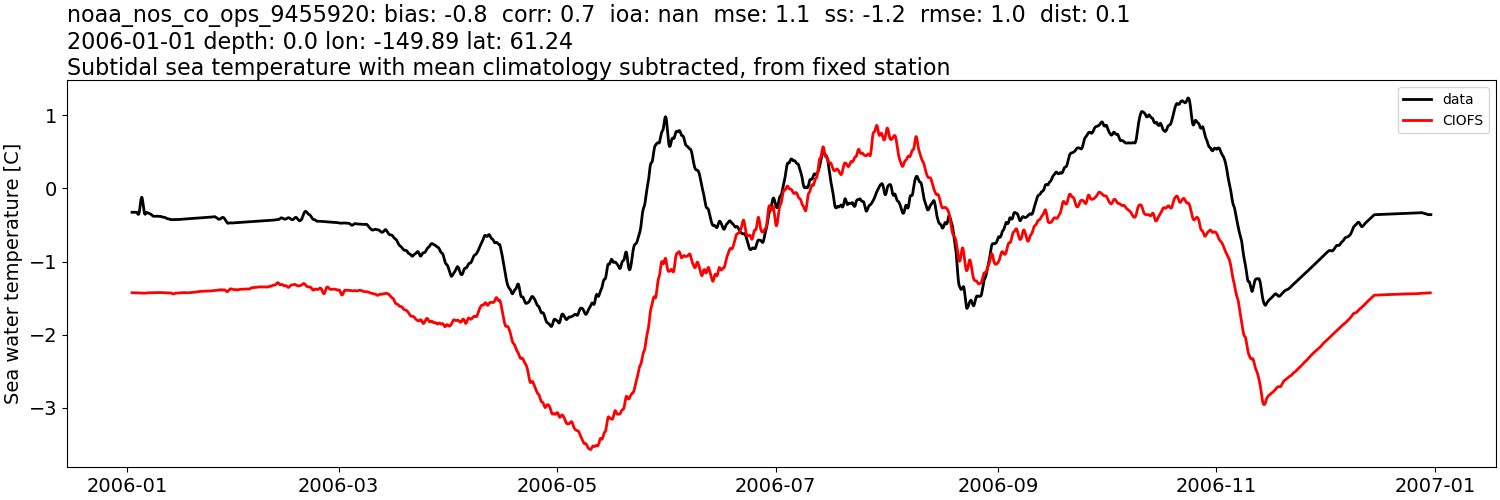
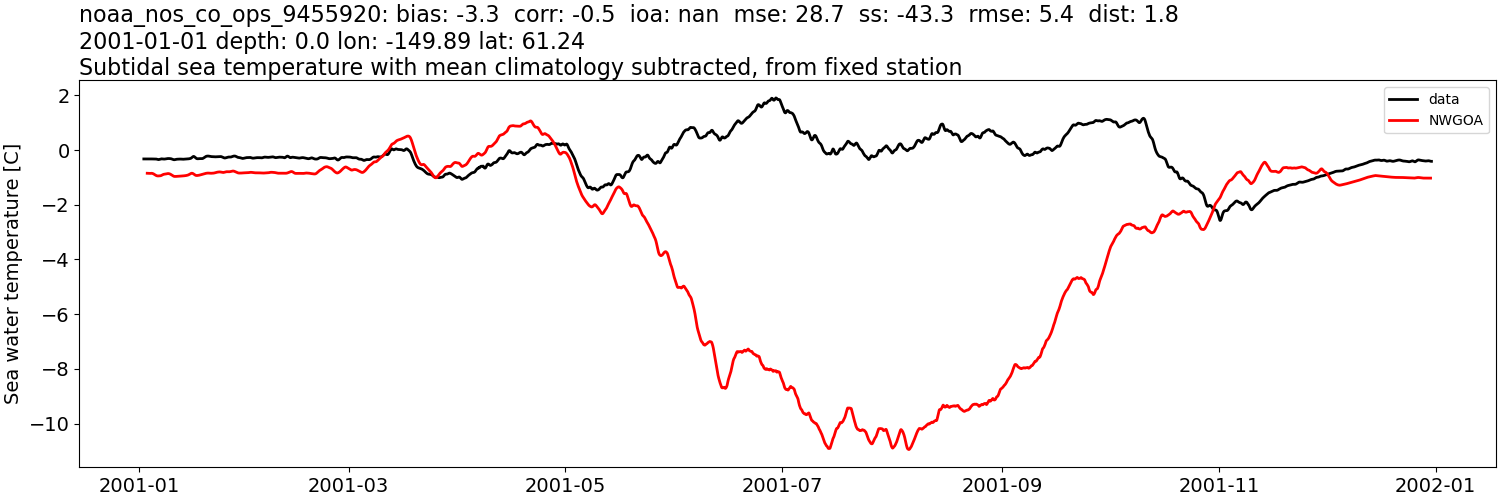
noaa_nos_co_ops_9455920#
Sea surface height: mean subtracted#
CIOFS#
Comparison plots by year
1999
2000
2001
2002
2003

2004
2005
2006

2007

2008
2009
2010
2011
2012
2013
2014
2015
2016
2017
2018
2019
2020
2021
2022
NWGOA#
Comparison plots by year
1999
2000
2001
2002
2003
2004
2005
2006
2007
2008
Sea surface height: mean subtracted, then tidally-filtered#
CIOFS#
Comparison plots by year
1999

2000

2001

2002

2003

2004

2005

2006

2007

2008
2009

2010

2011

2012

2013

2014

2015

2016

2017

2018

2019

2020

2021

2022

NWGOA#
Comparison plots by year
1999

2000

2001

2002

2003

2004
2005

2006

2007

2008

Sea water temperature:#
CIOFS#
Comparison plots by year
1999
2000
2001
2002
2003
2004
2005
2006
2007
2008
2009
2010
2011
2012
2013
2014
2015
2016
2017
2018
2019
2020
2021
2022
NWGOA#
Comparison plots by year
1999
2000
2001
2002
2003
2004
2005
2006
2007
2008
Sea water temperature: tidally-filtered#
CIOFS#
Comparison plots by year
1999
2000
2001
2002
2003
2004
2005
2006
2007
2008
2009
2010
2011
2012
2013
2014
2015
2016
2017
2018
2019
2020
2021
2022
NWGOA#
Comparison plots by year
1999

2000
2001
2002
2003
2004
2005
2006

2007
2008
Sea water temperature: tidally-filtered, then monthly mean from data subtracted#
CIOFS#
Comparison plots by year
1999

2000

2001

2002

2003

2004

2005
2006
2007

2008

2009

2010

2011

2012

2013

2014

2015

2016

2017

2018

2019

2020

2021

2022

NWGOA#
Comparison plots by year
1999

2000

2001
2002

2003

2004

2005

2006

2007

2008

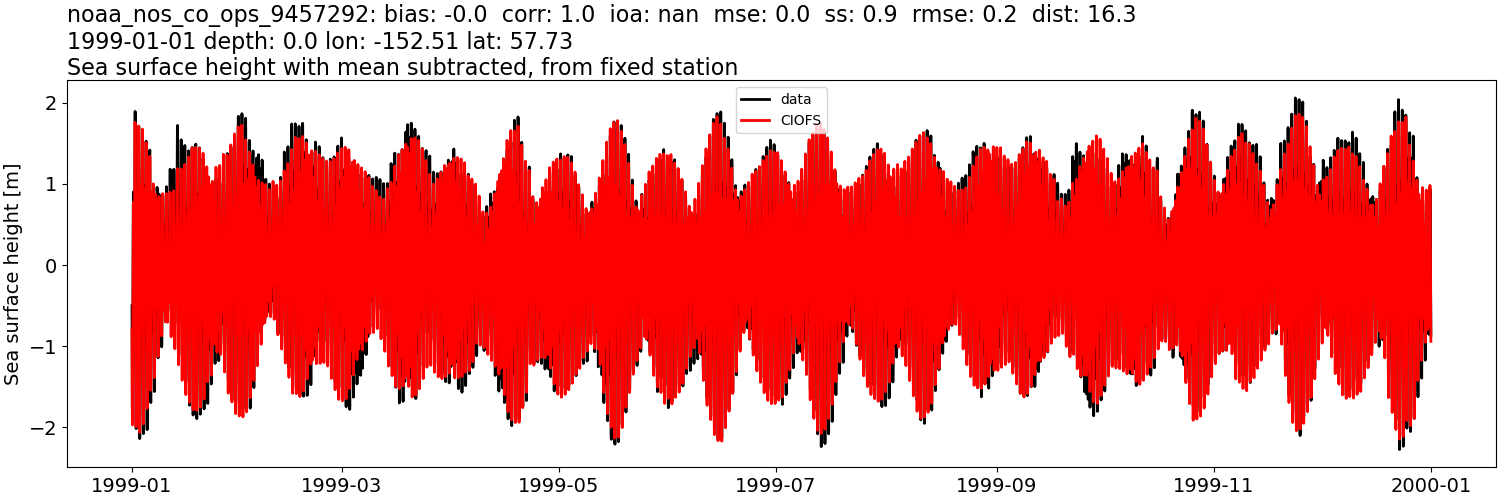
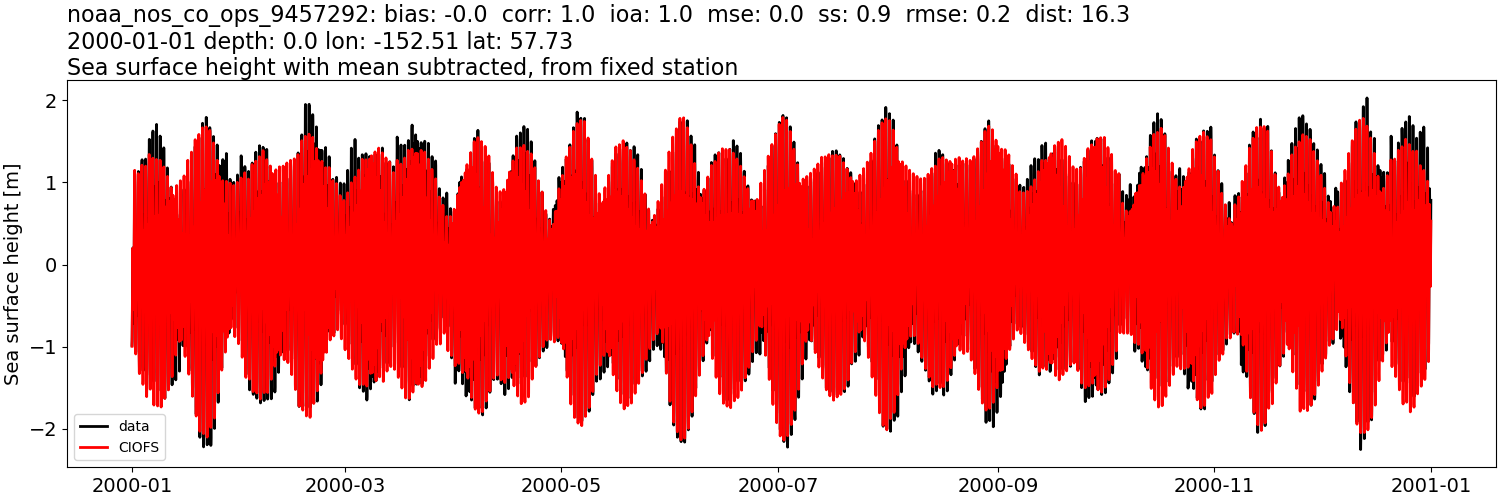
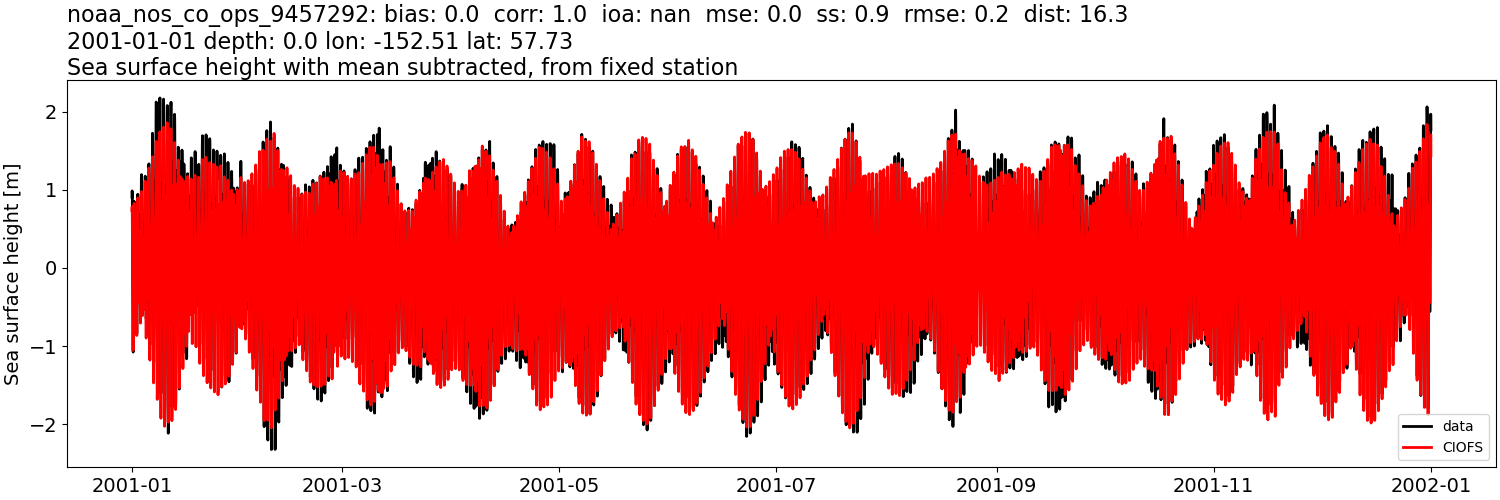
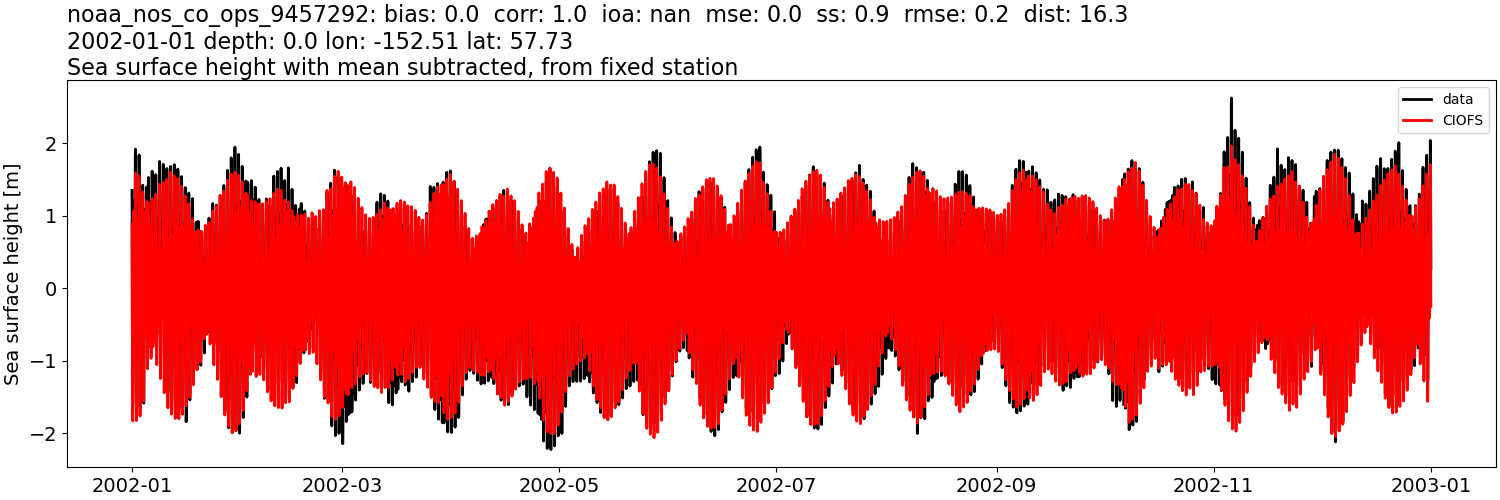
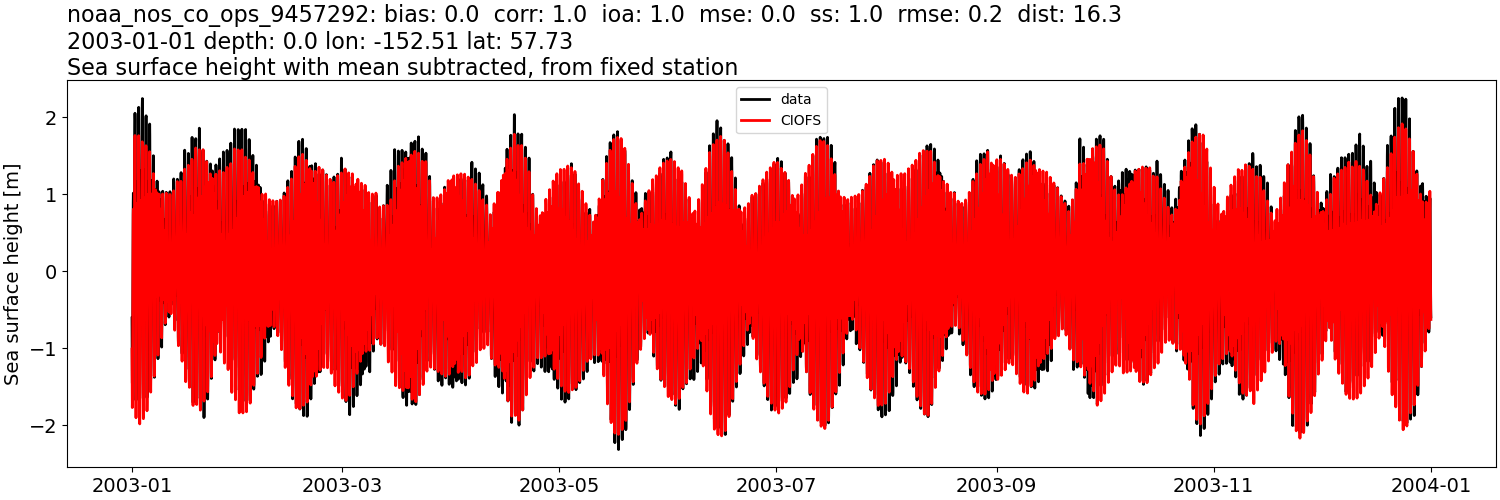
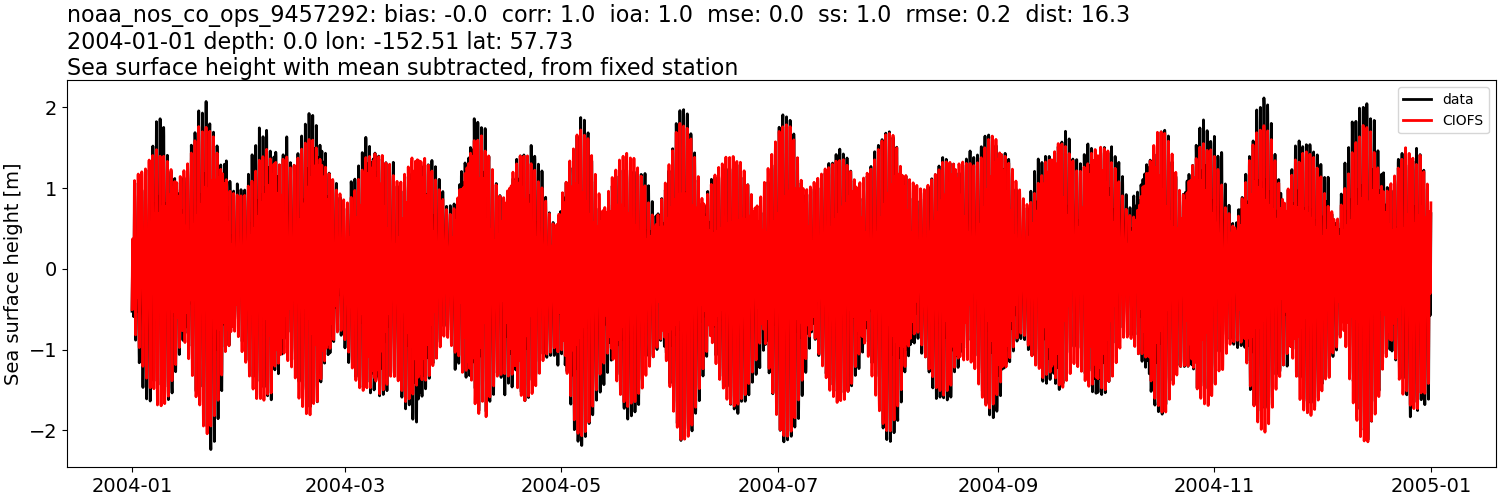
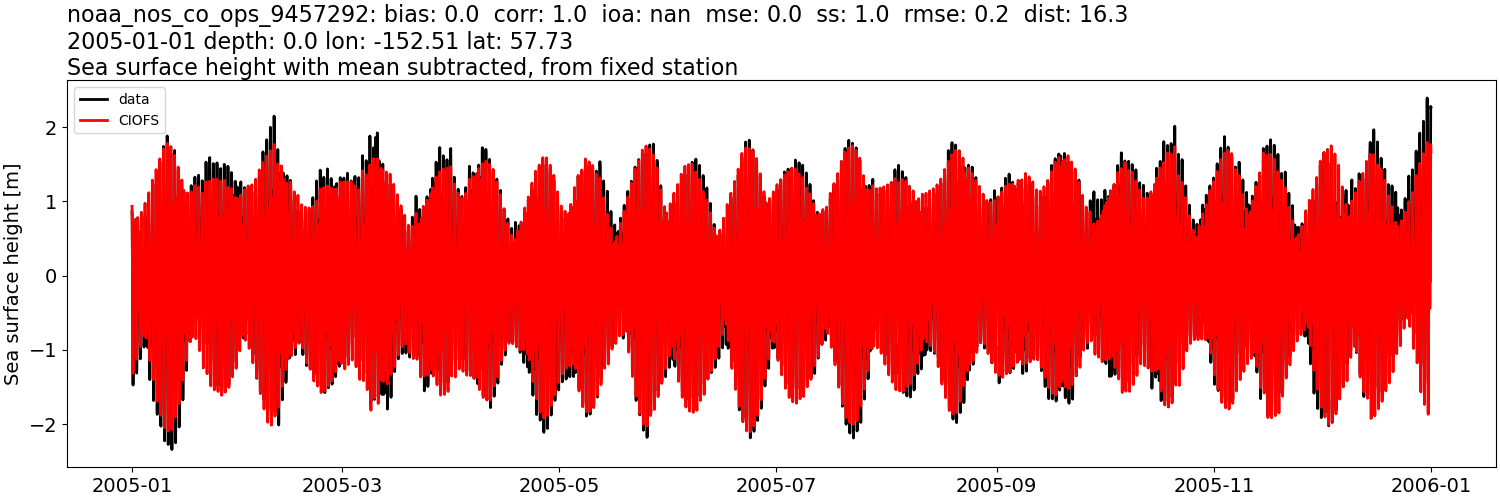
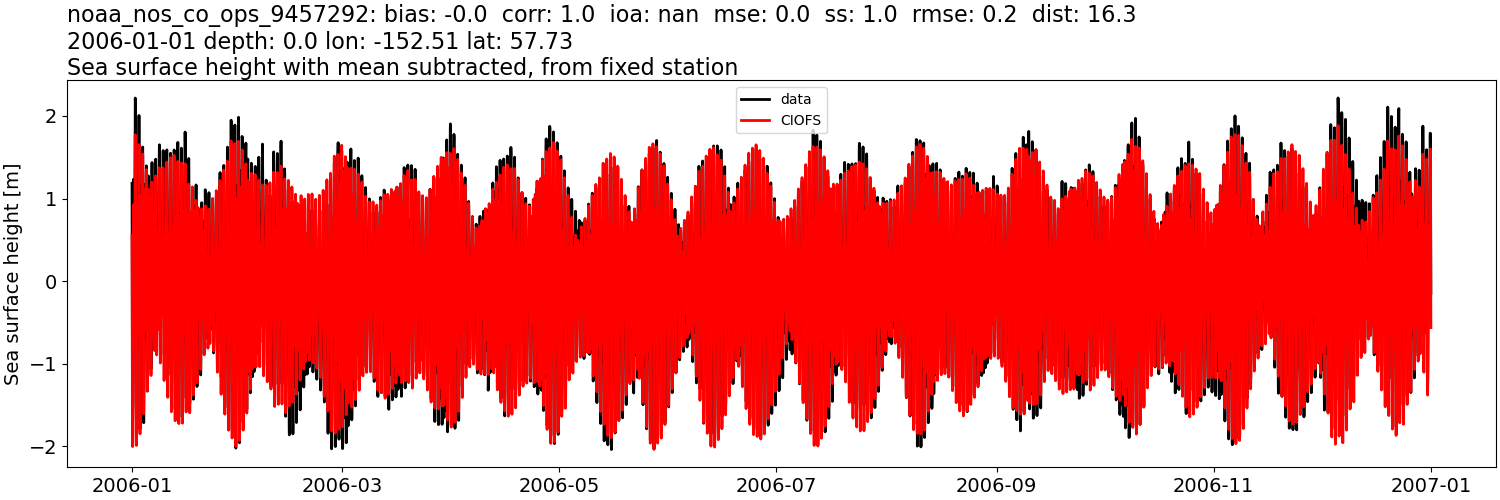
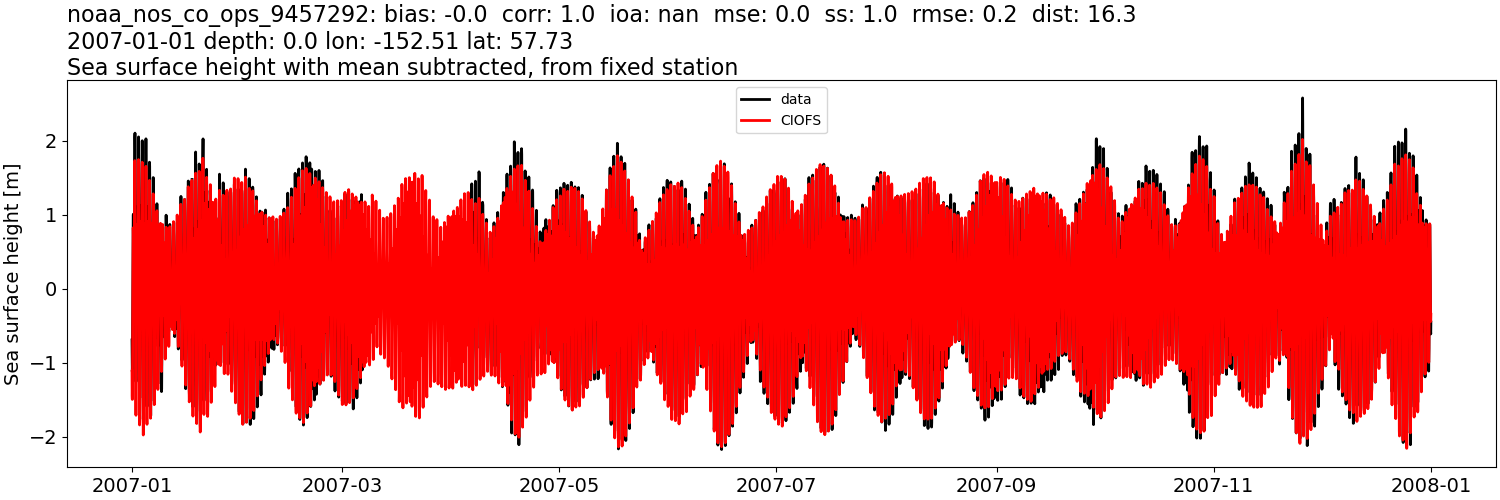
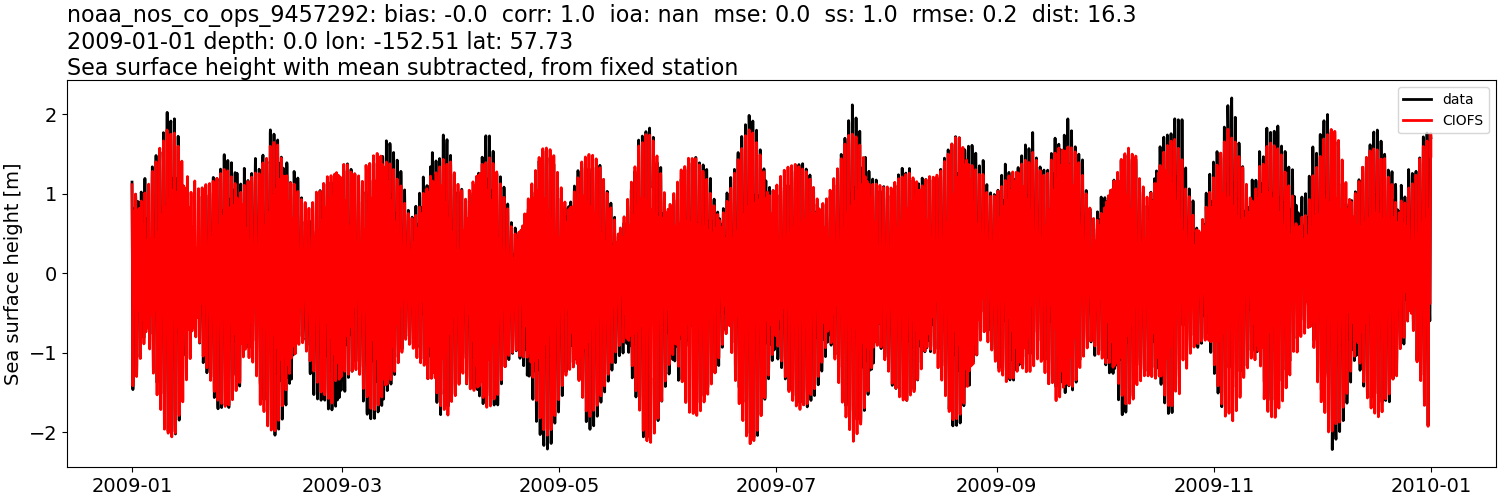
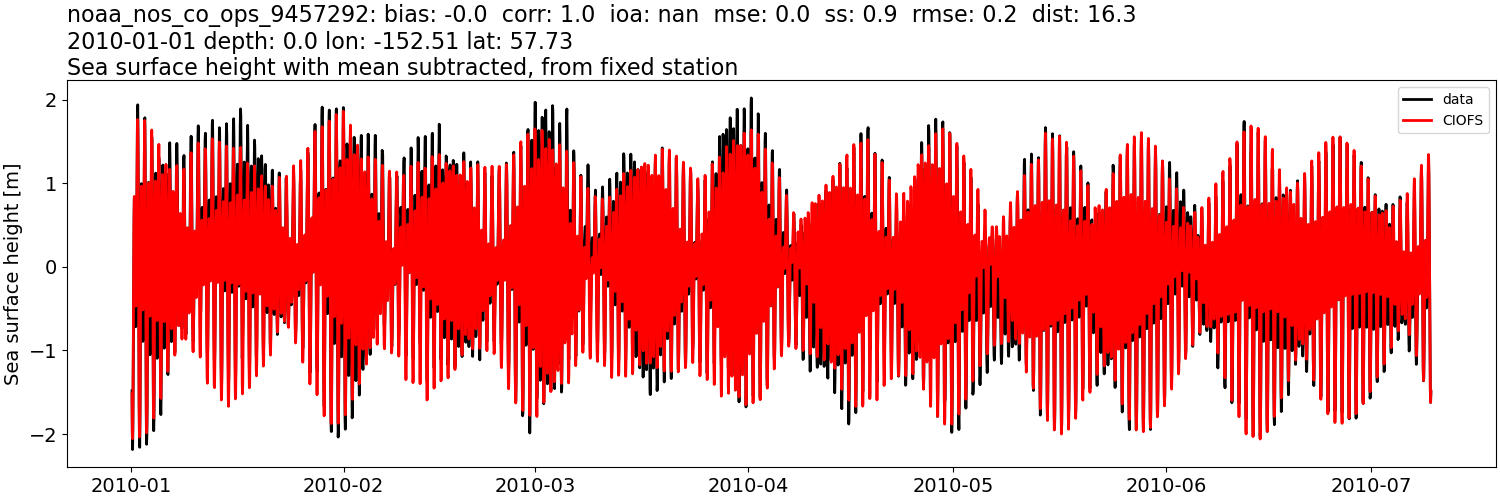
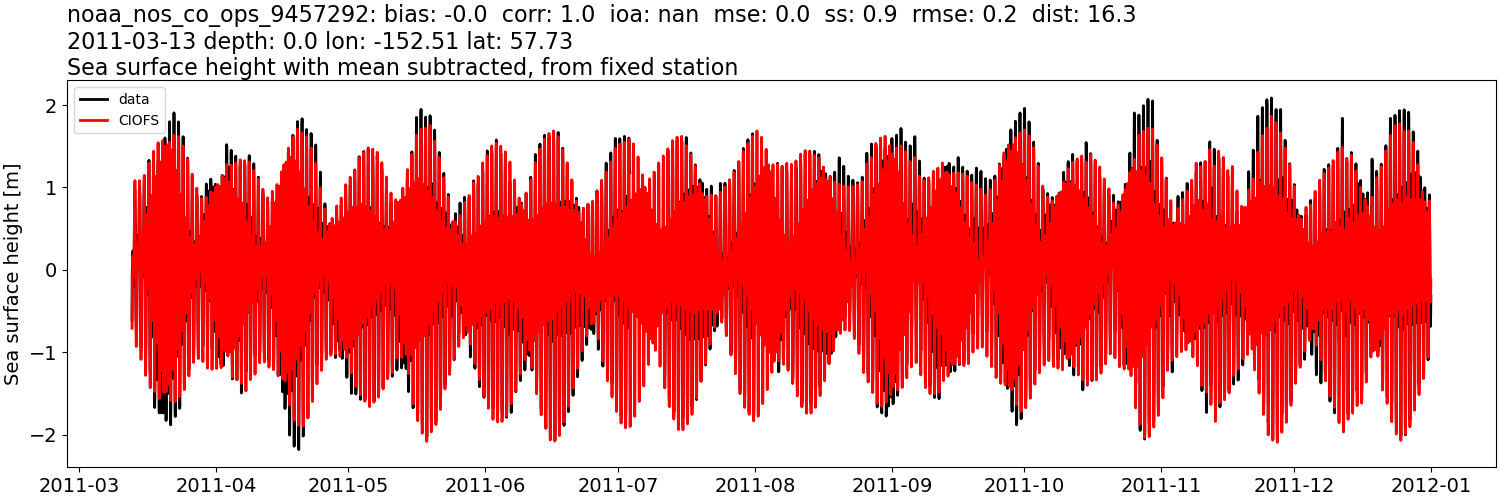
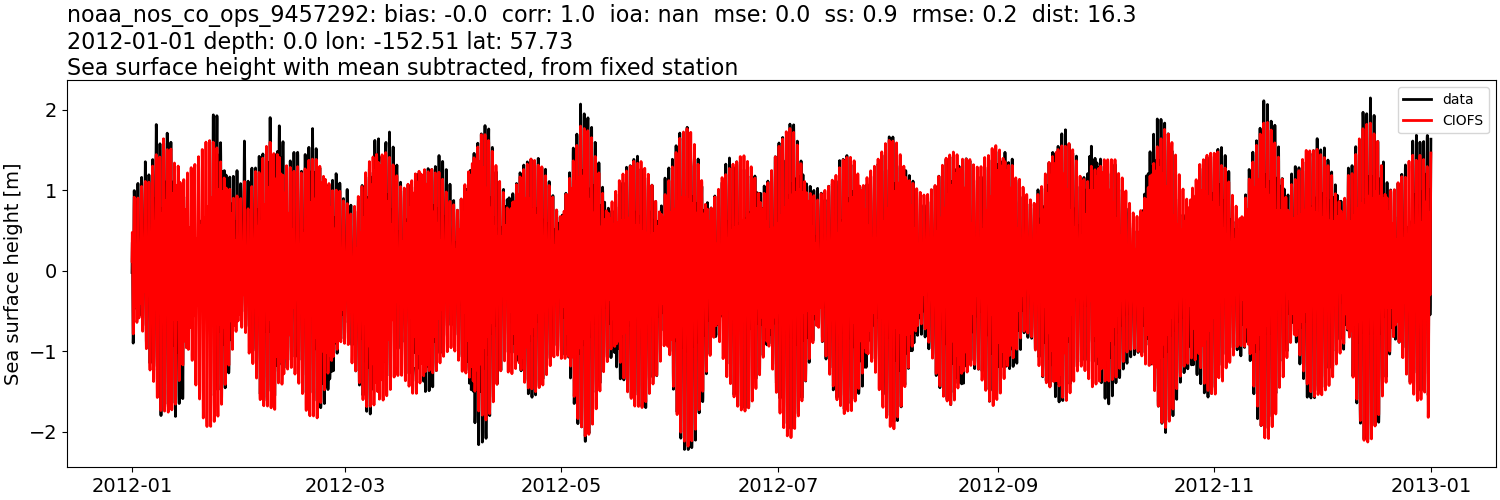
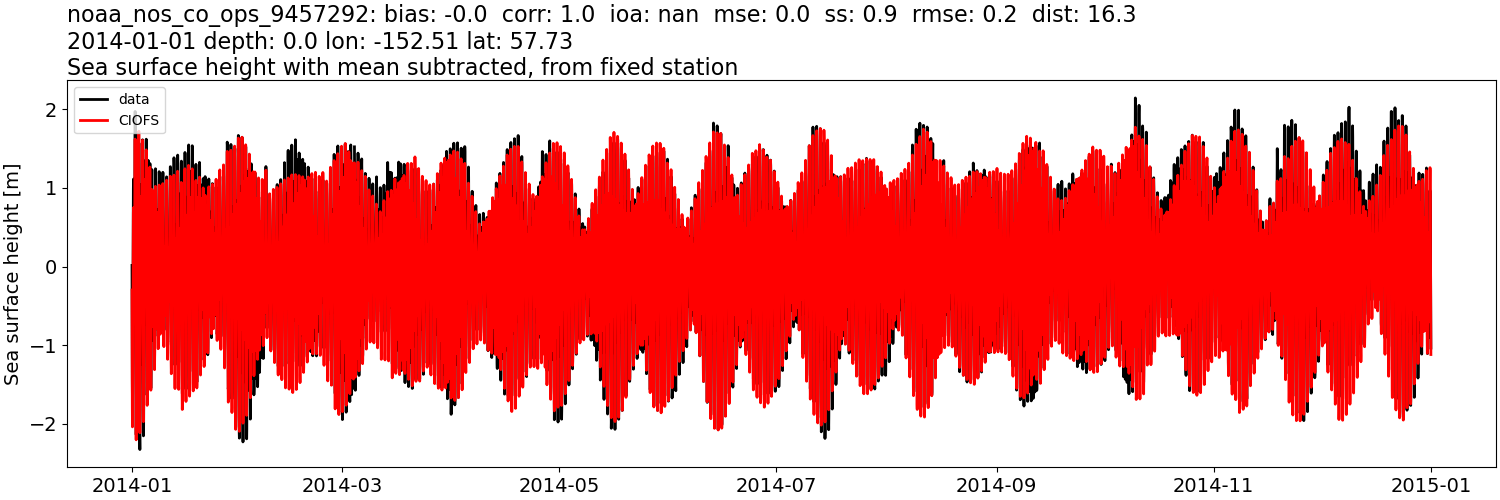
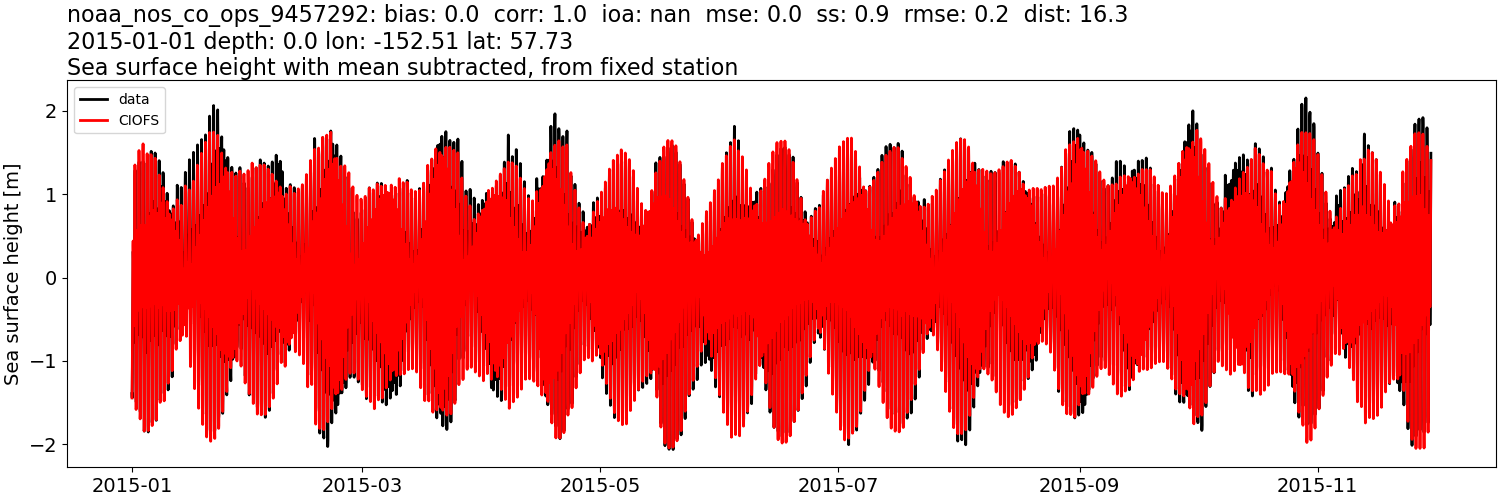
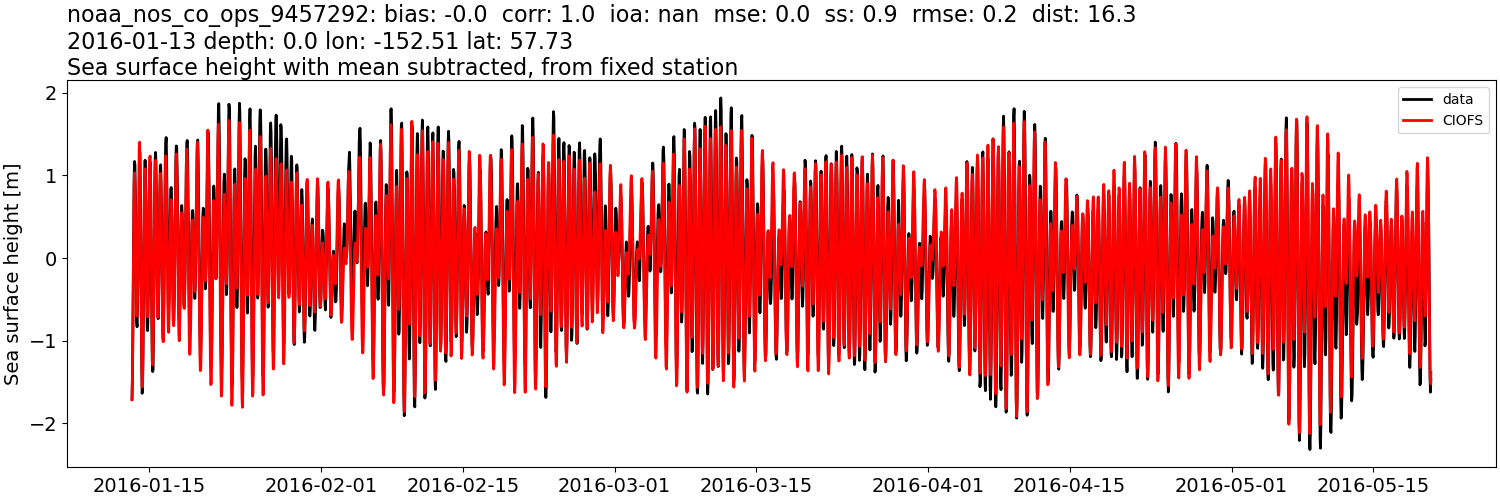
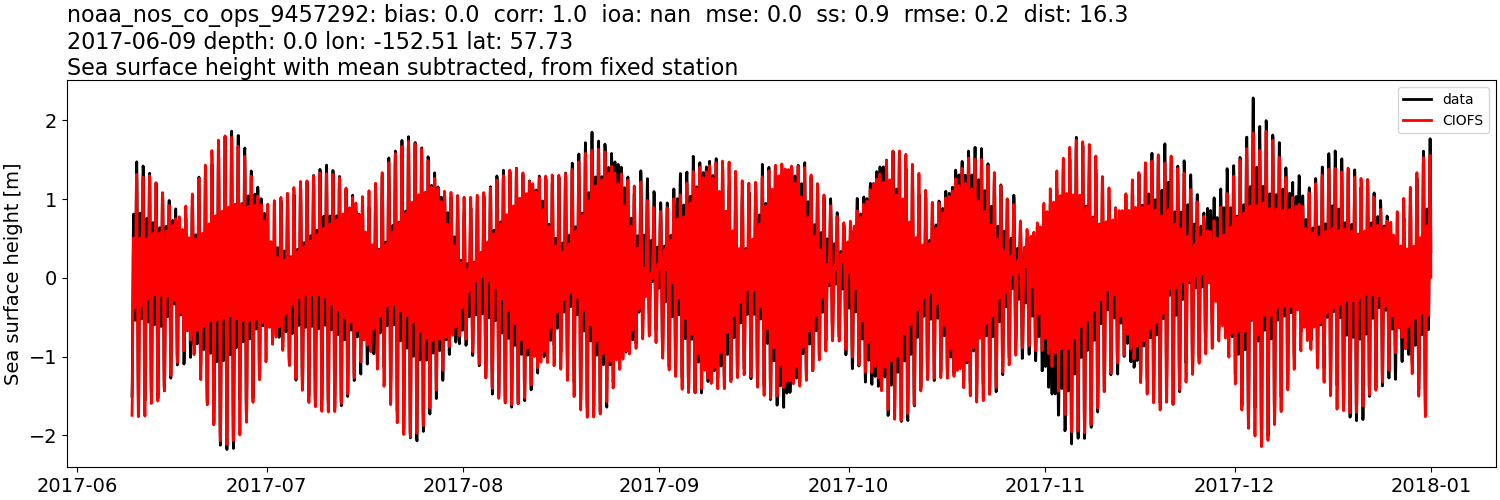
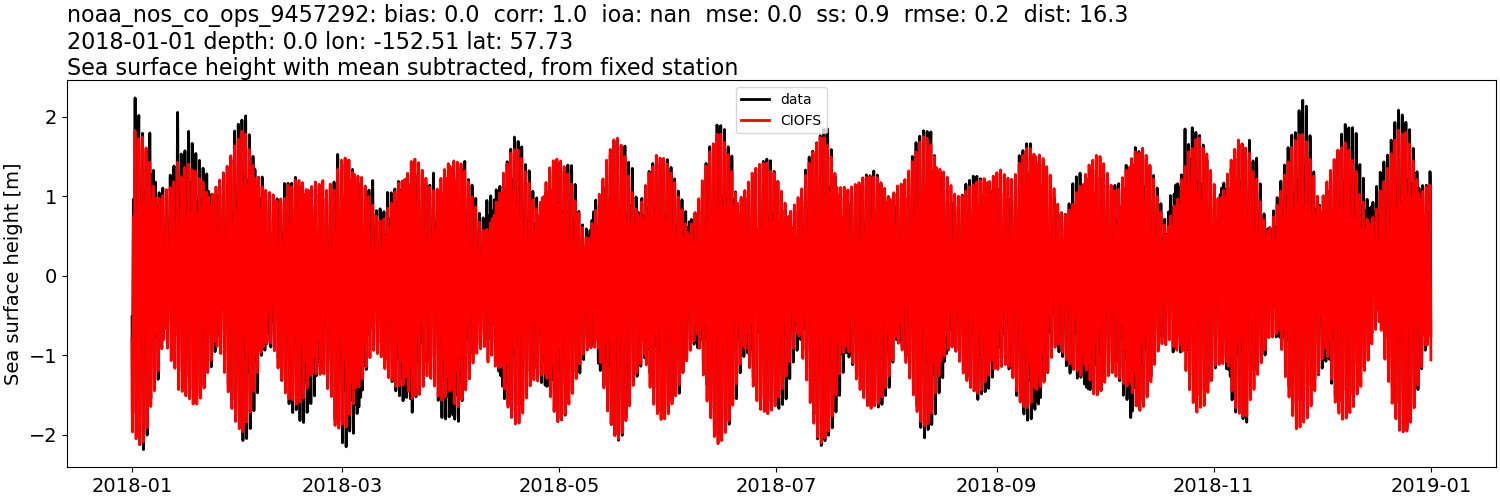
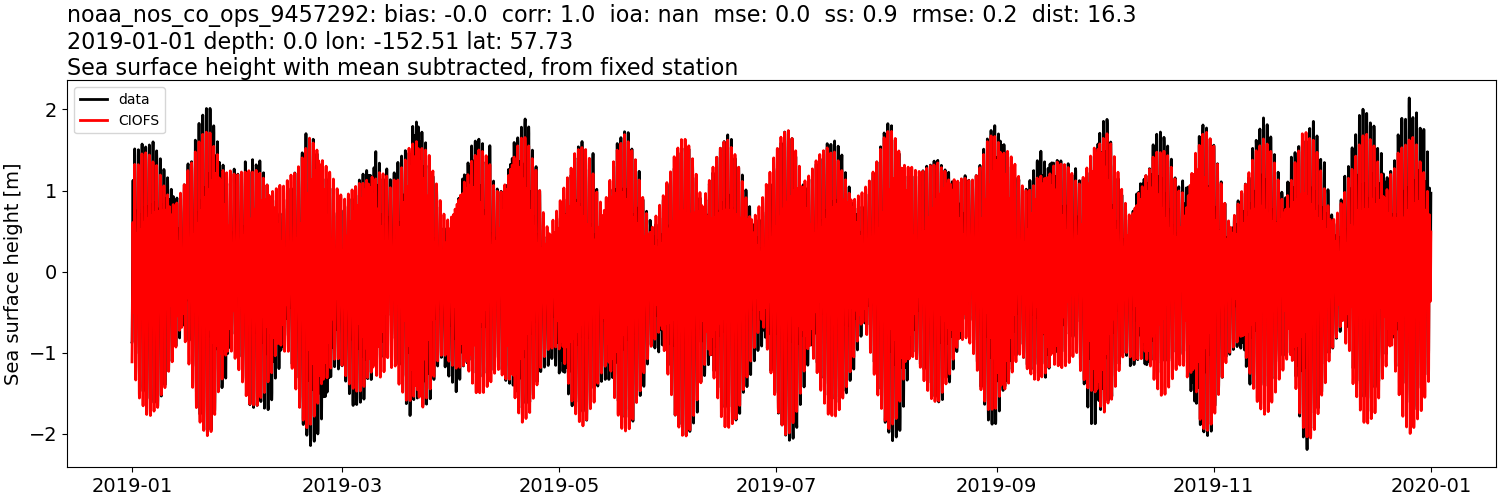
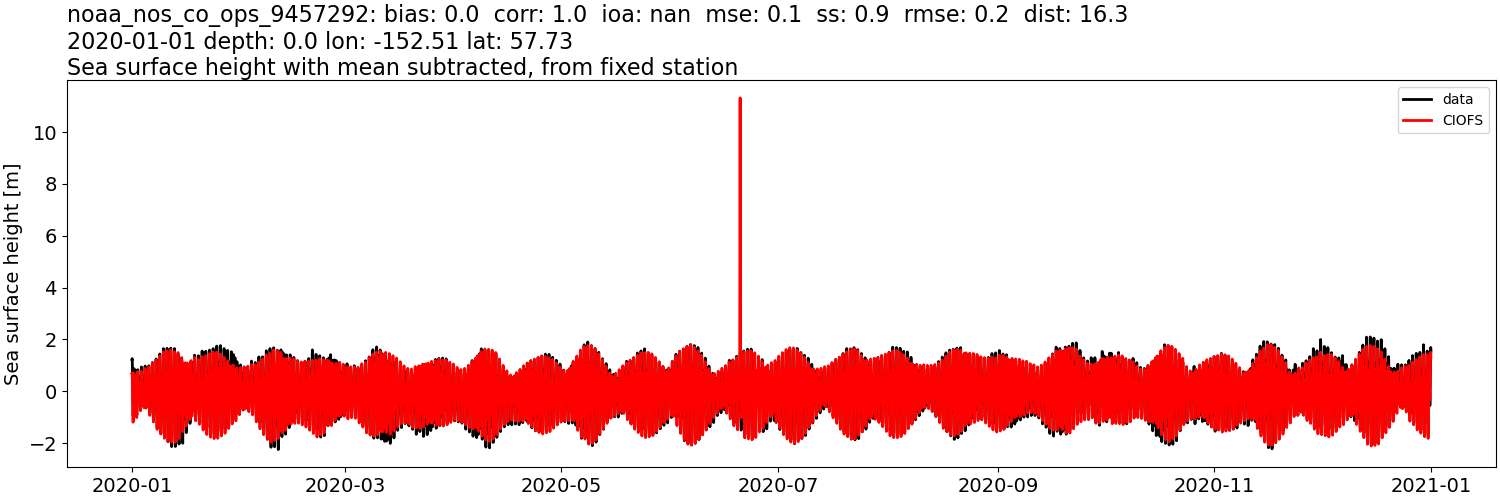
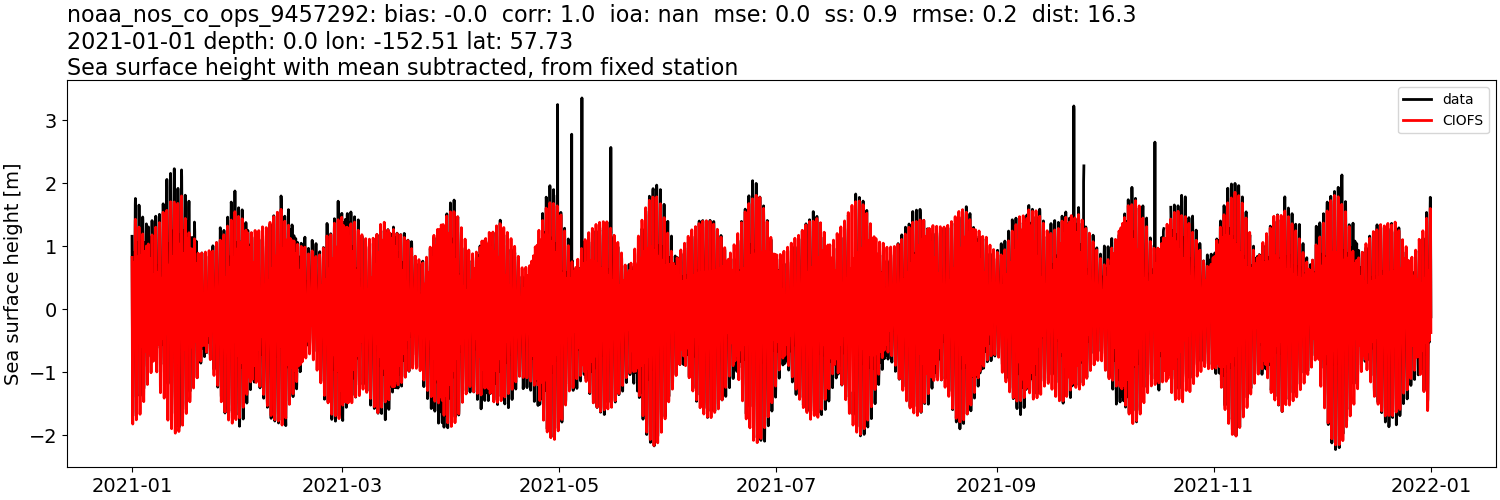
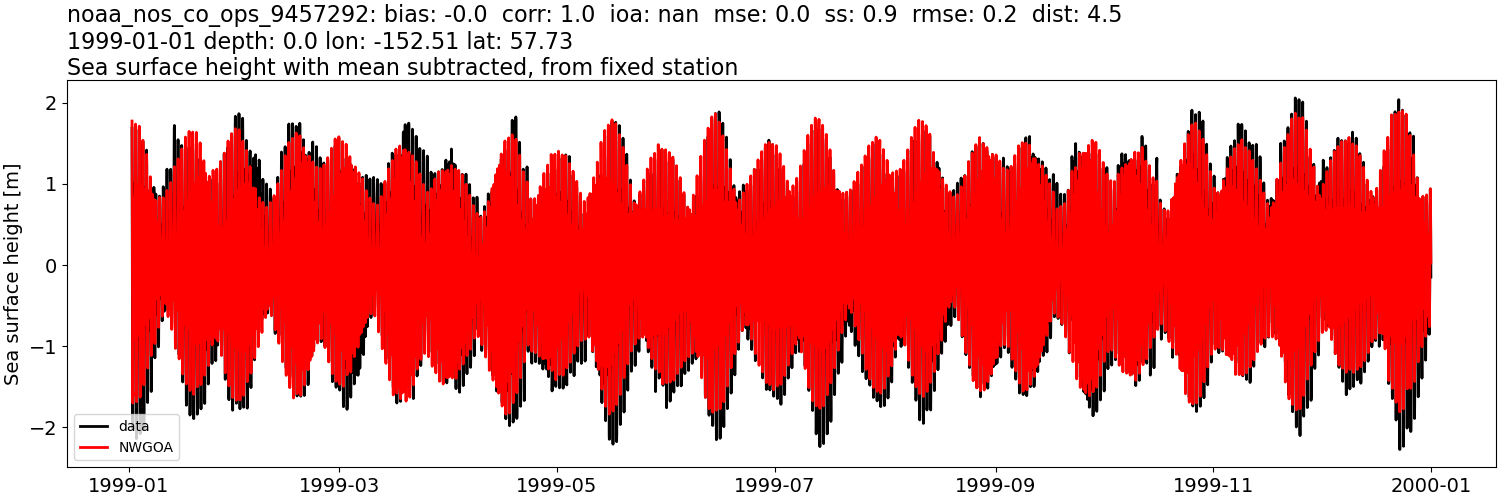
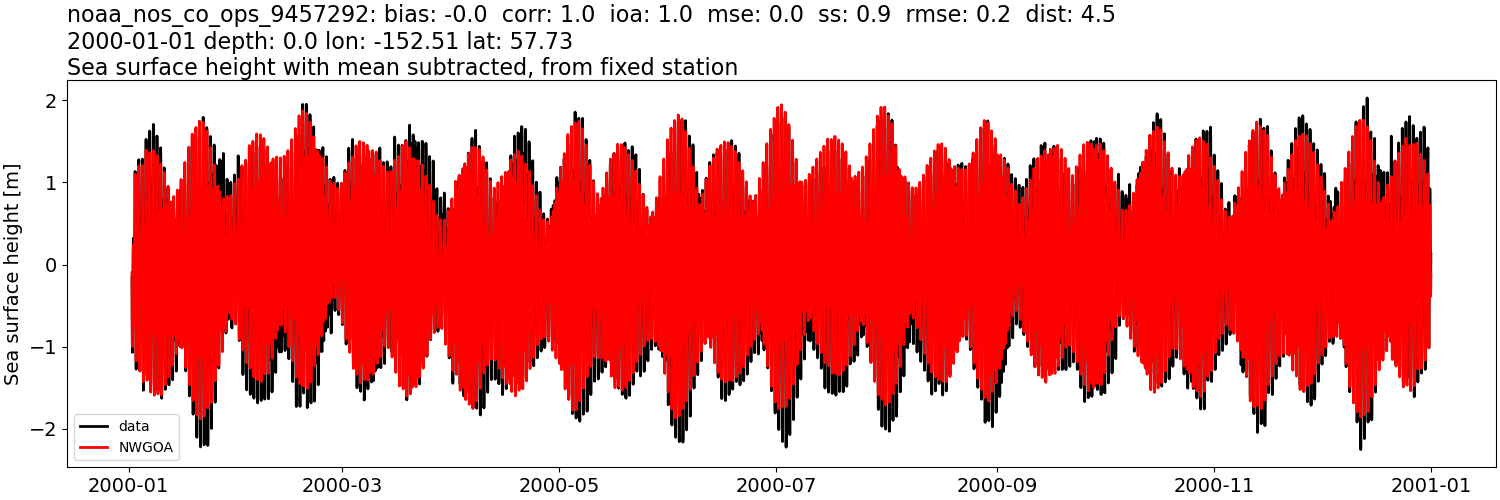
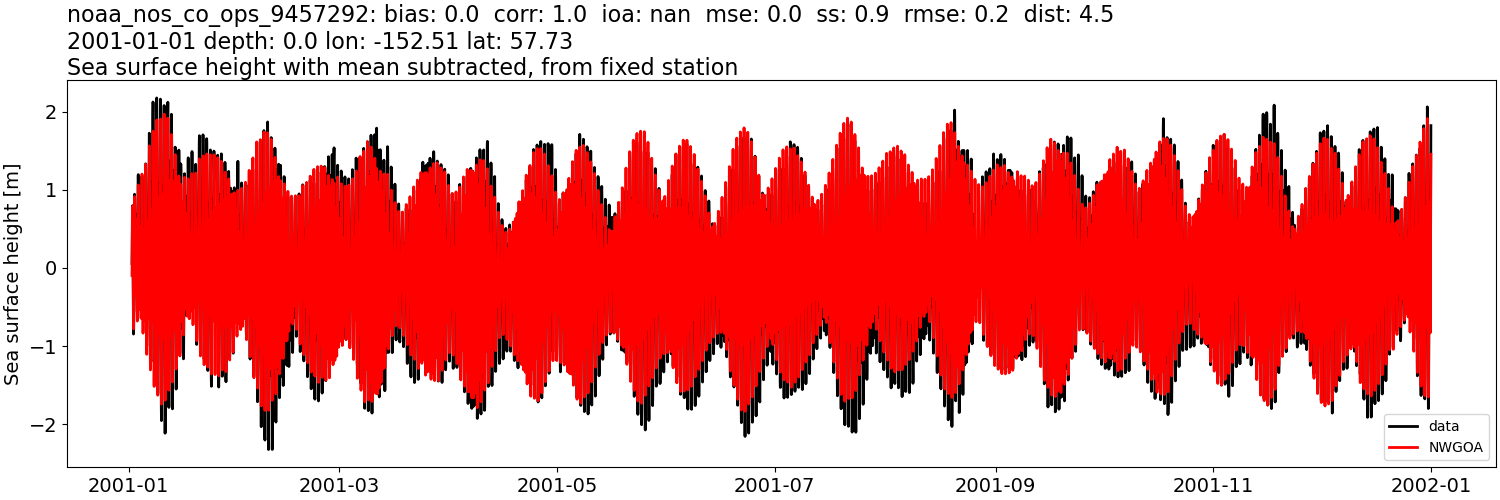
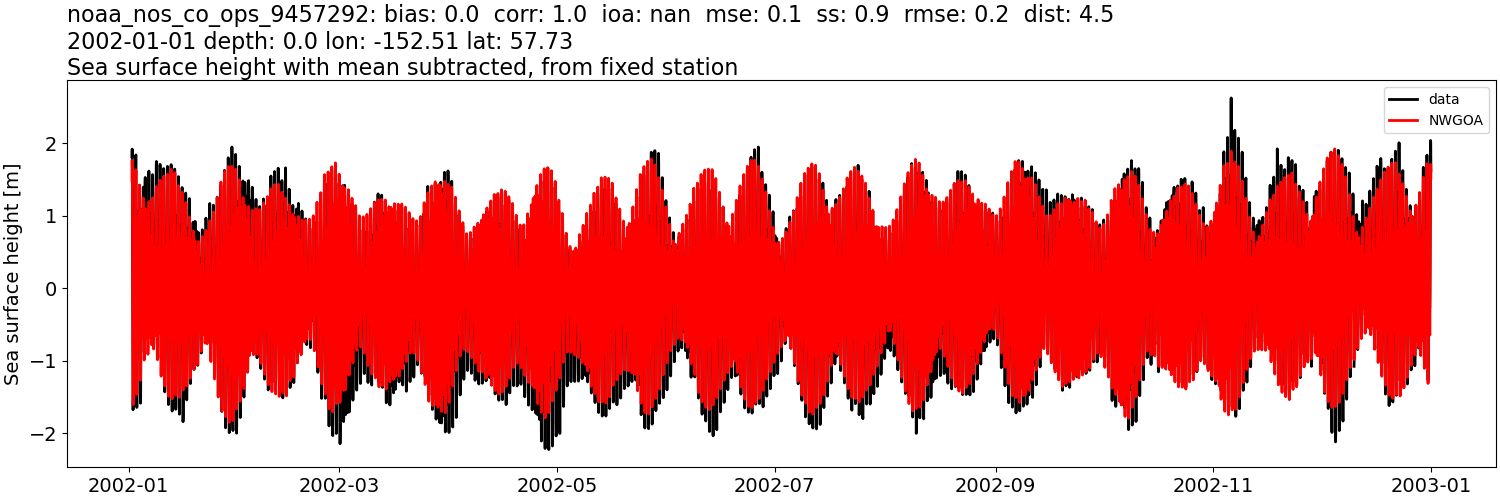
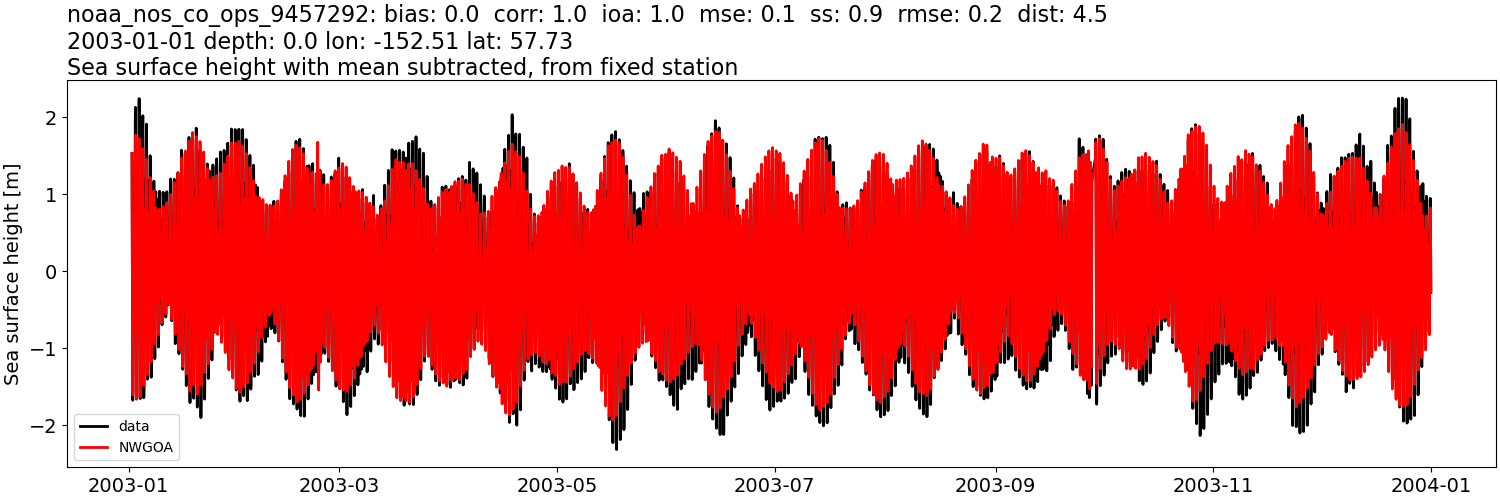
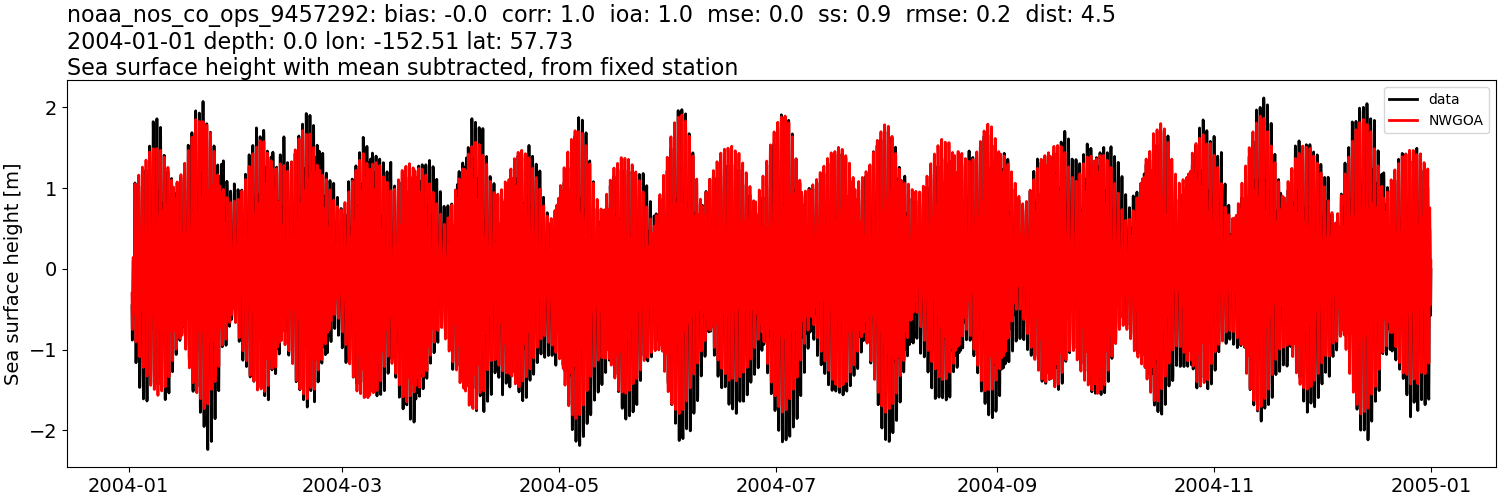
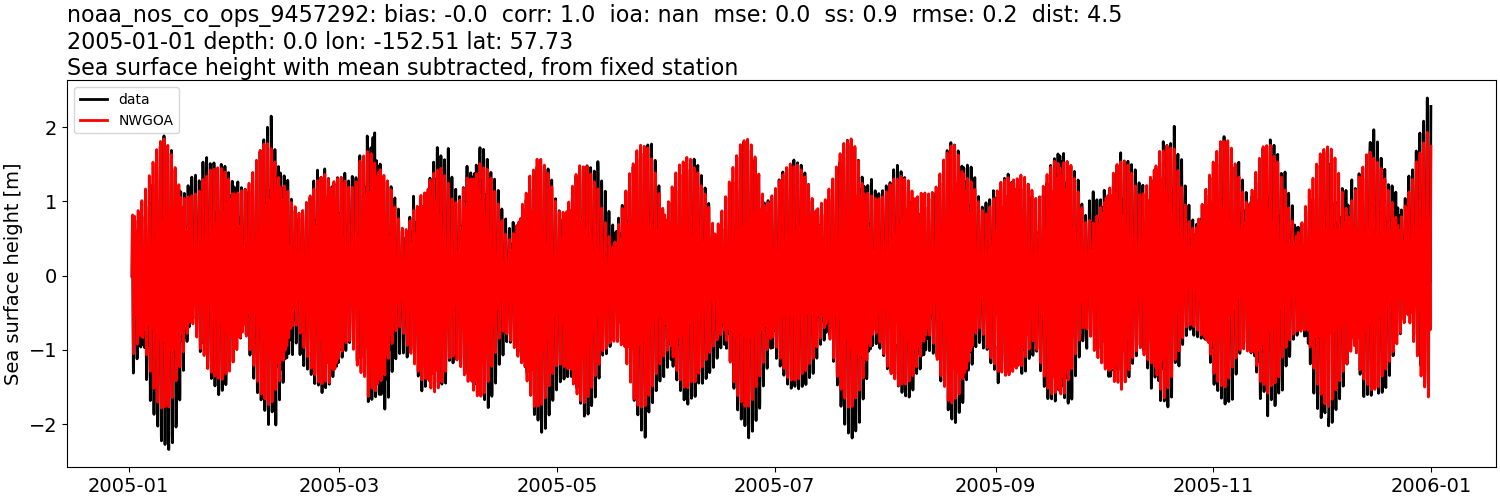
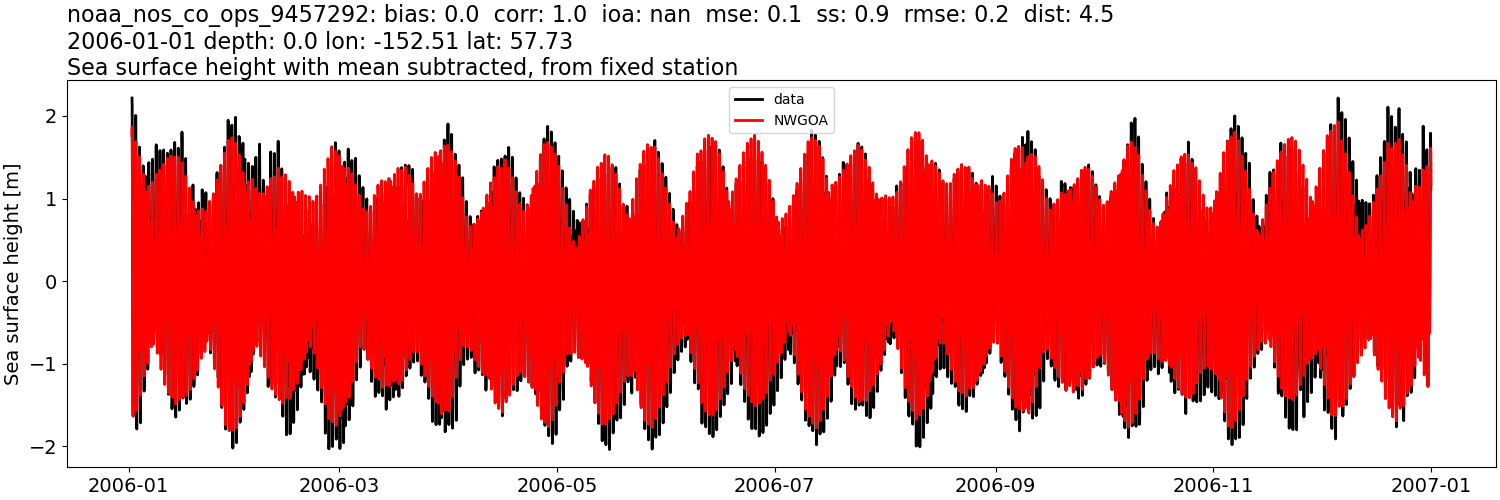
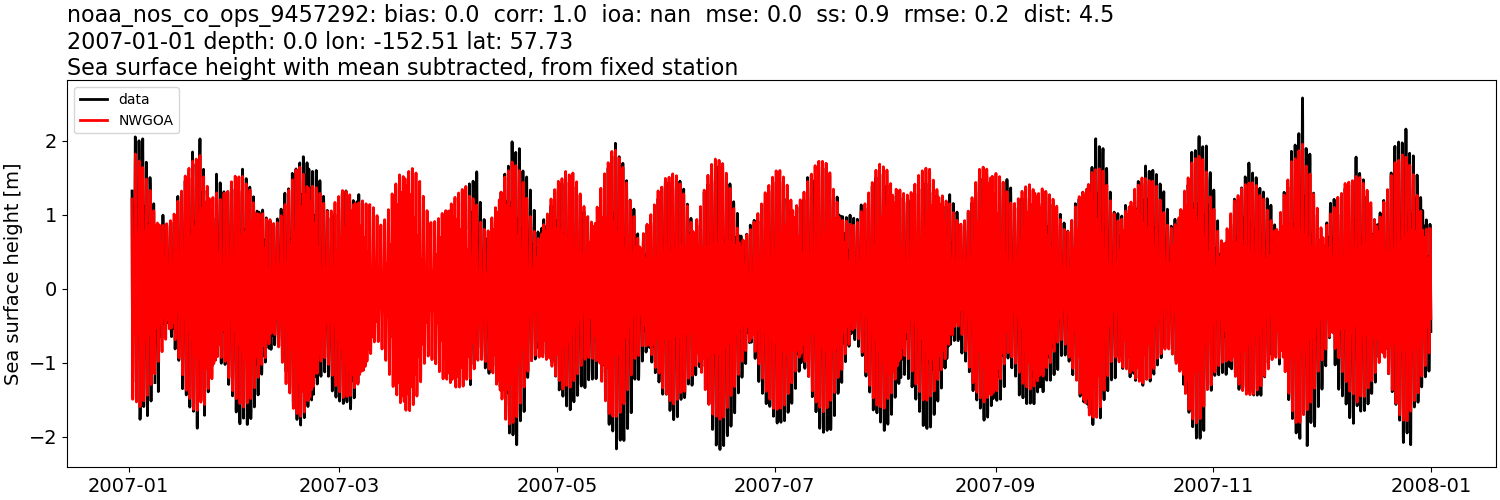
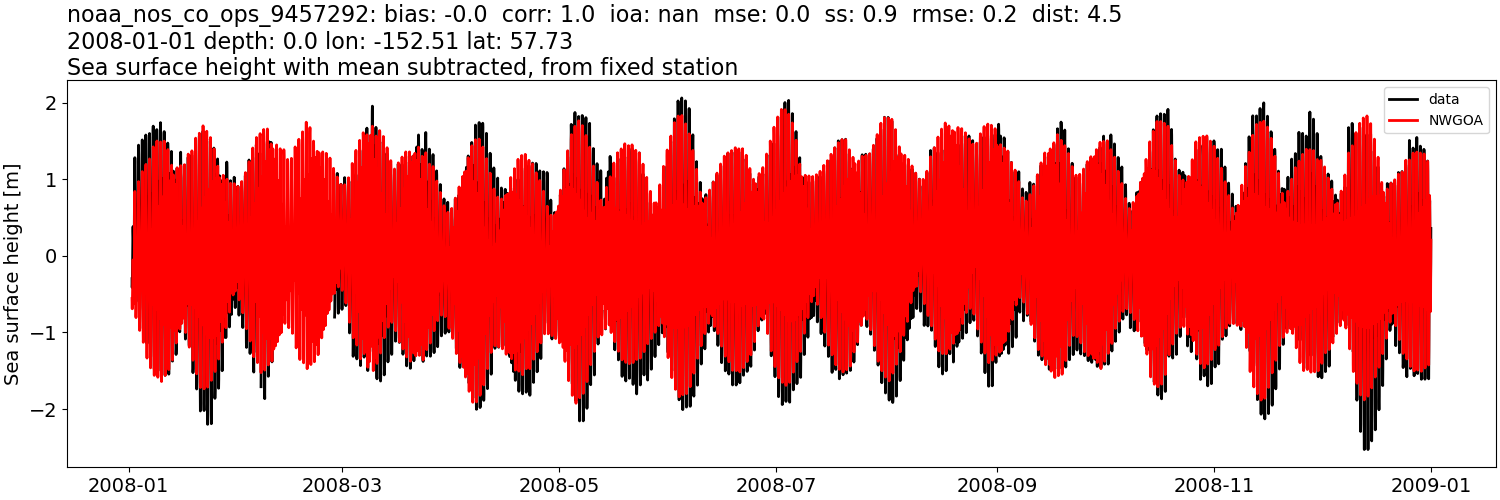
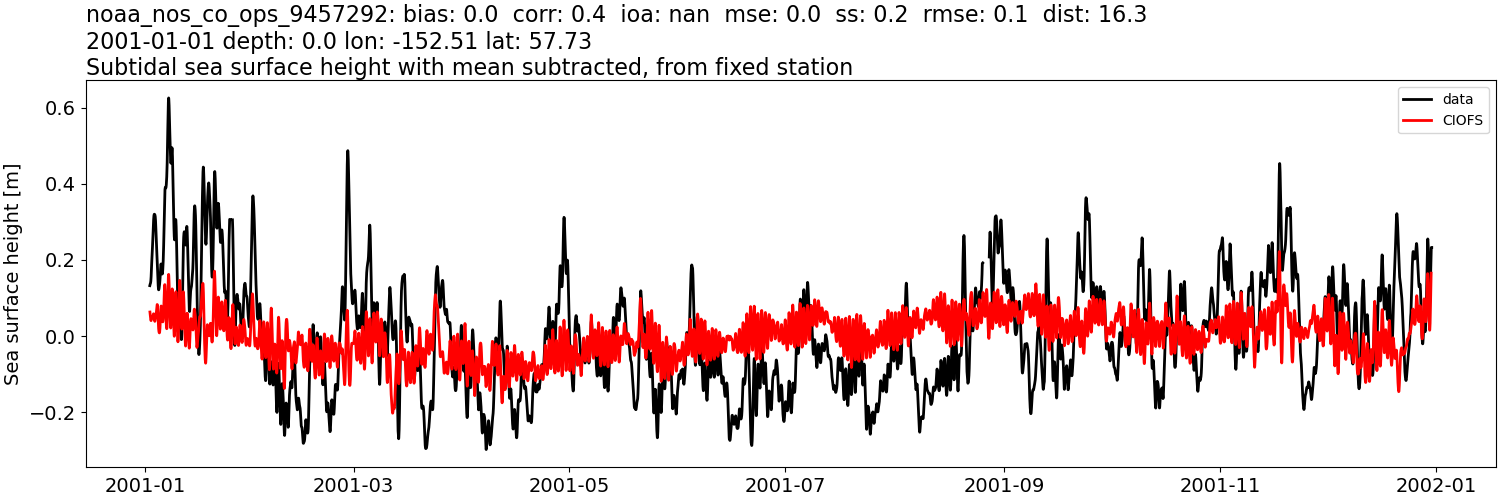
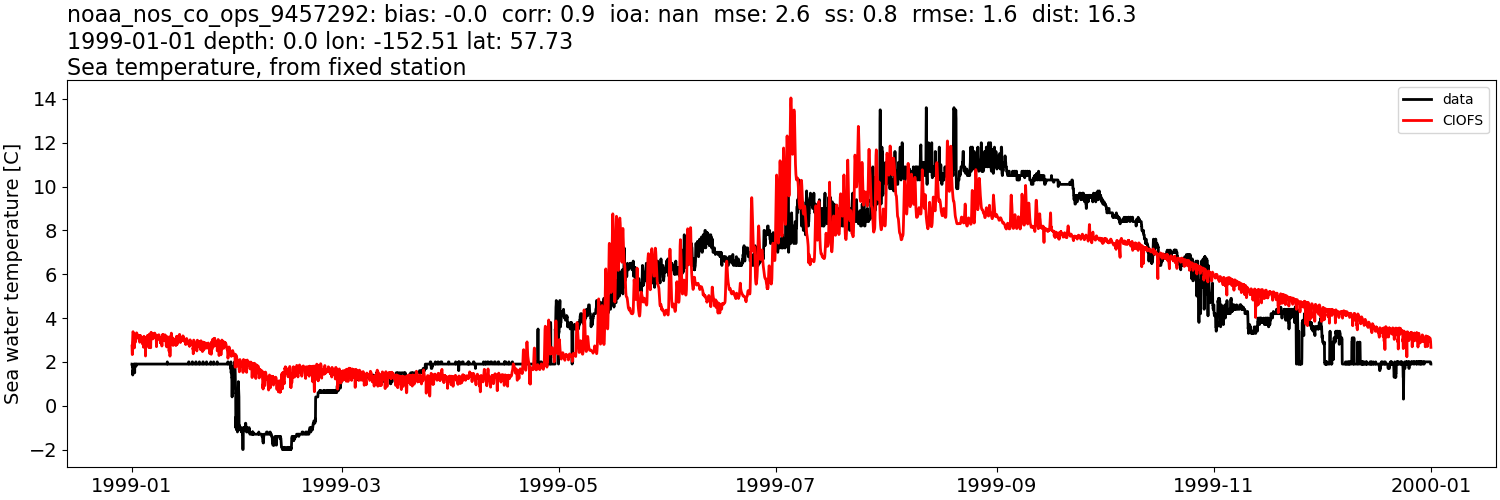
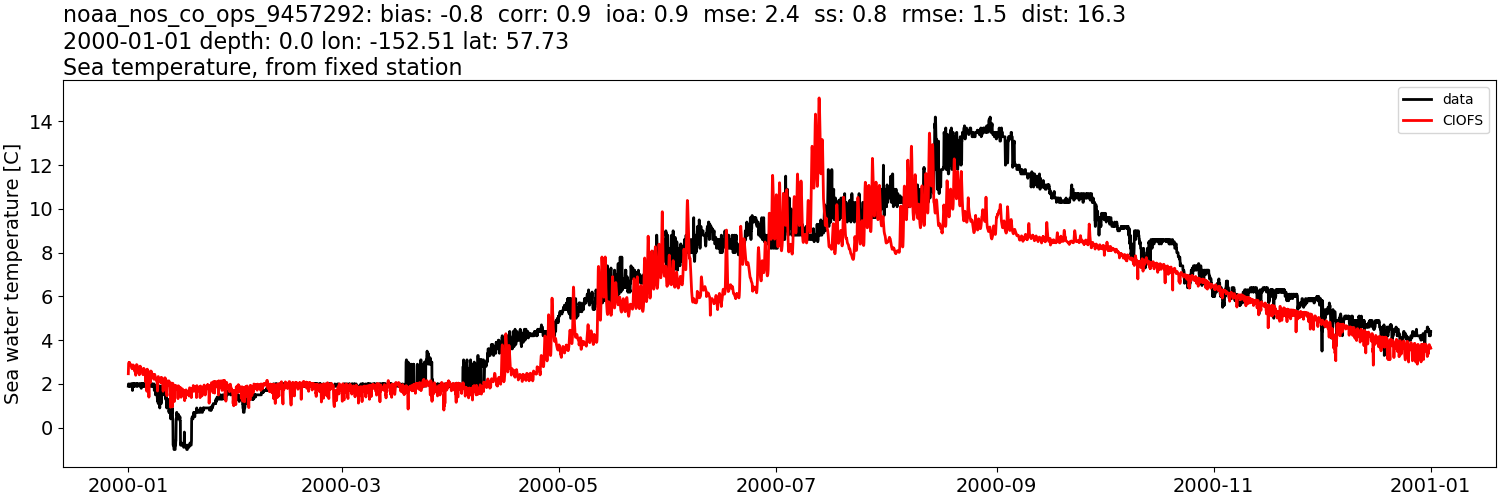
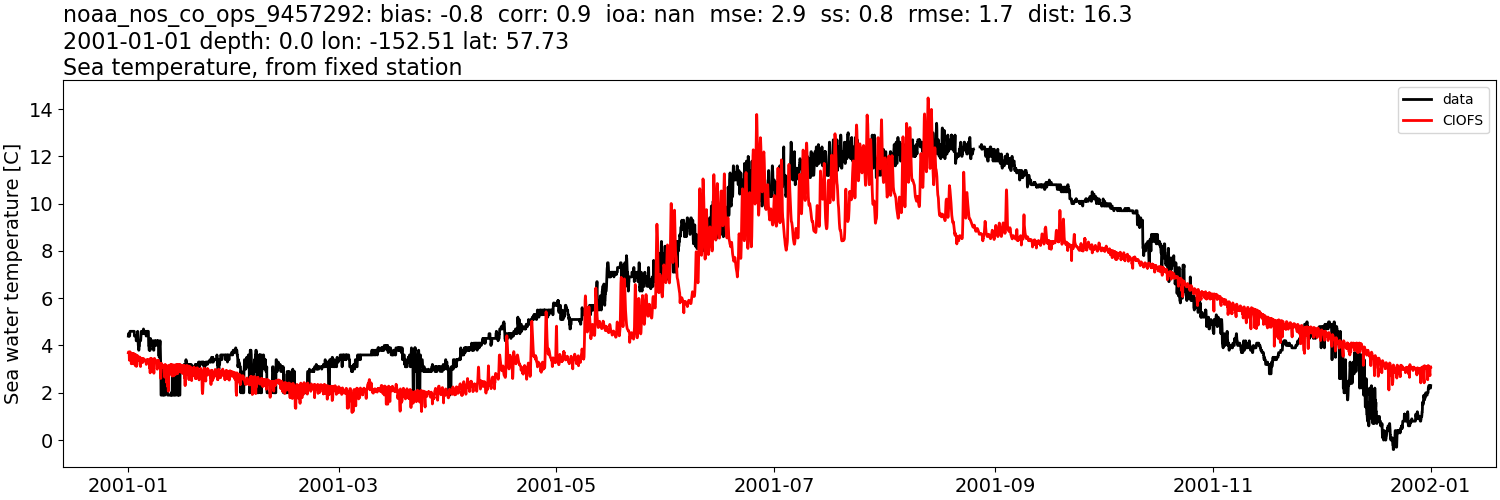
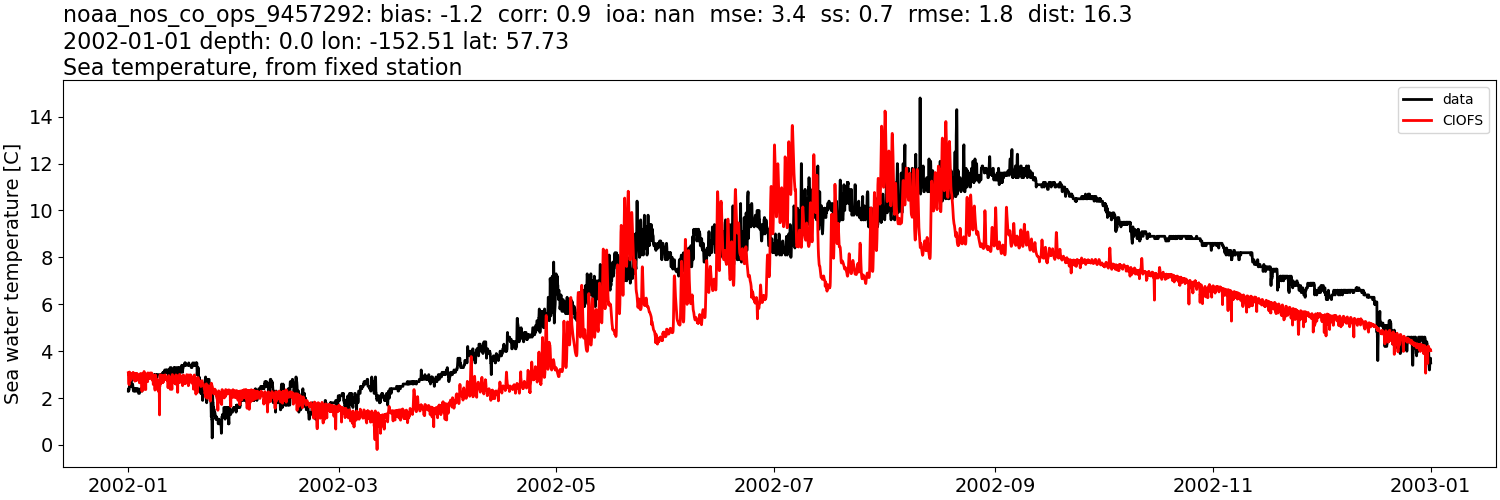
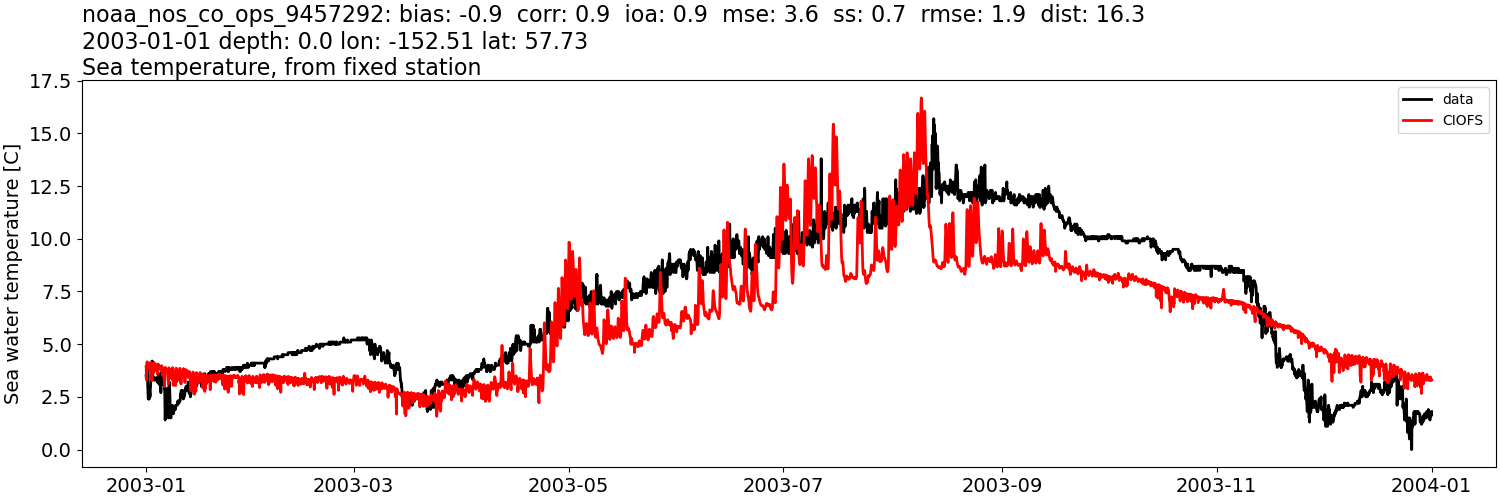
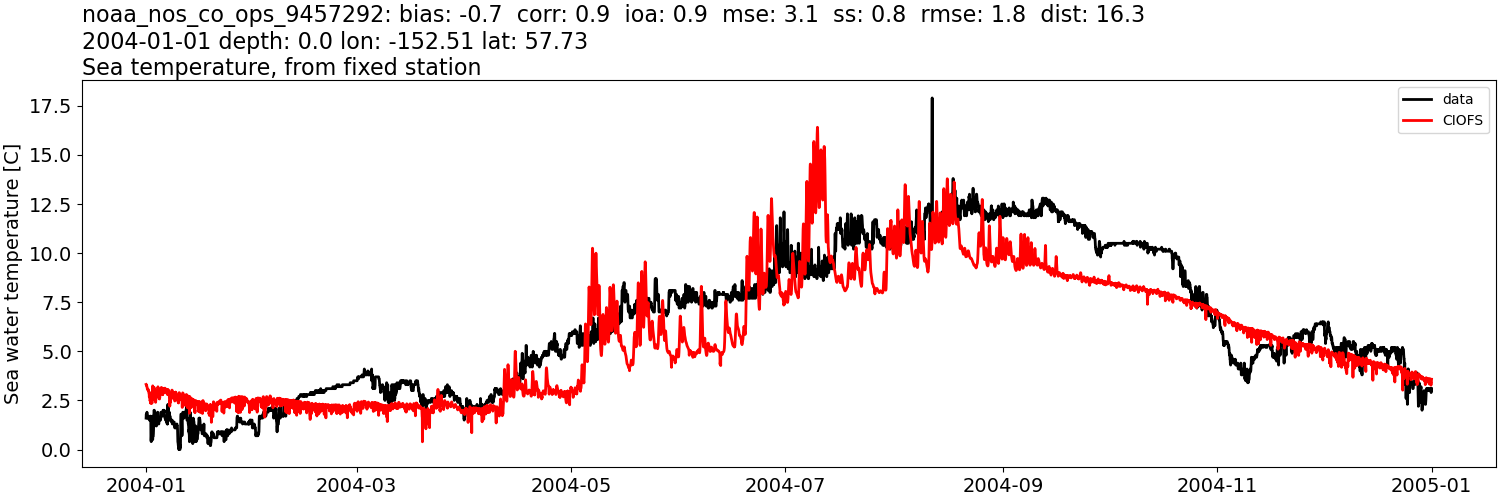
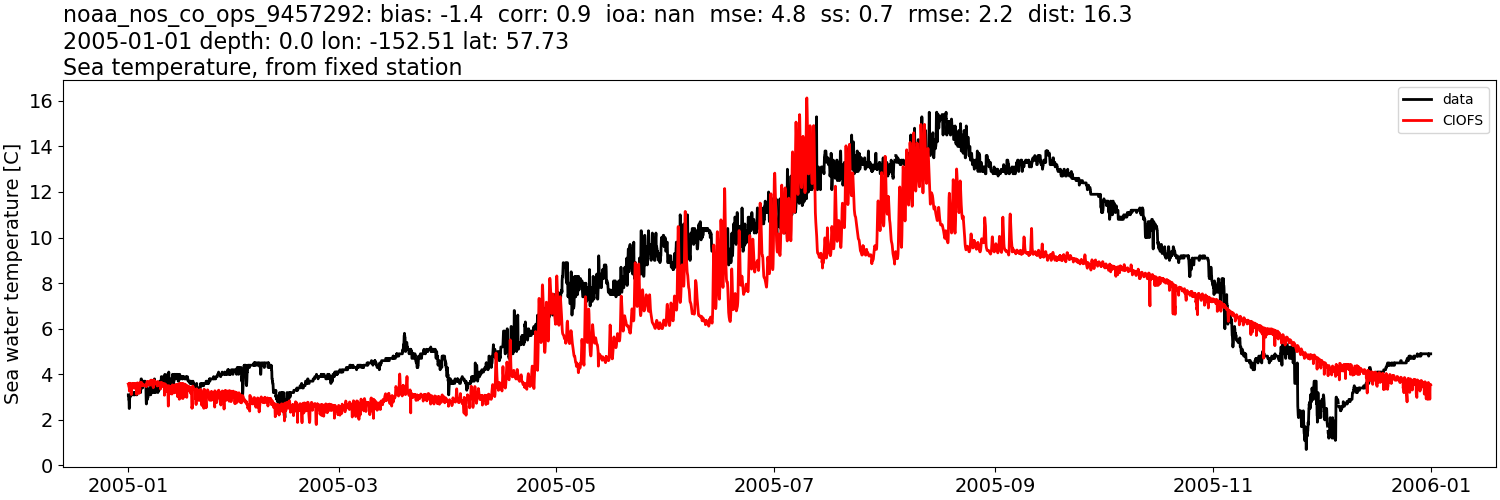
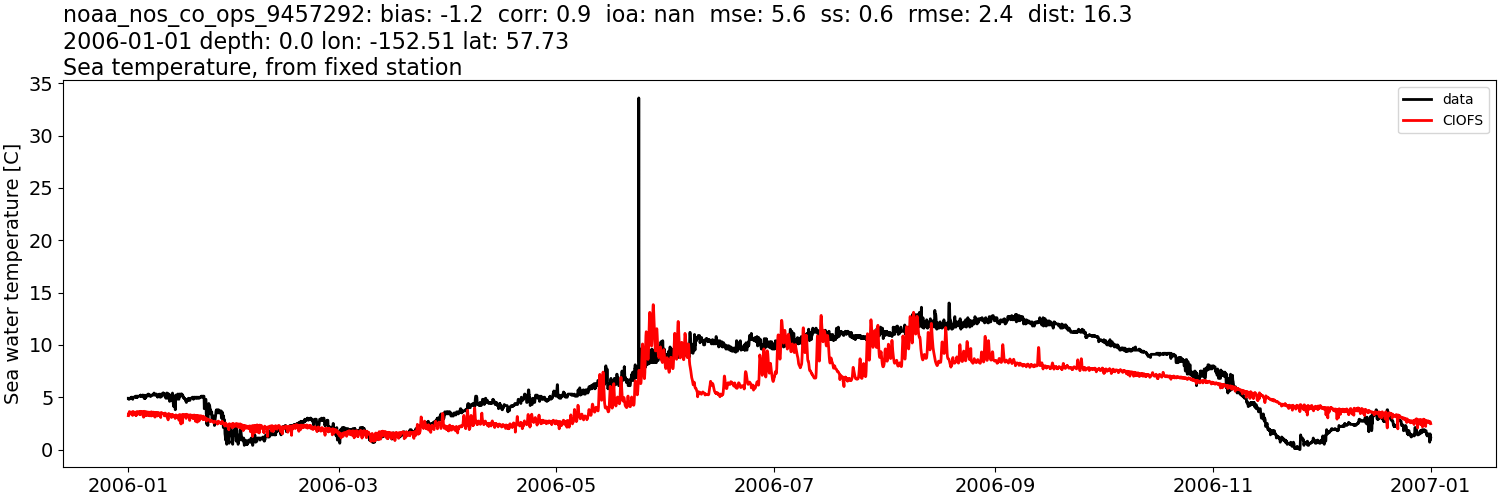
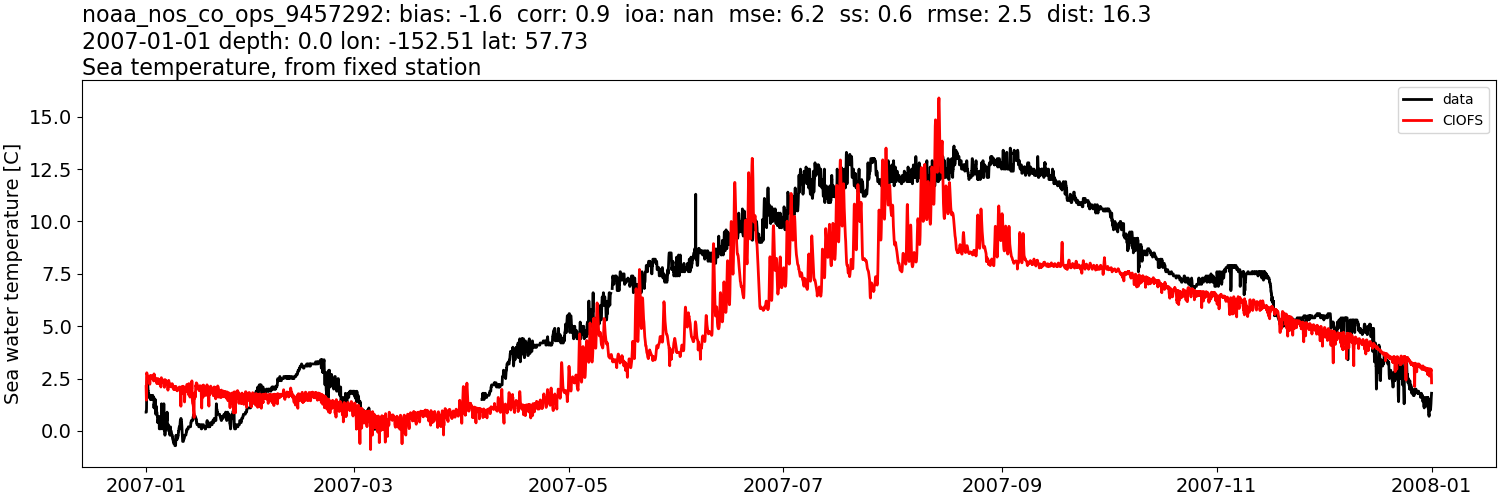
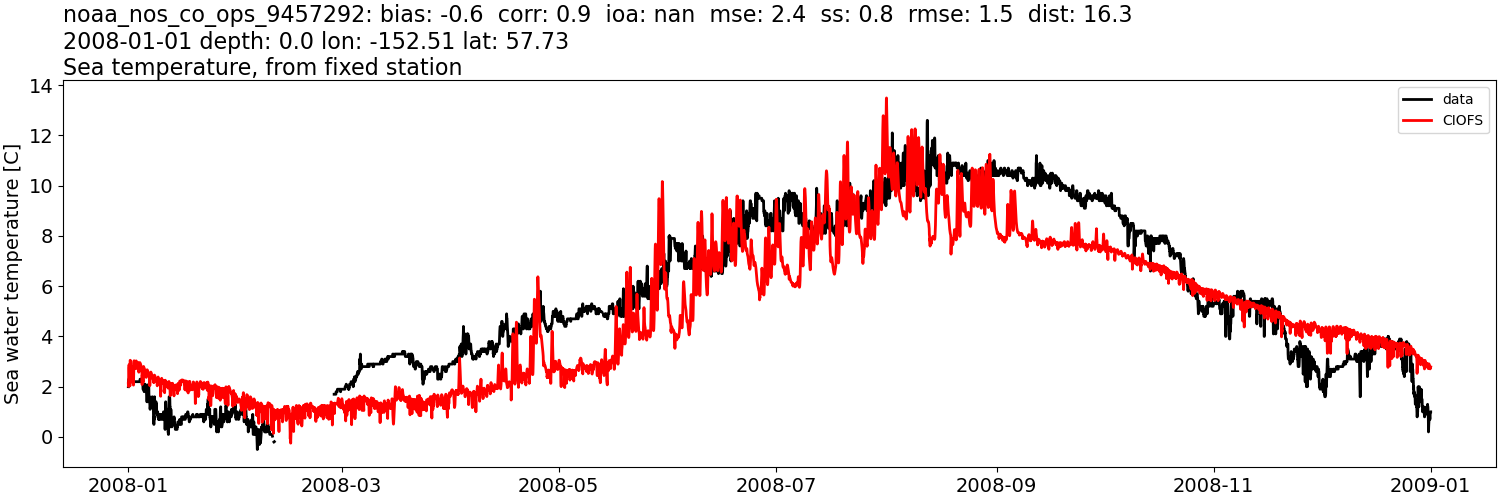
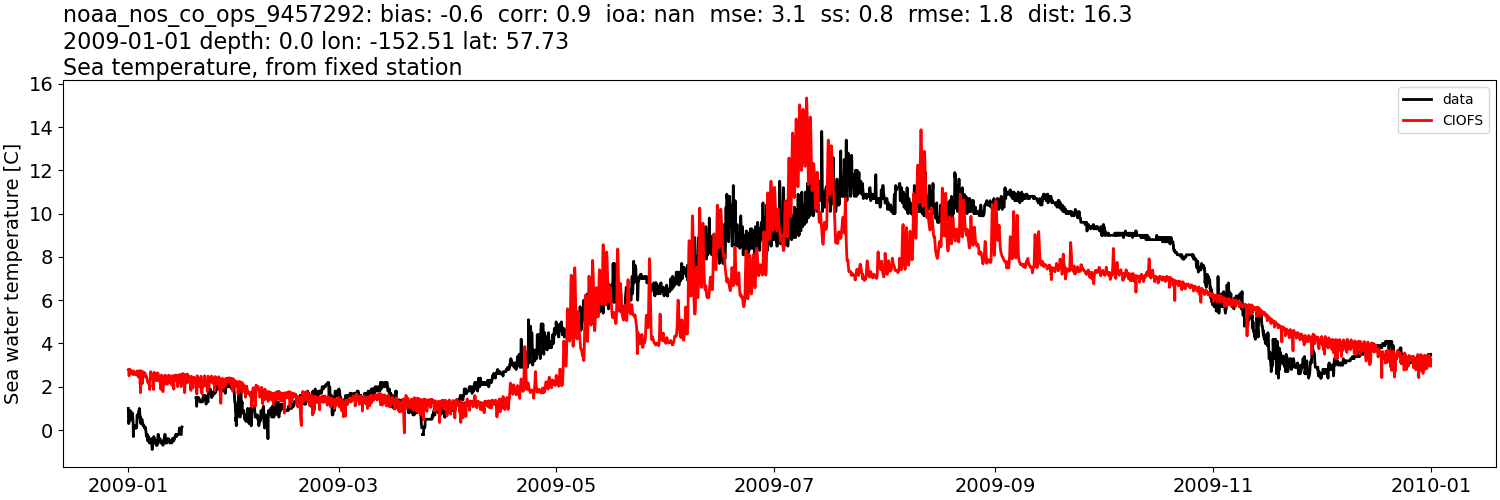
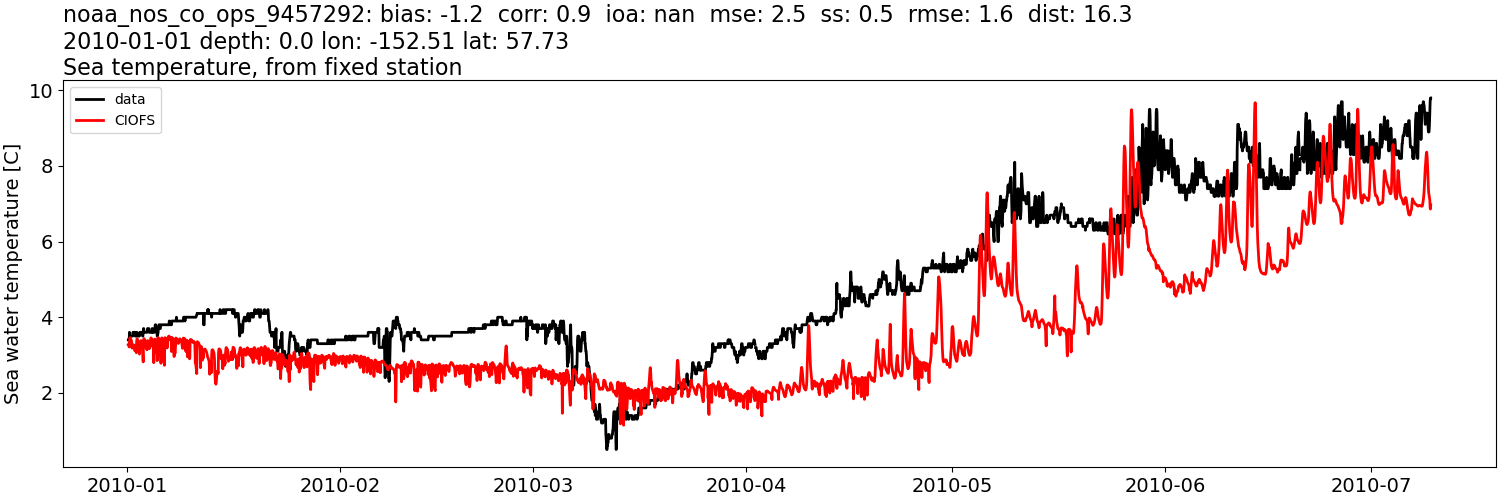
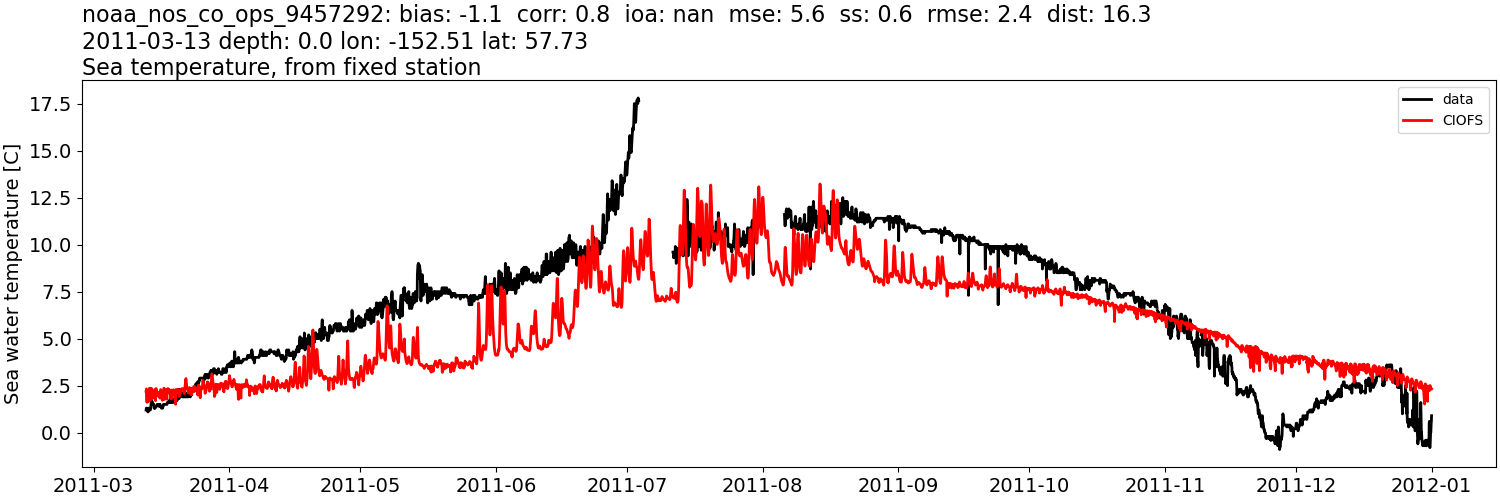
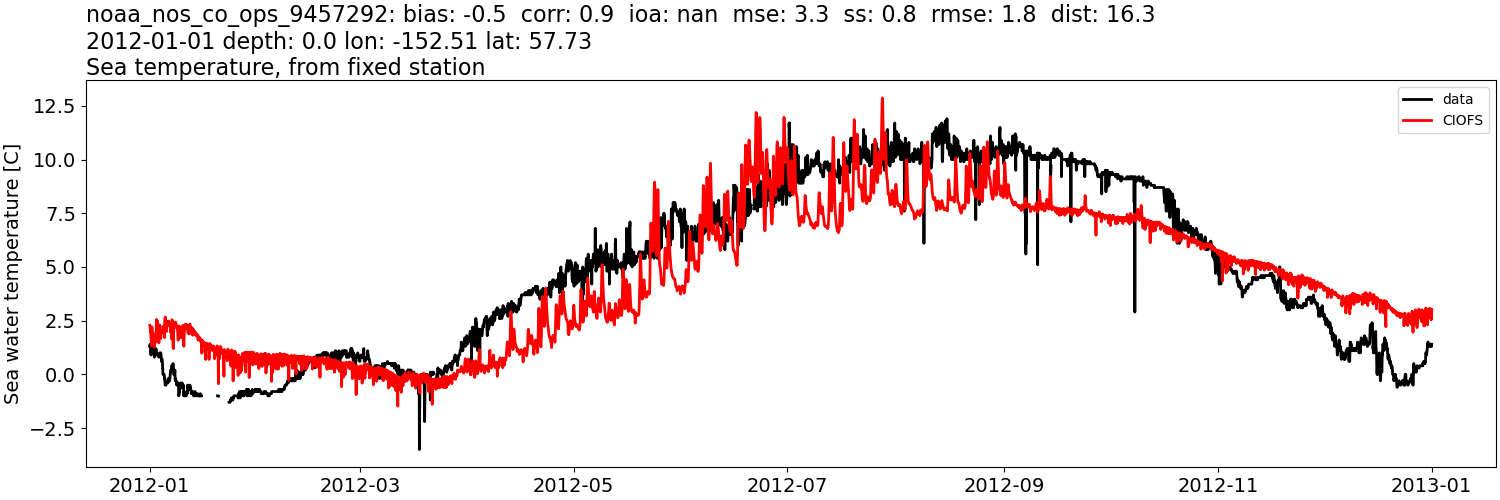
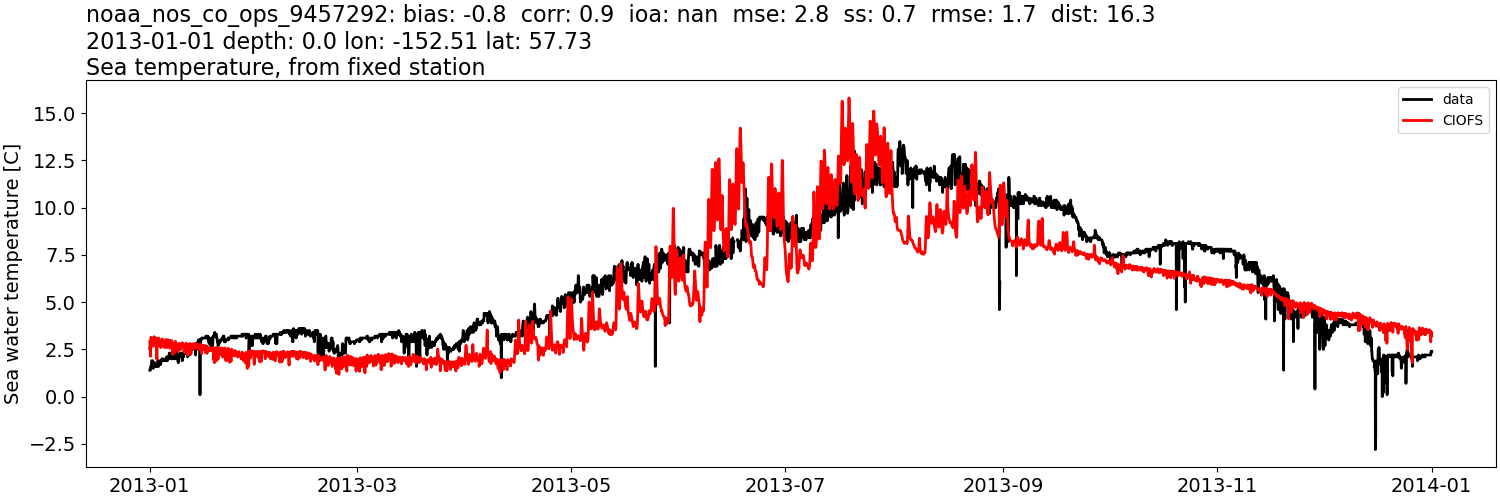
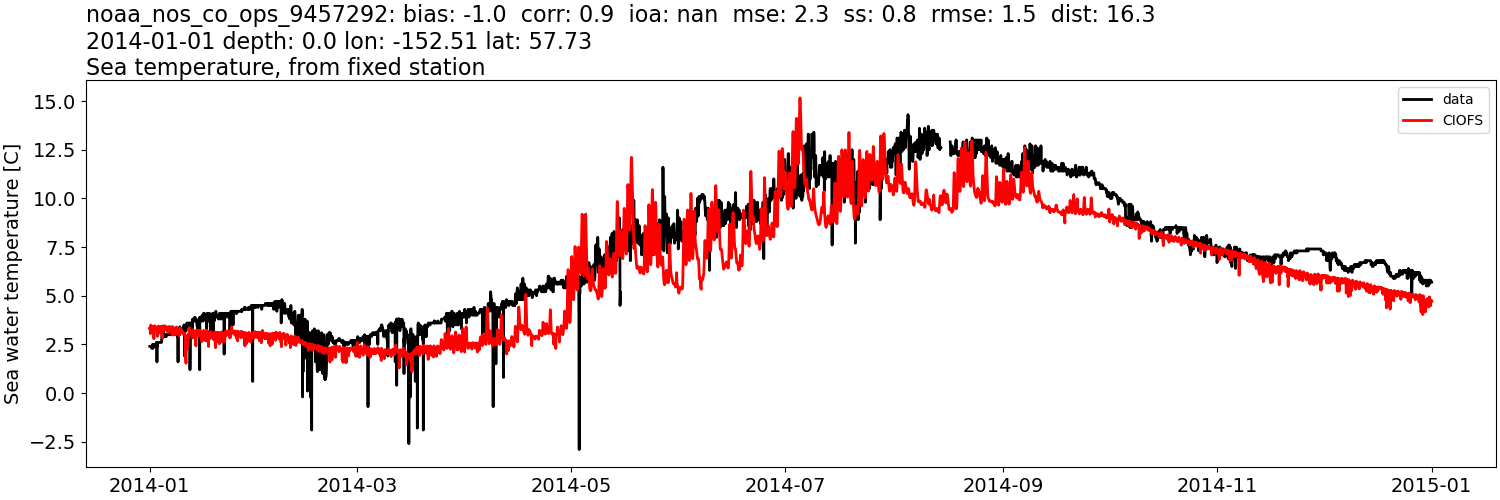
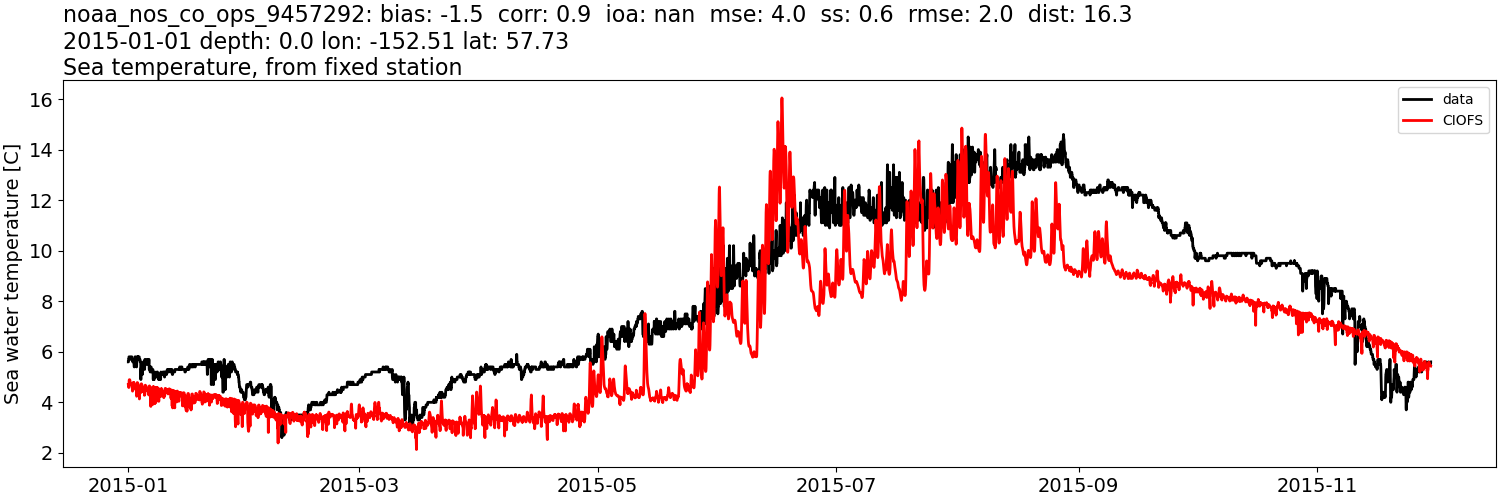
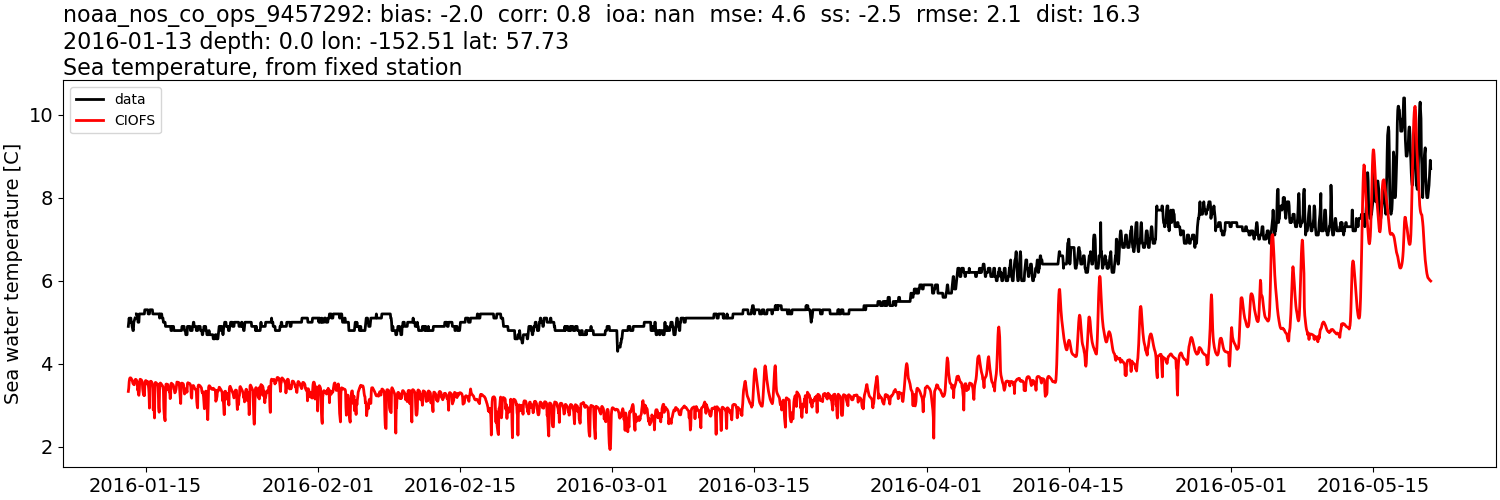
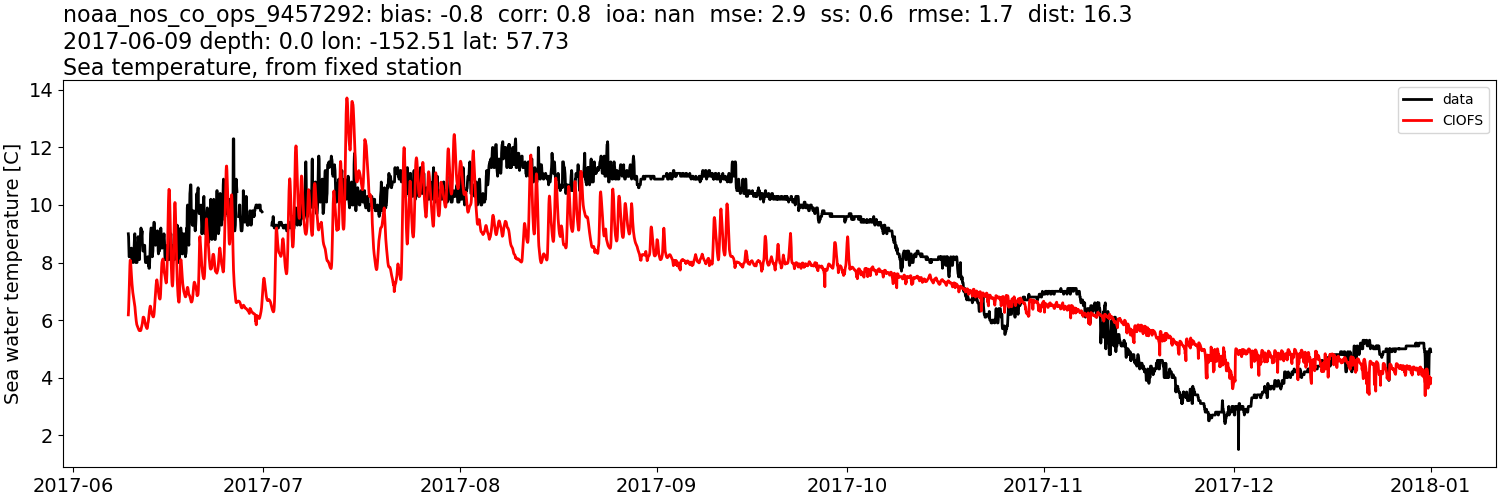
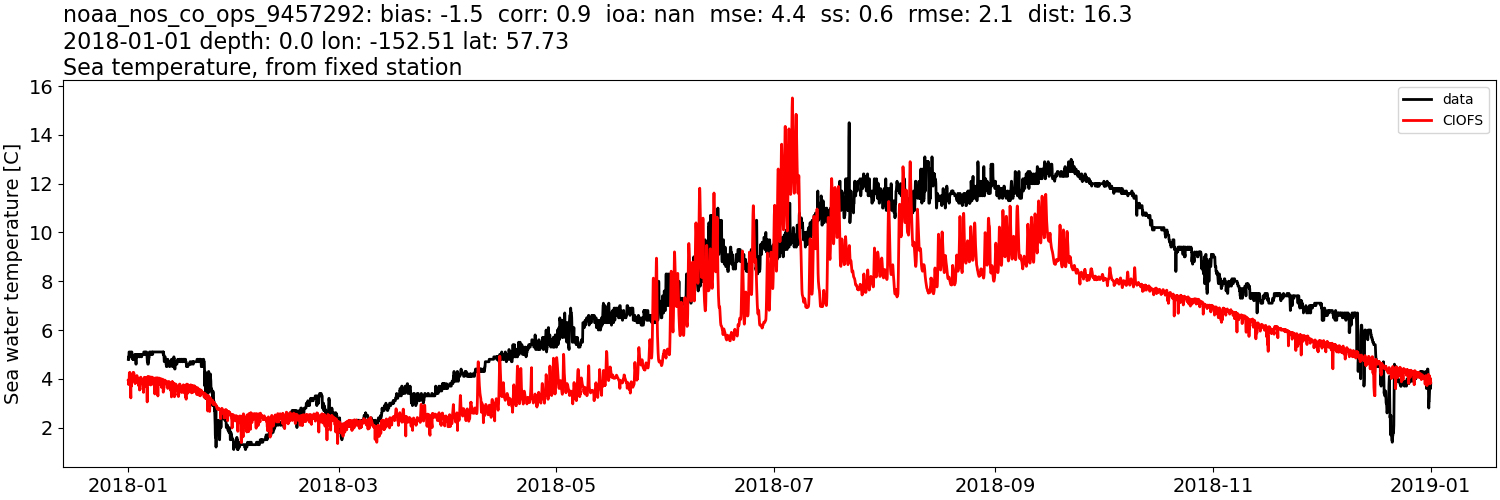
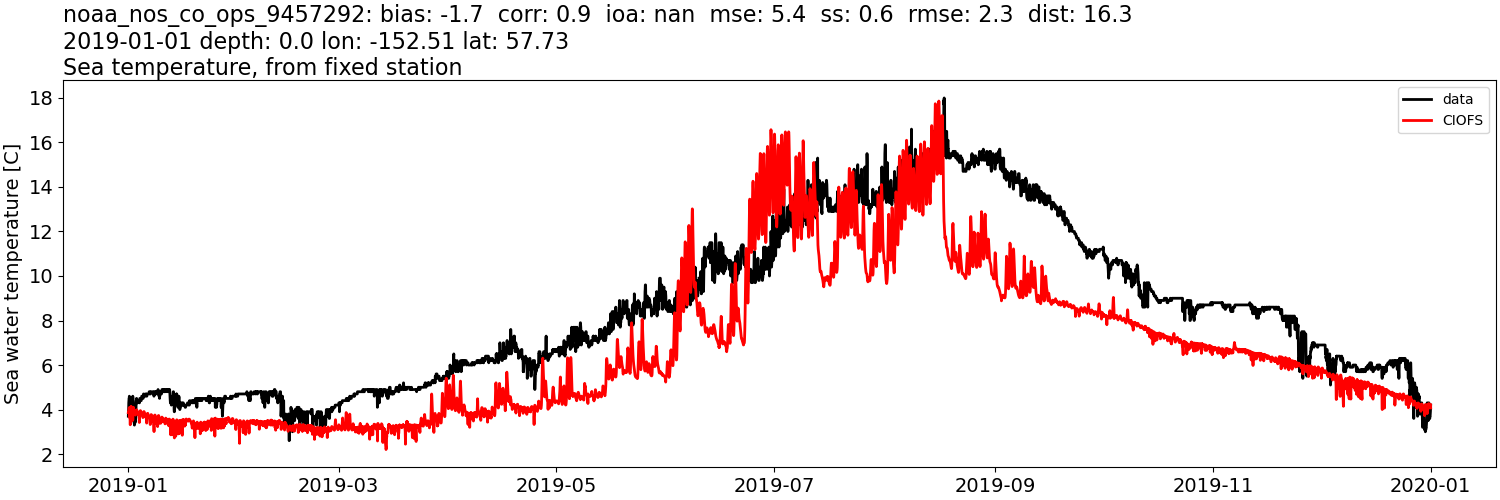
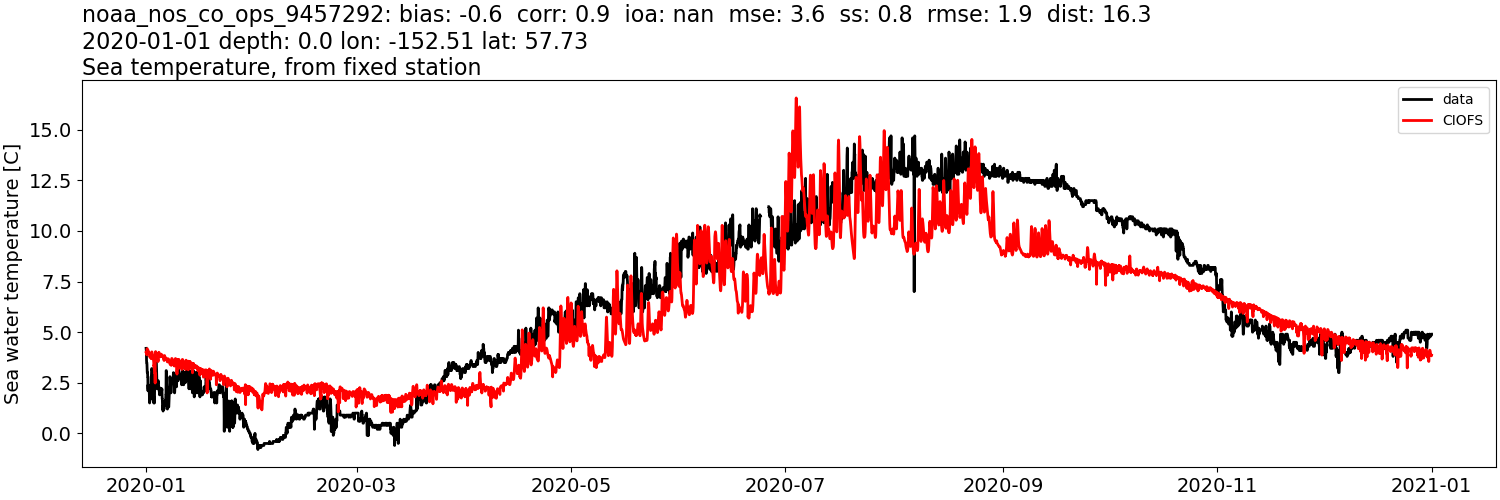
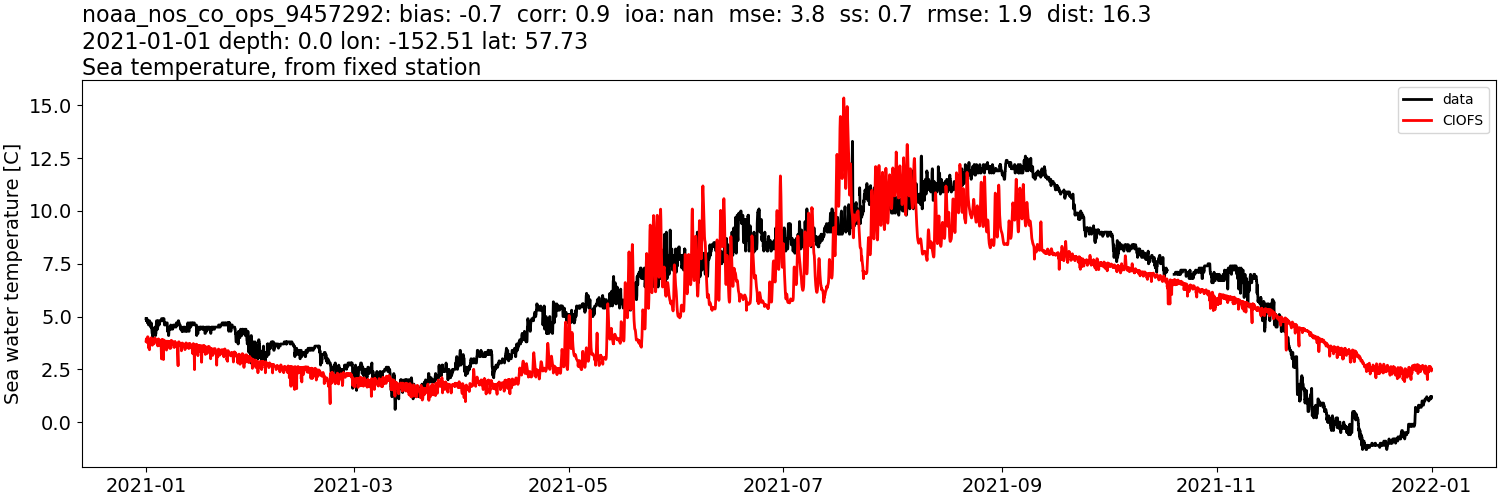
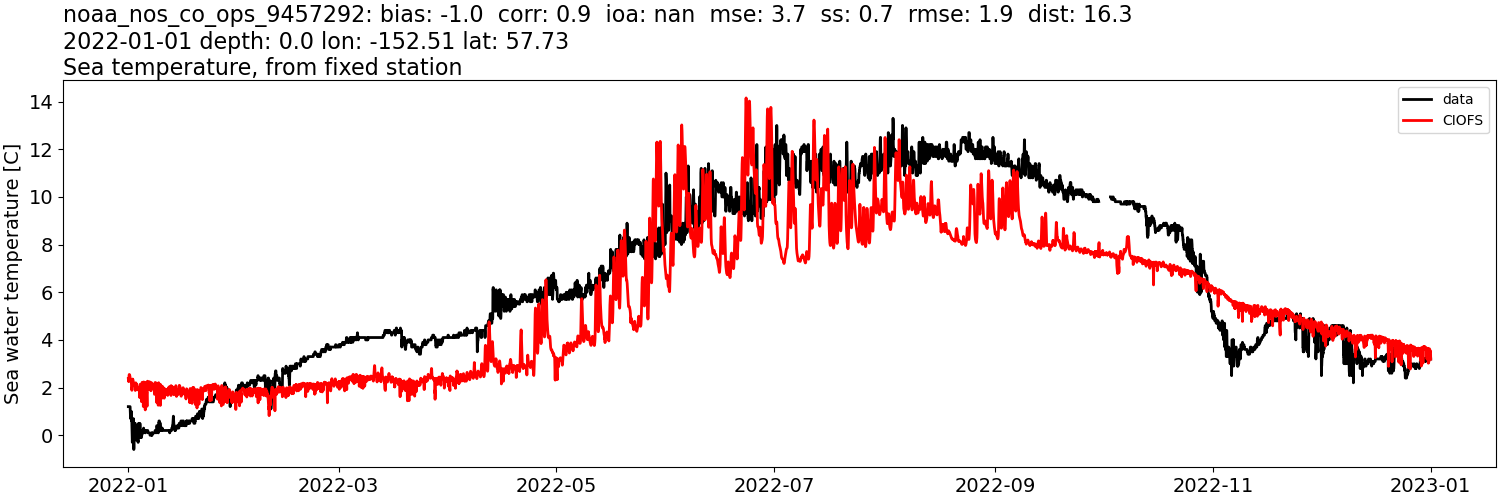
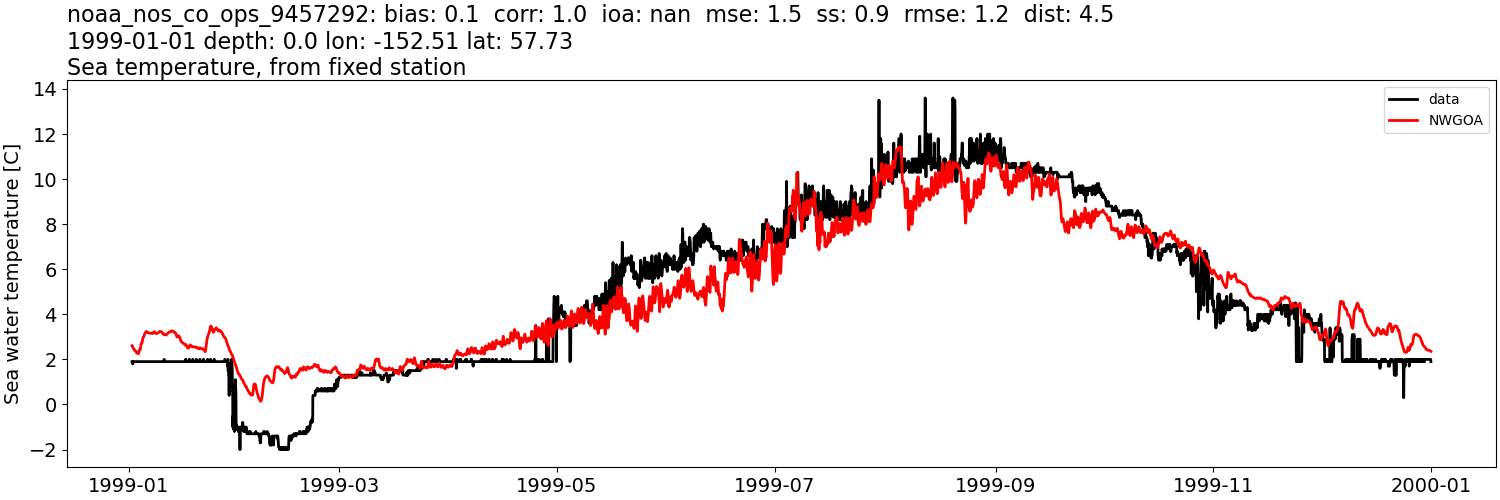
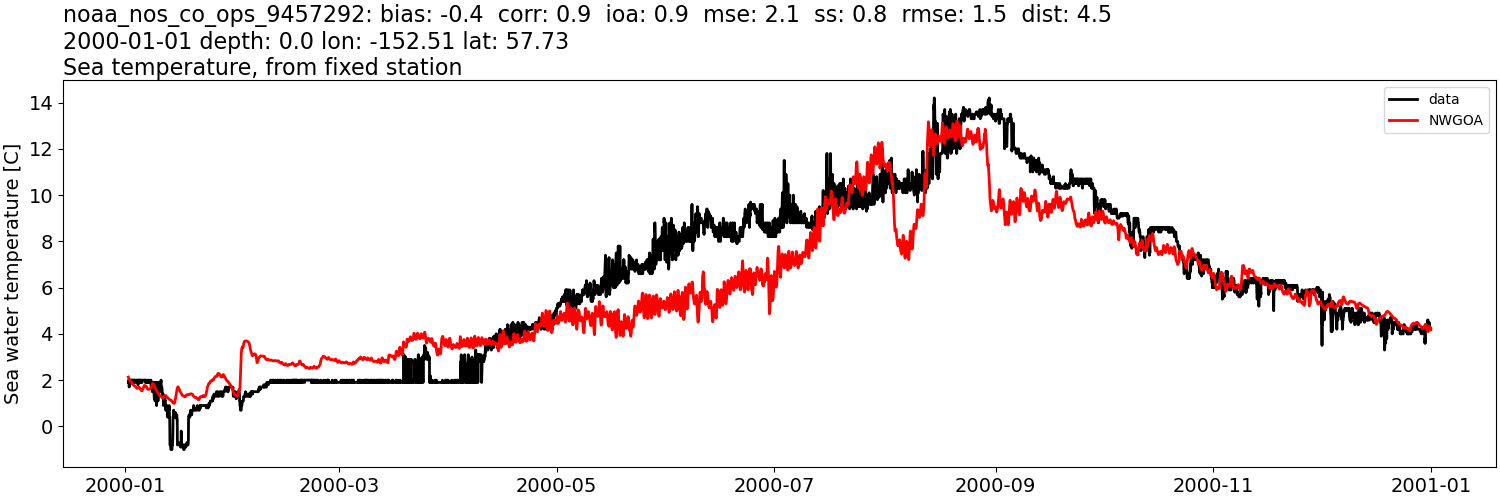
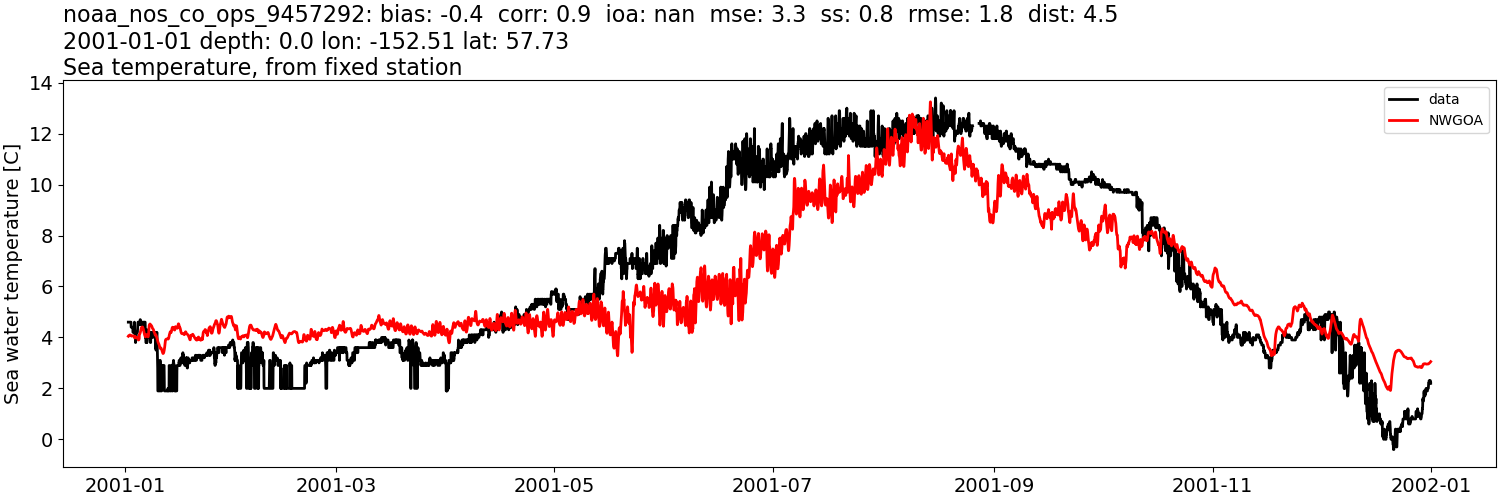
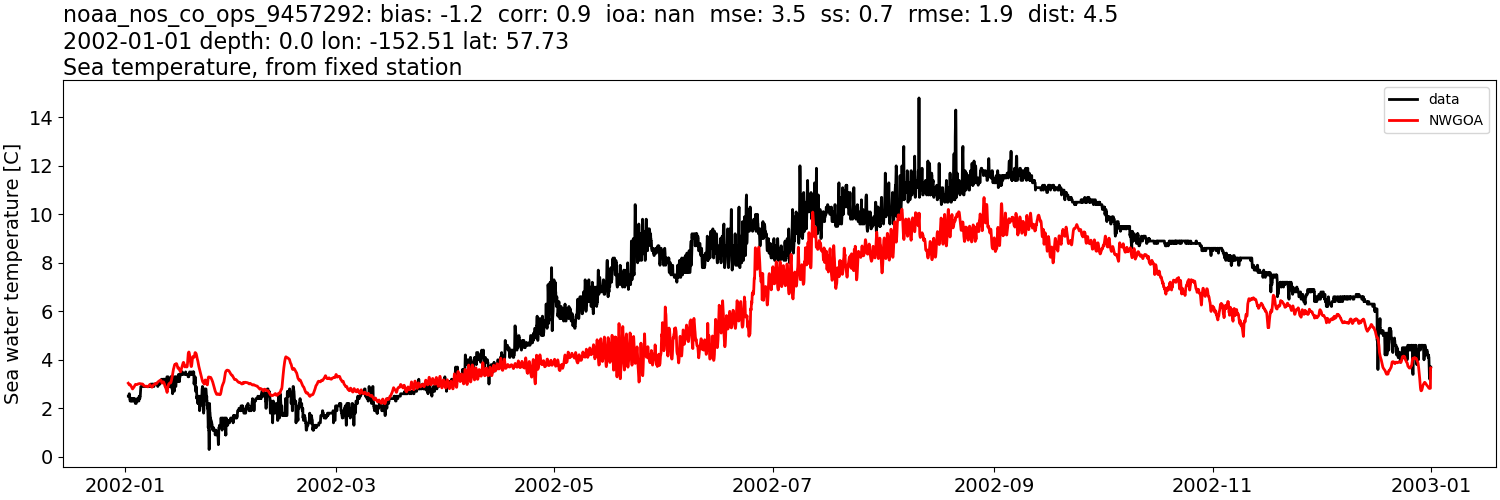
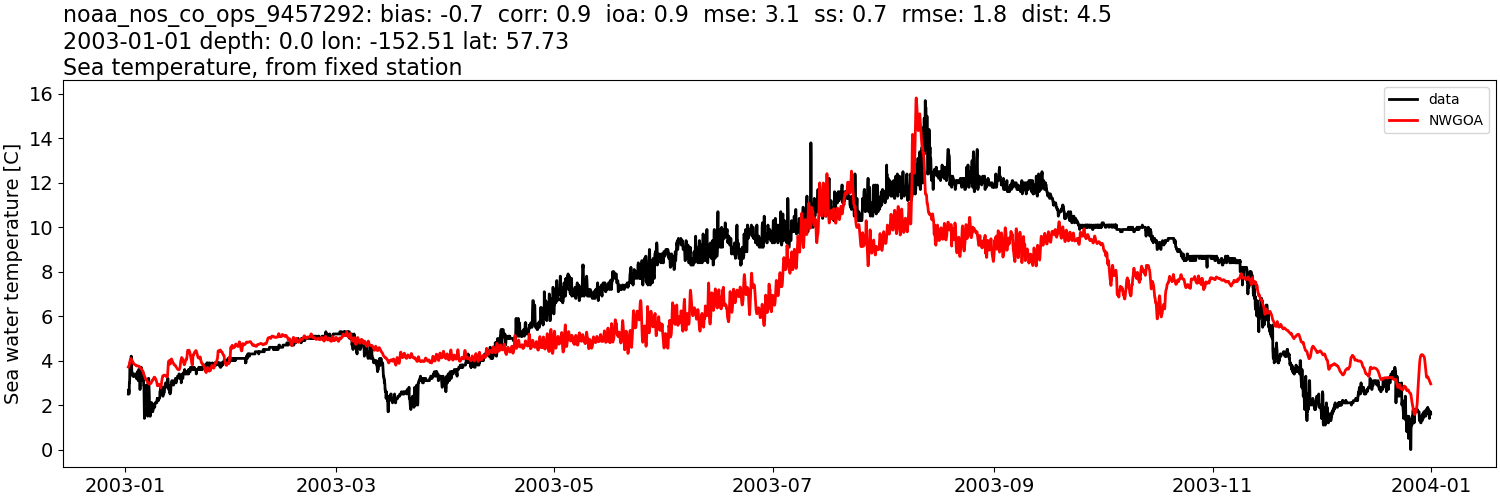
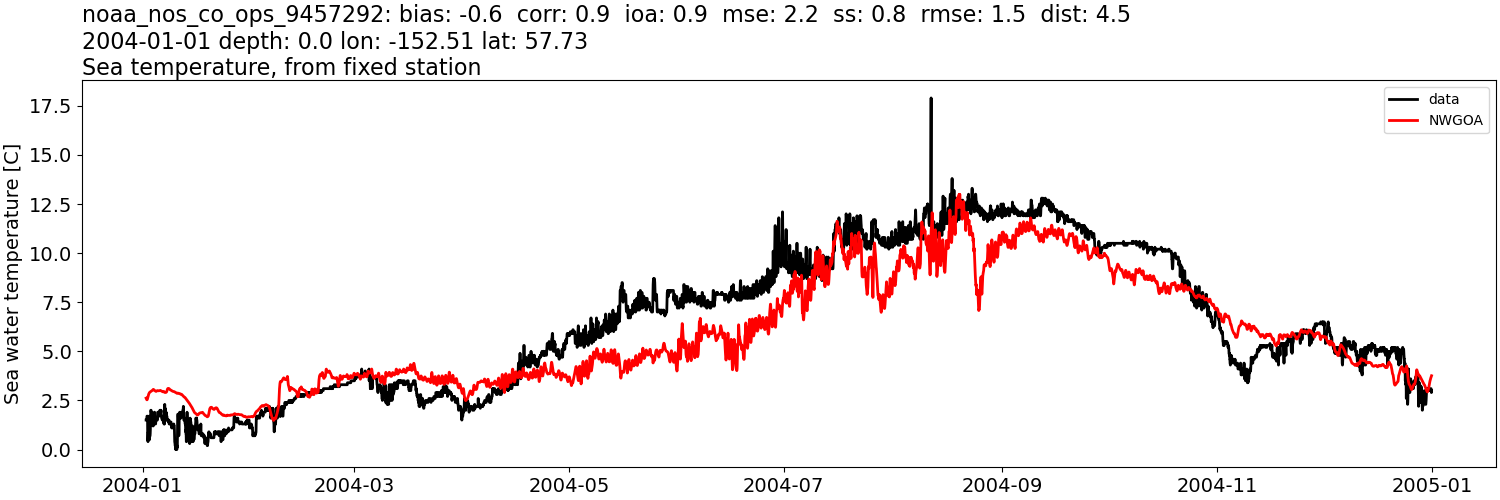
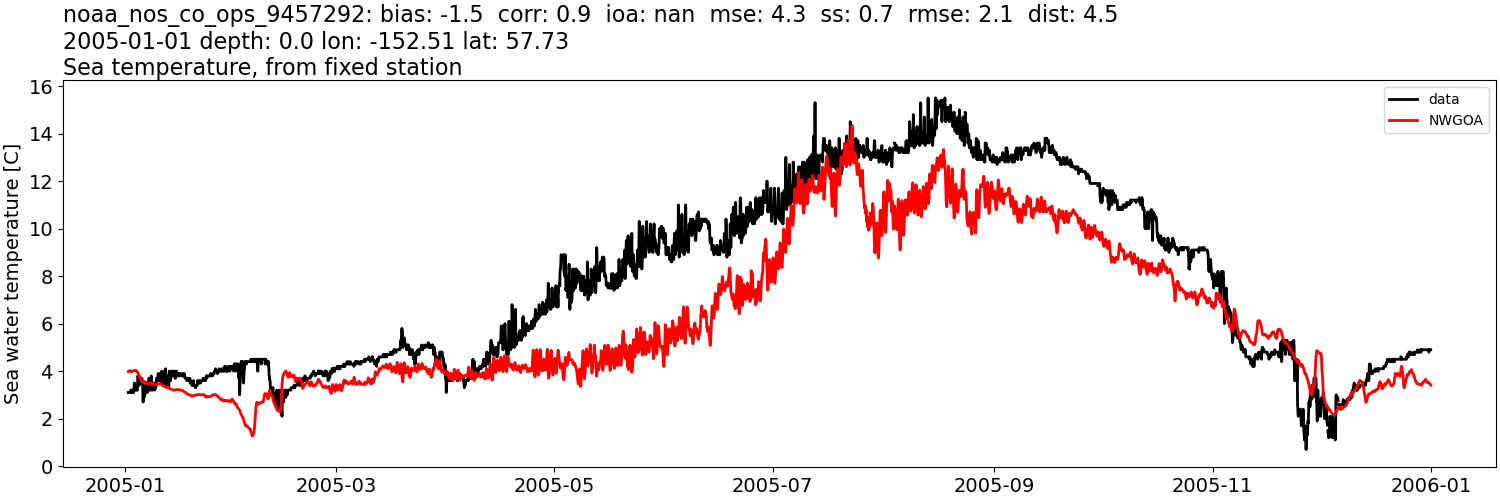
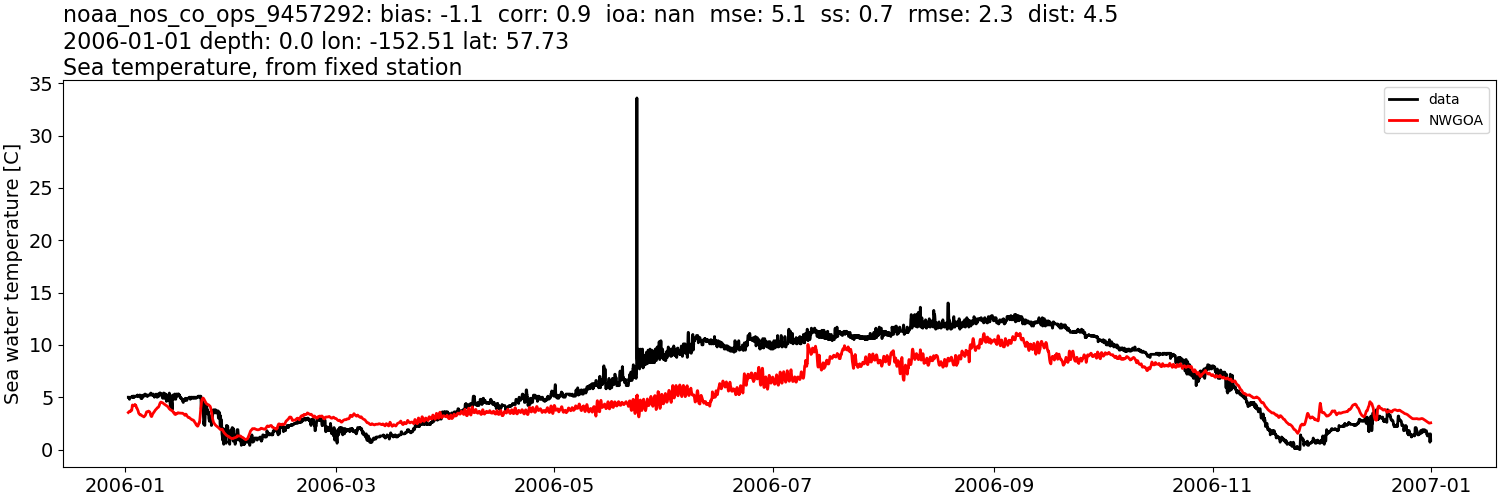
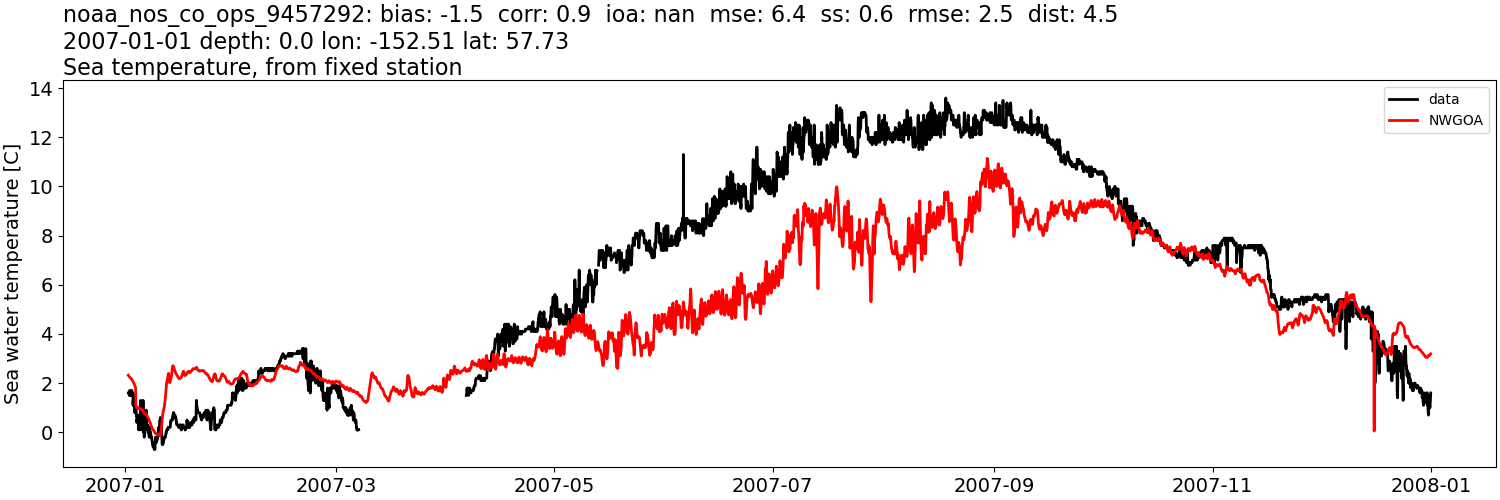
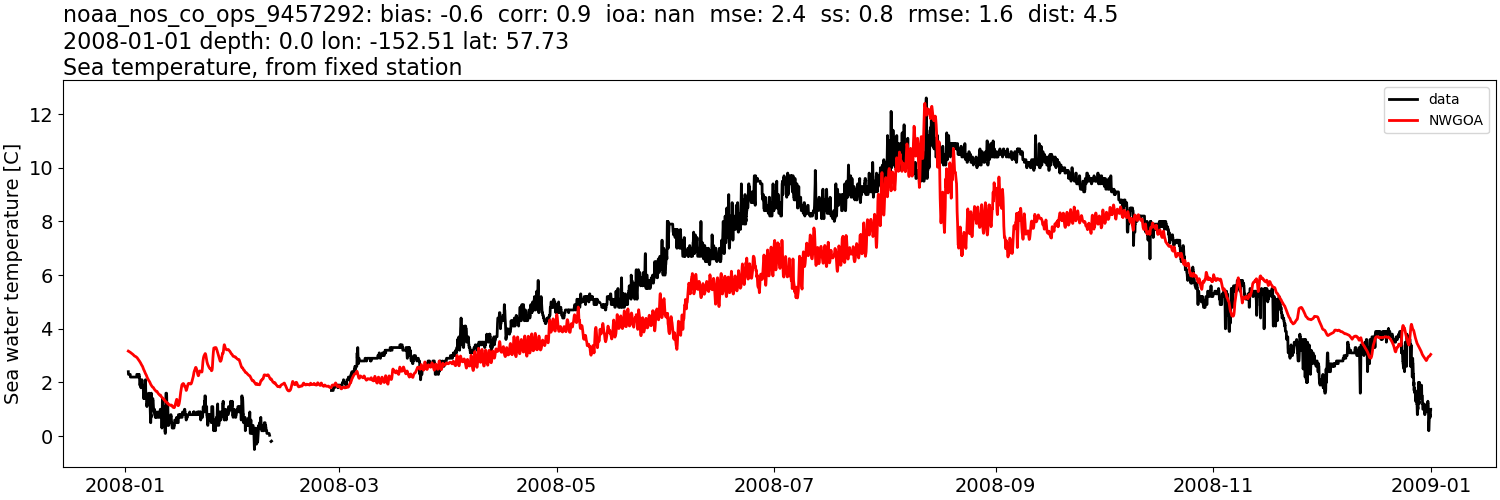
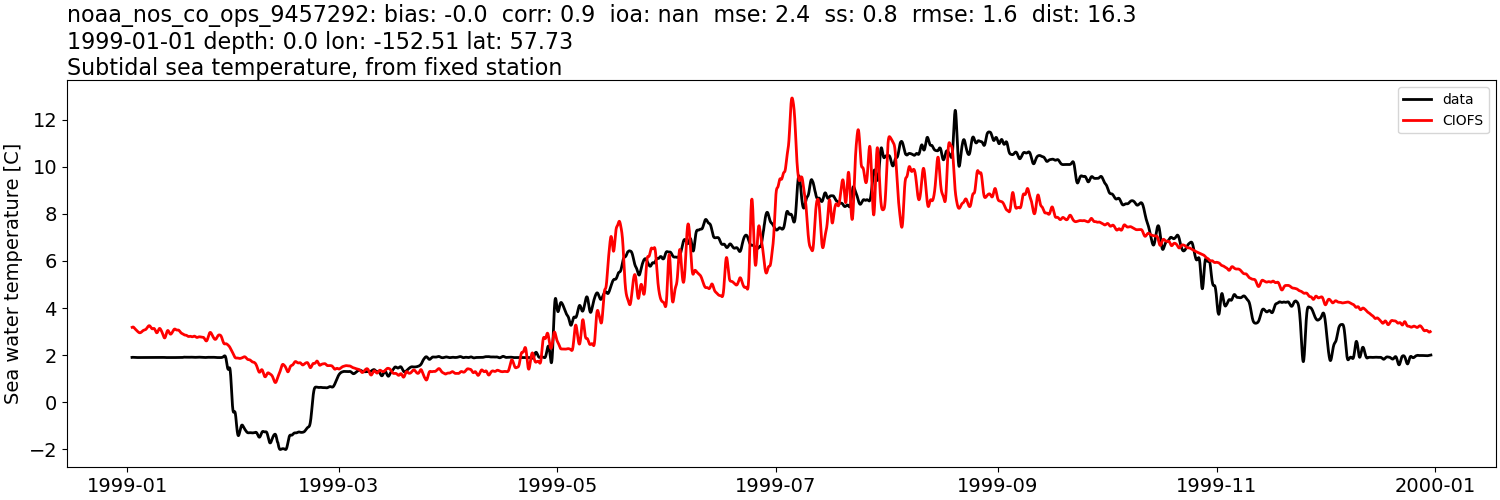
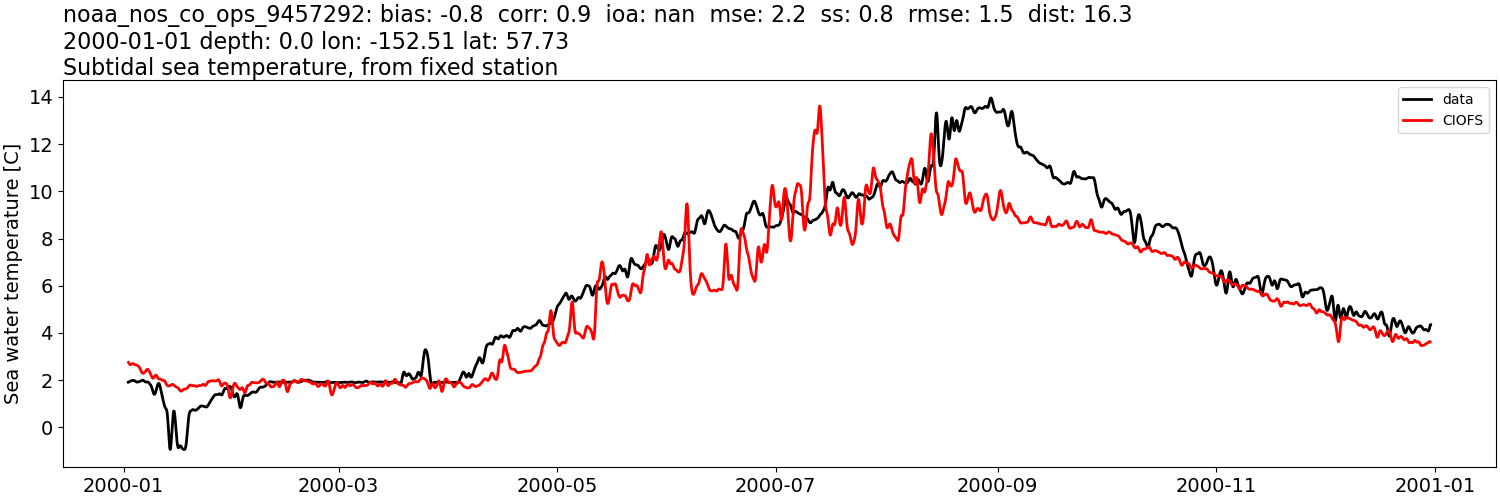
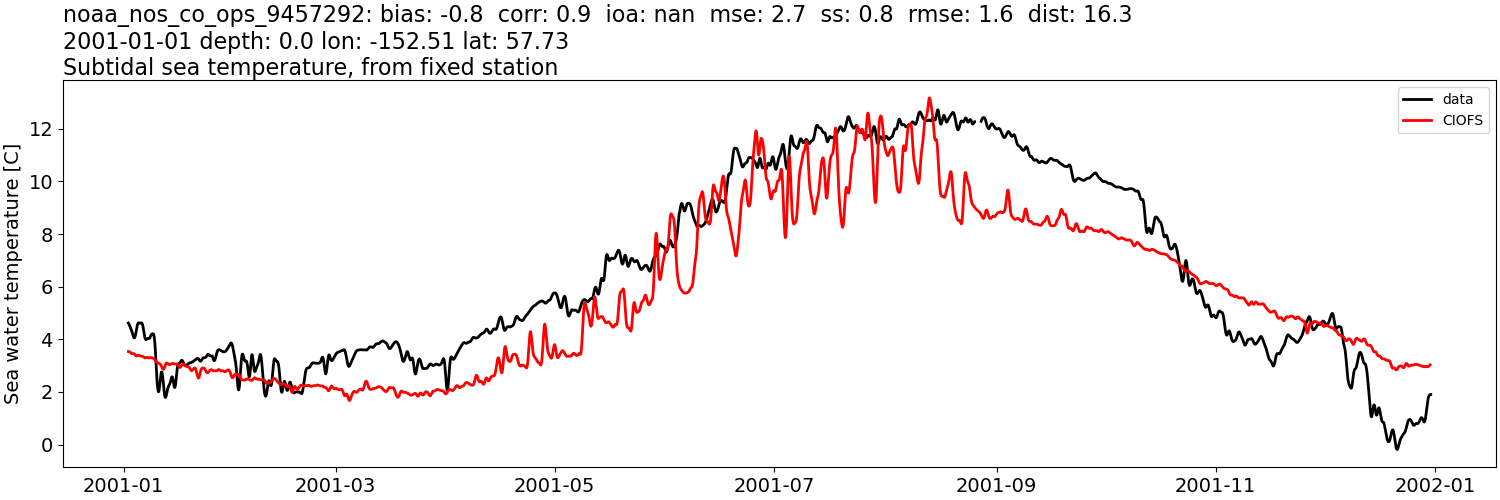
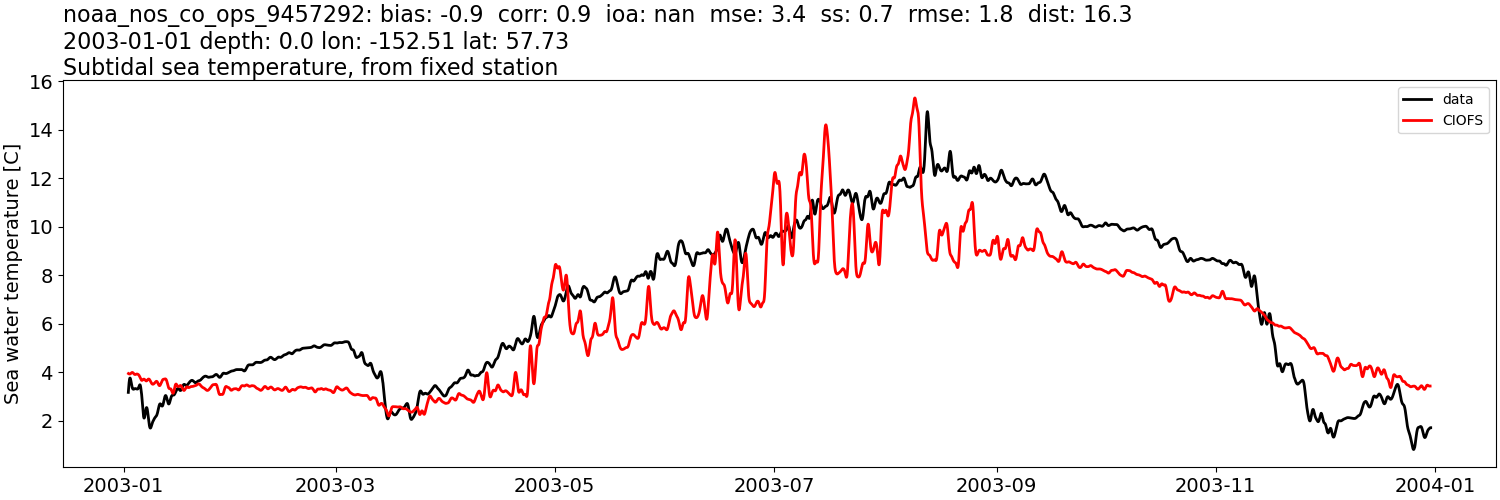
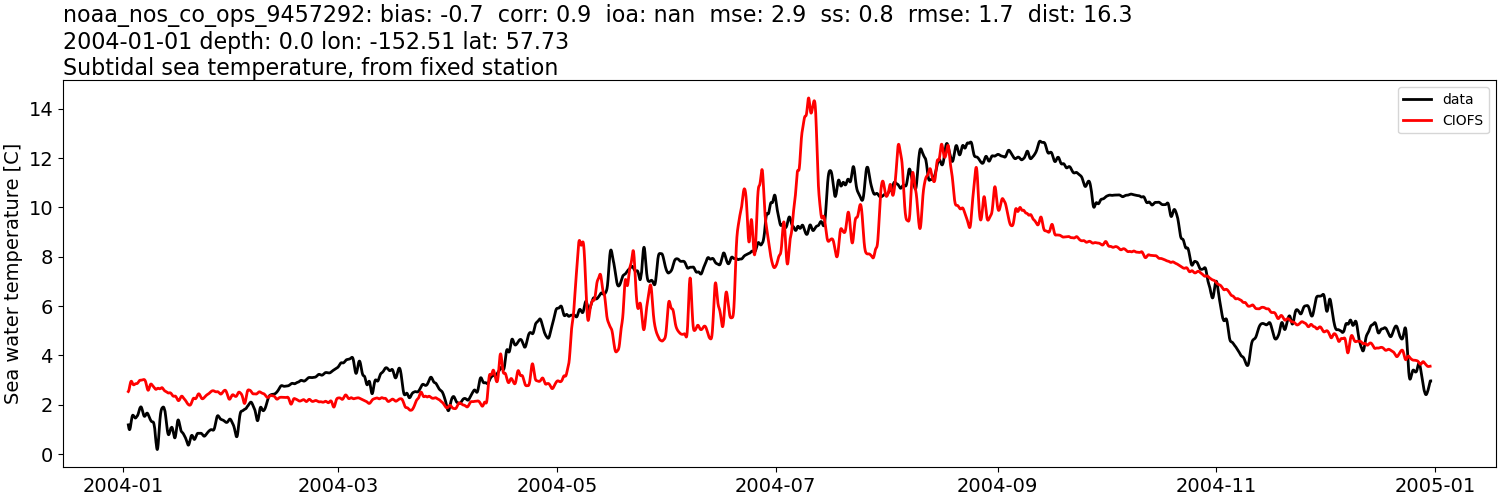
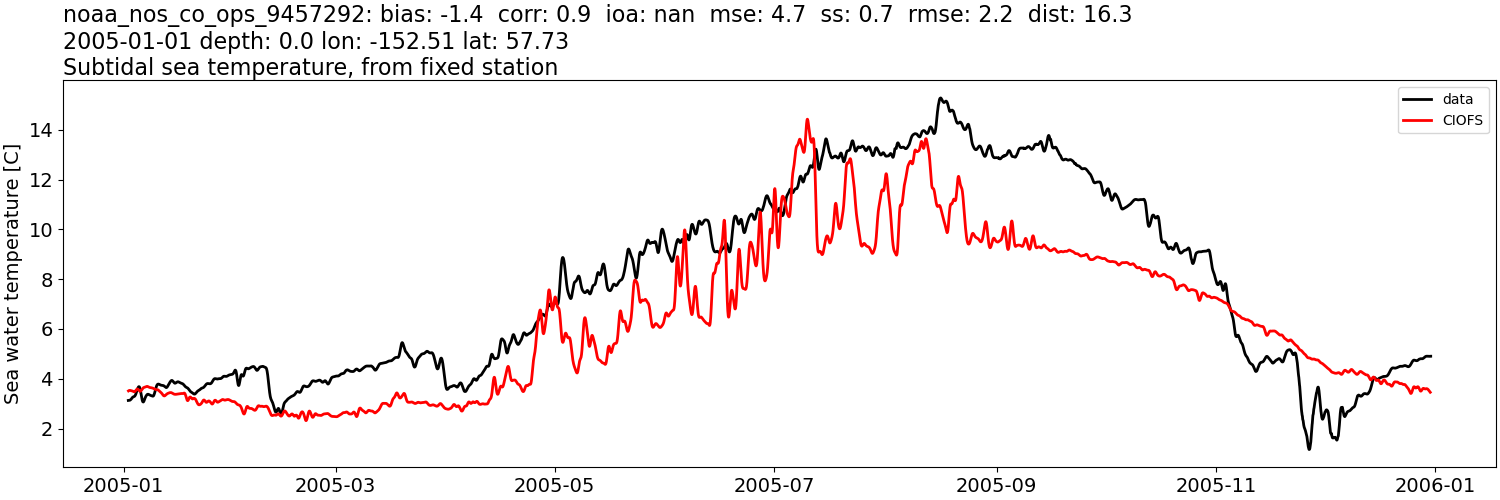
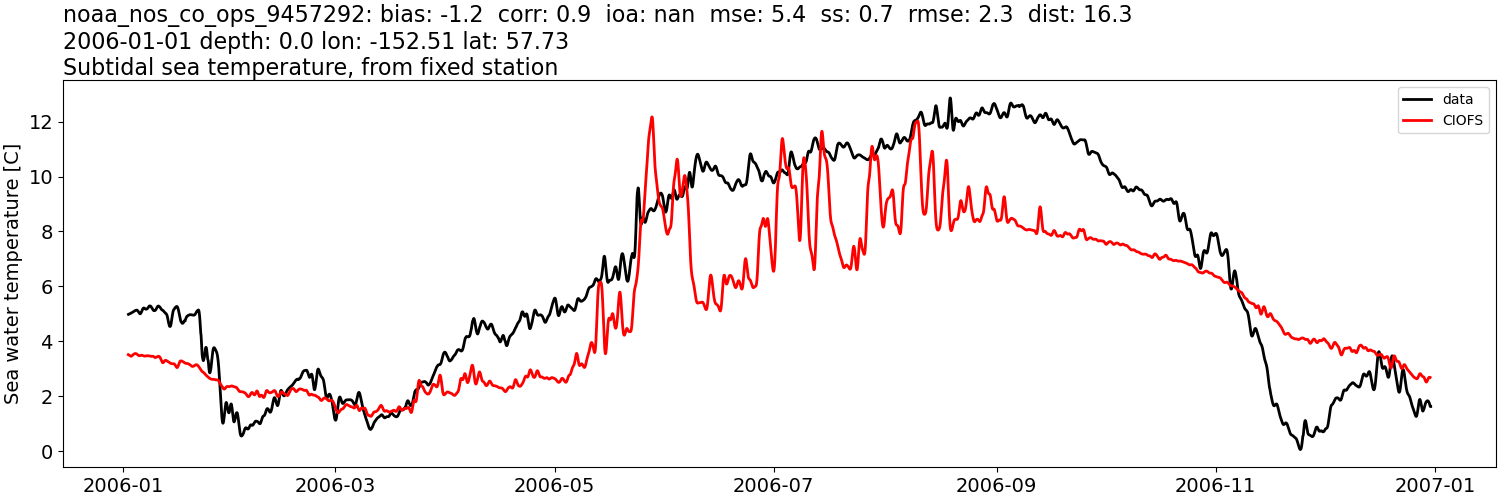
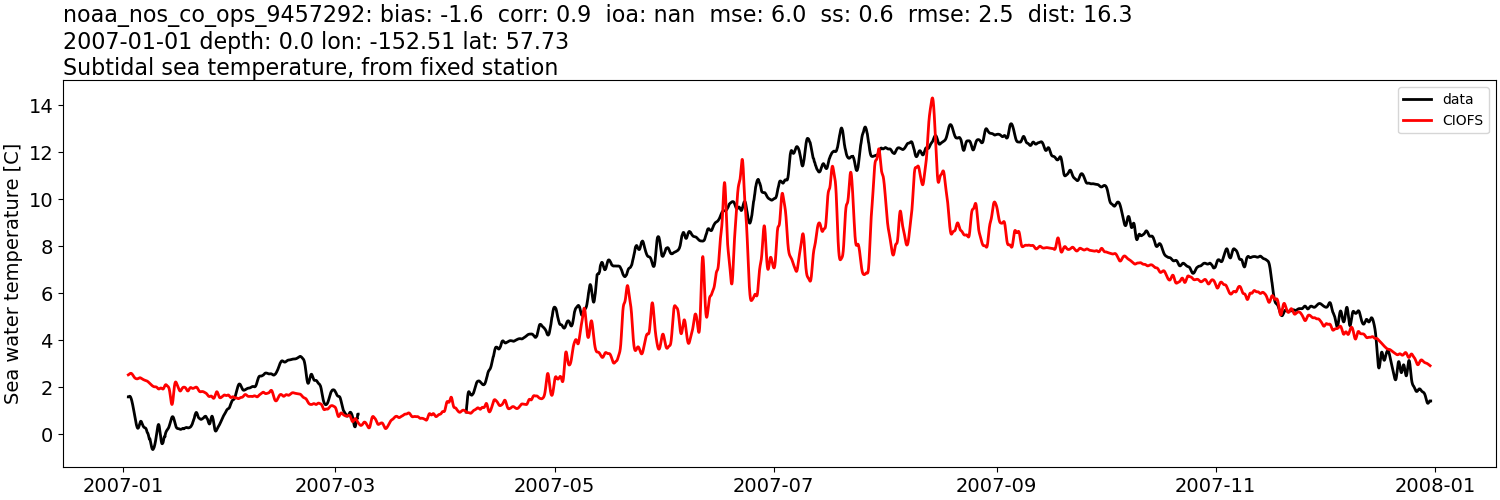
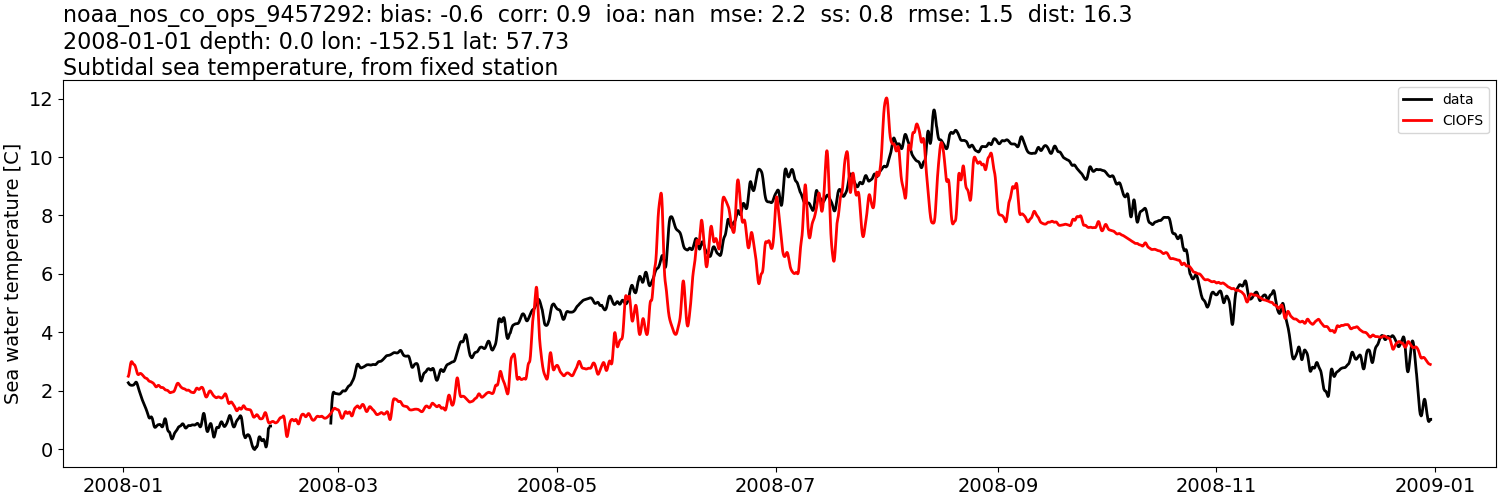
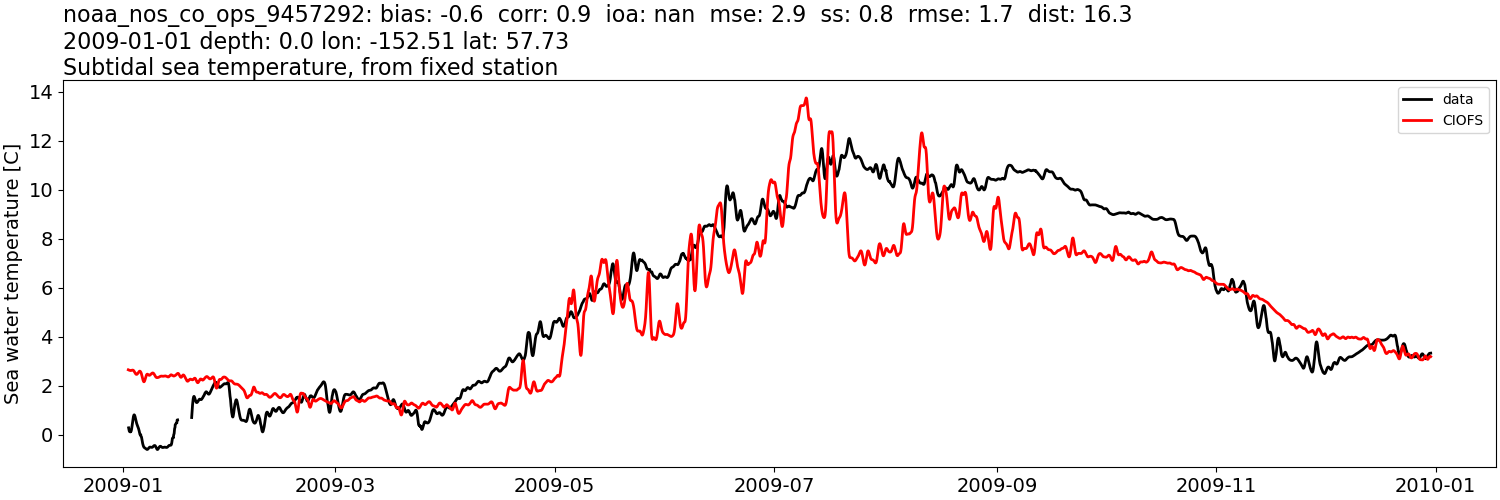
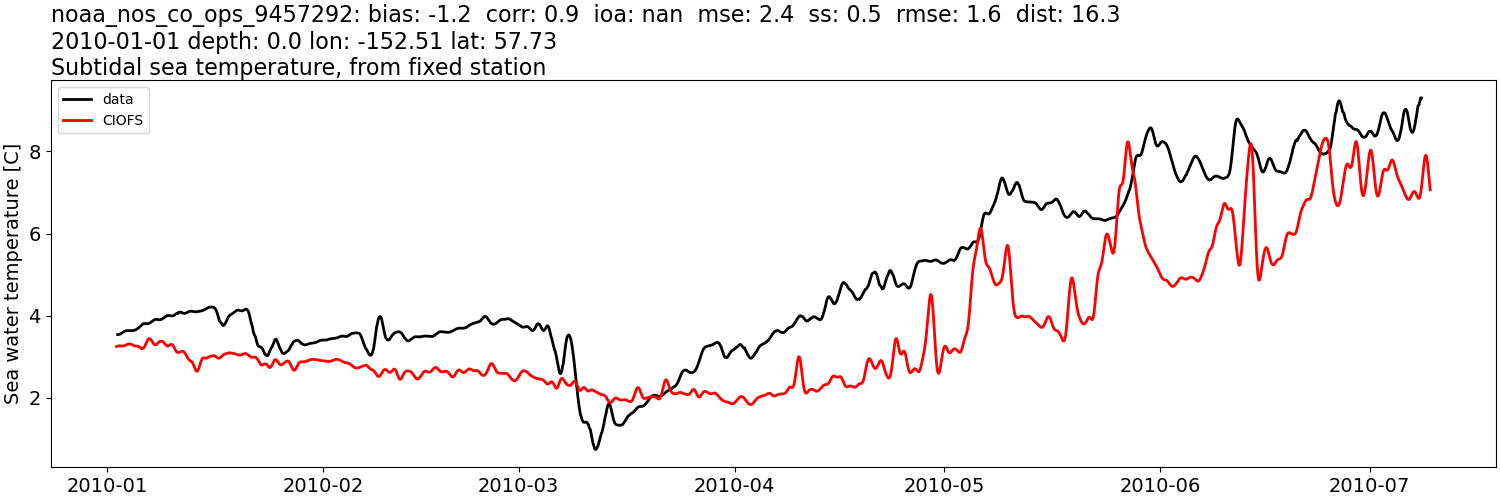
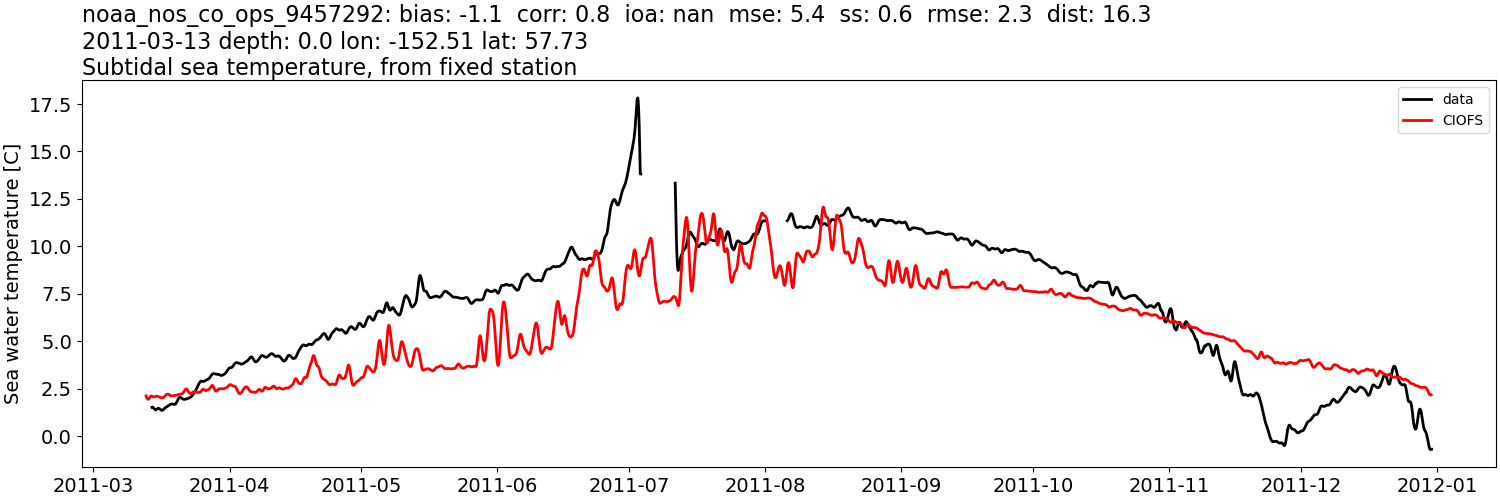
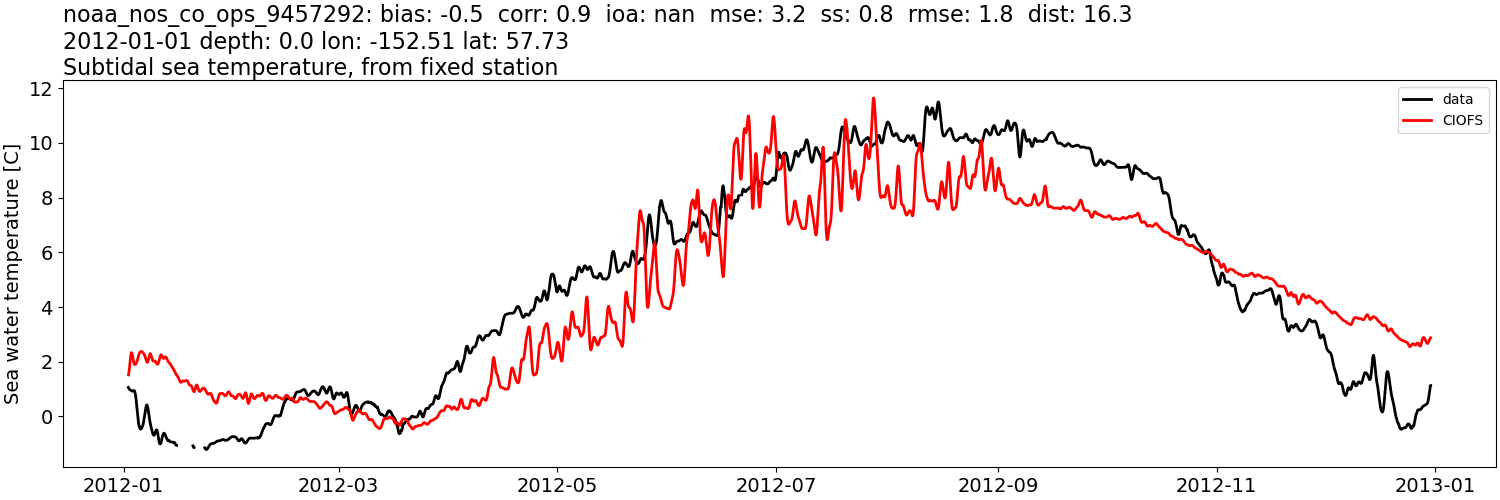
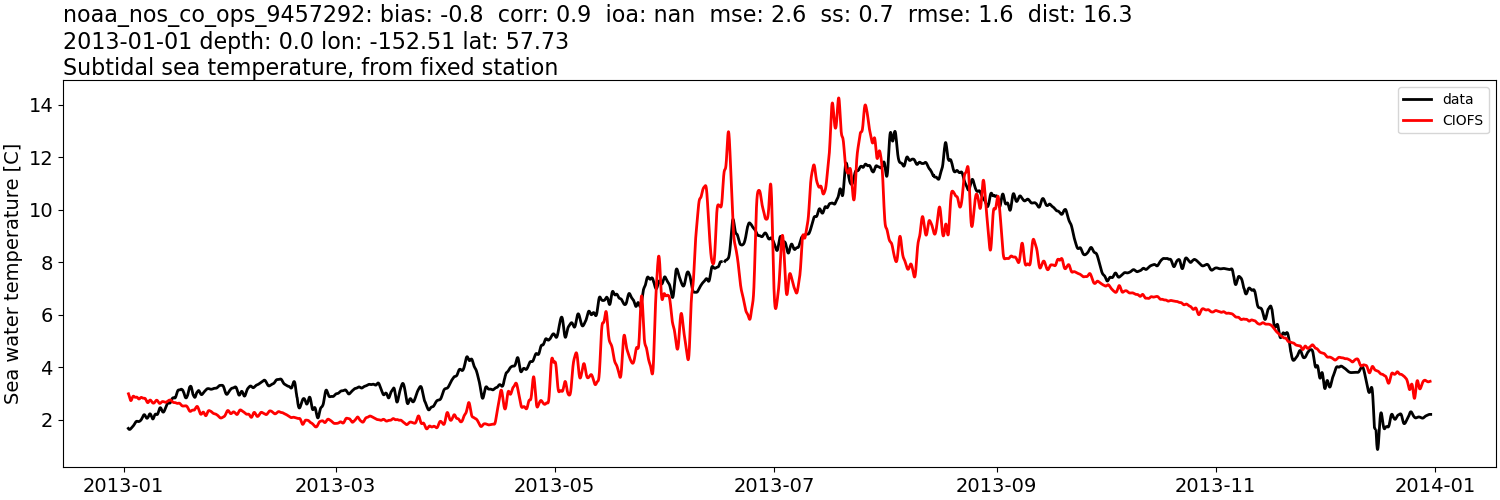
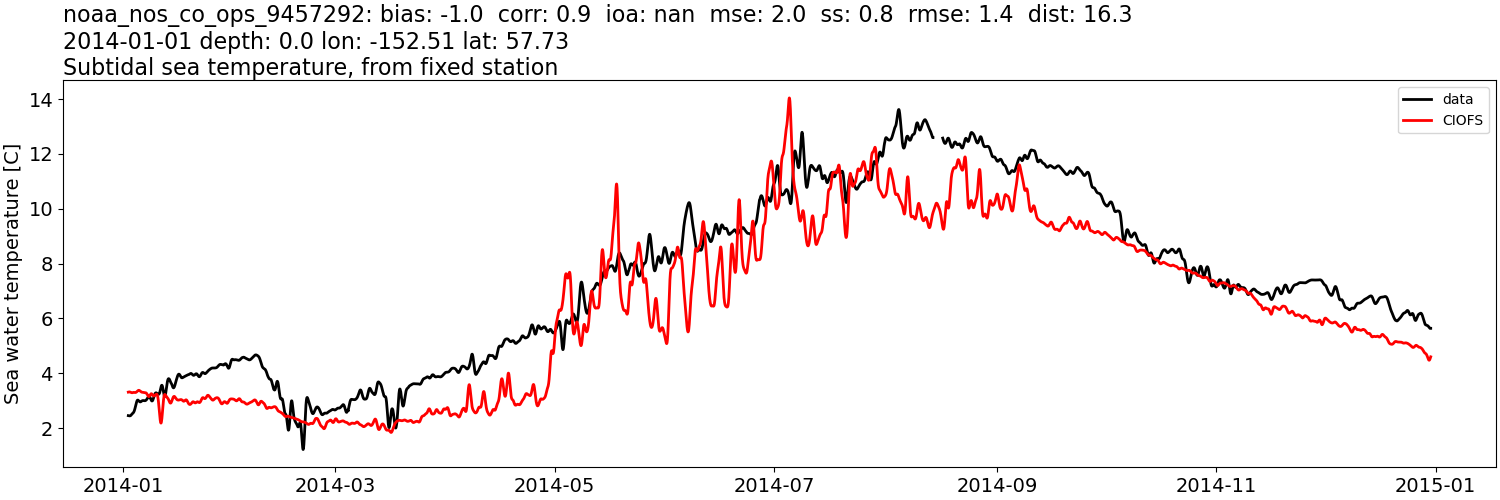
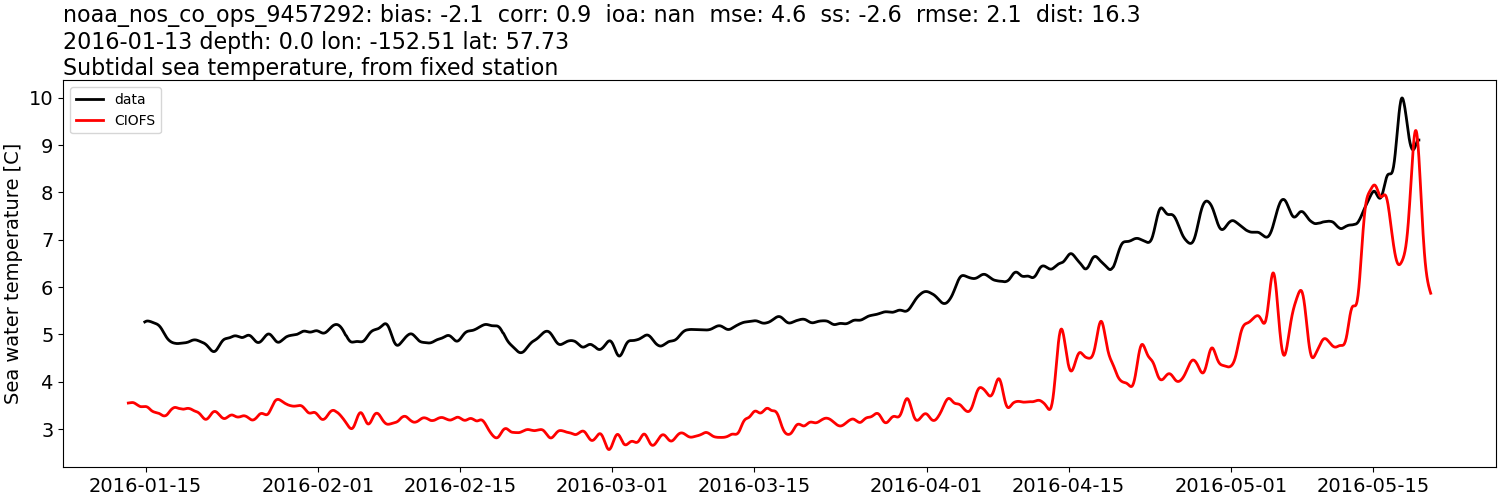
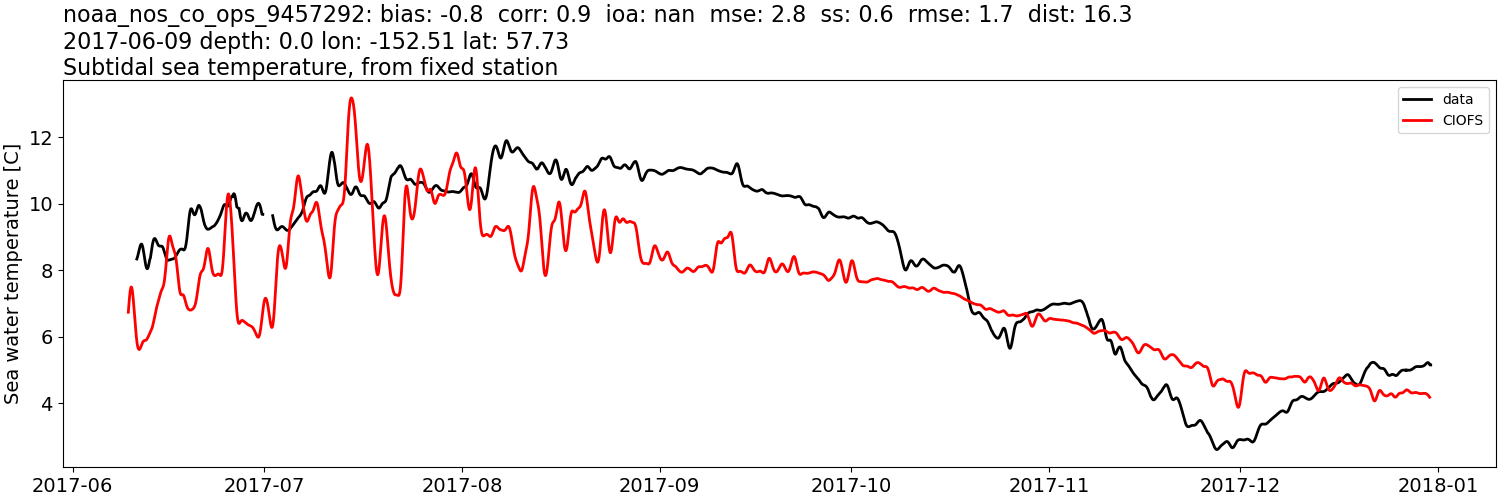
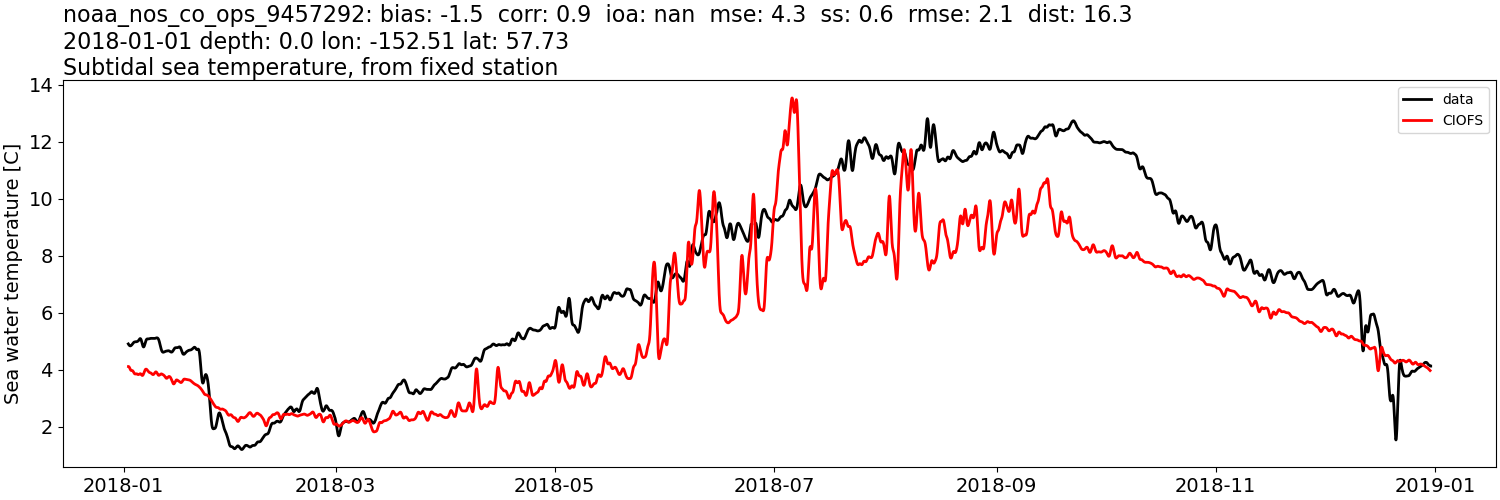
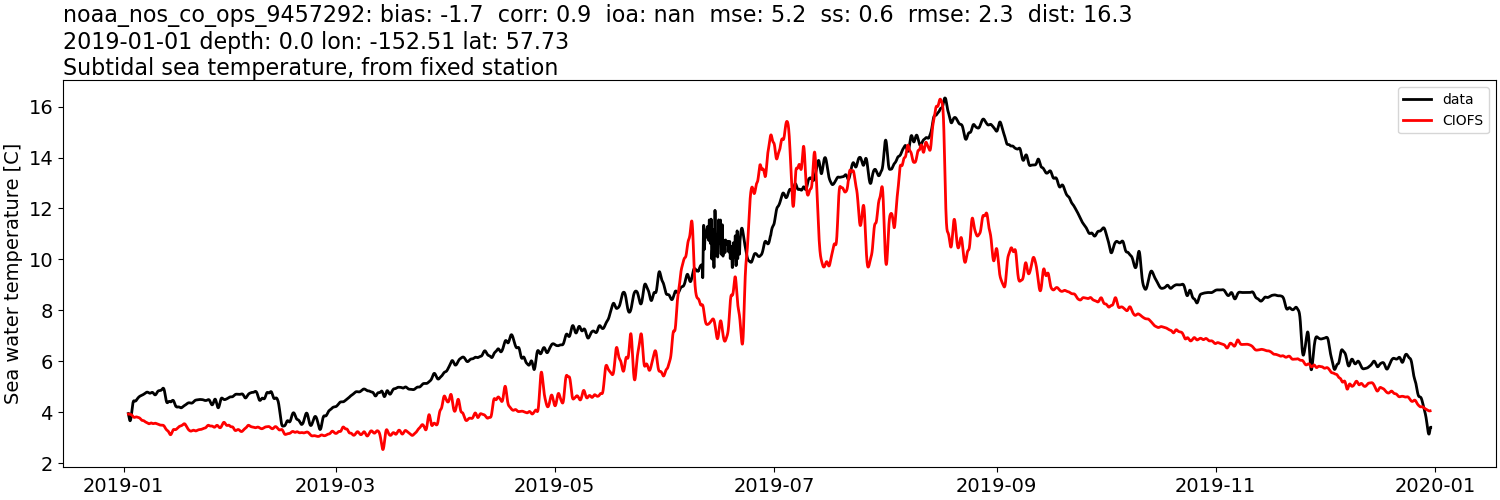
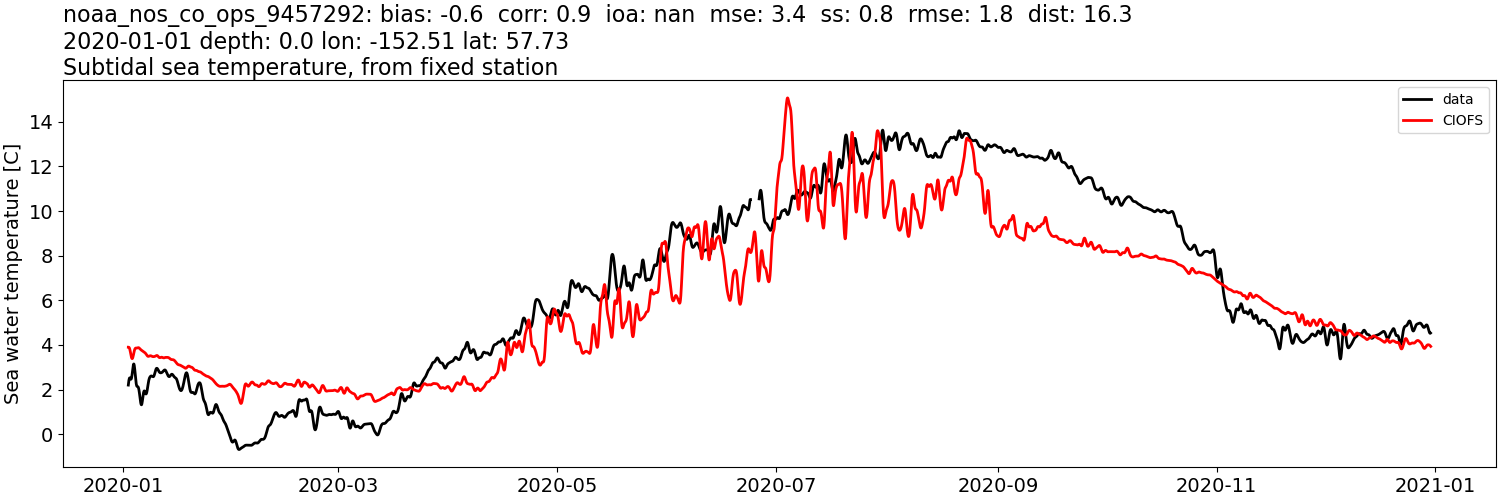
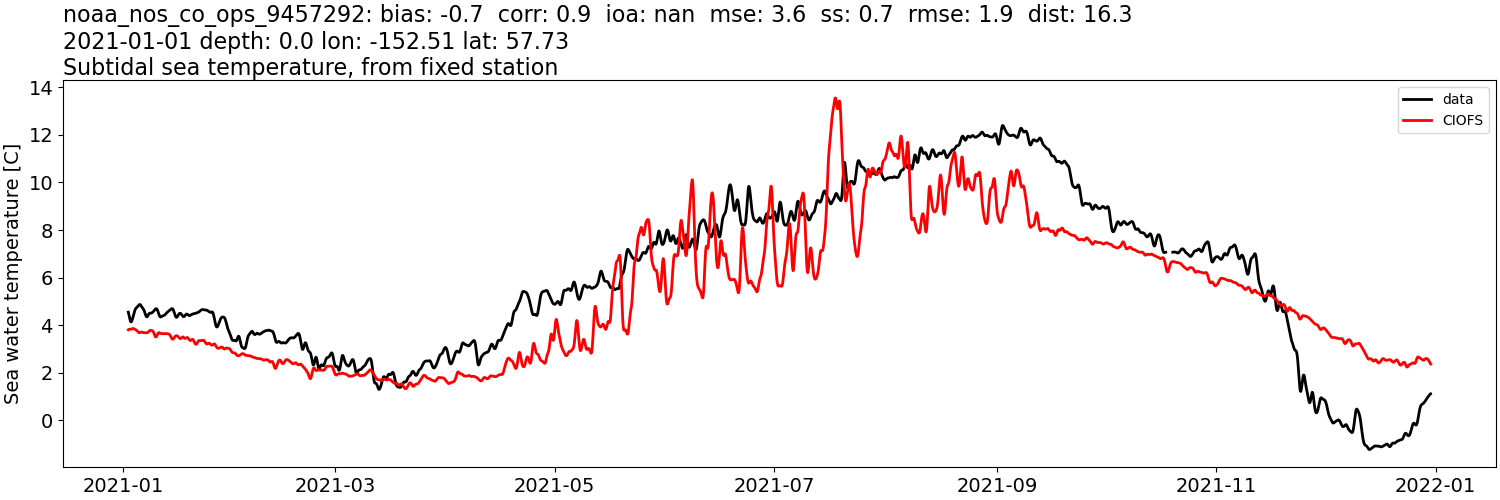
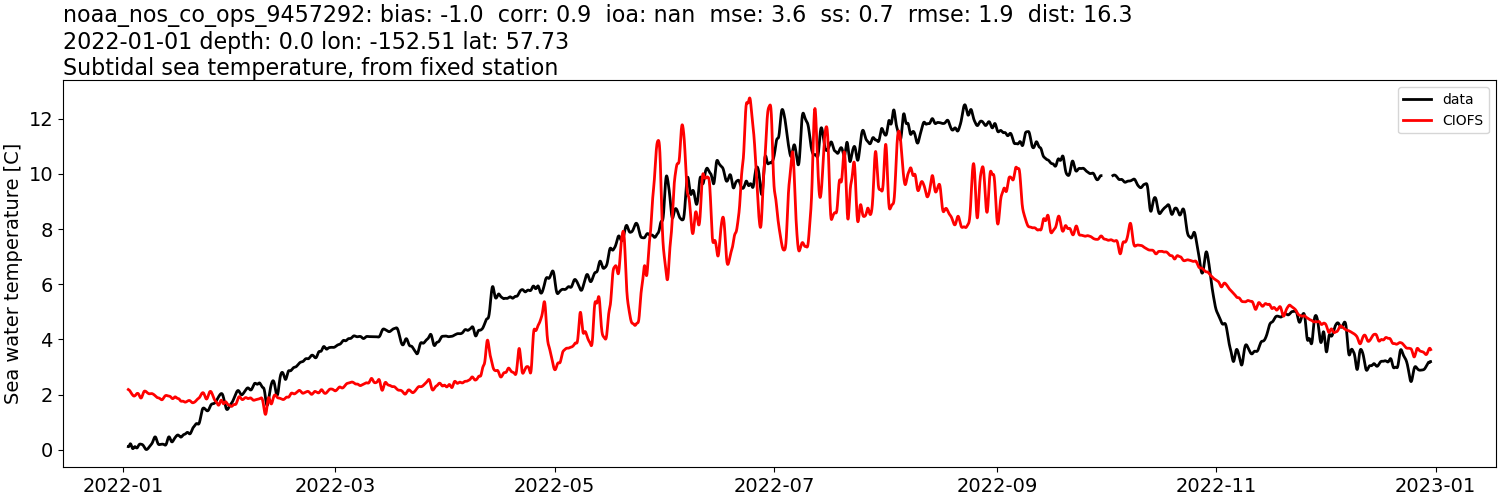
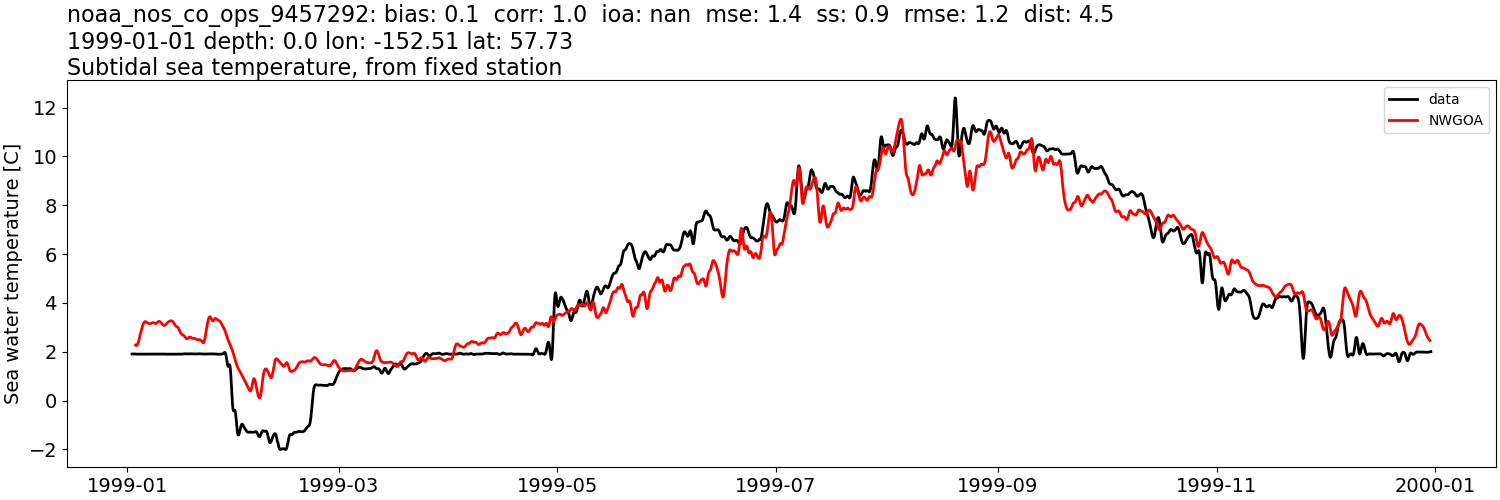
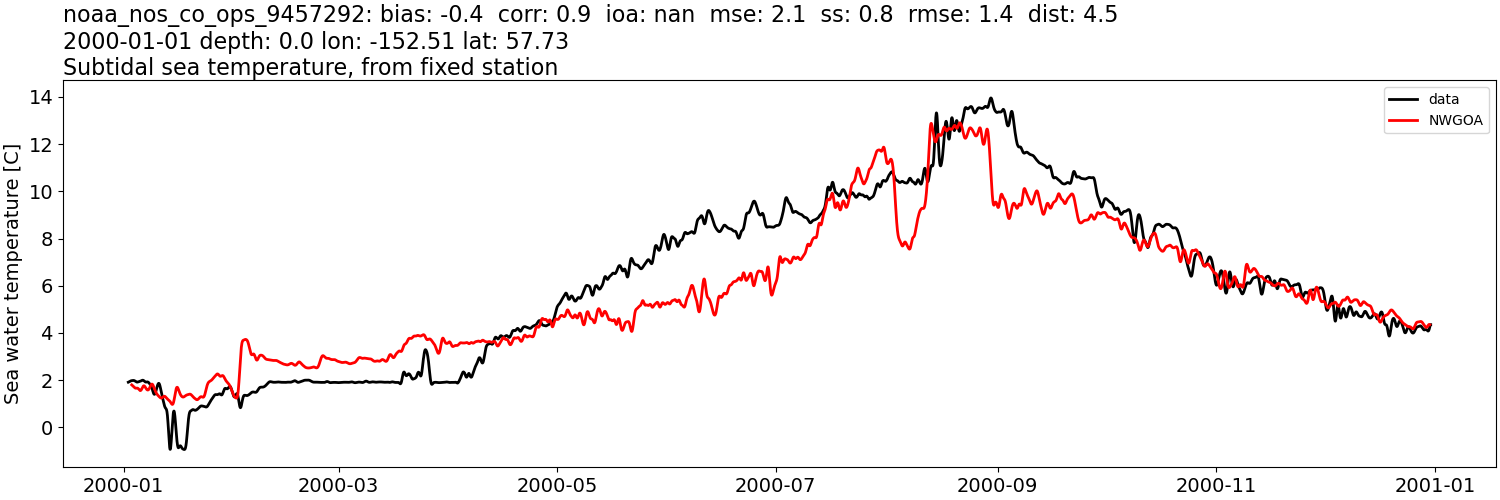
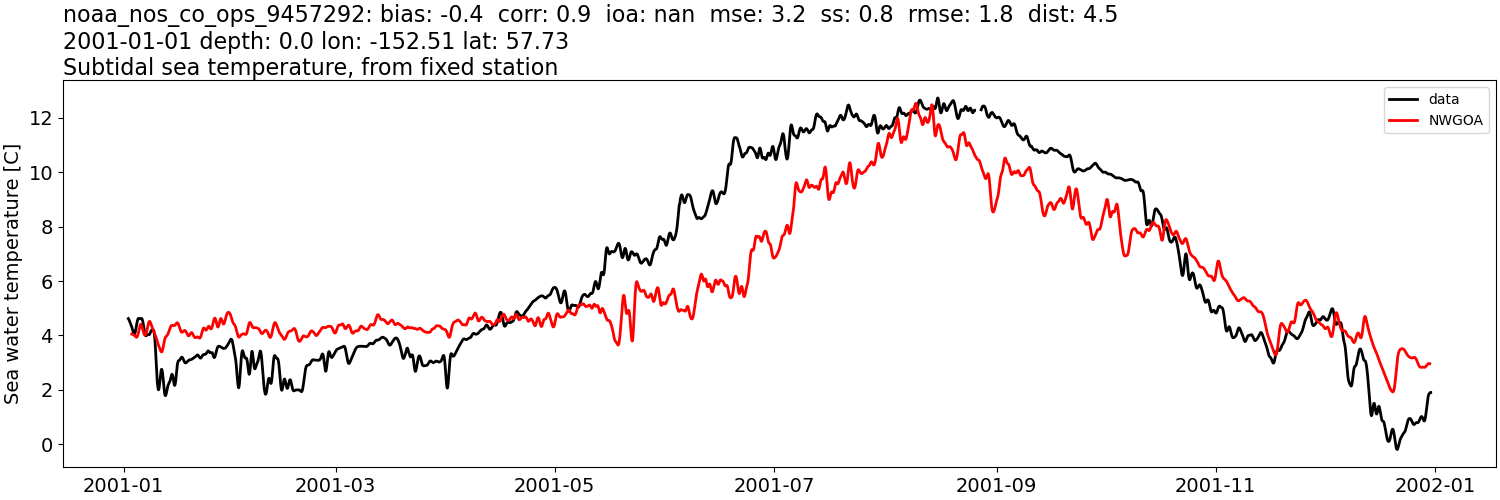
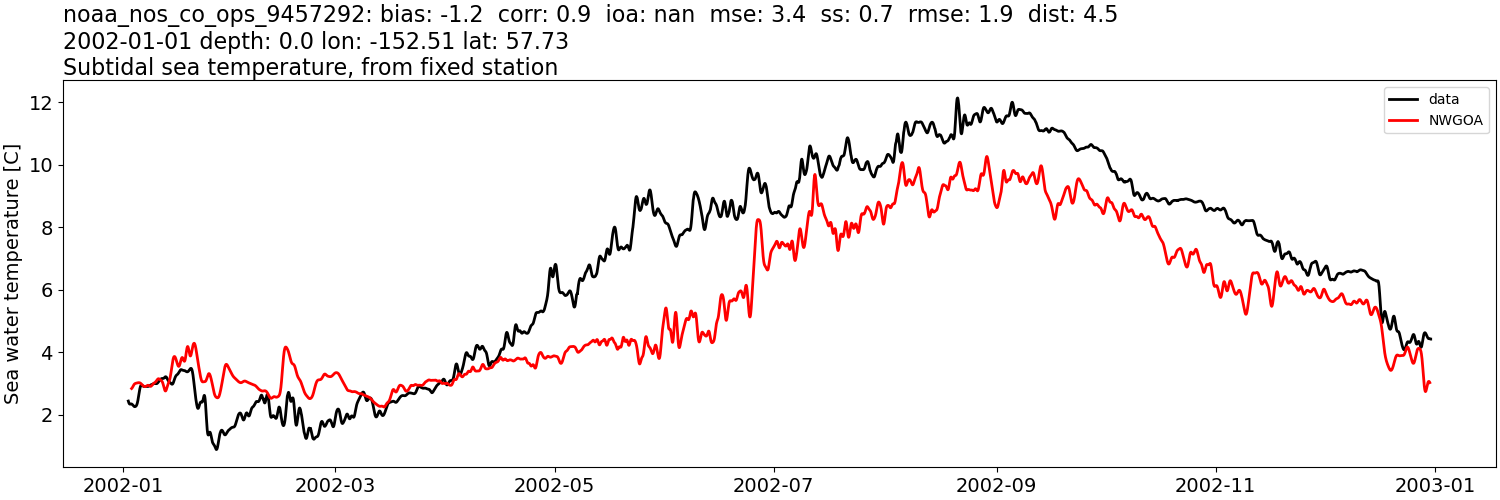
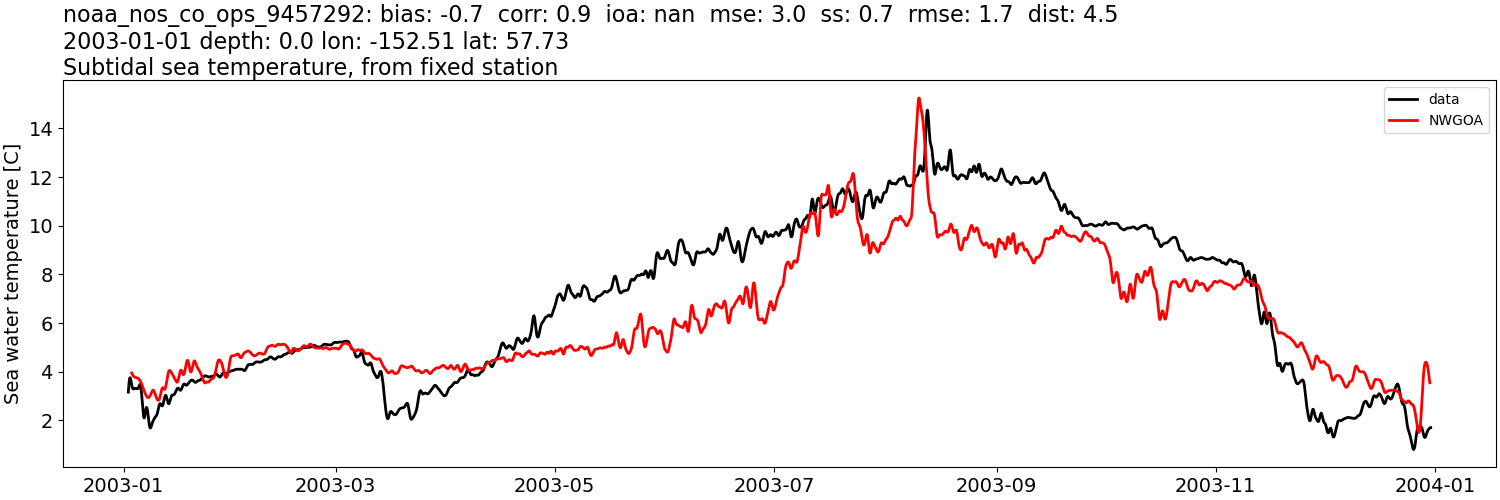
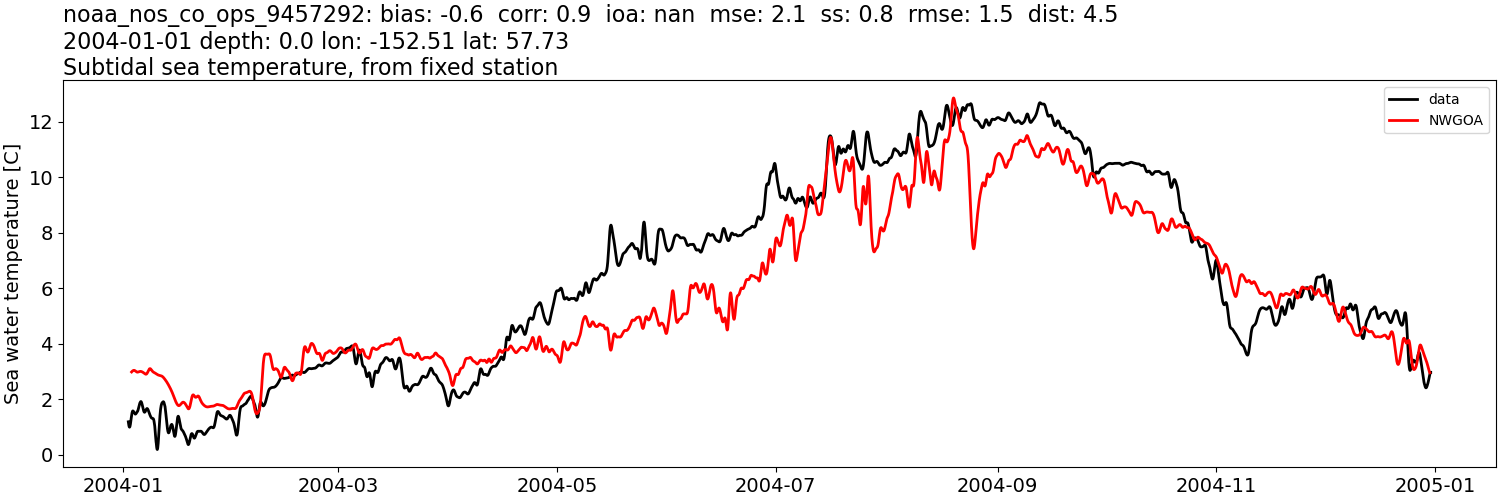
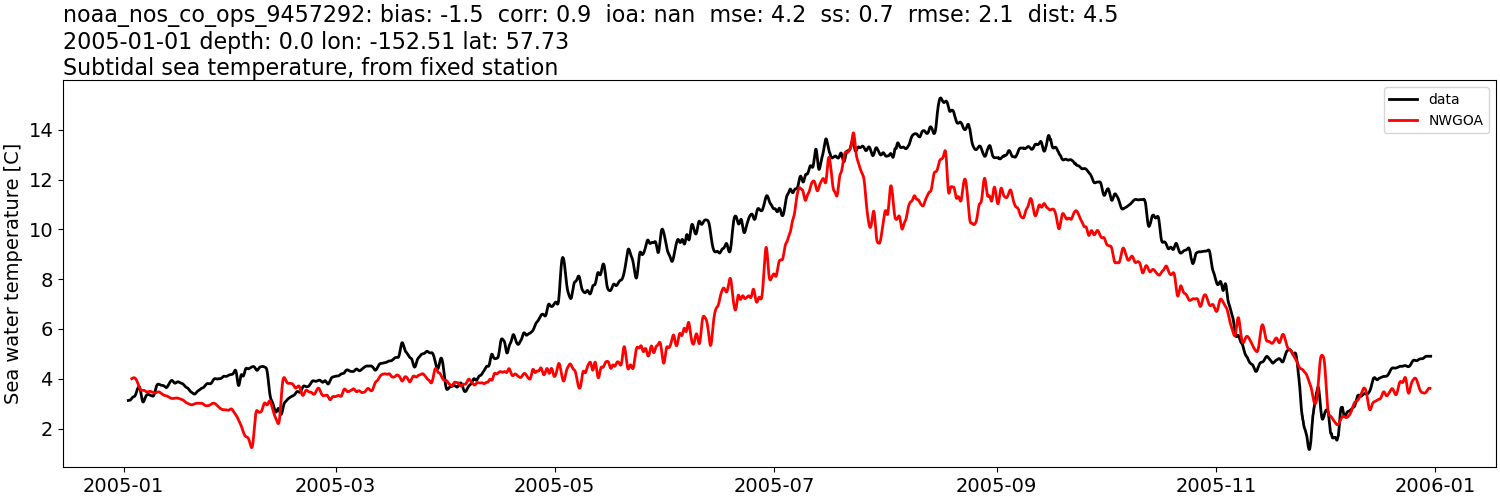
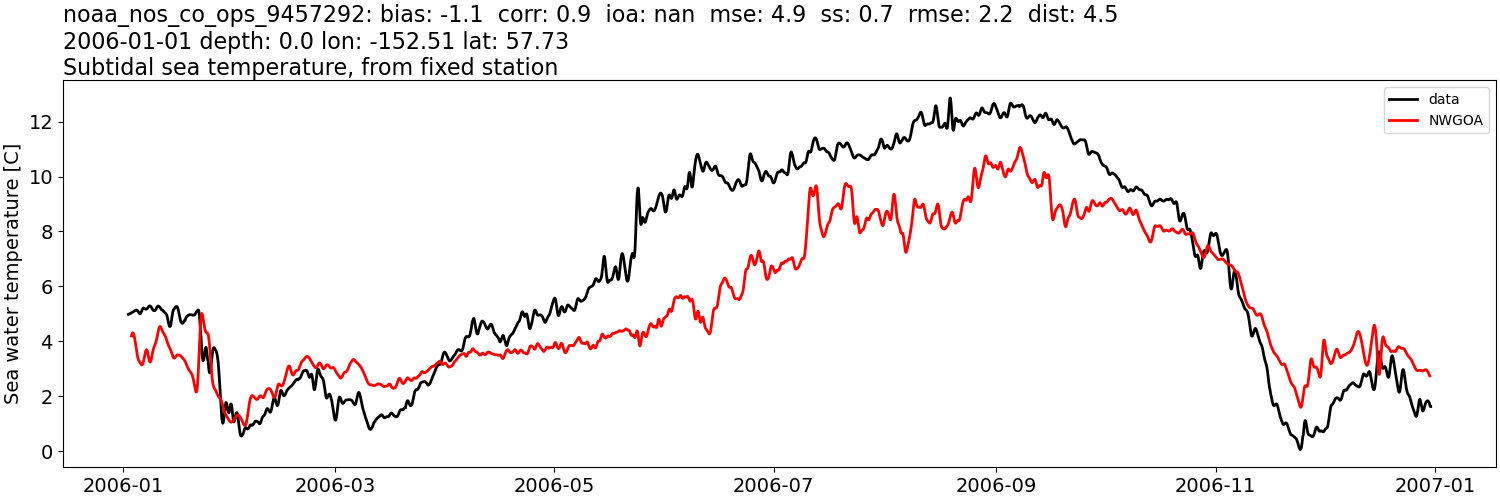
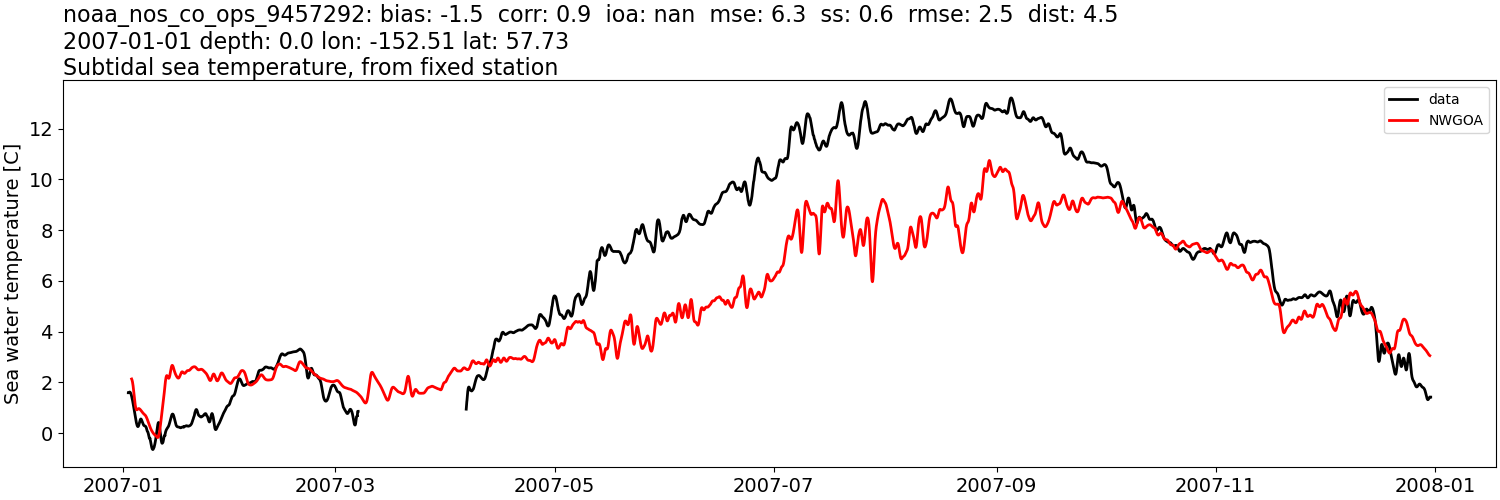
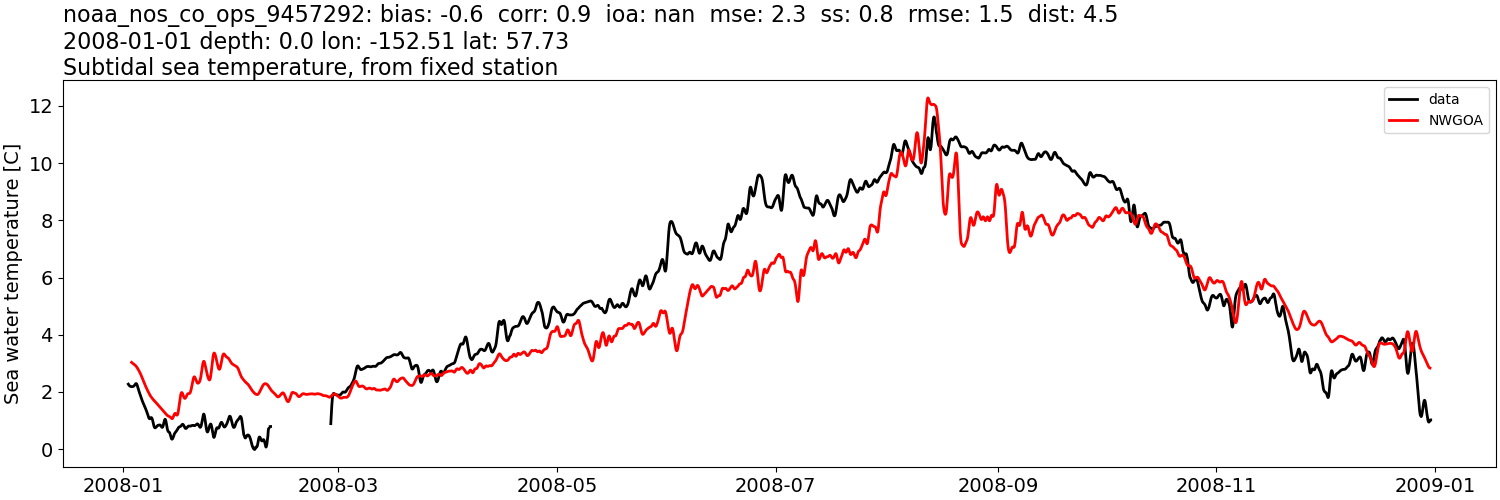
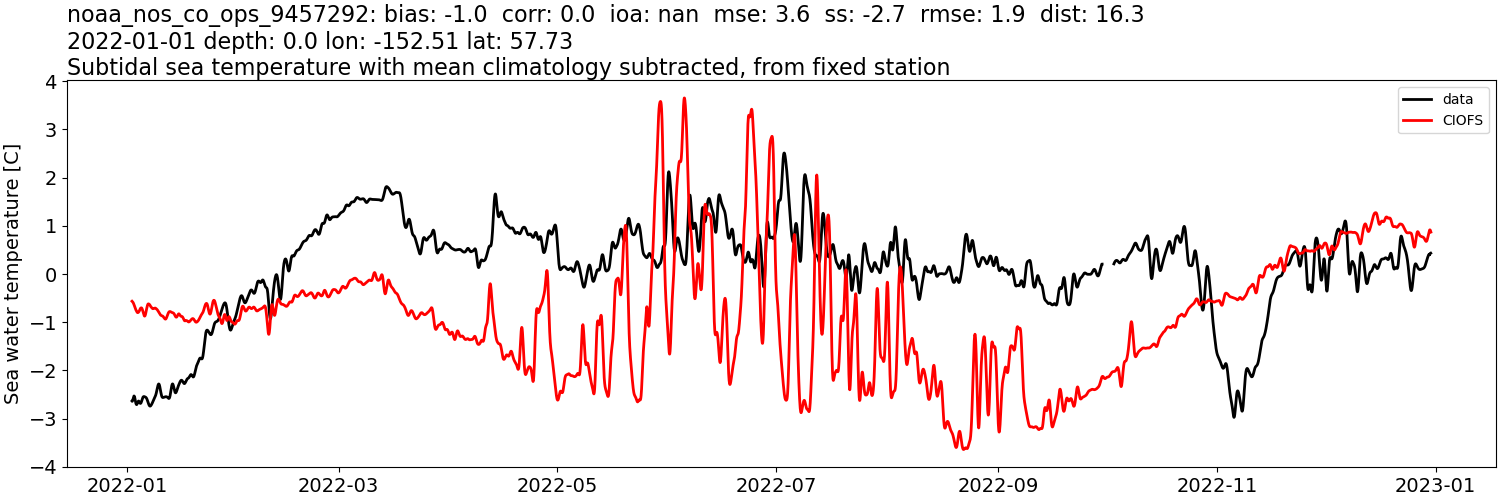
noaa_nos_co_ops_9457292#
Sea surface height: mean subtracted#
CIOFS#
Comparison plots by year
1999
2000
2001
2002
2003
2004
2005
2006
2007
2008

2009
2010
2011
2012
2013

2014
2015
2016
2017
2018
2019
2020
2021
2022

NWGOA#
Comparison plots by year
1999
2000
2001
2002
2003
2004
2005
2006
2007
2008
Sea surface height: mean subtracted, then tidally-filtered#
CIOFS#
Comparison plots by year
1999

2000

2001
2002

2003

2004

2005

2006

2007

2008

2009

2010

2011

2012

2013

2014

2015

2016

2017

2018

2019

2020

2021

2022

NWGOA#
Comparison plots by year
1999

2000

2001

2002

2003

2004

2005

2006

2007

2008

Sea water temperature:#
CIOFS#
Comparison plots by year
1999
2000
2001
2002
2003
2004
2005
2006
2007
2008
2009
2010
2011
2012
2013
2014
2015
2016
2017
2018
2019
2020
2021
2022
NWGOA#
Comparison plots by year
1999
2000
2001
2002
2003
2004
2005
2006
2007
2008
Sea water temperature: tidally-filtered#
CIOFS#
Comparison plots by year
1999
2000
2001
2002

2003
2004
2005
2006
2007
2008
2009
2010
2011
2012
2013
2014
2015

2016
2017
2018
2019
2020
2021
2022
NWGOA#
Comparison plots by year
1999
2000
2001
2002
2003
2004
2005
2006
2007
2008
Sea water temperature: tidally-filtered, then monthly mean from data subtracted#
CIOFS#
Comparison plots by year
1999

2000

2001

2002

2003

2004

2005

2006

2007

2008

2009

2010

2011

2012

2013

2014

2015

2016

2017

2018

2019

2020

2021

2022
NWGOA#
Comparison plots by year
1999

2000

2001

2002

2003

2004

2005

2006

2007

2008

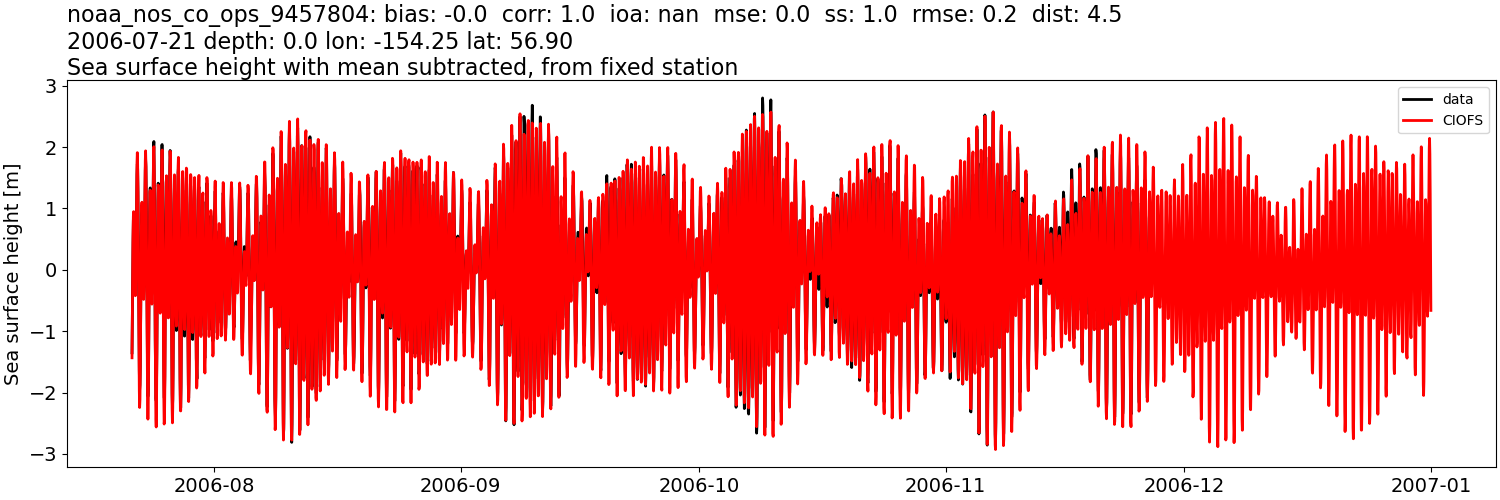
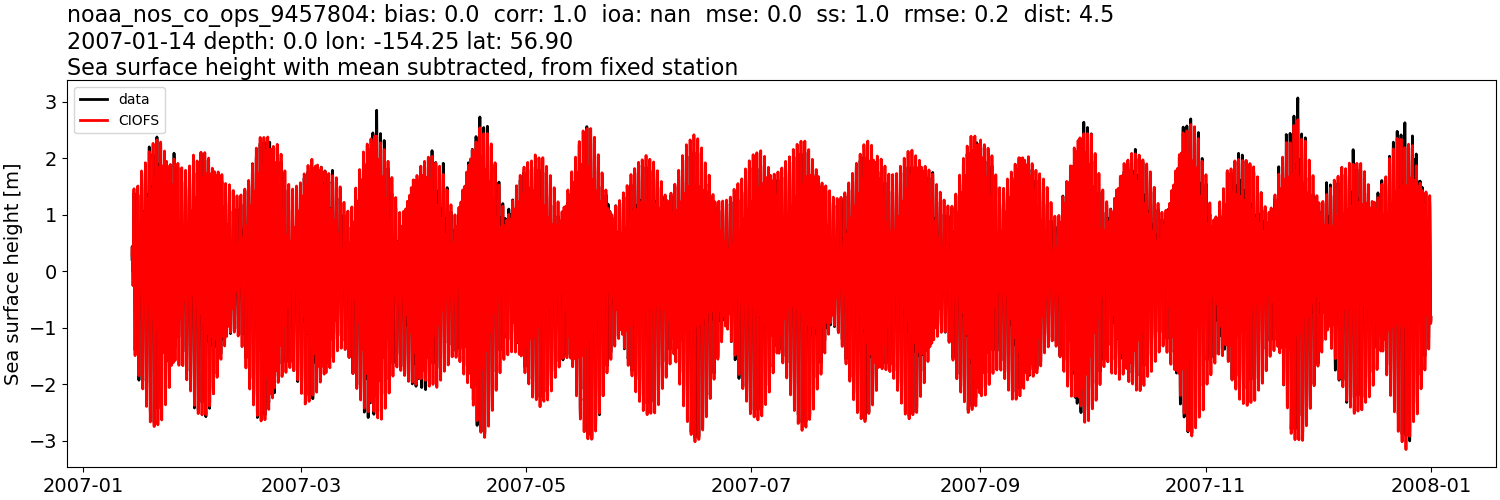
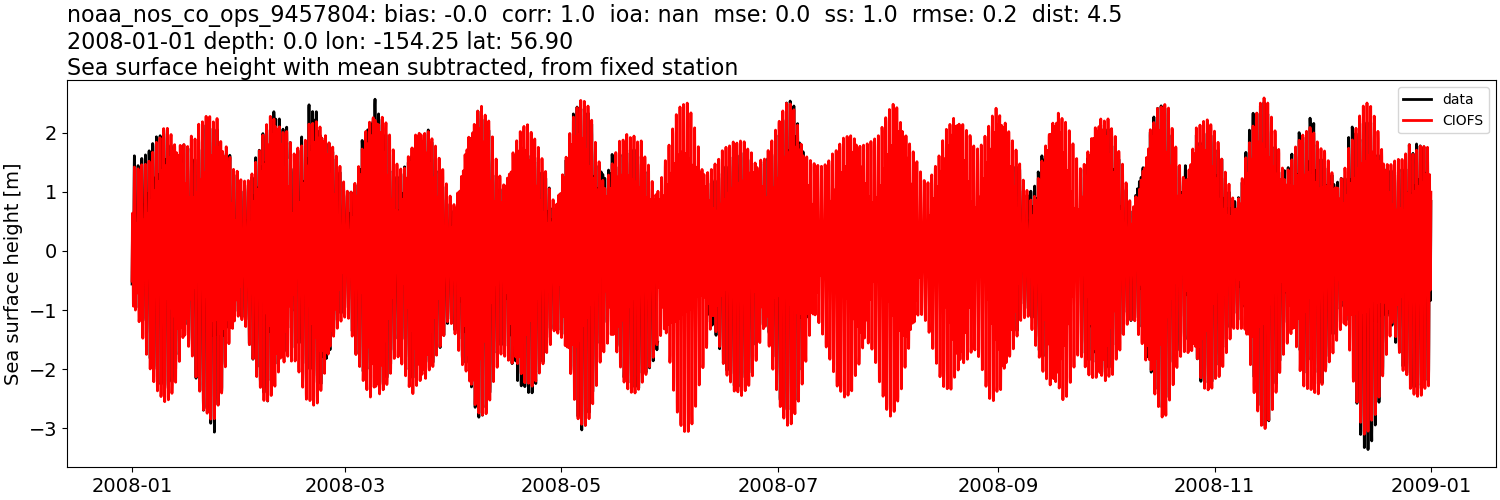
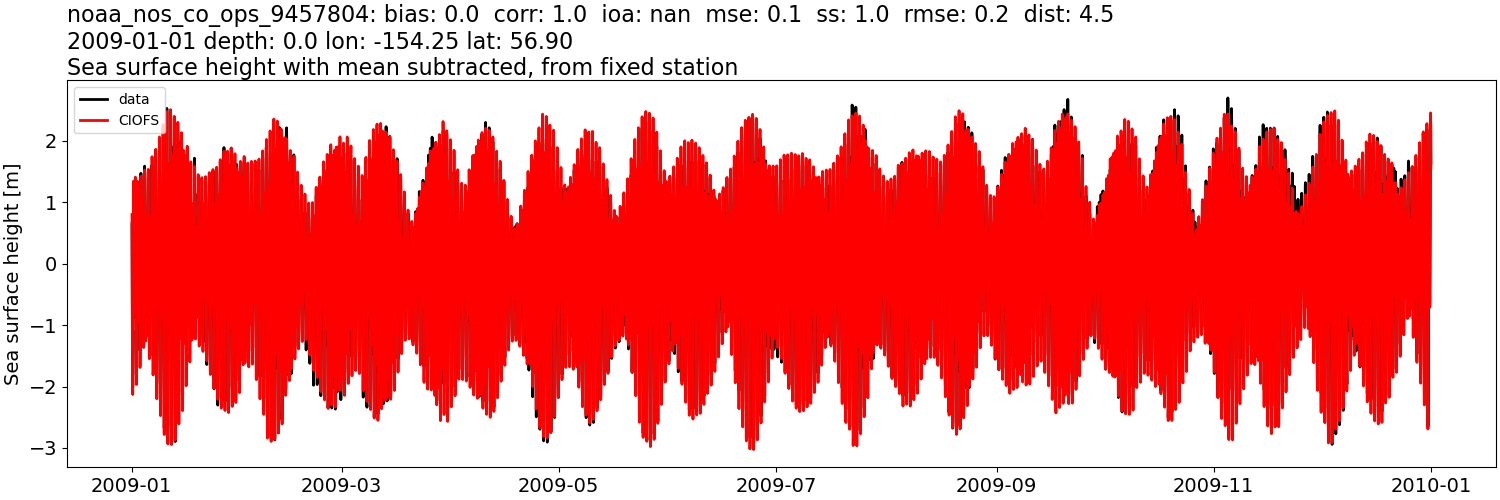
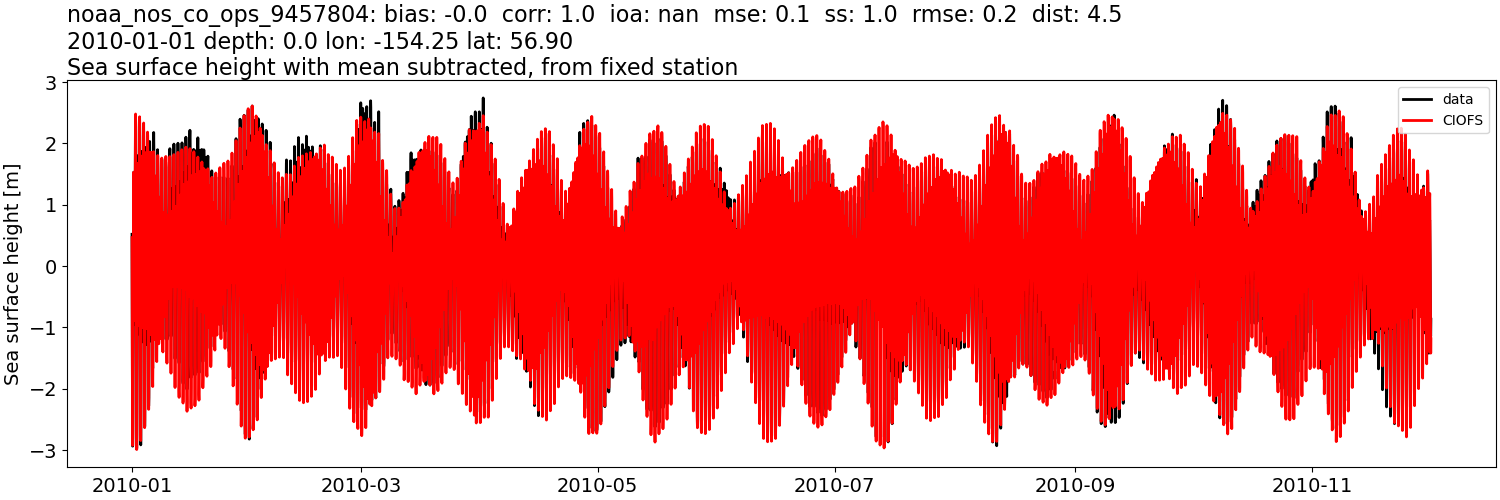
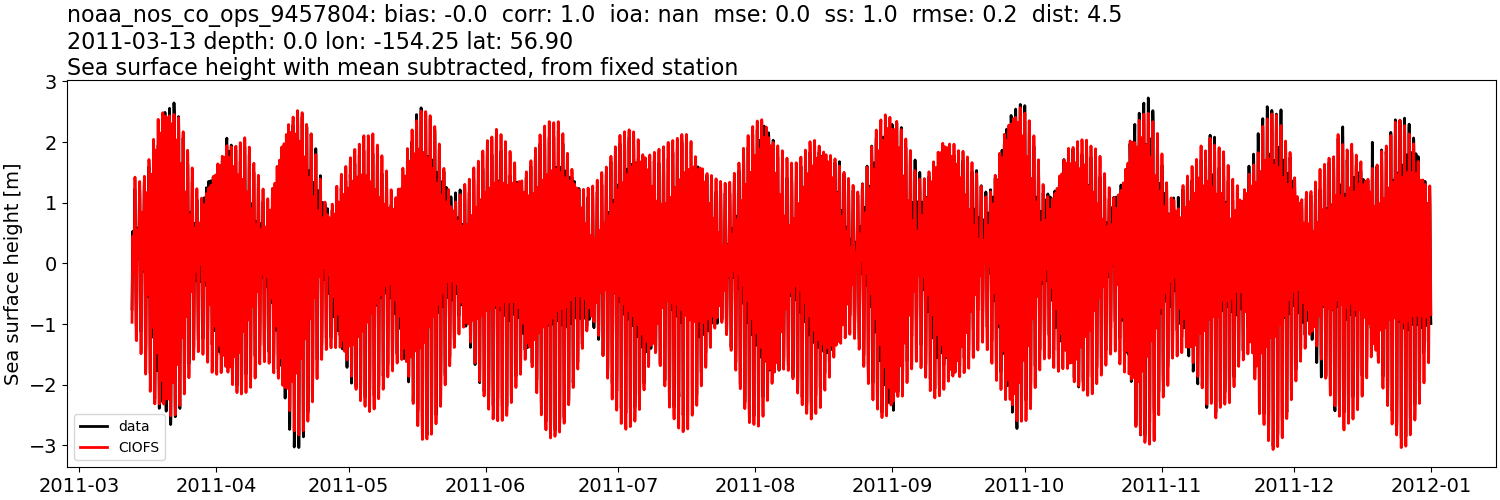
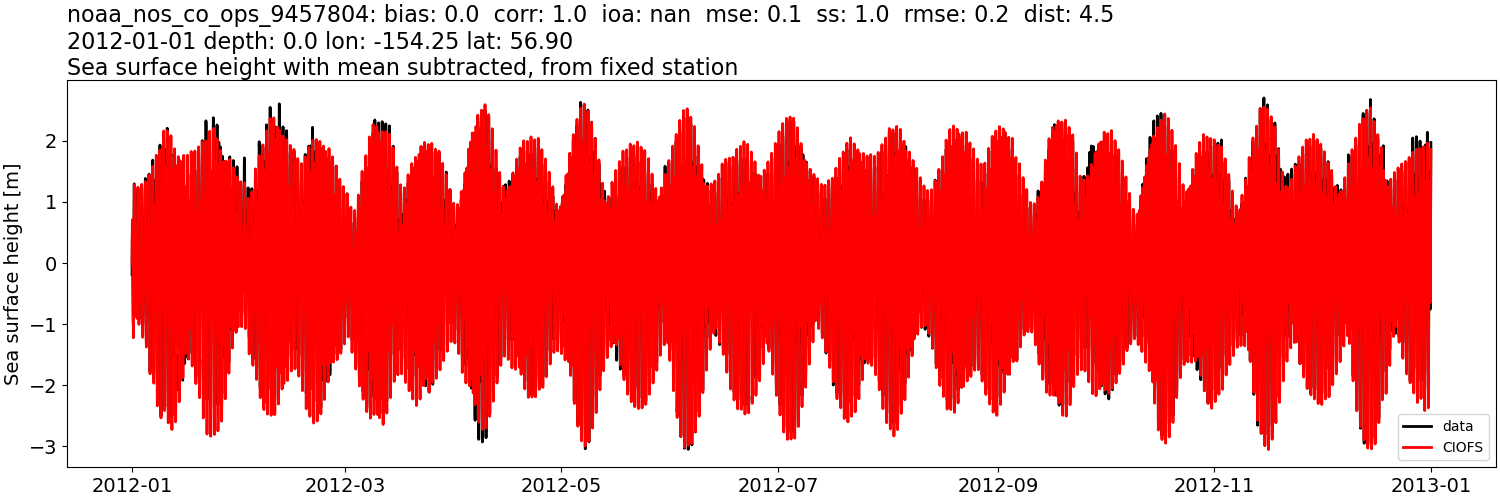
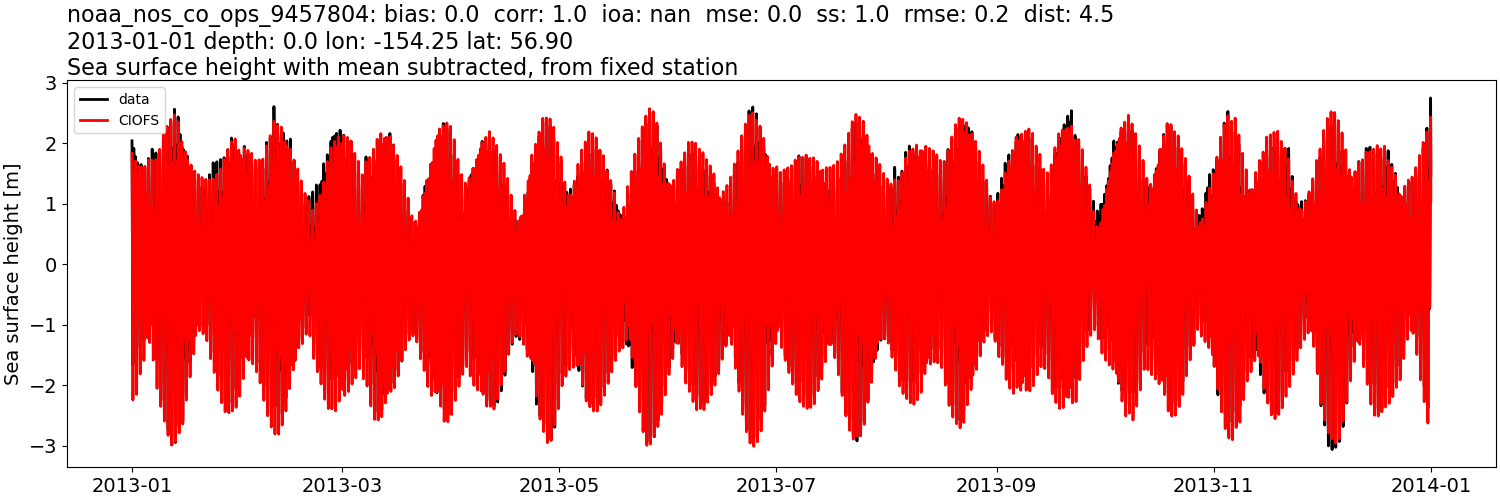
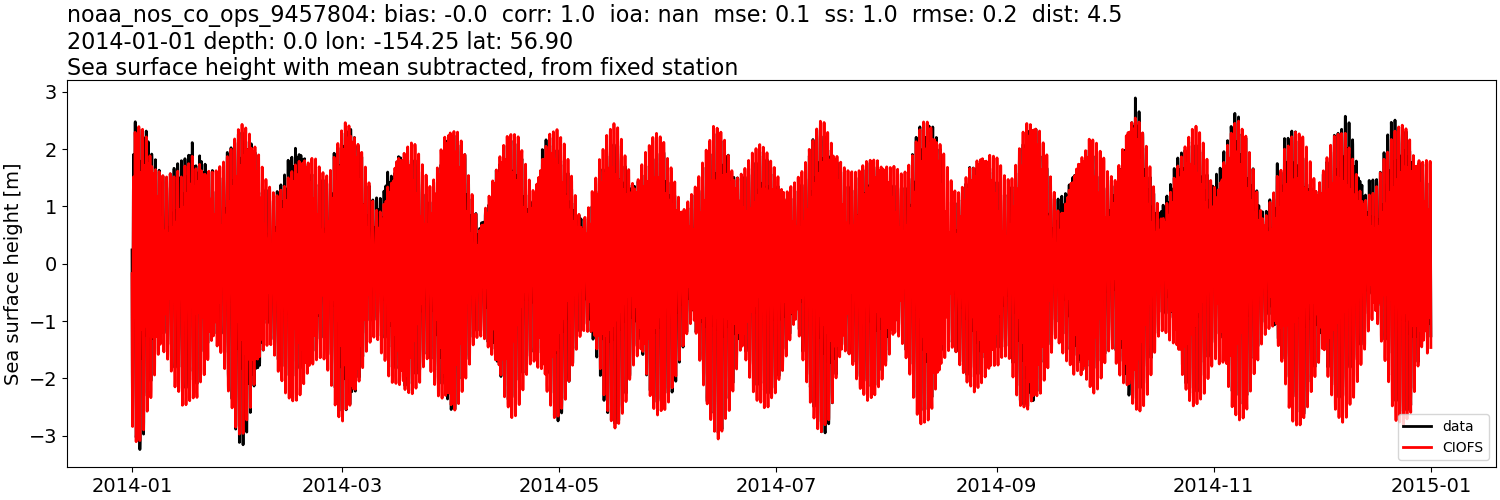
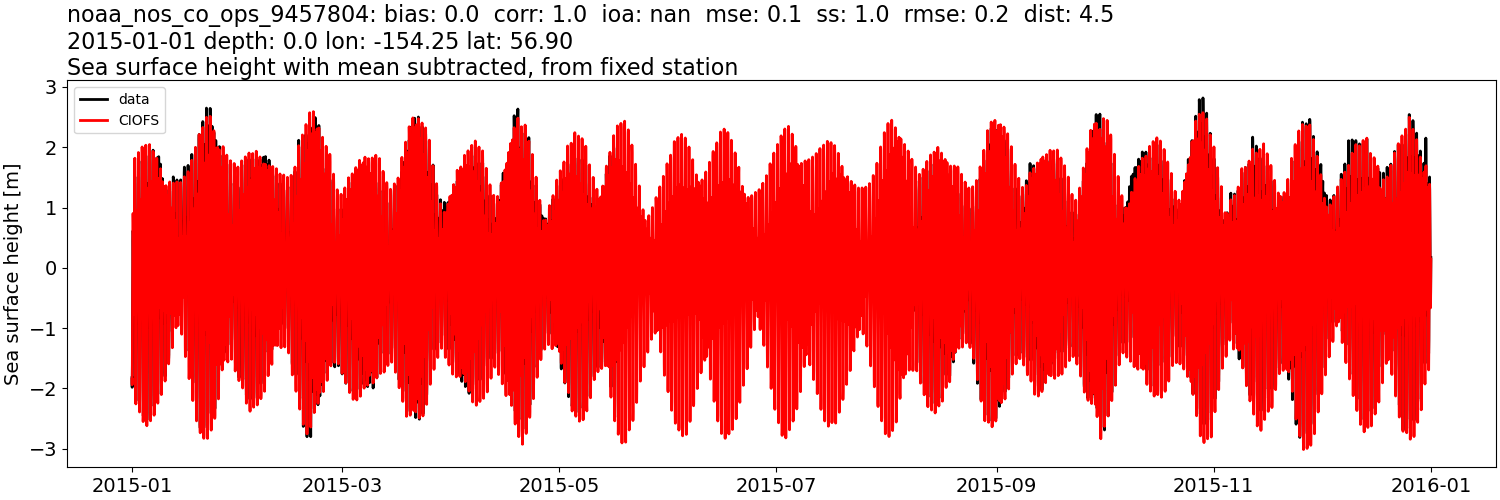
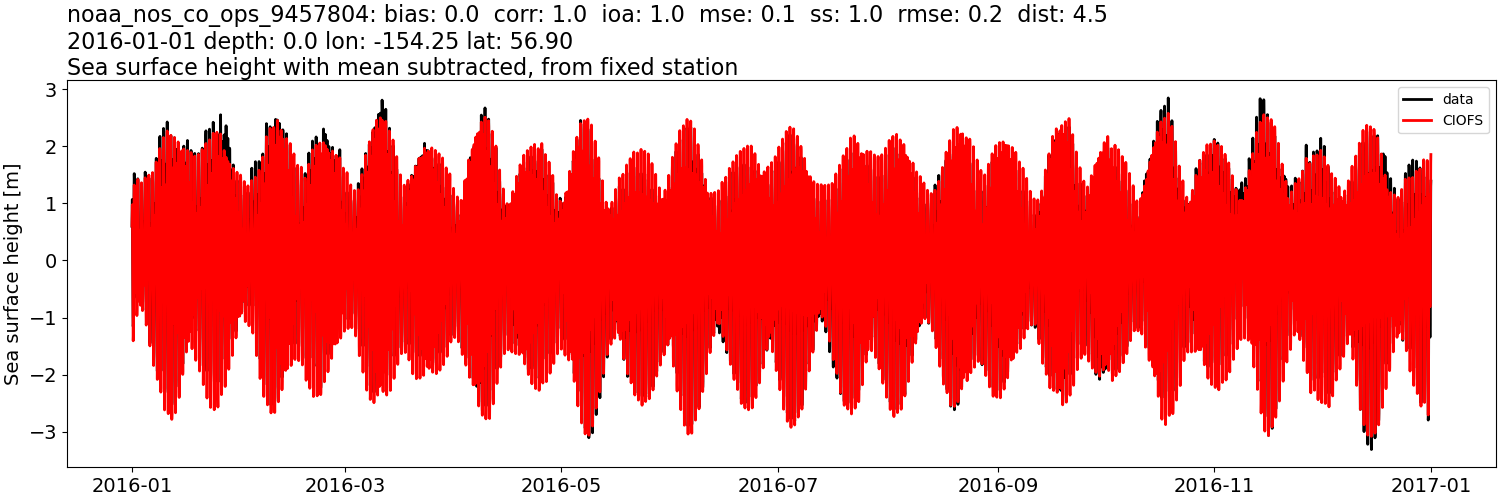
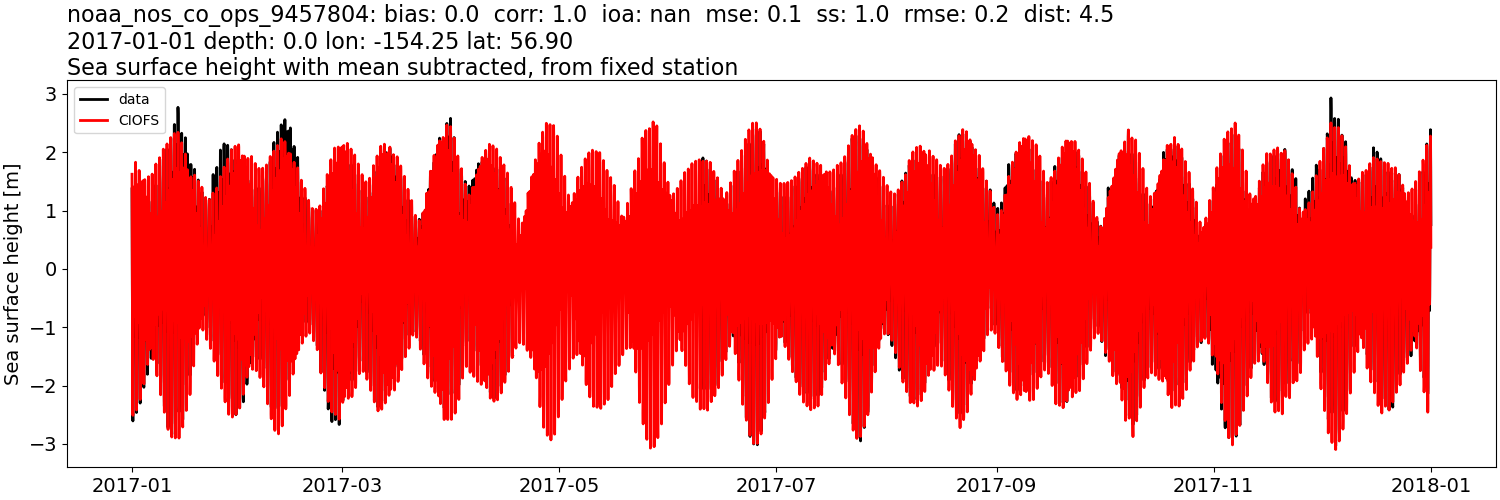
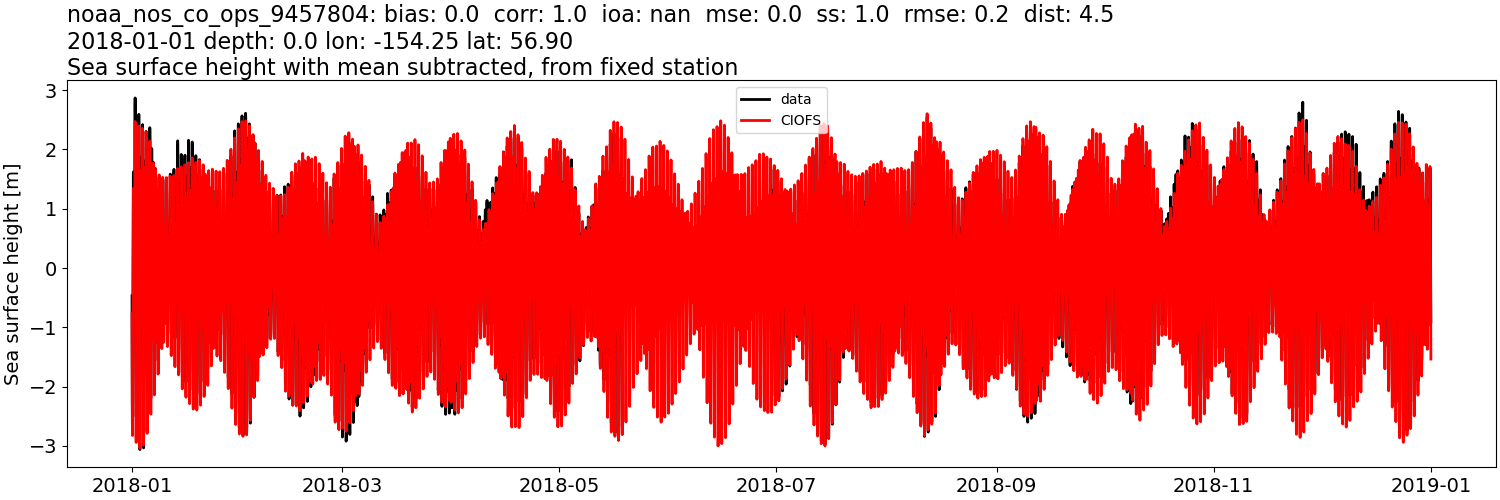
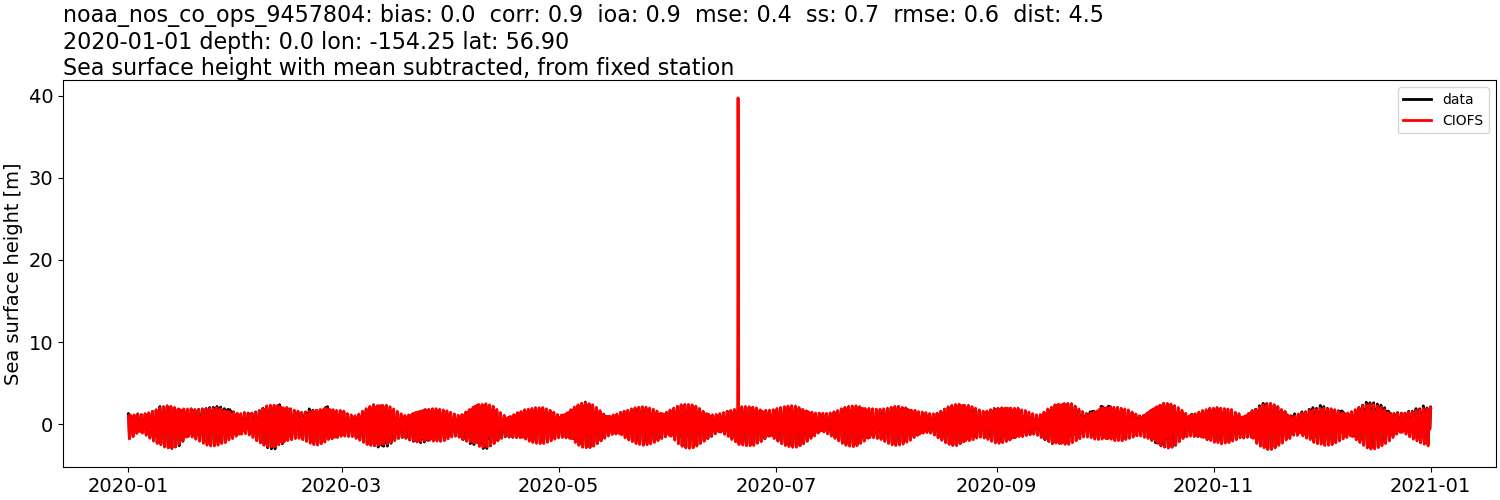
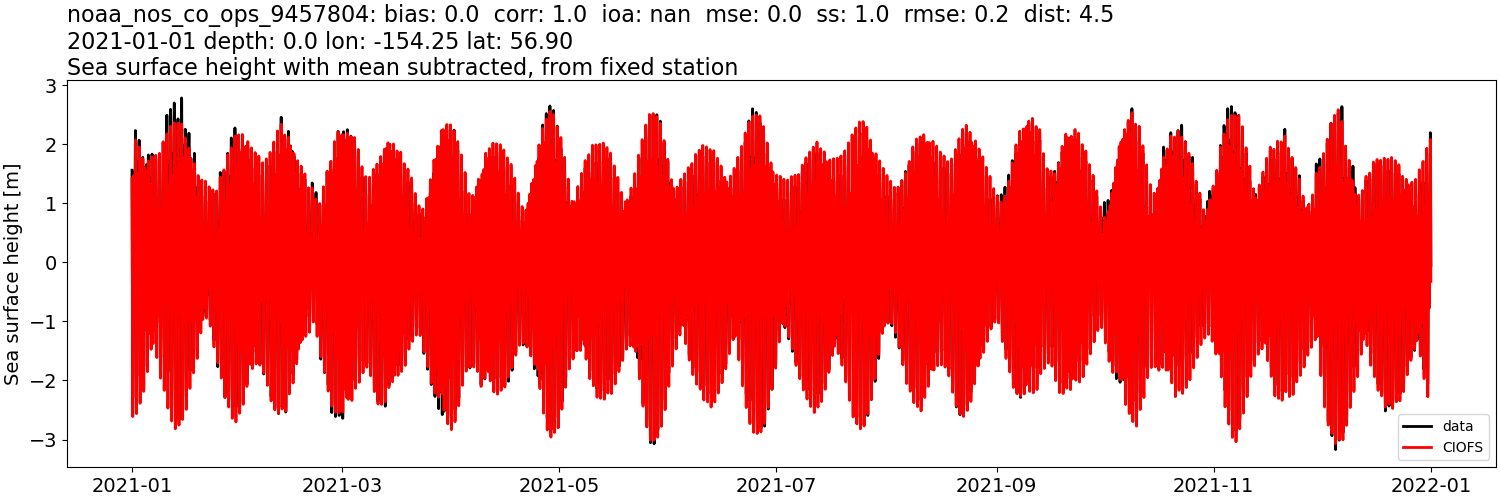
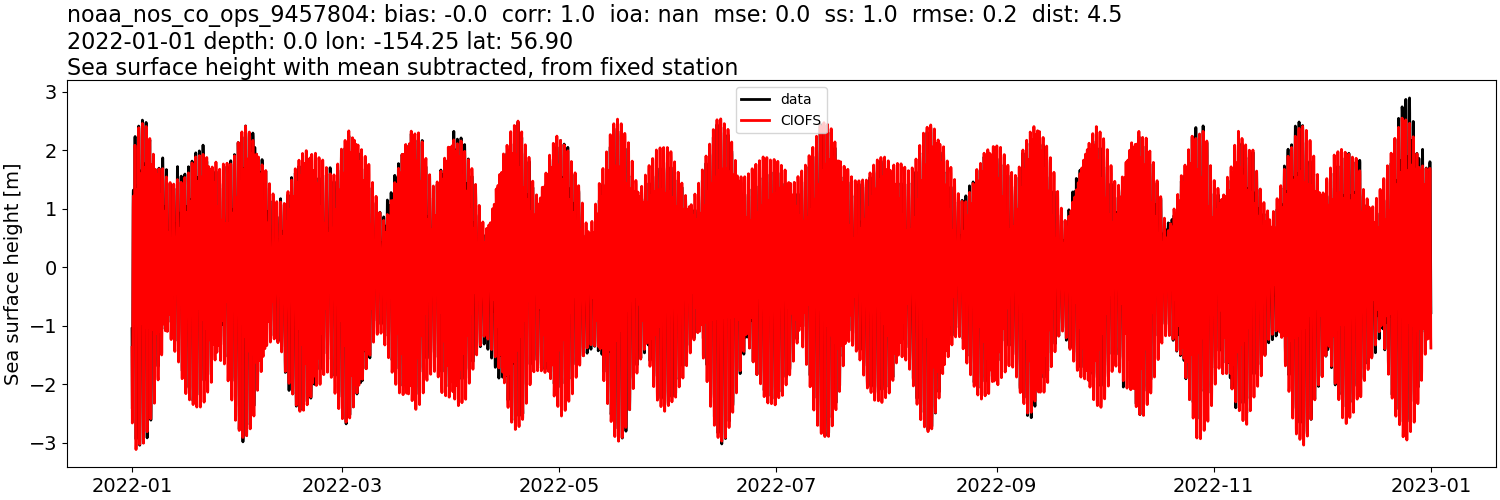
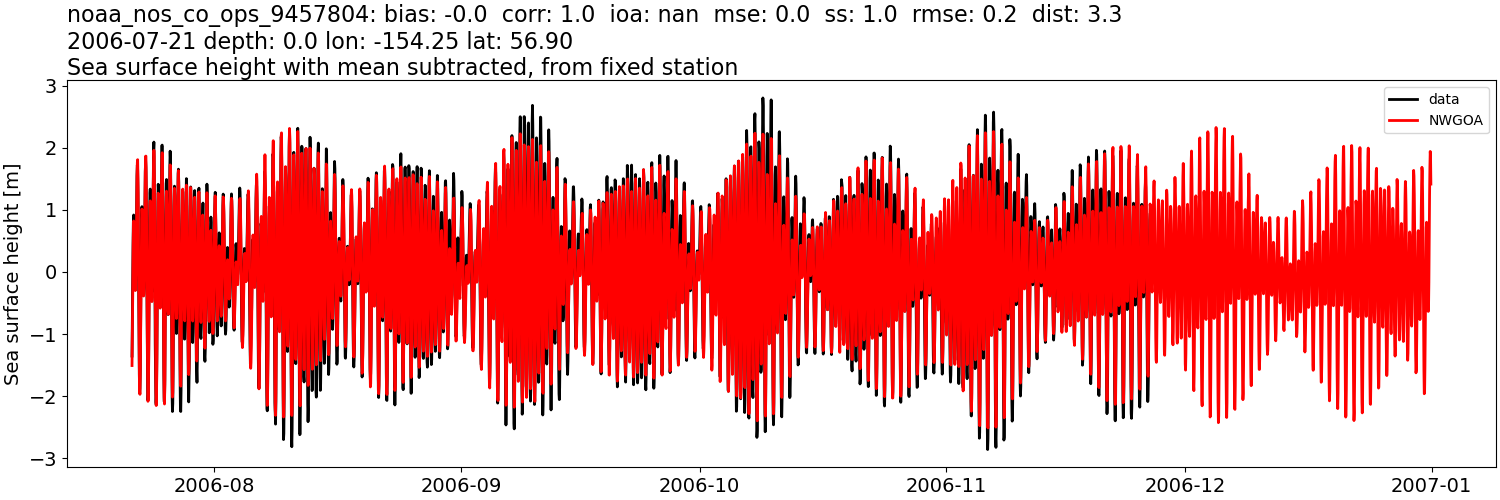
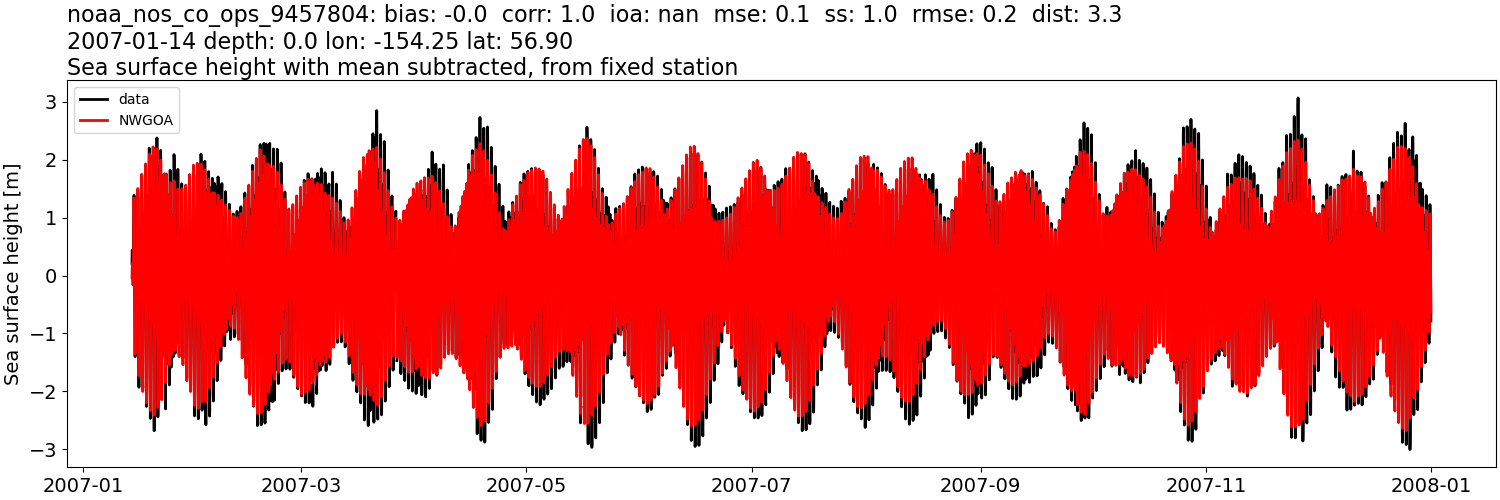
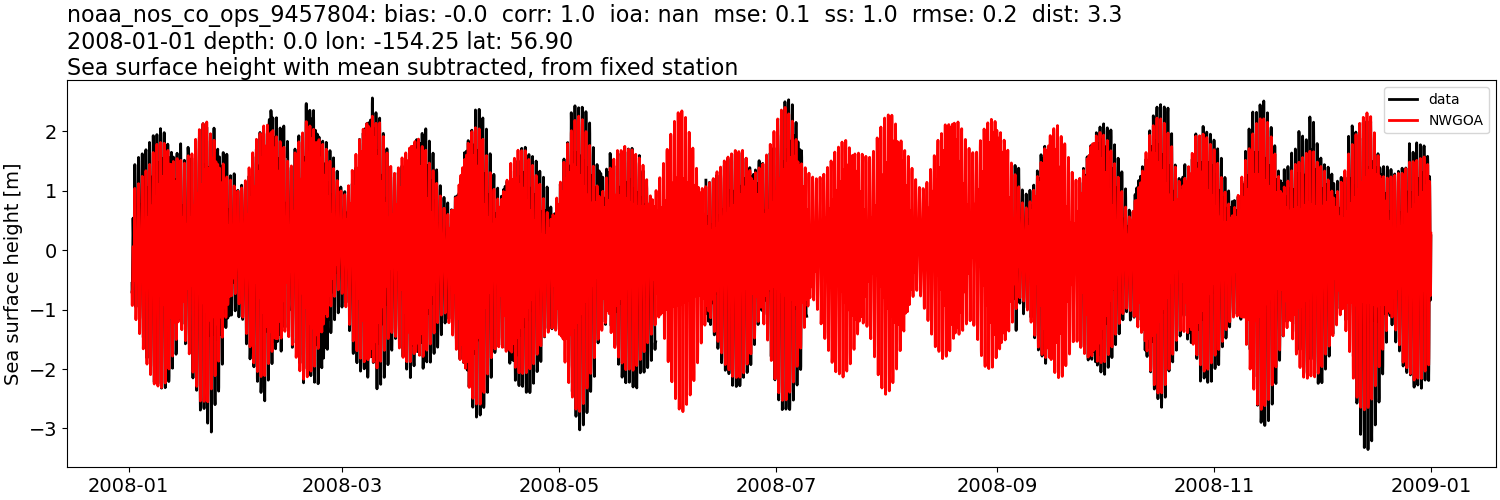
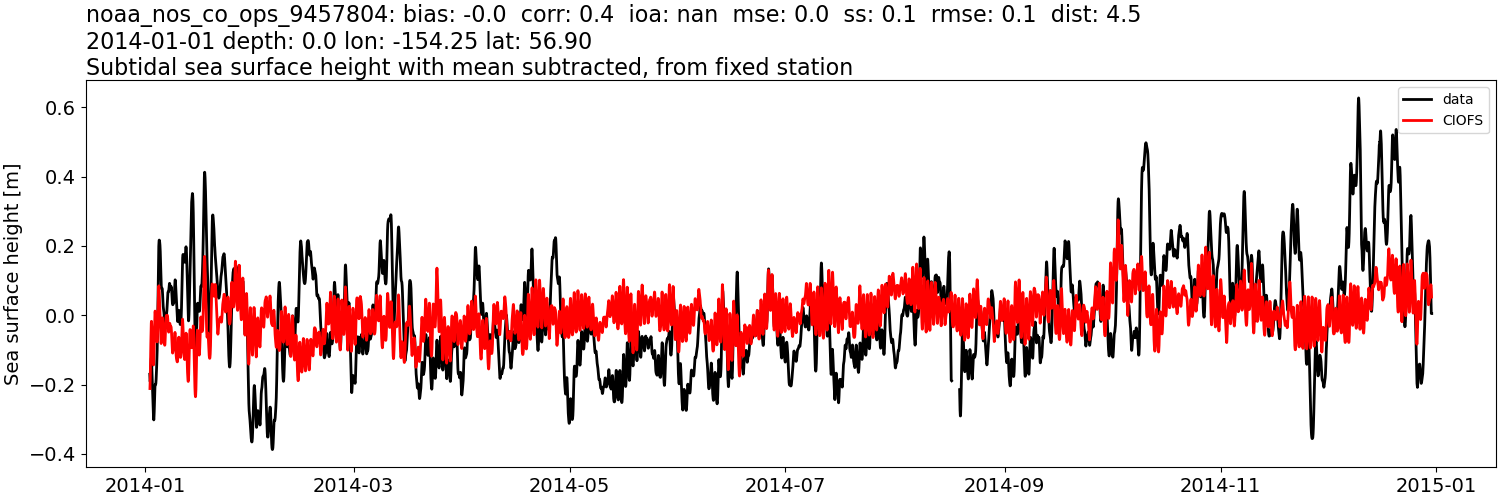
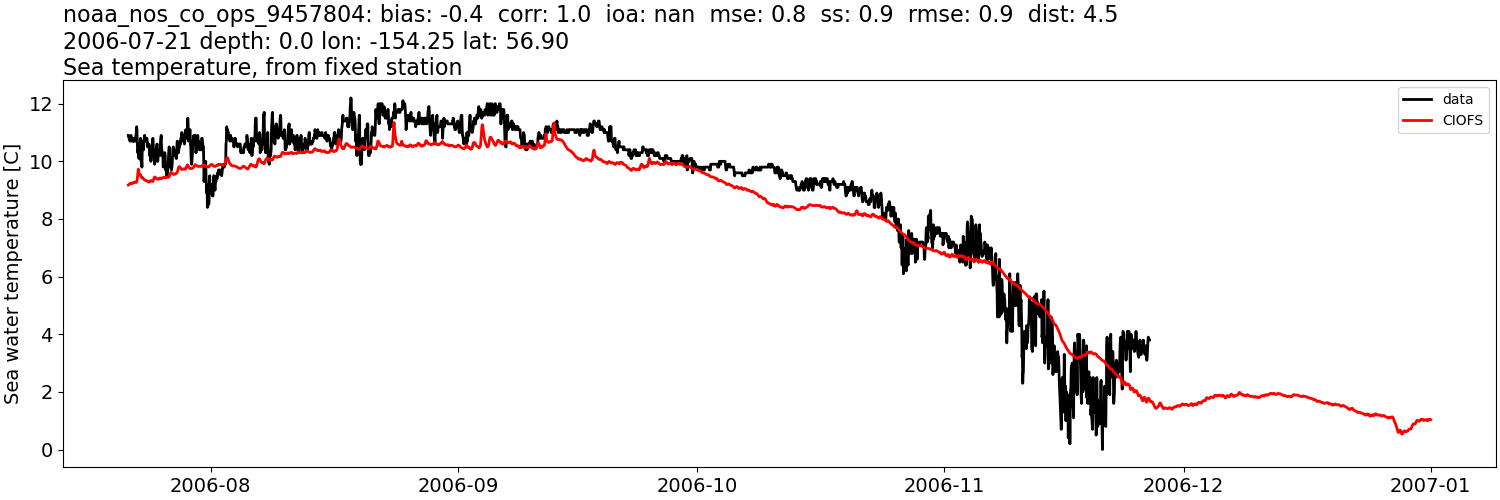
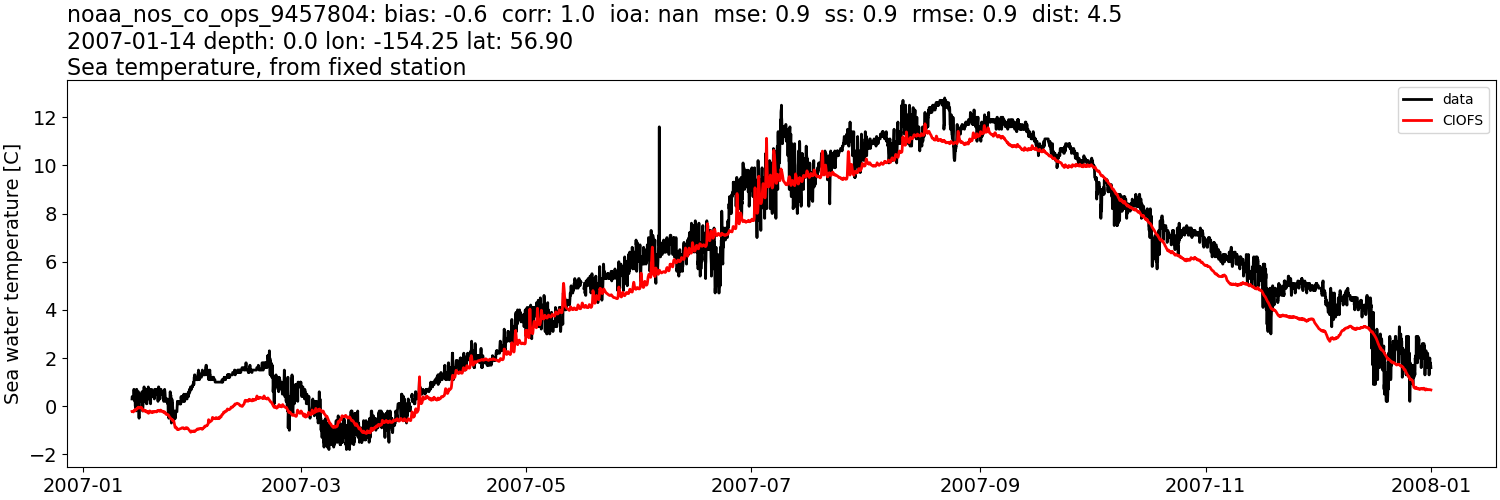
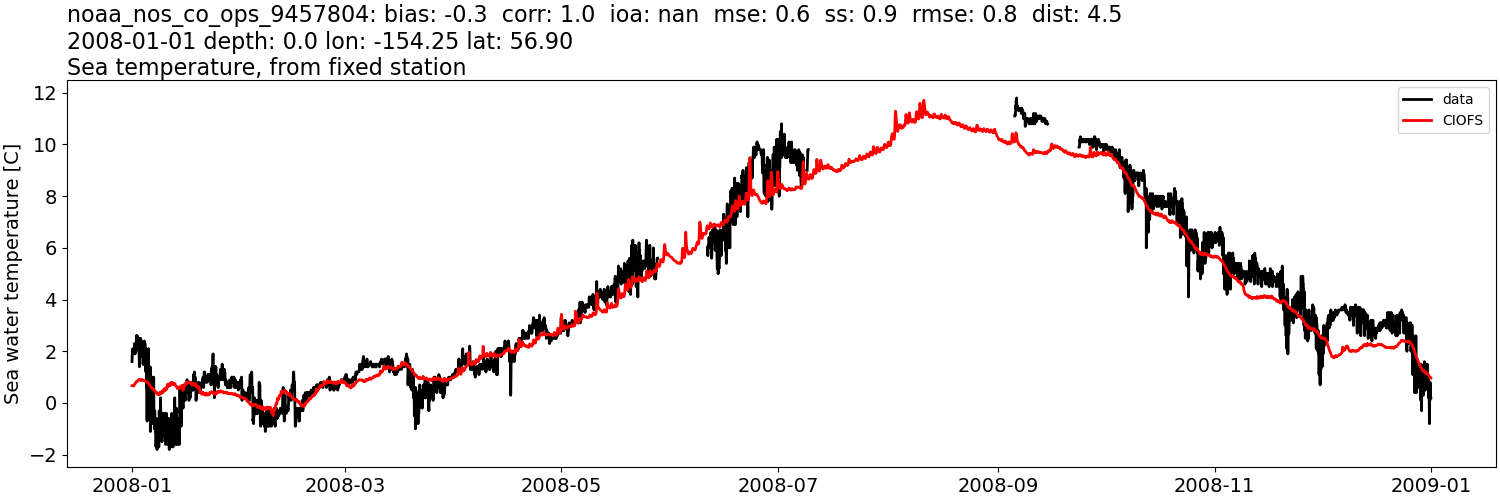
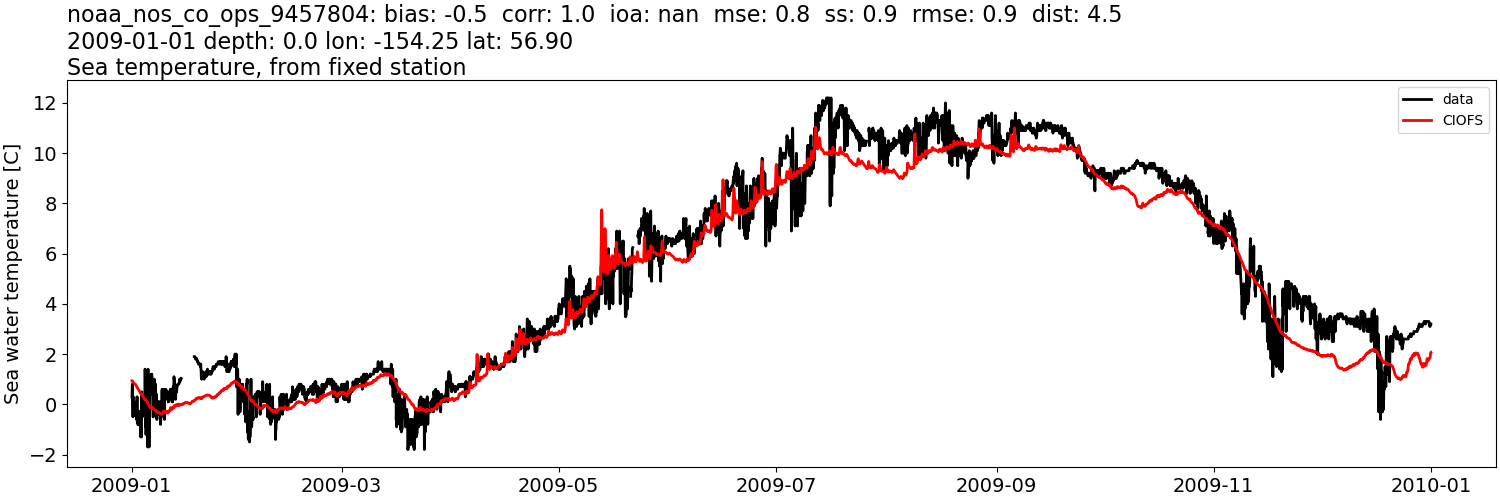
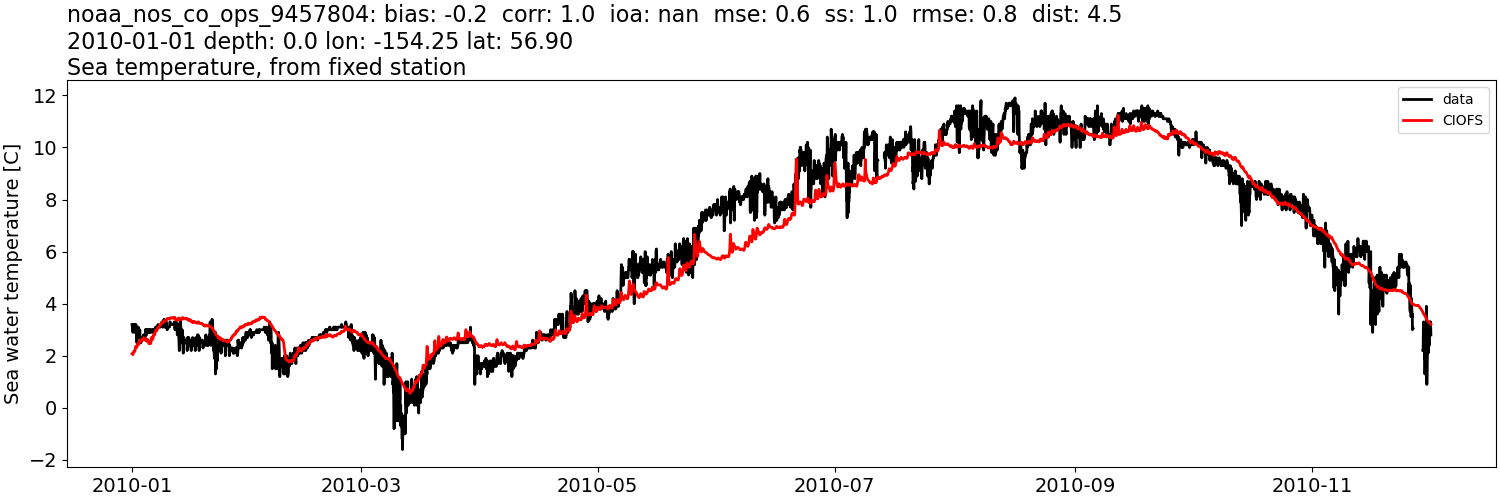
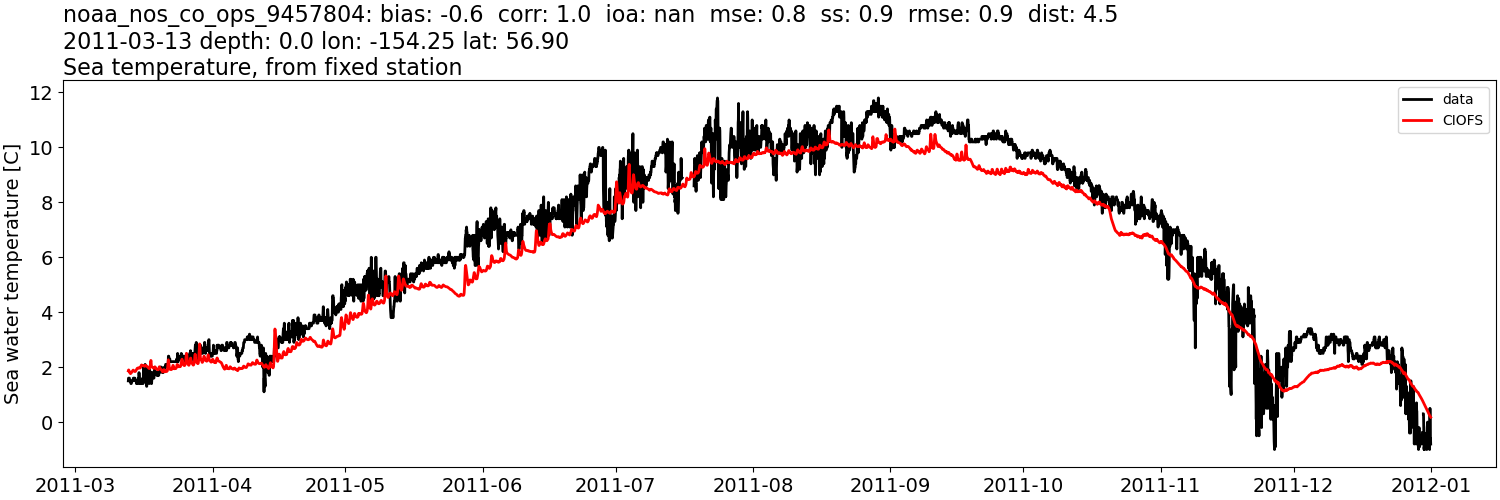
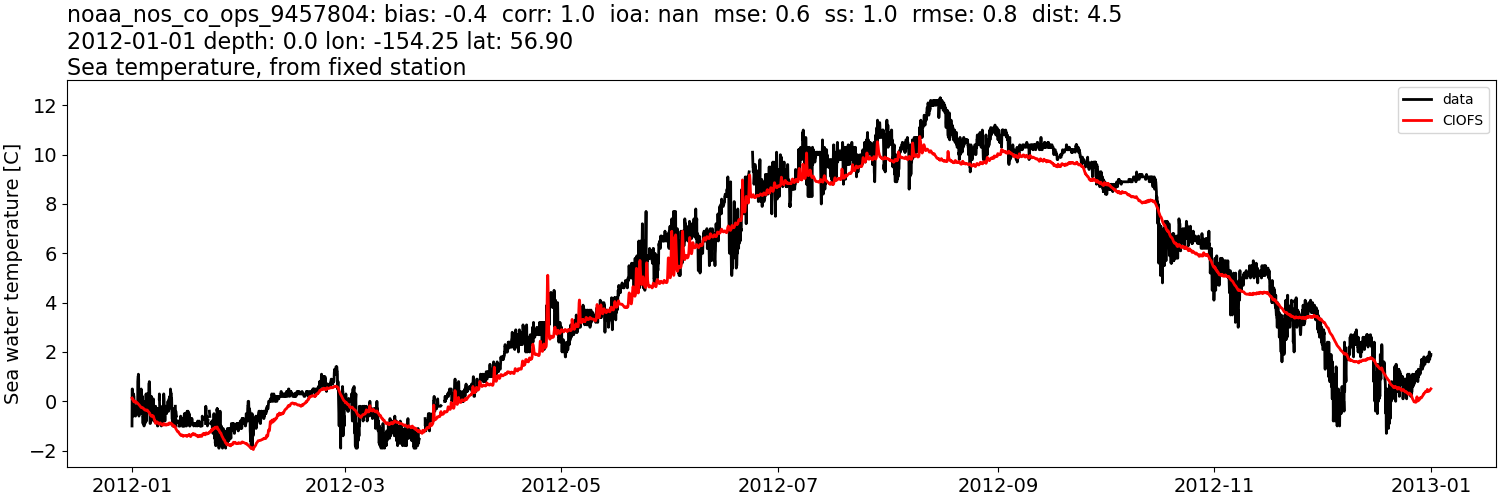
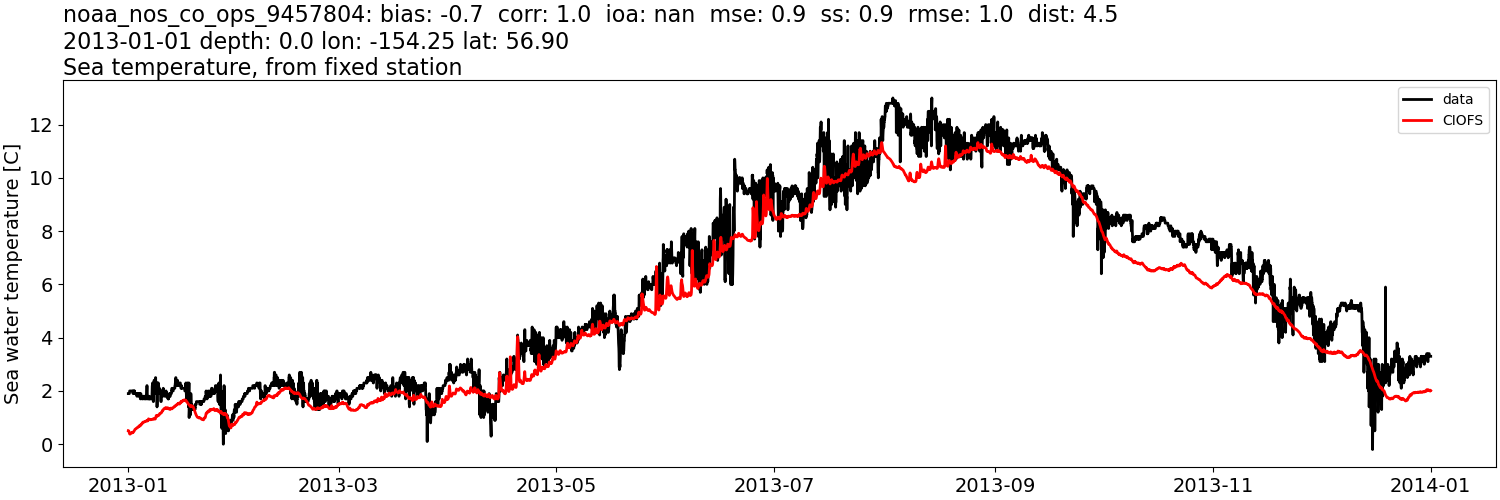
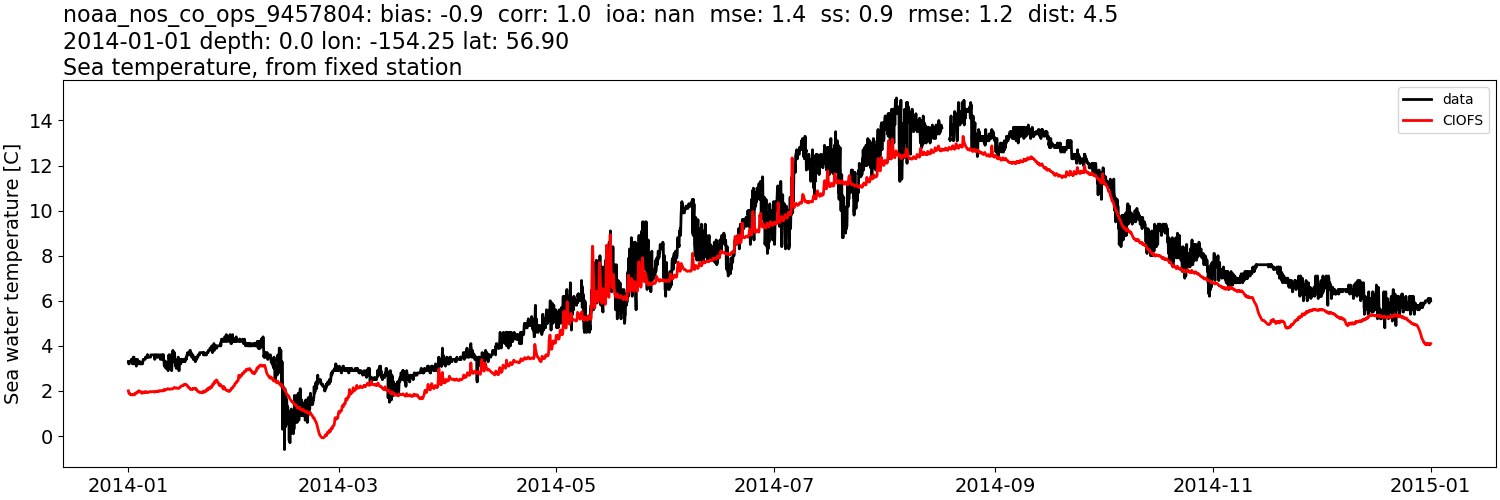
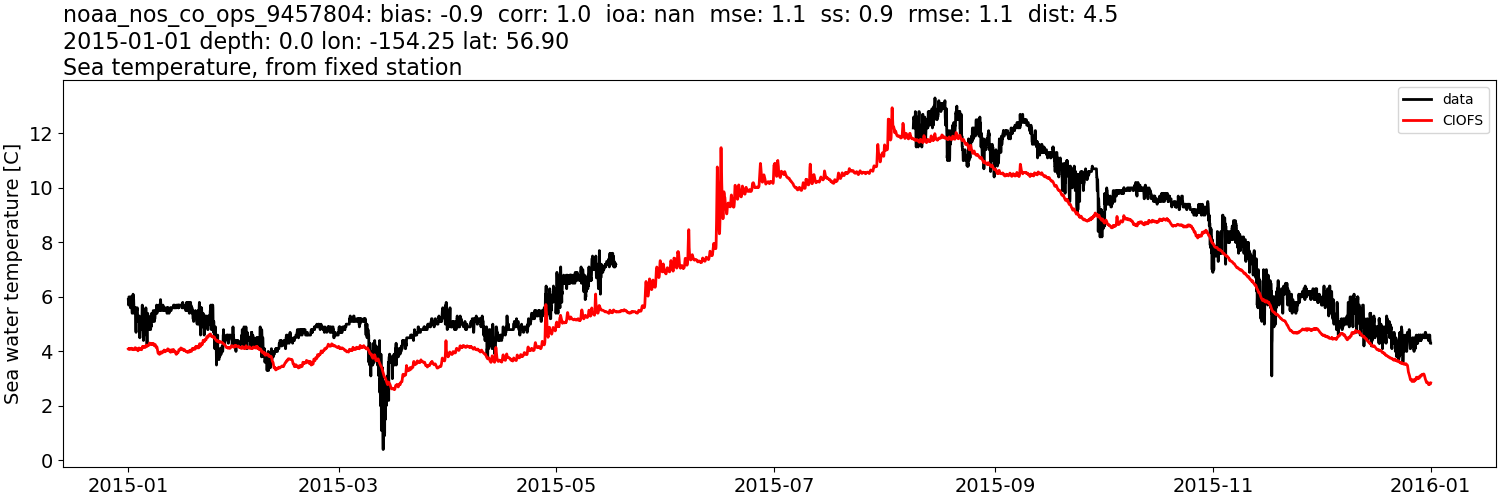
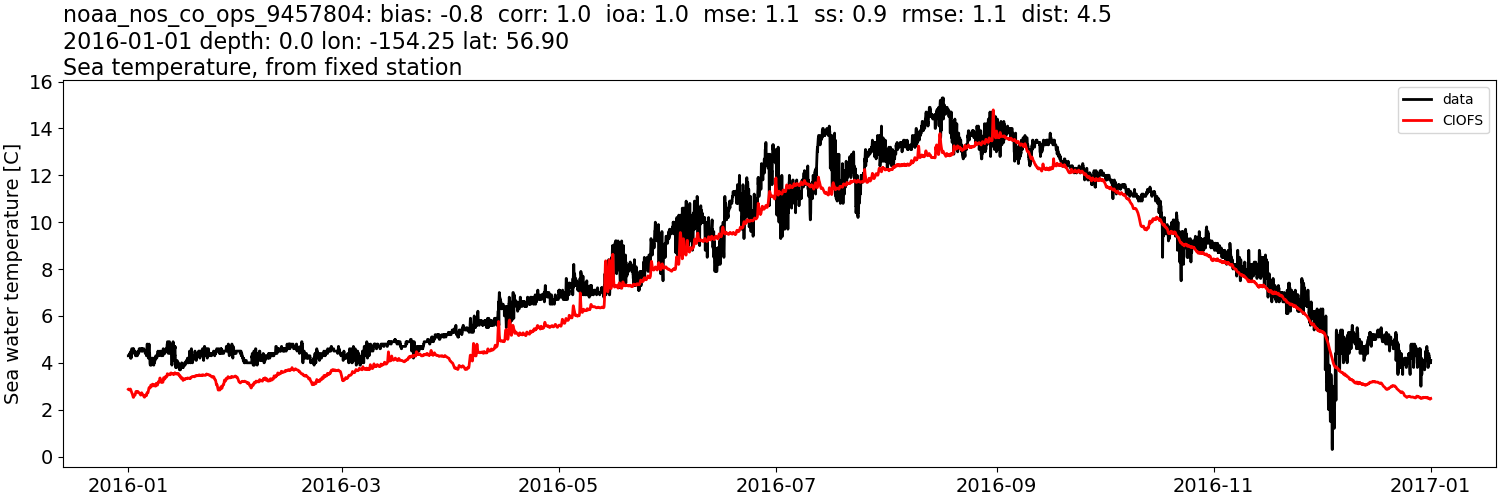
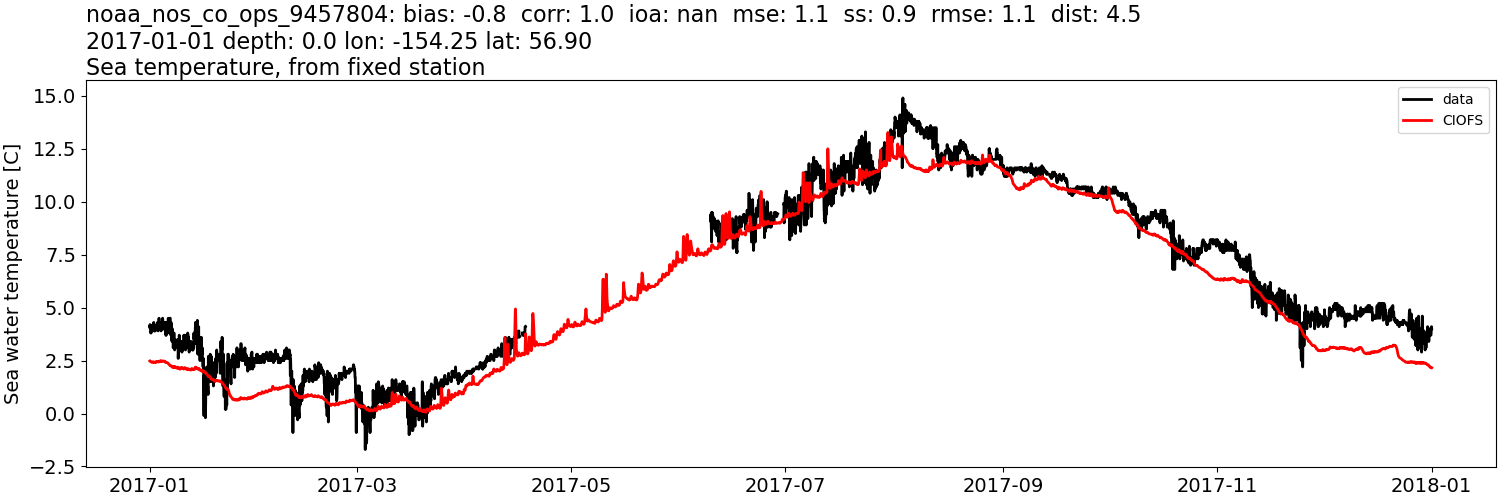
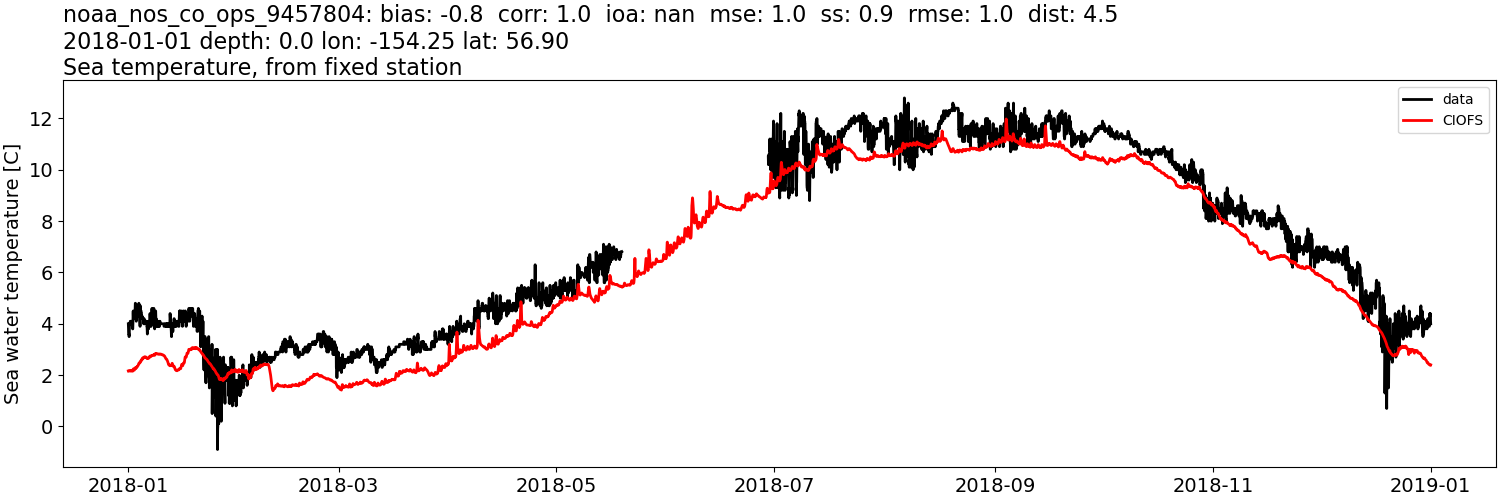
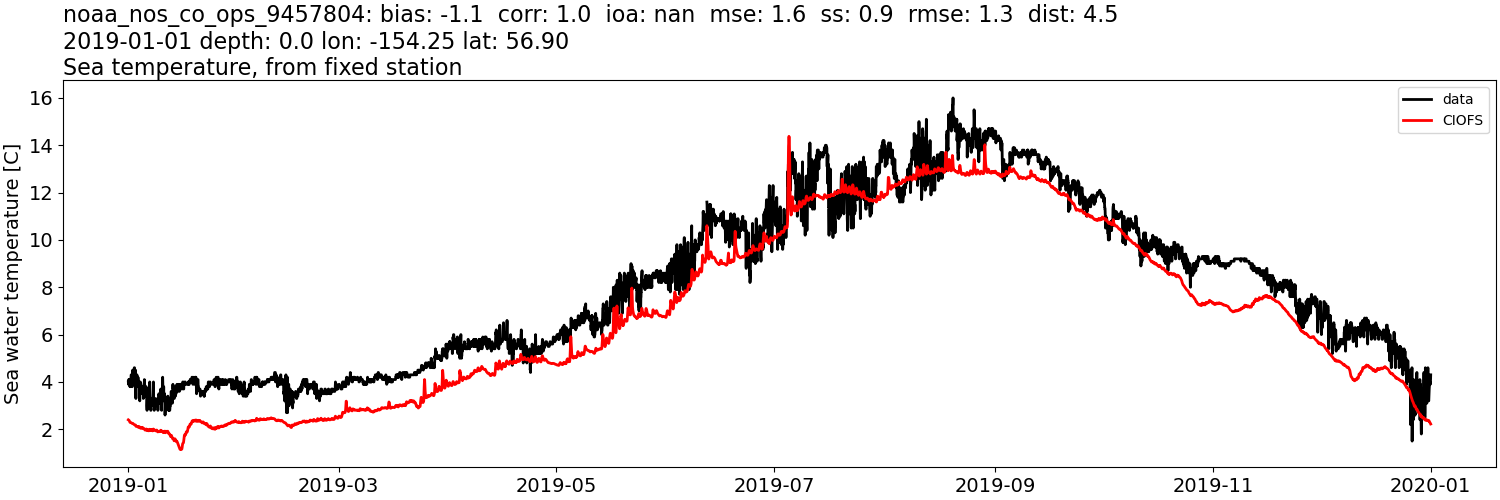
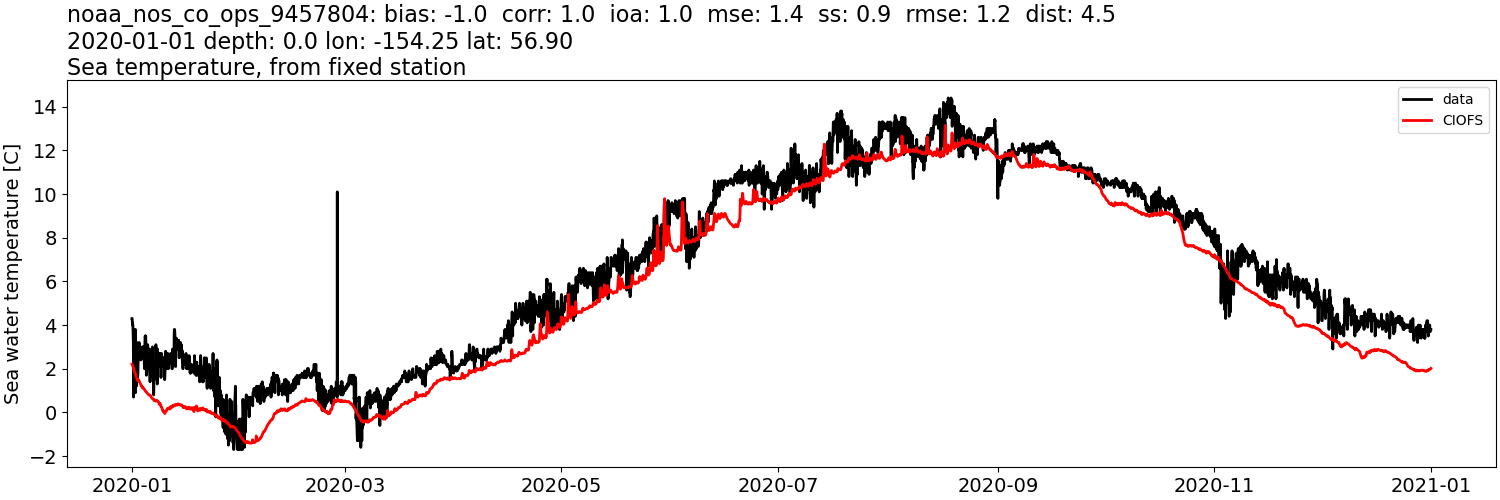
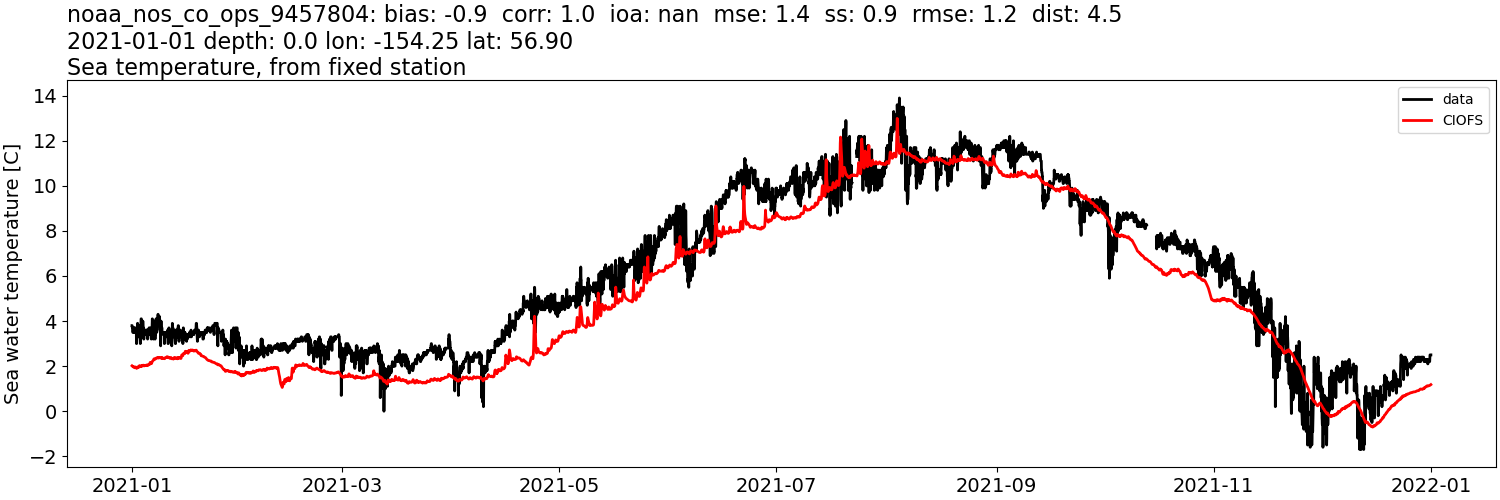
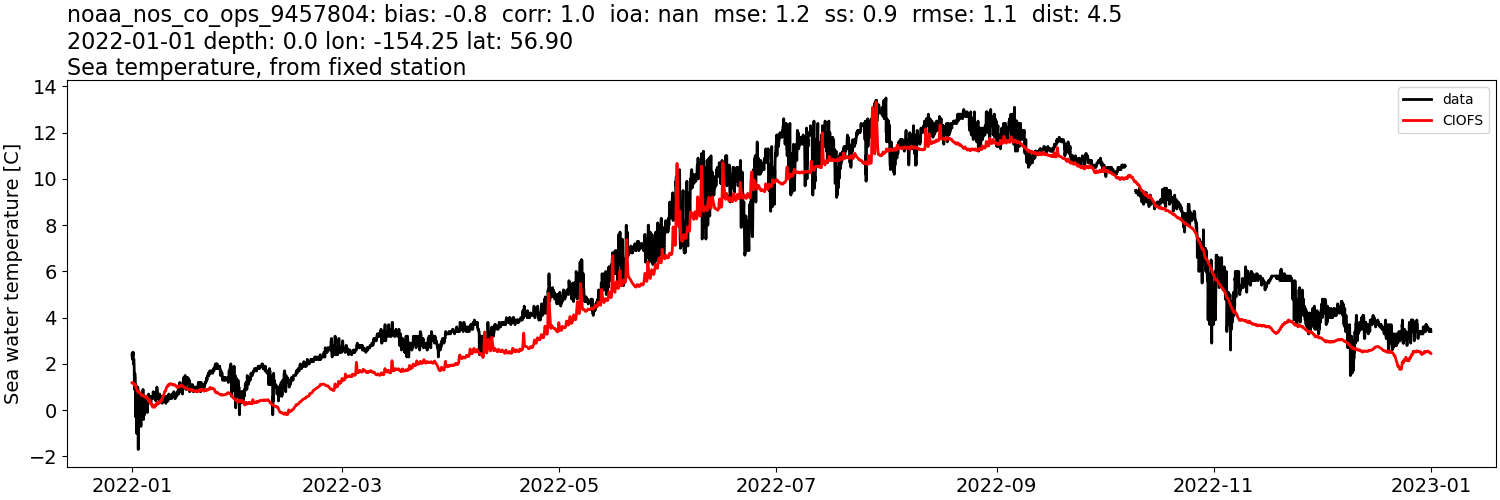
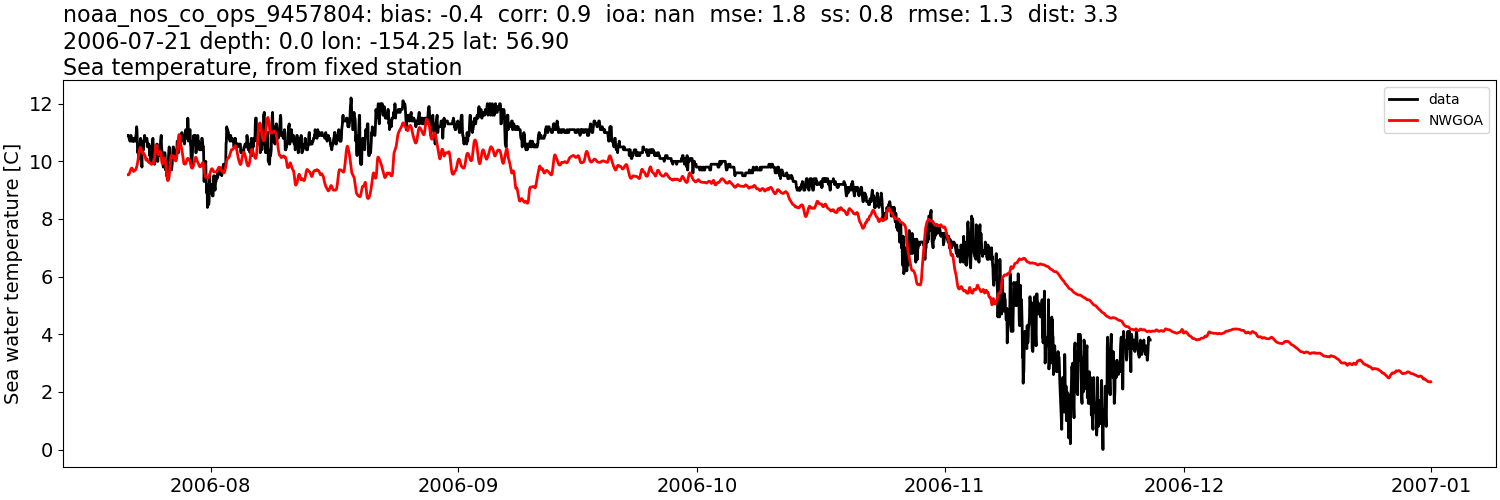
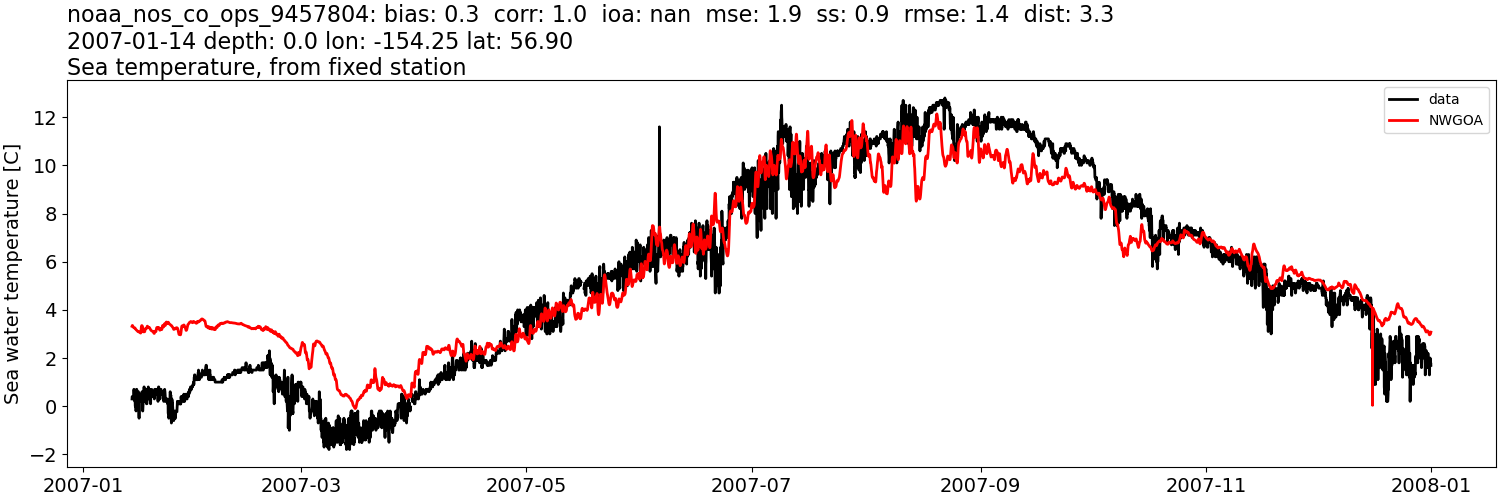
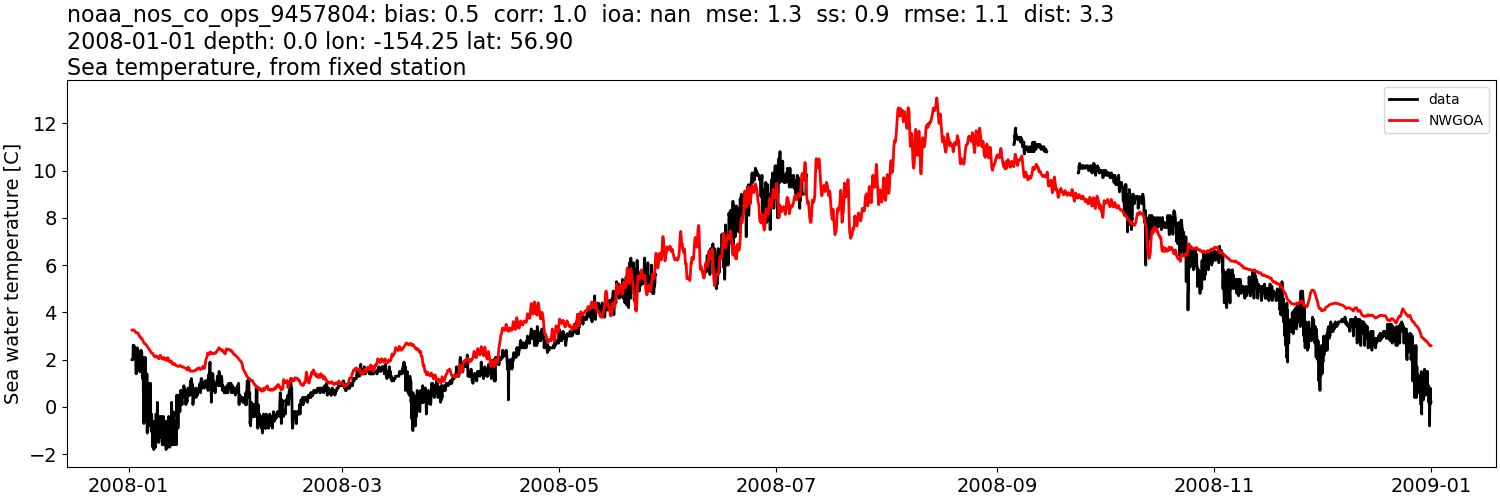
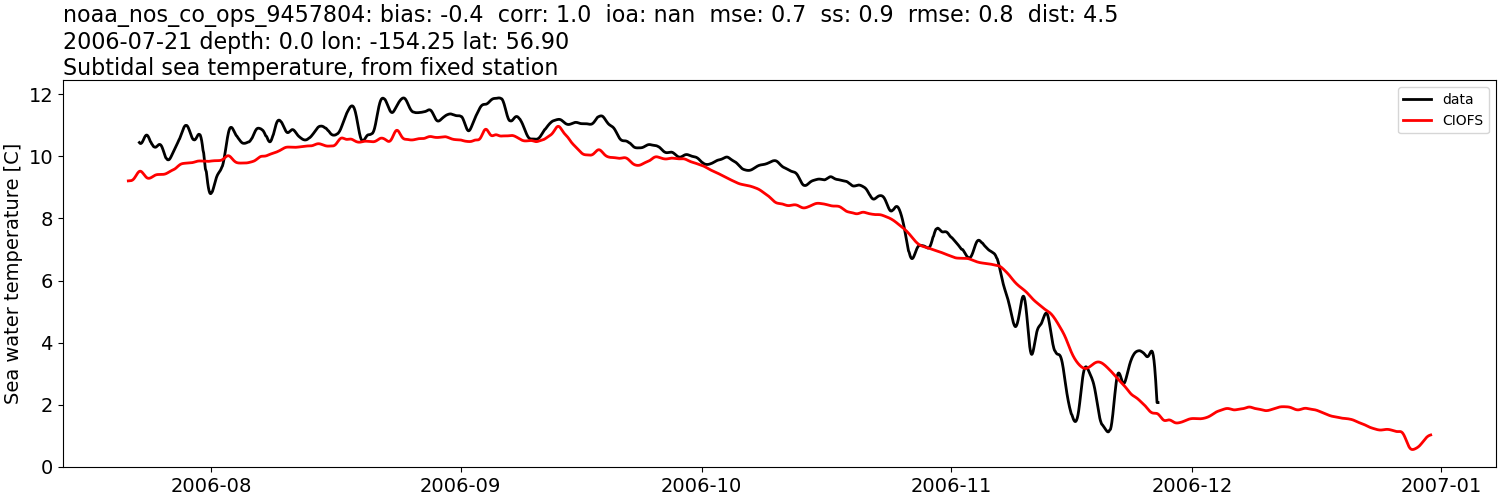
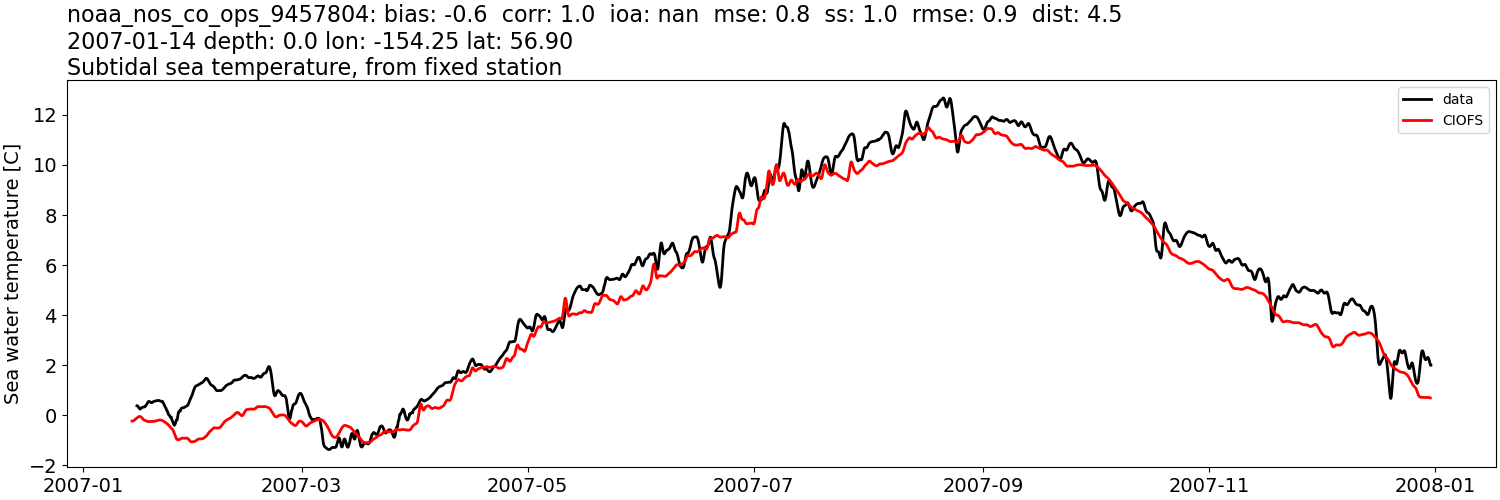
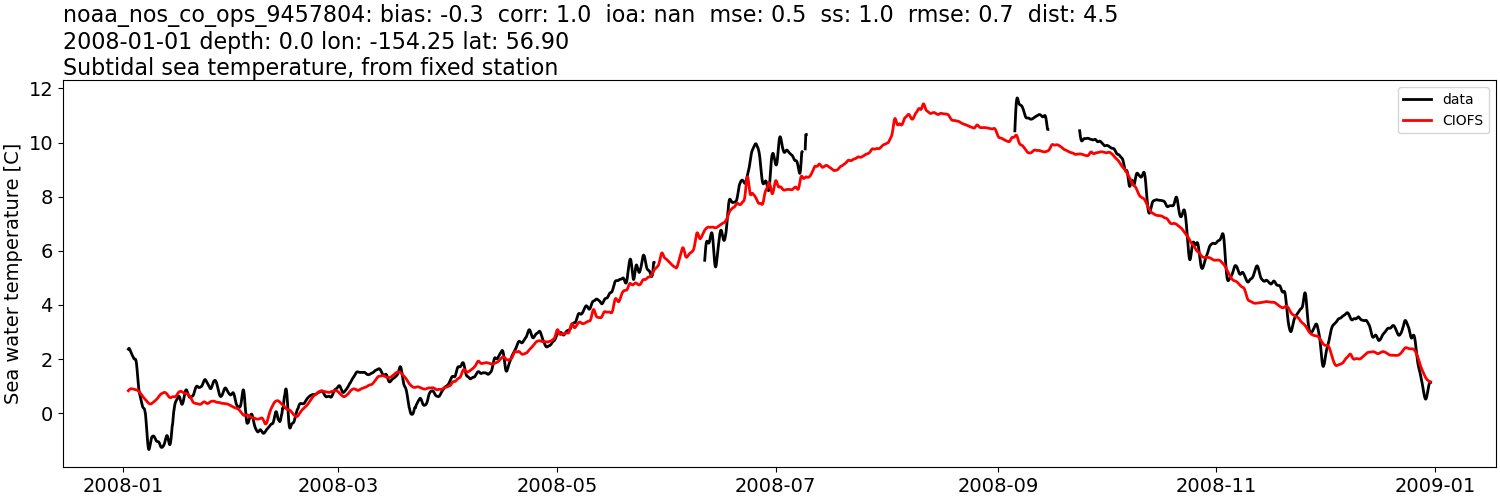
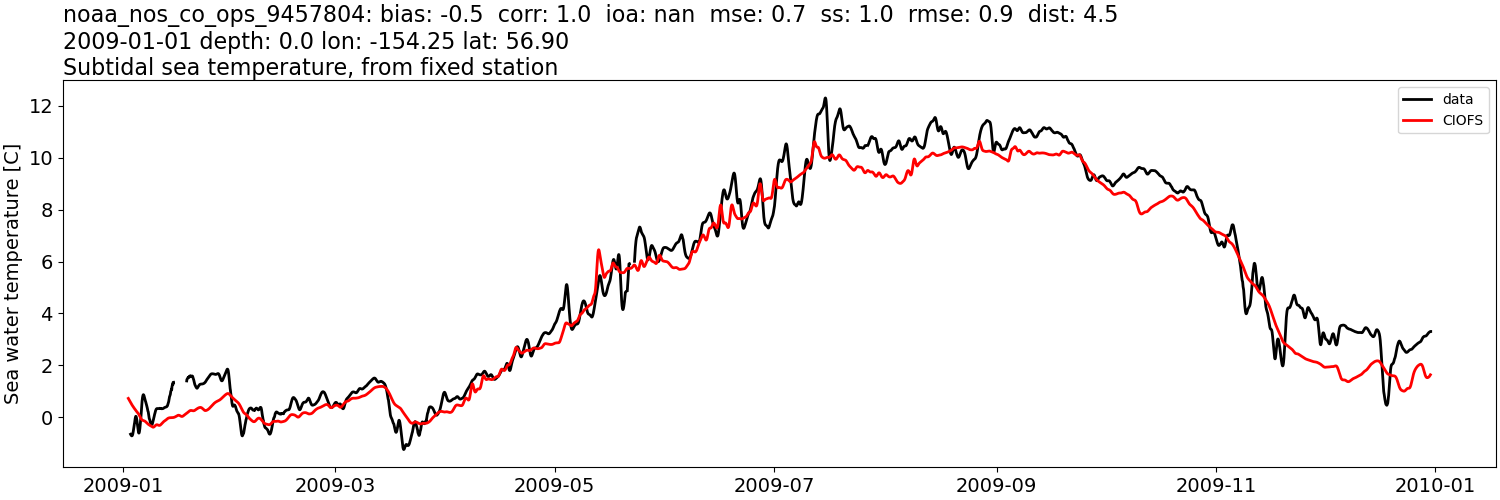
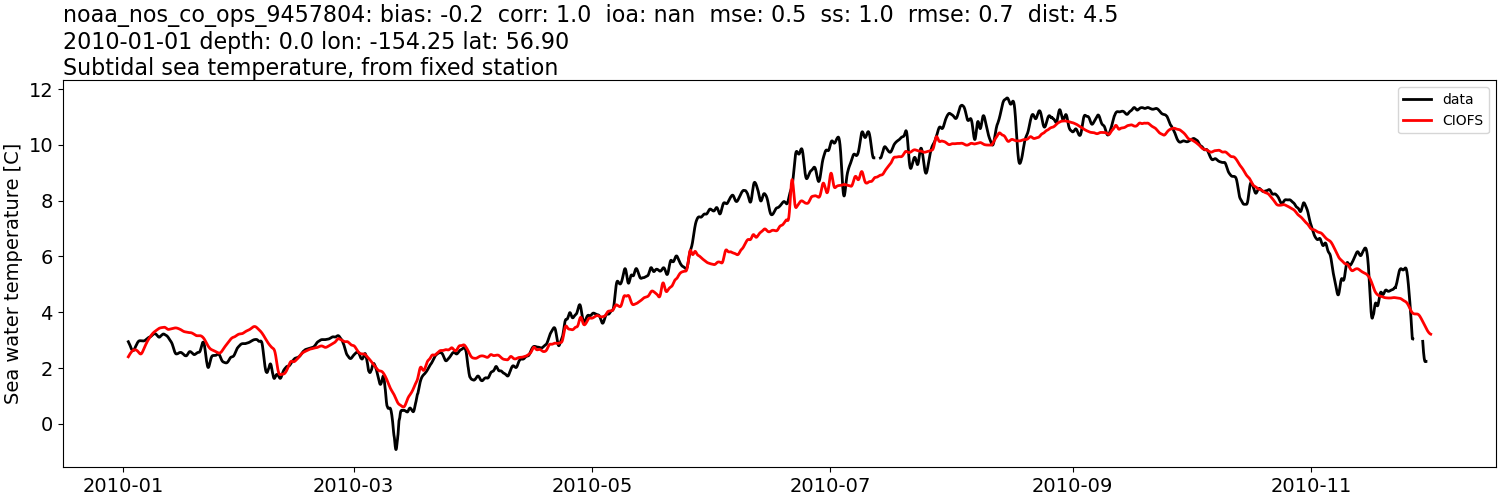
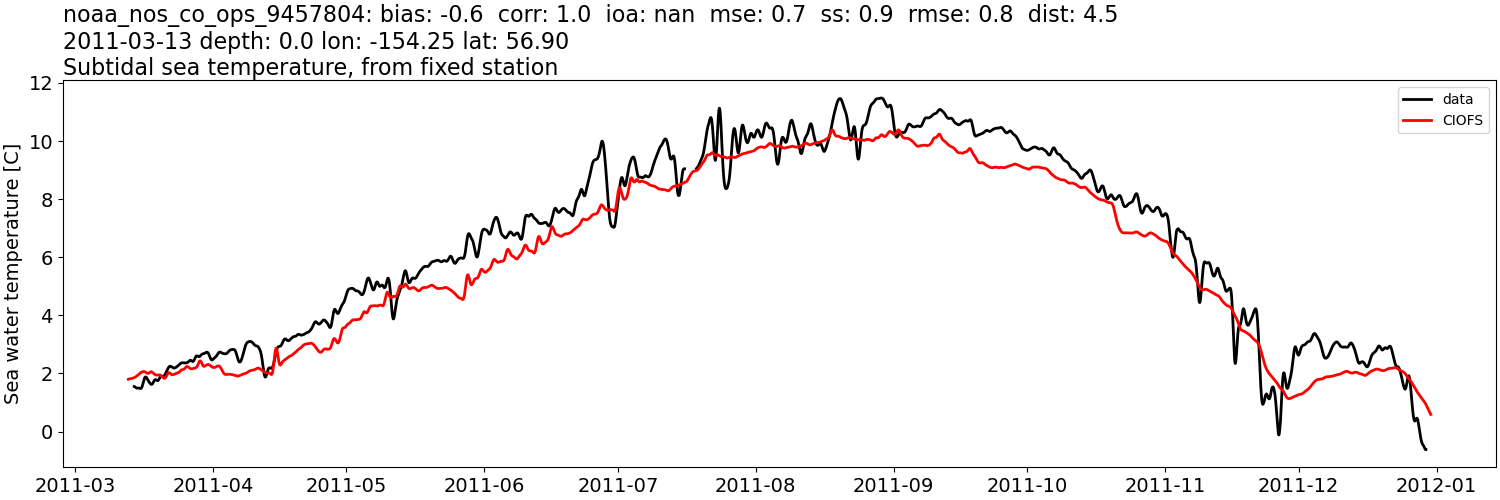
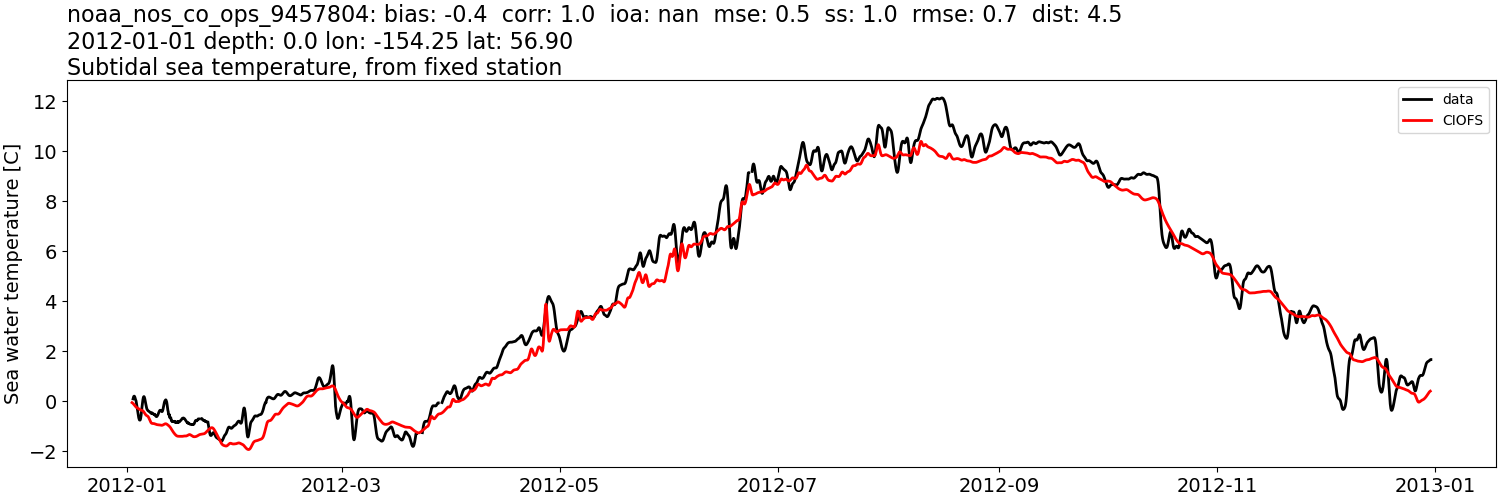
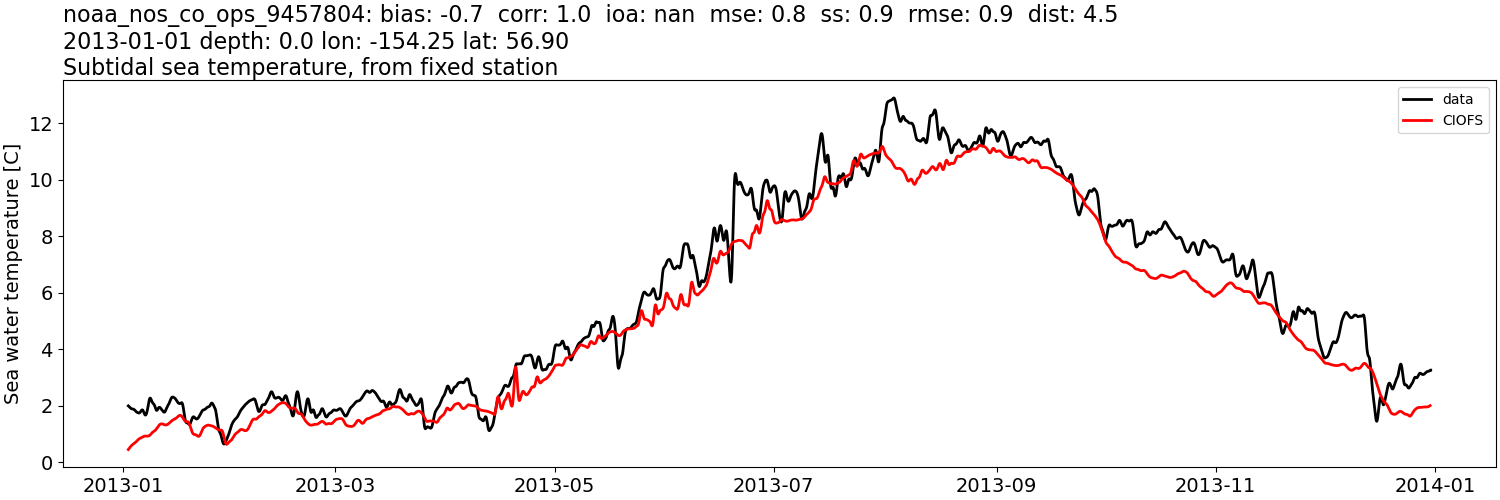
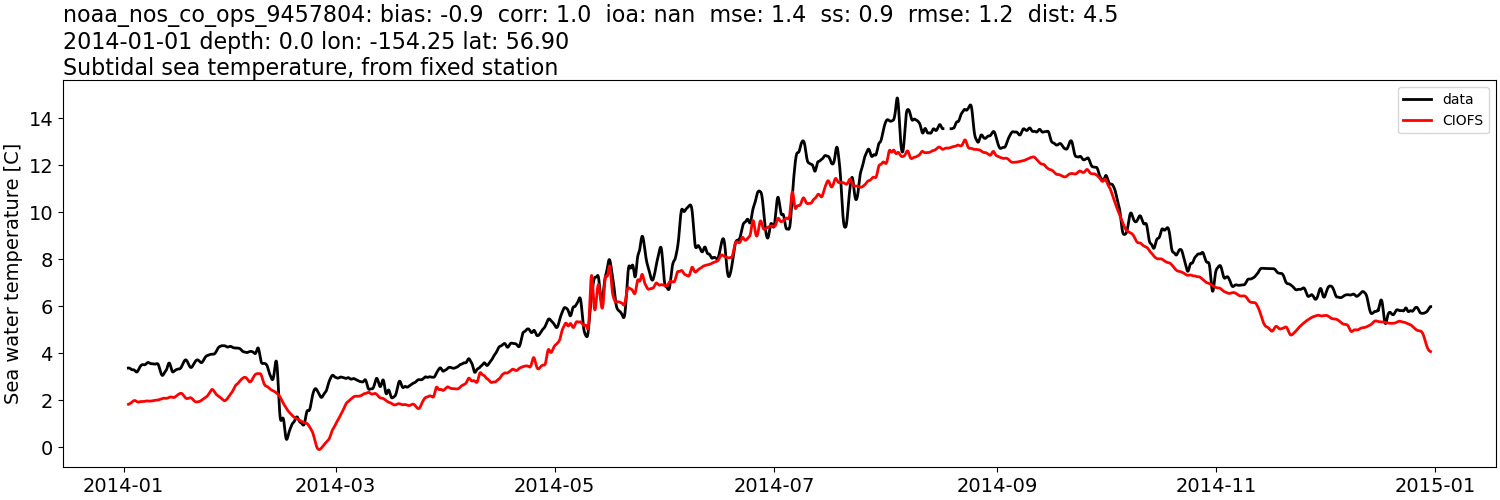
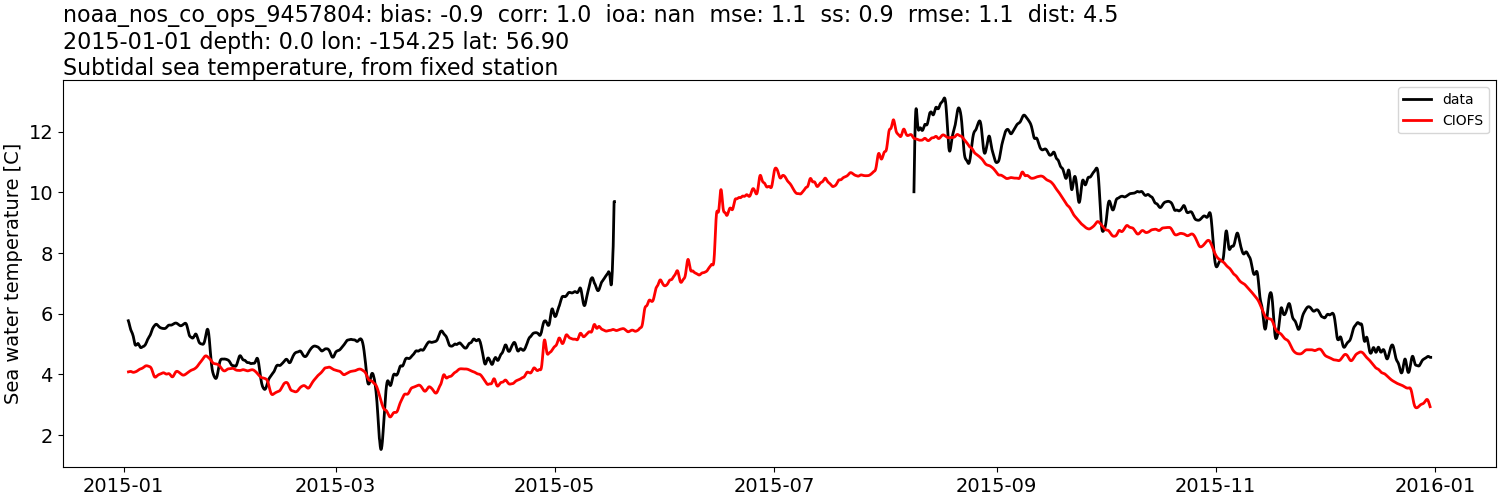
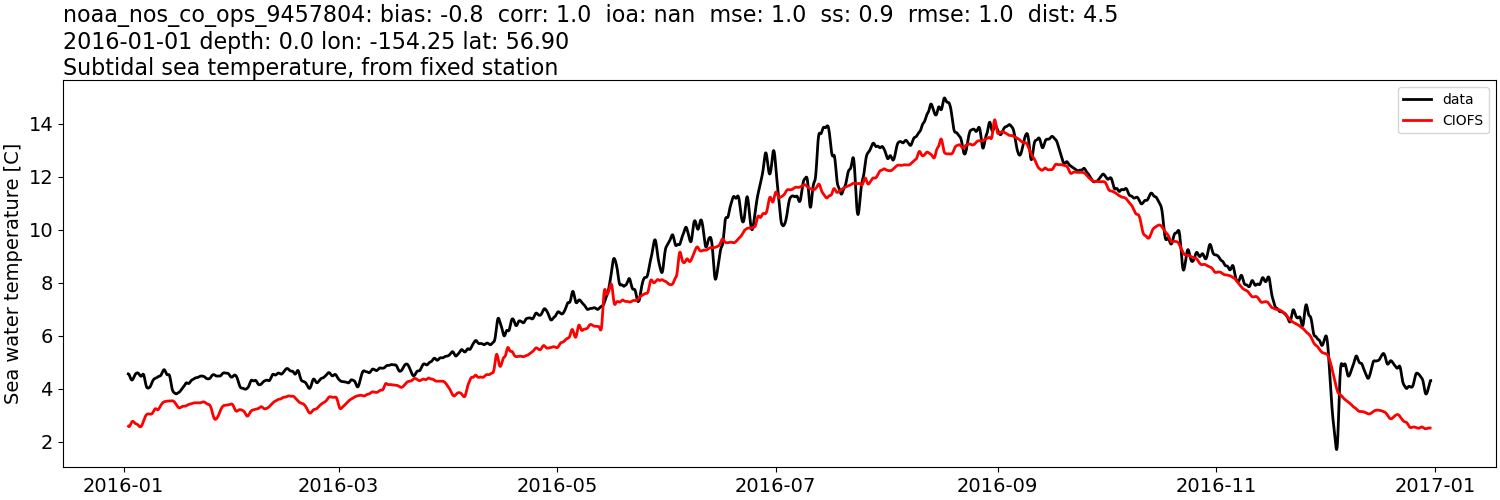
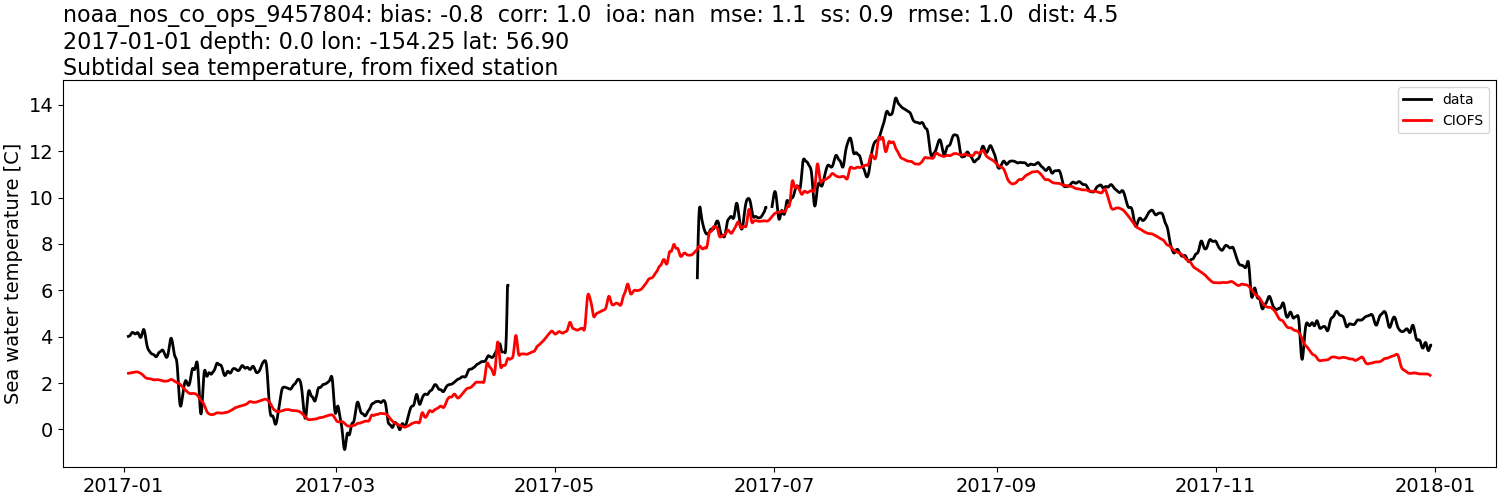
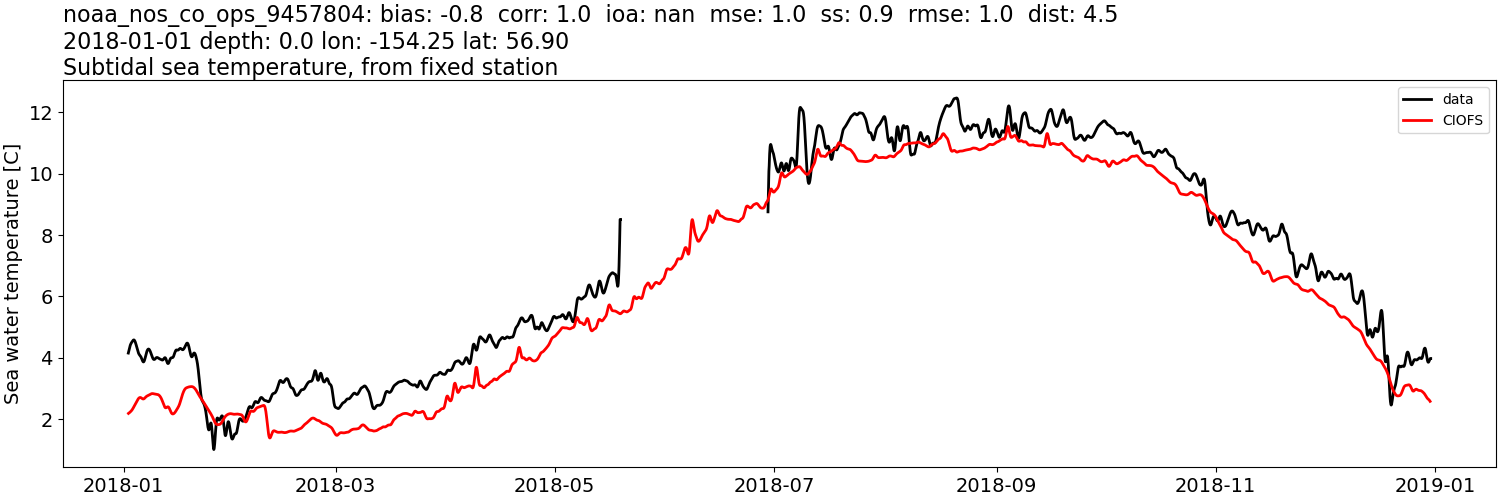
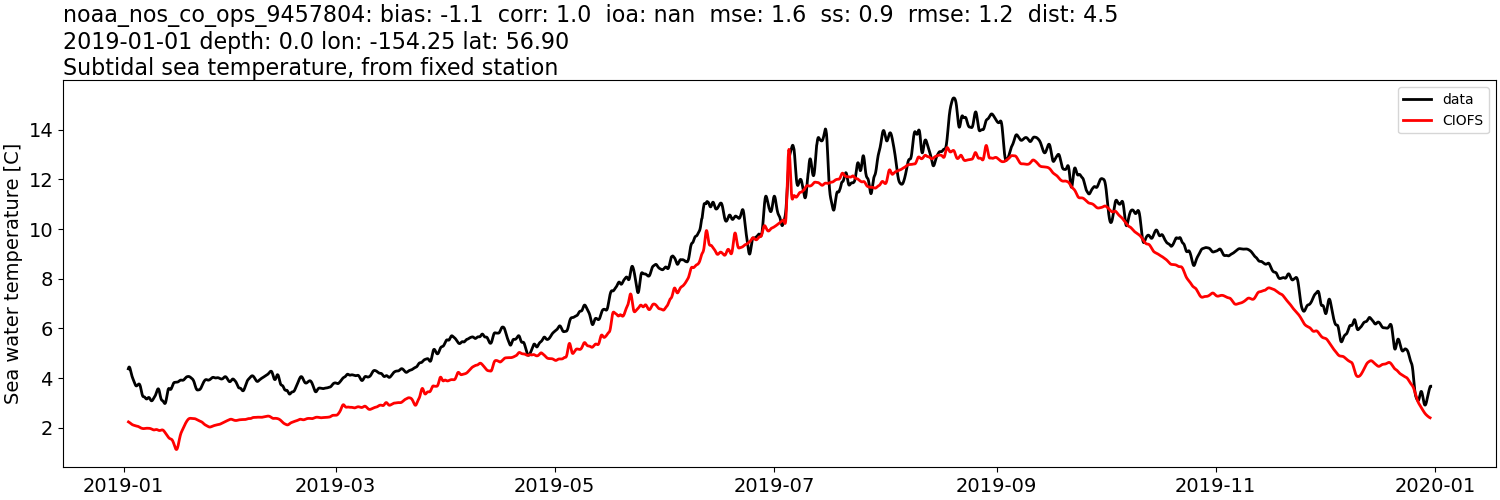
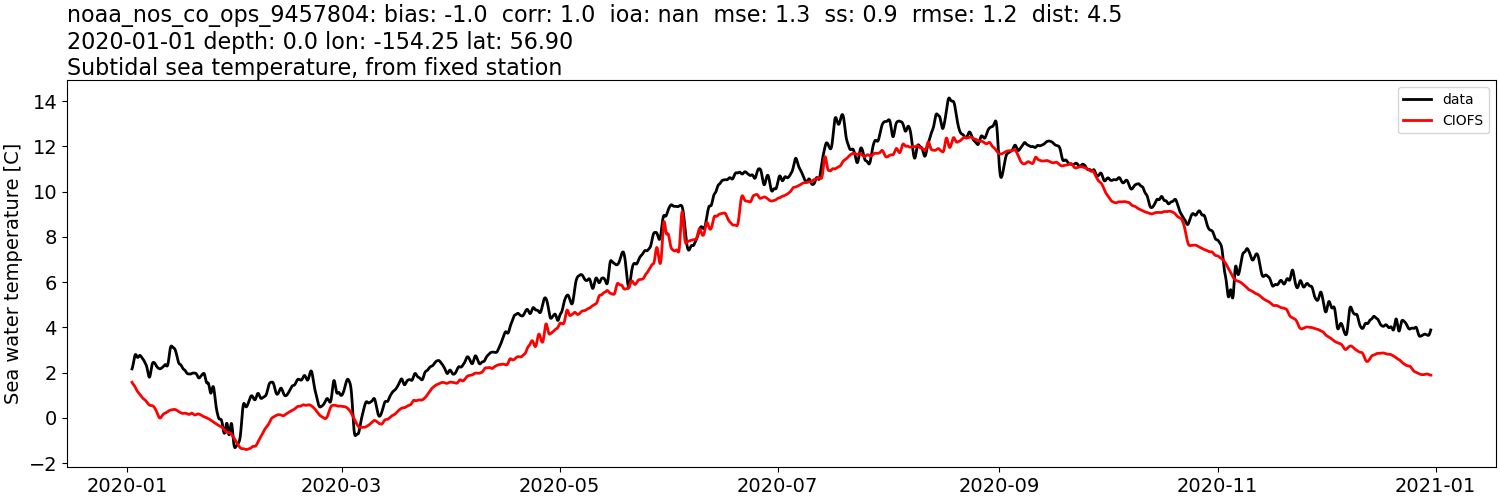
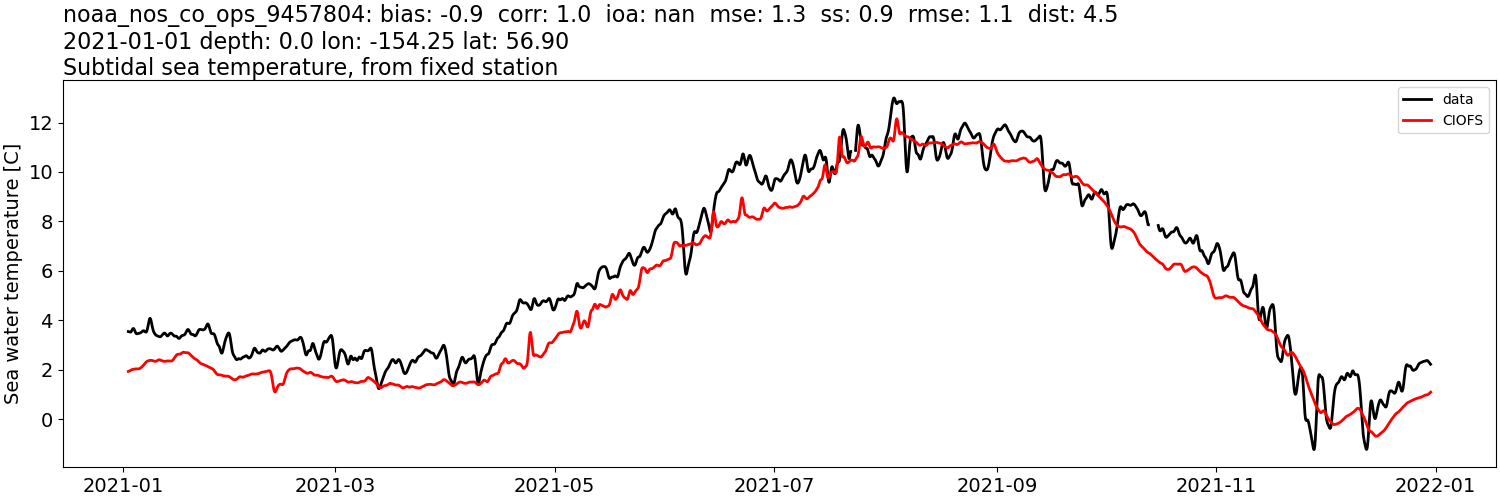
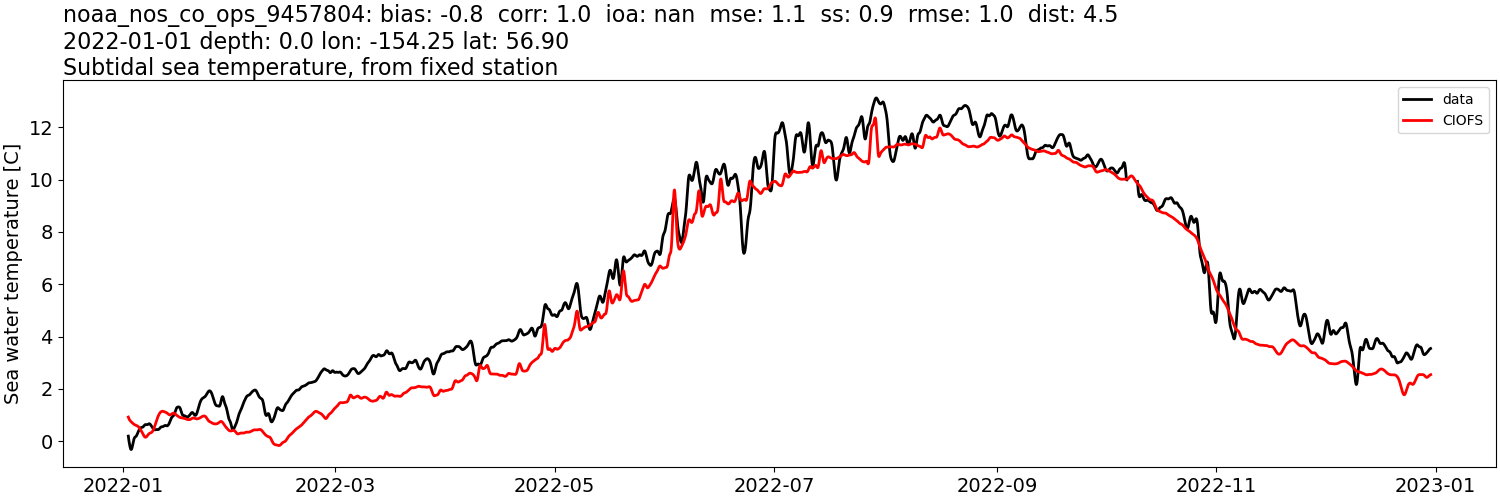
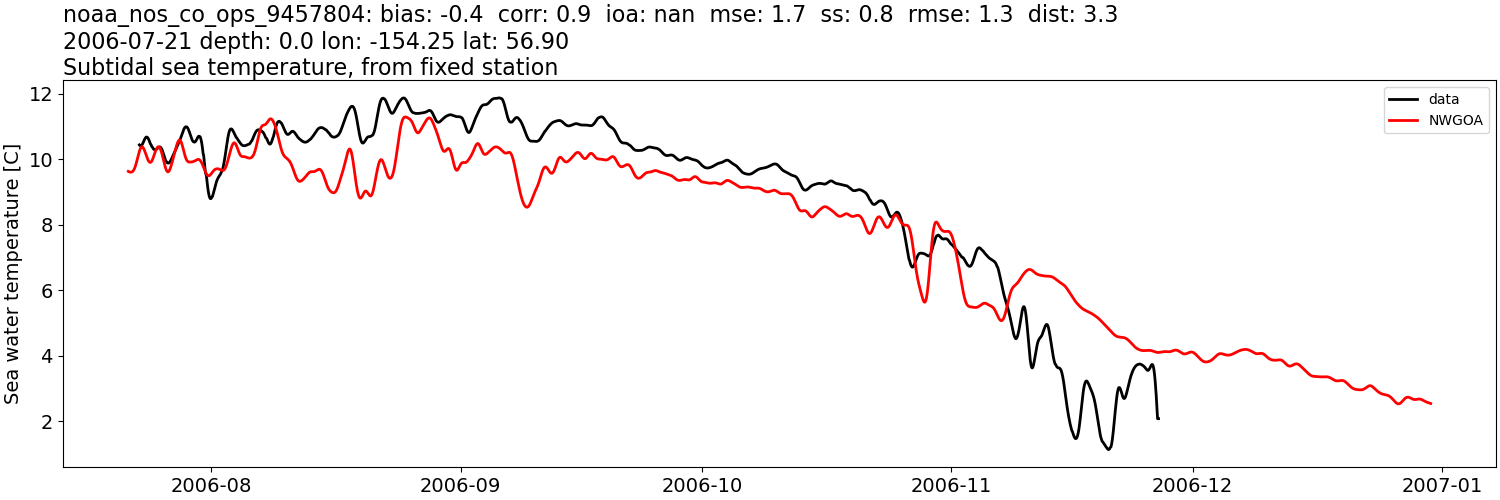
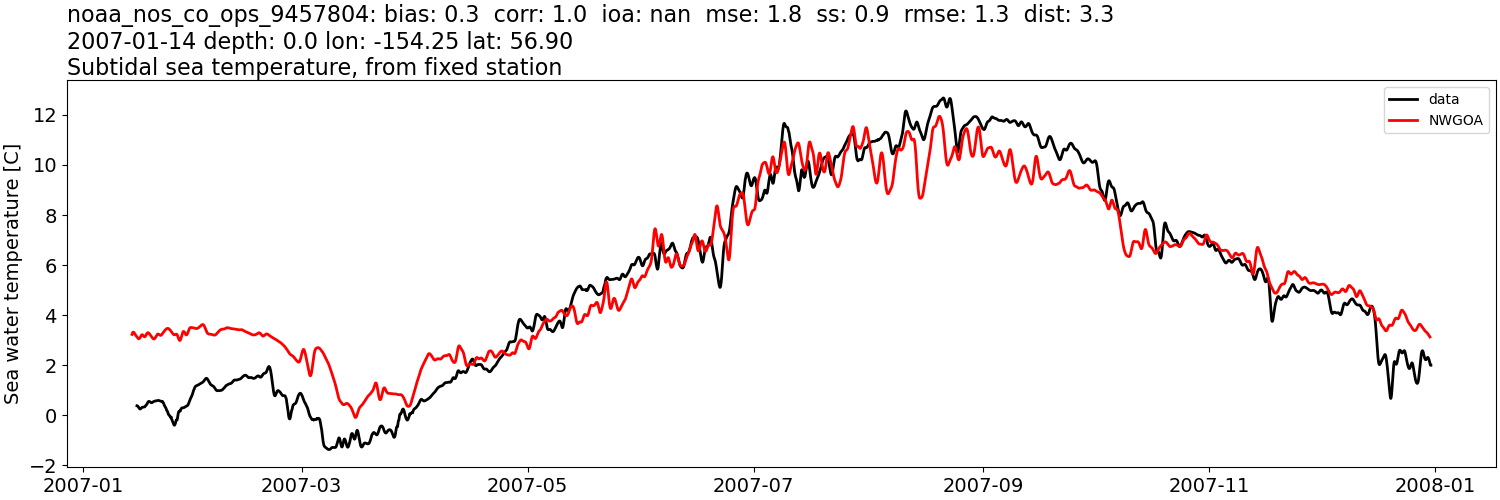
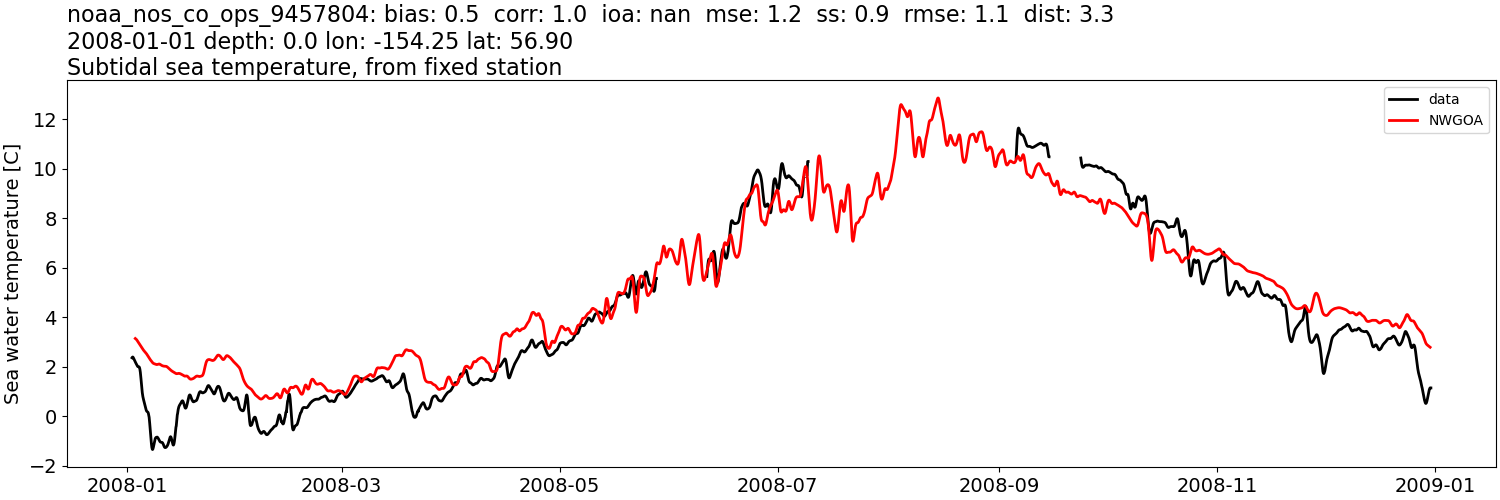
noaa_nos_co_ops_9457804#
Sea surface height: mean subtracted#
CIOFS#
Comparison plots by year
2006
2007
2008
2009
2010
2011
2012
2013
2014
2015
2016
2017
2018
2019

2020
2021
2022
NWGOA#
Comparison plots by year
2006
2007
2008
Sea surface height: mean subtracted, then tidally-filtered#
CIOFS#
Comparison plots by year
2006

2007

2008

2009

2010

2011

2012

2013

2014
2015

2016

2017

2018

2019

2020

2021

2022

NWGOA#
Comparison plots by year
2006

2007

2008

Sea water temperature:#
CIOFS#
Comparison plots by year
2006
2007
2008
2009
2010
2011
2012
2013
2014
2015
2016
2017
2018
2019
2020
2021
2022
NWGOA#
Comparison plots by year
2006
2007
2008
Sea water temperature: tidally-filtered#
CIOFS#
Comparison plots by year
2006
2007
2008
2009
2010
2011
2012
2013
2014
2015
2016
2017
2018
2019
2020
2021
2022
NWGOA#
Comparison plots by year
2006
2007
2008
Sea water temperature: tidally-filtered, then monthly mean from data subtracted#

CIOFS#
Comparison plots by year
2006

2007

2008

2009

2010

2011

2012

2013

2014

2015

2016

2017

2018

2019

2020

2021

2022

NWGOA#
Comparison plots by year
2006

2007

2008

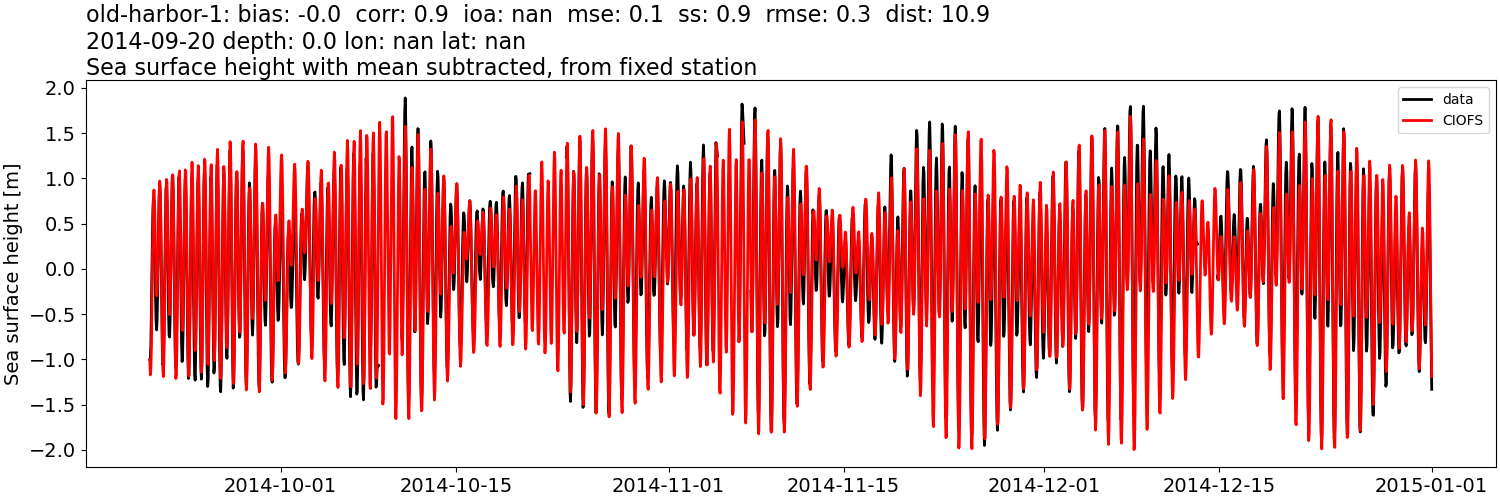
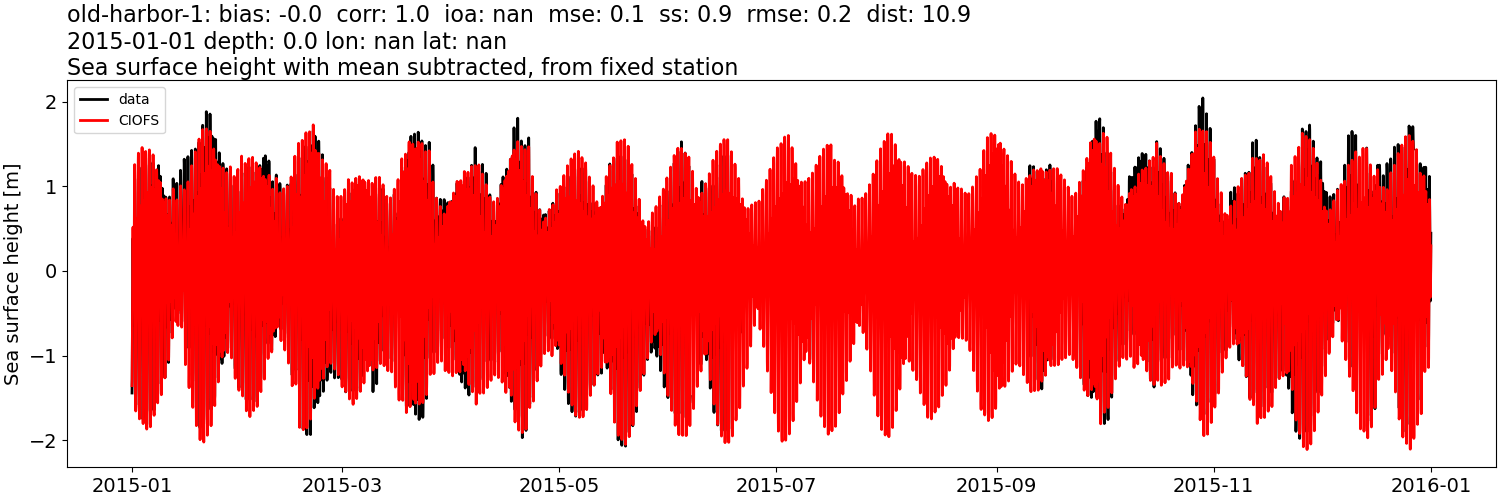
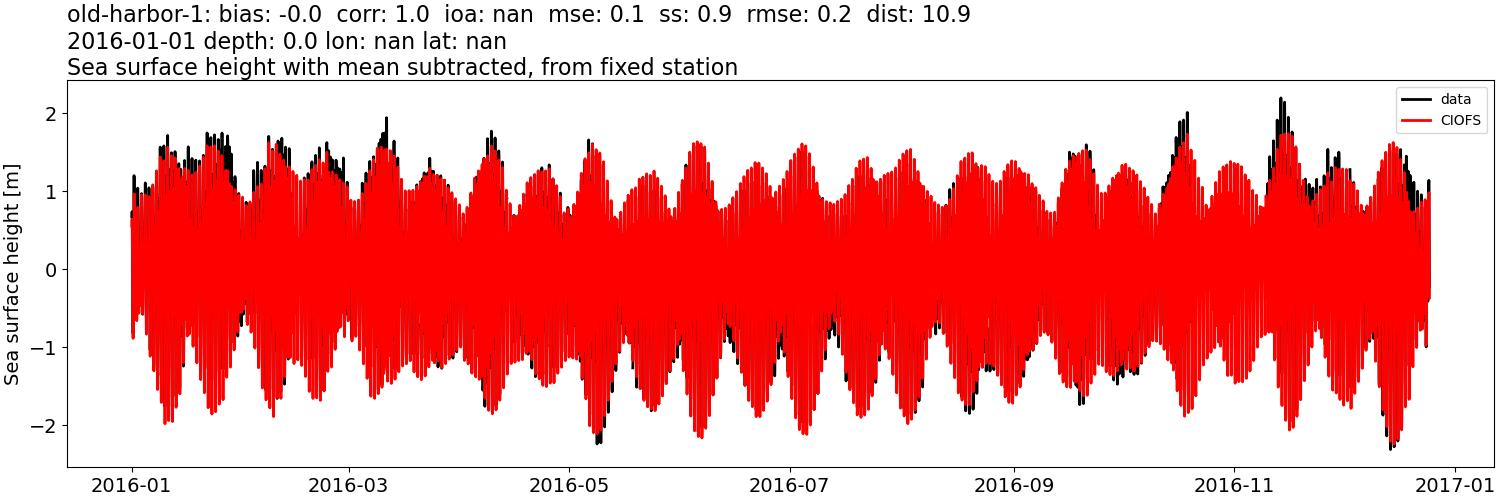
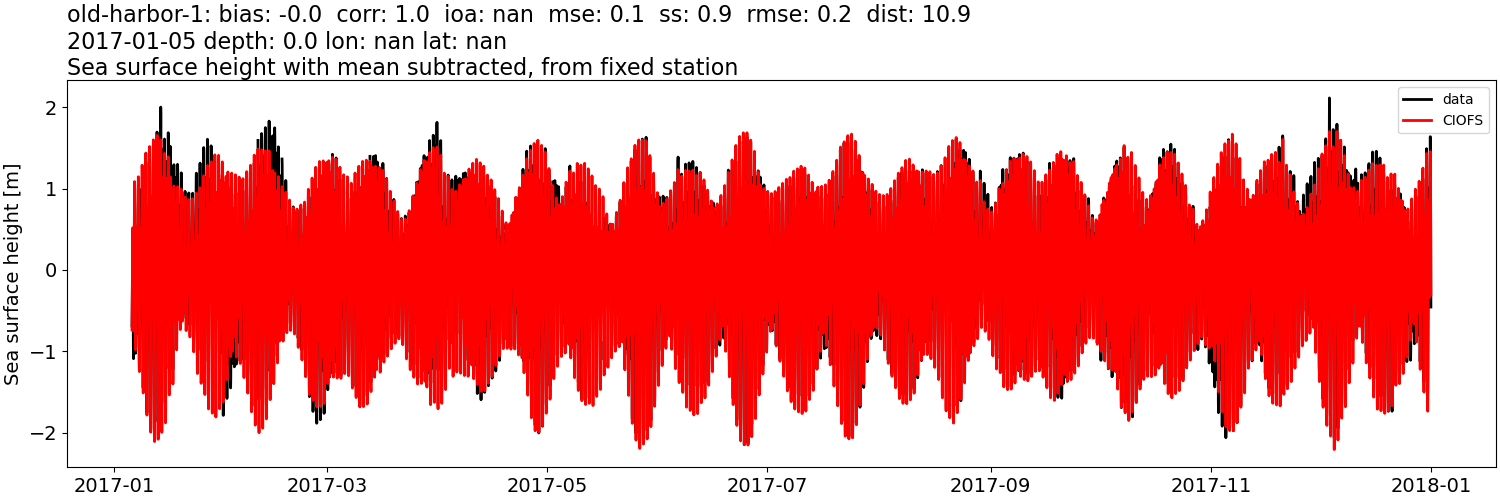
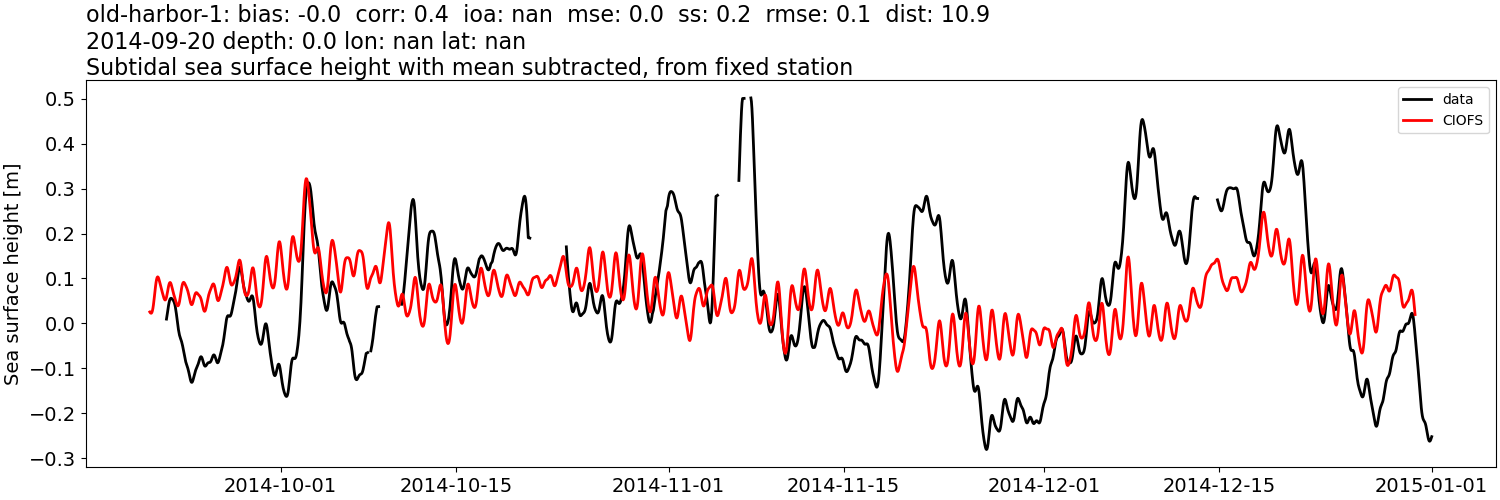
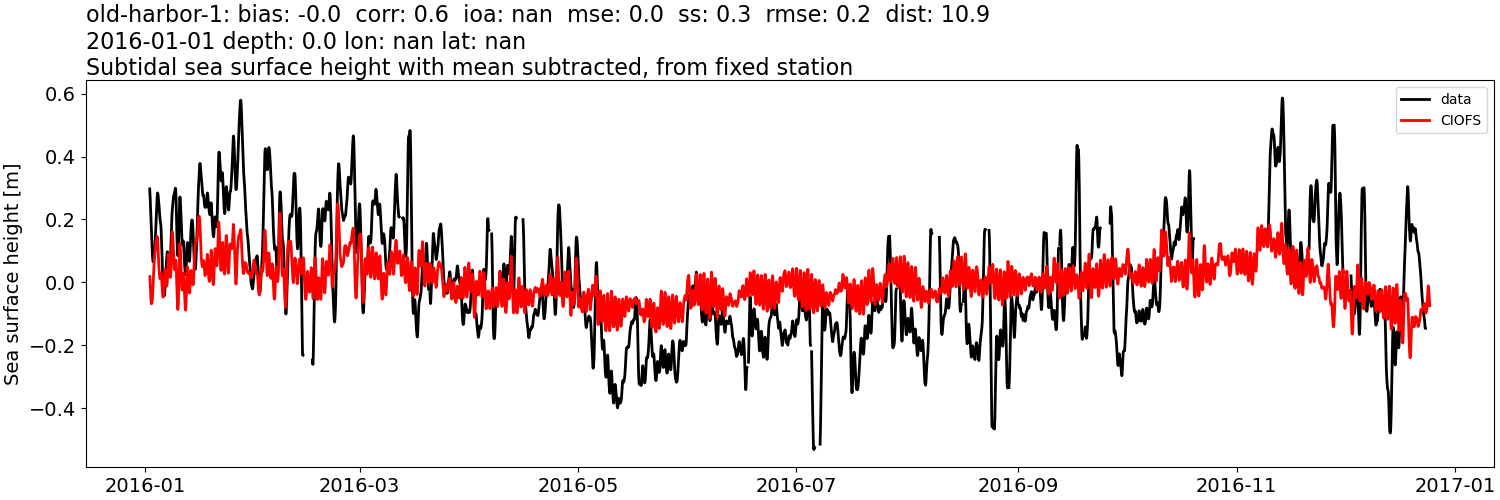
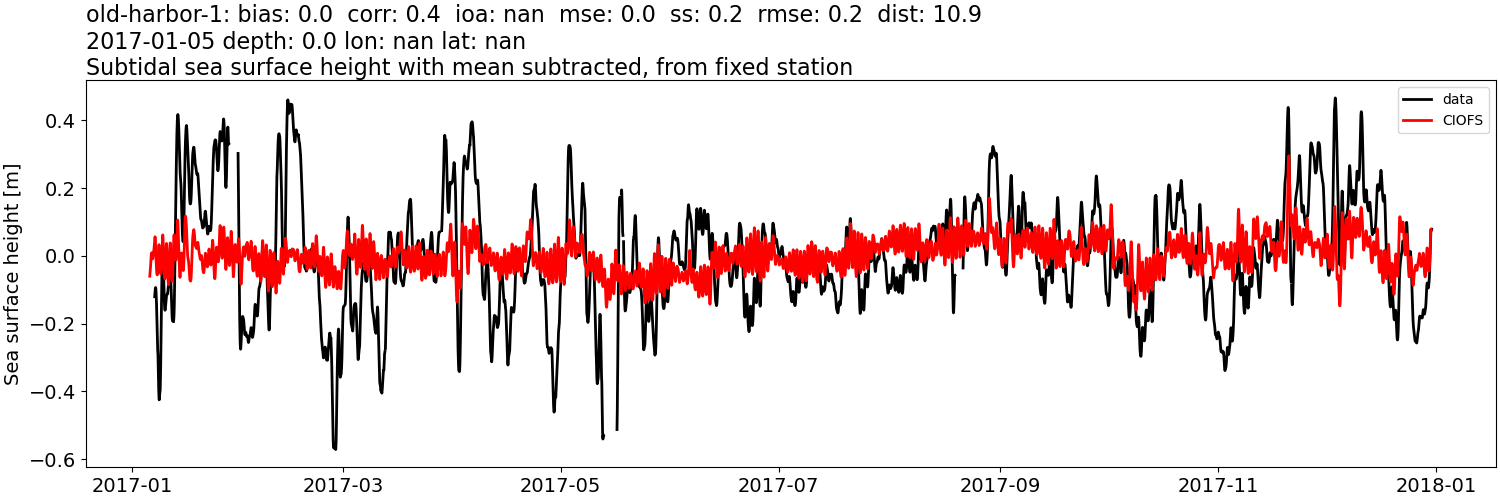
old-harbor-1#
NWGOA: Data time range is 2014-09-20 to 2018-08-27 but model ends 2009-01-01.
Sea surface height: mean subtracted#
CIOFS#
Comparison plots by year
2014
2015
2016
2017
Sea surface height: mean subtracted, then tidally-filtered#
CIOFS#
Comparison plots by year
2014
2015

2016
2017
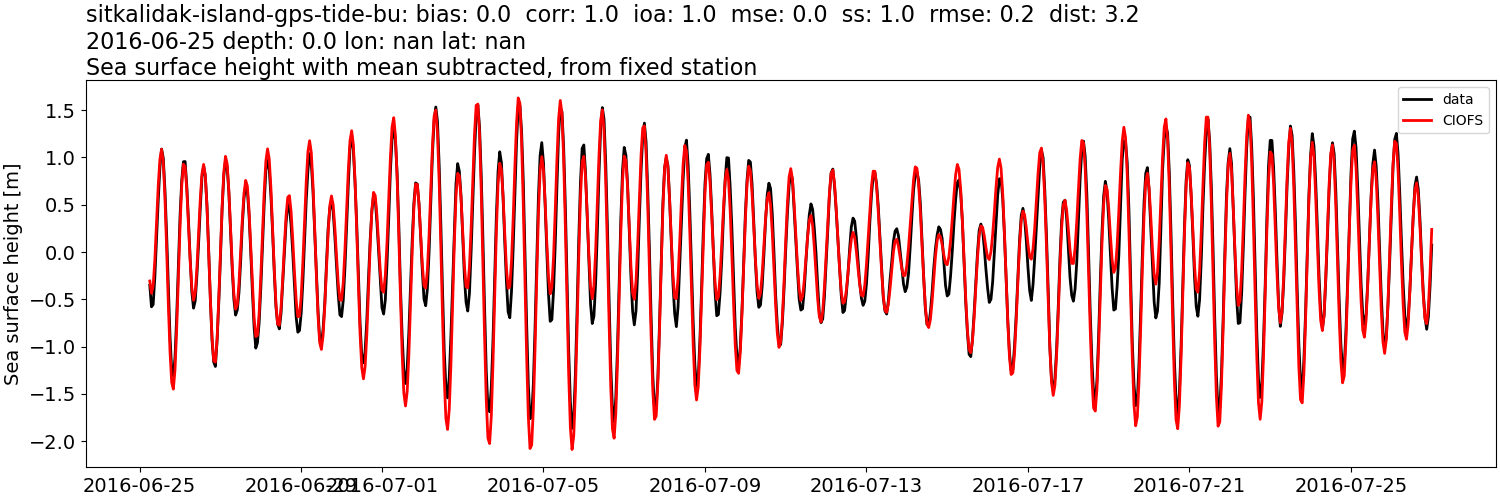
sitkalidak-island-gps-tide-bu#
NWGOA: Data time range is 2016-06-25 to 2016-07-27 but model ends 2009-01-01.
Sea surface height: mean subtracted#
CIOFS#
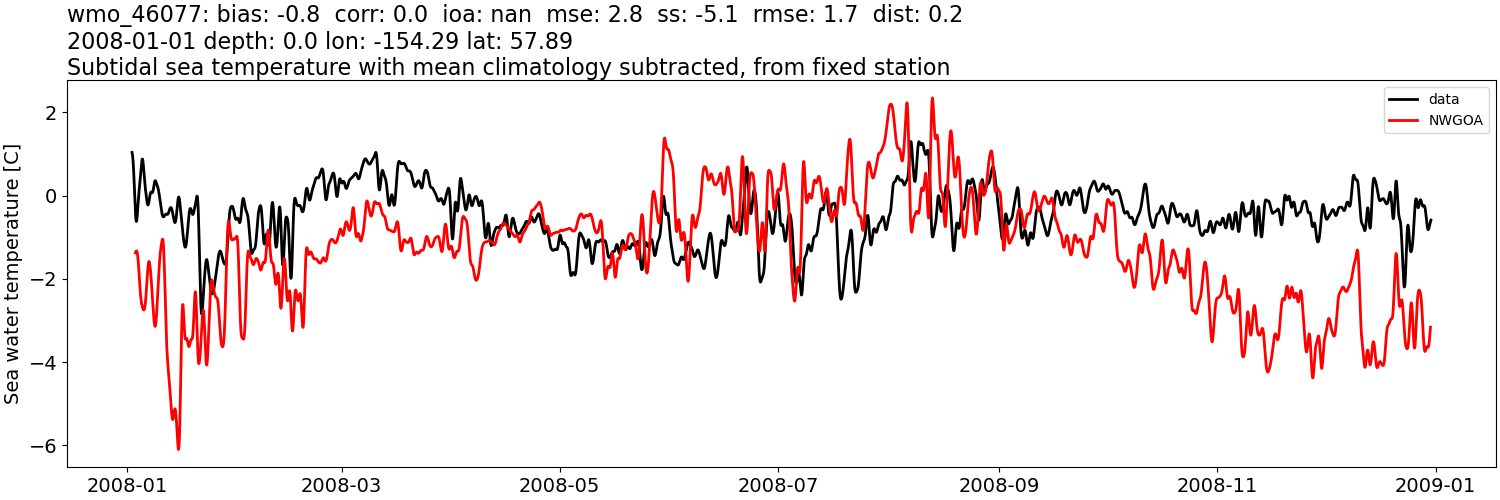
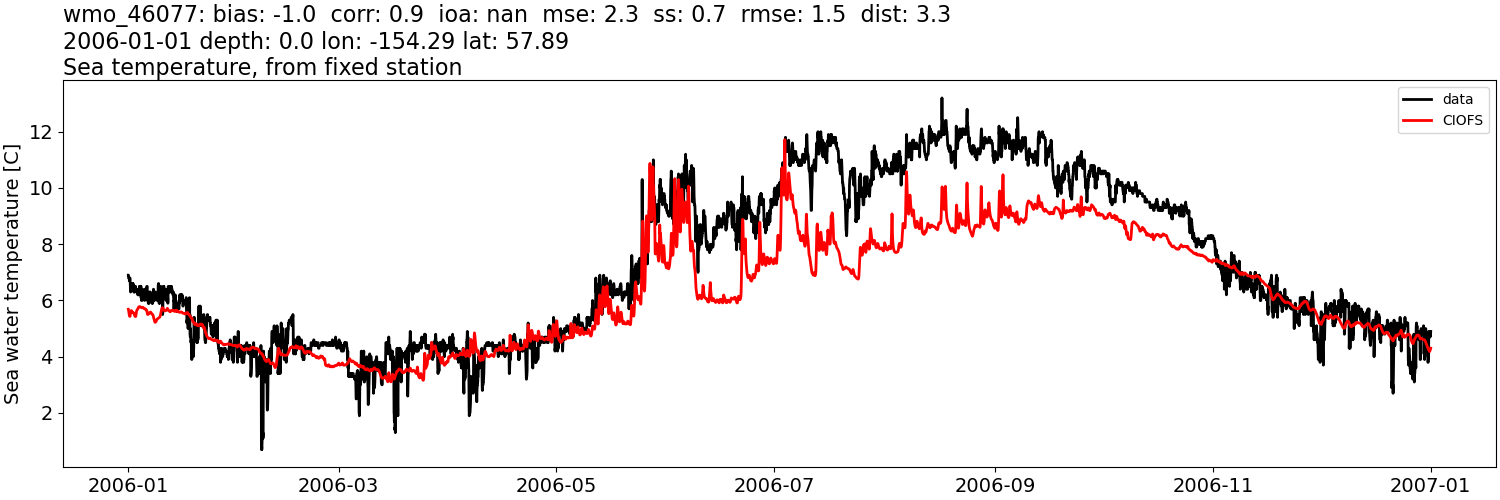
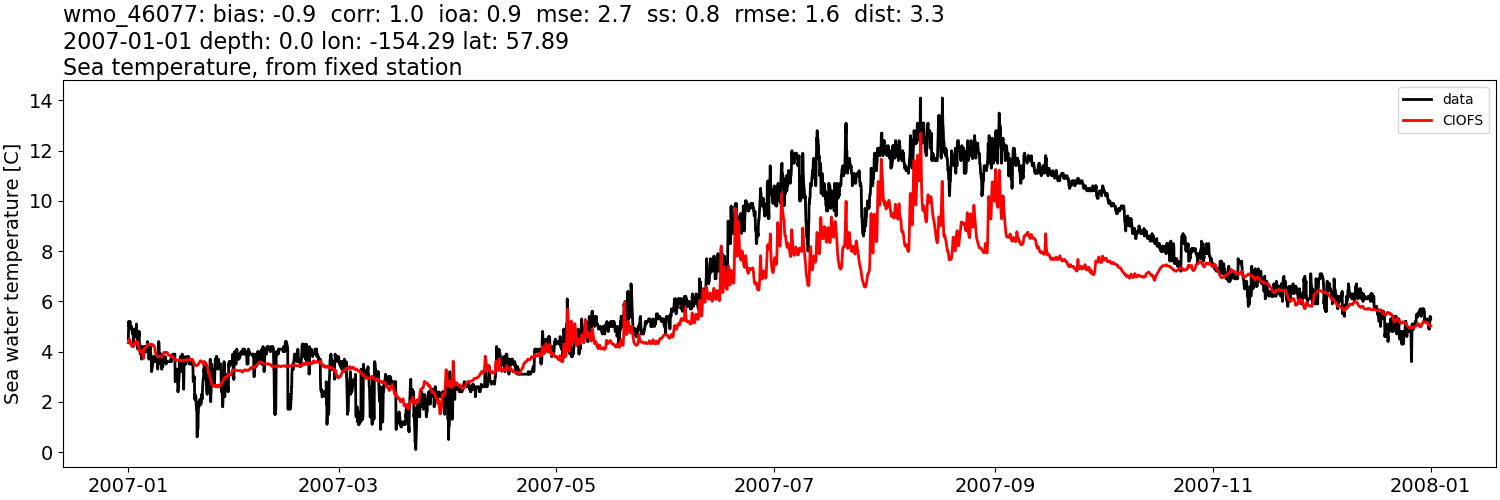
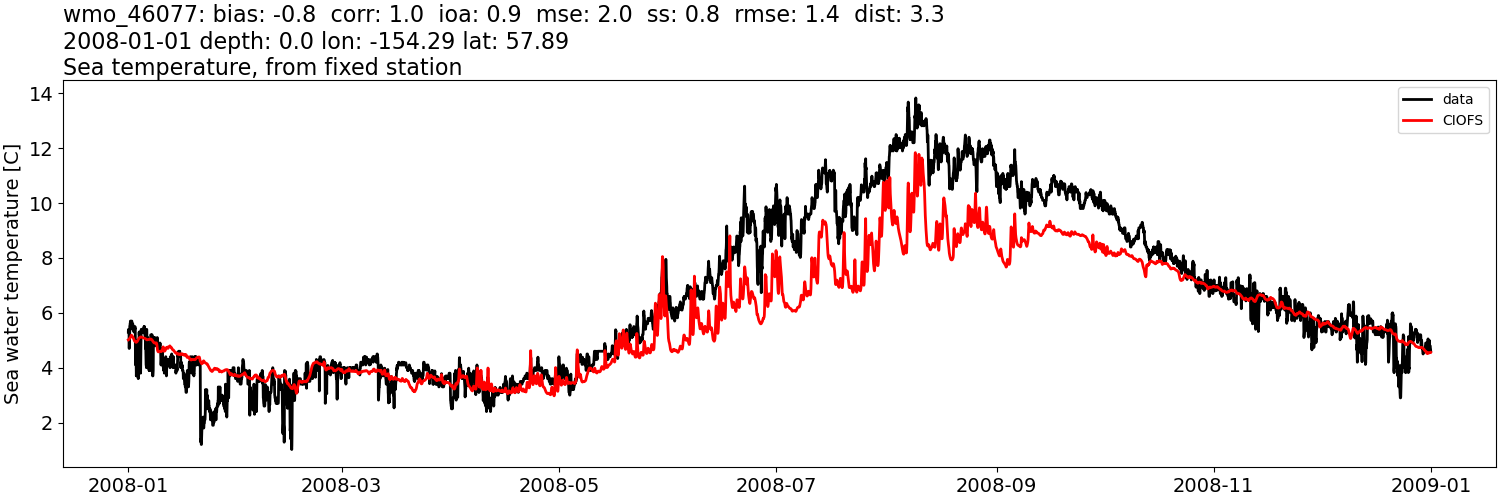
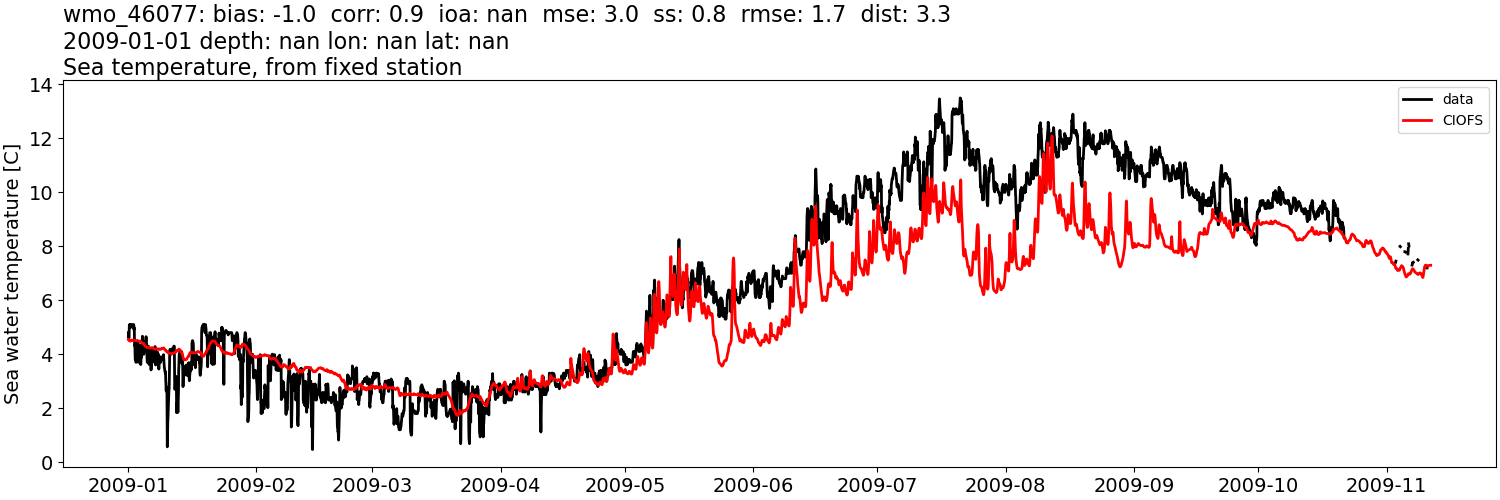
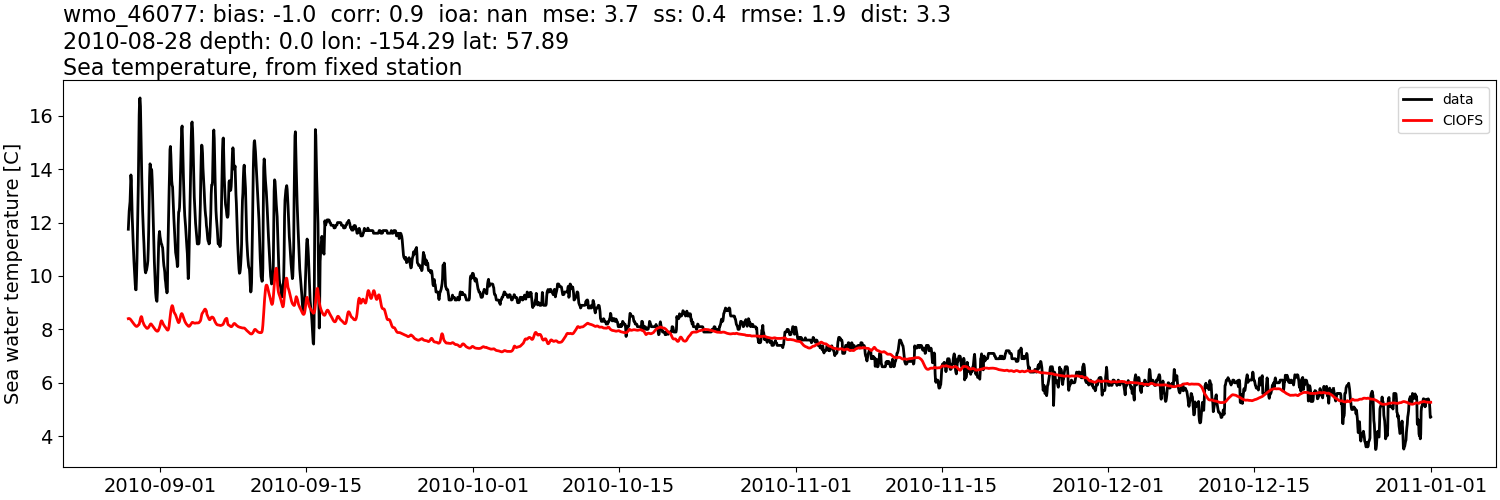
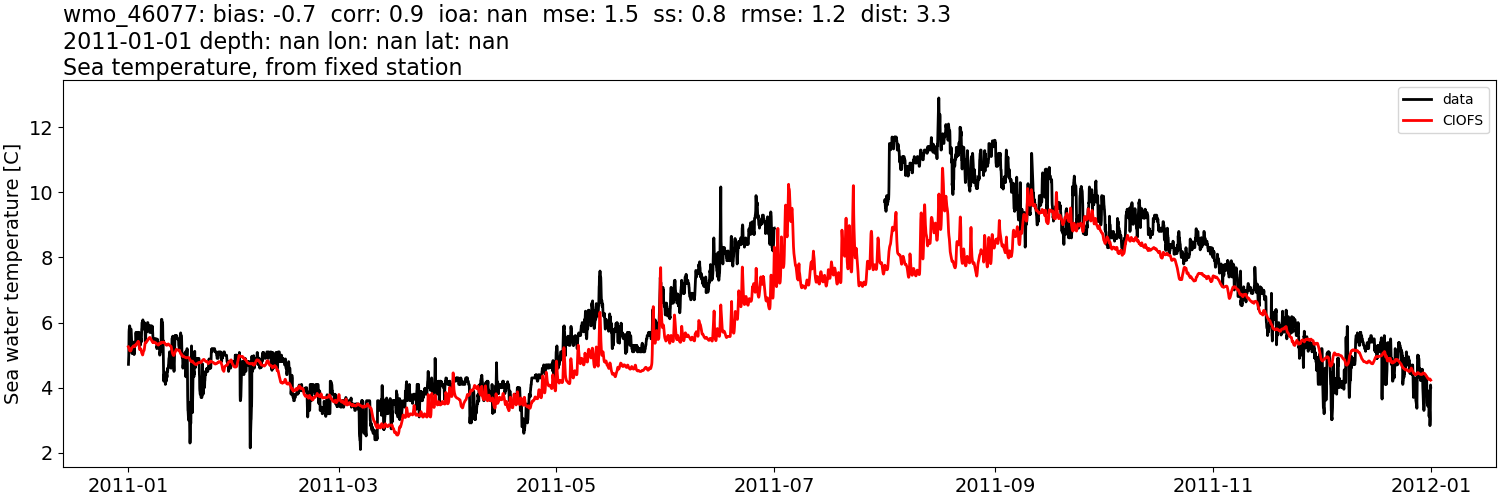
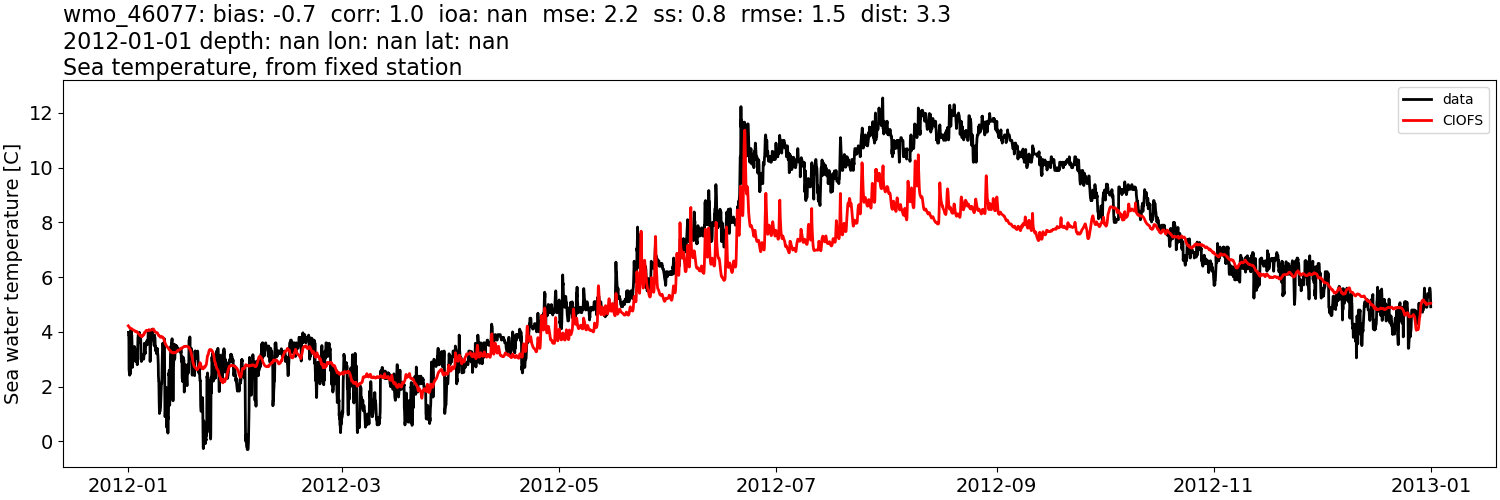
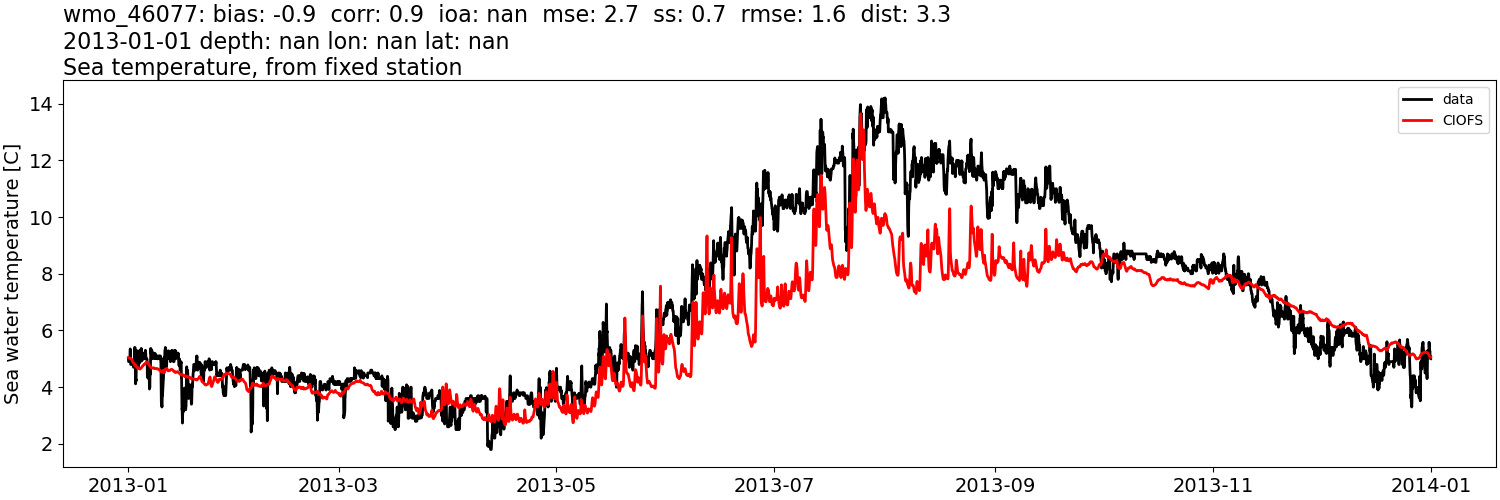
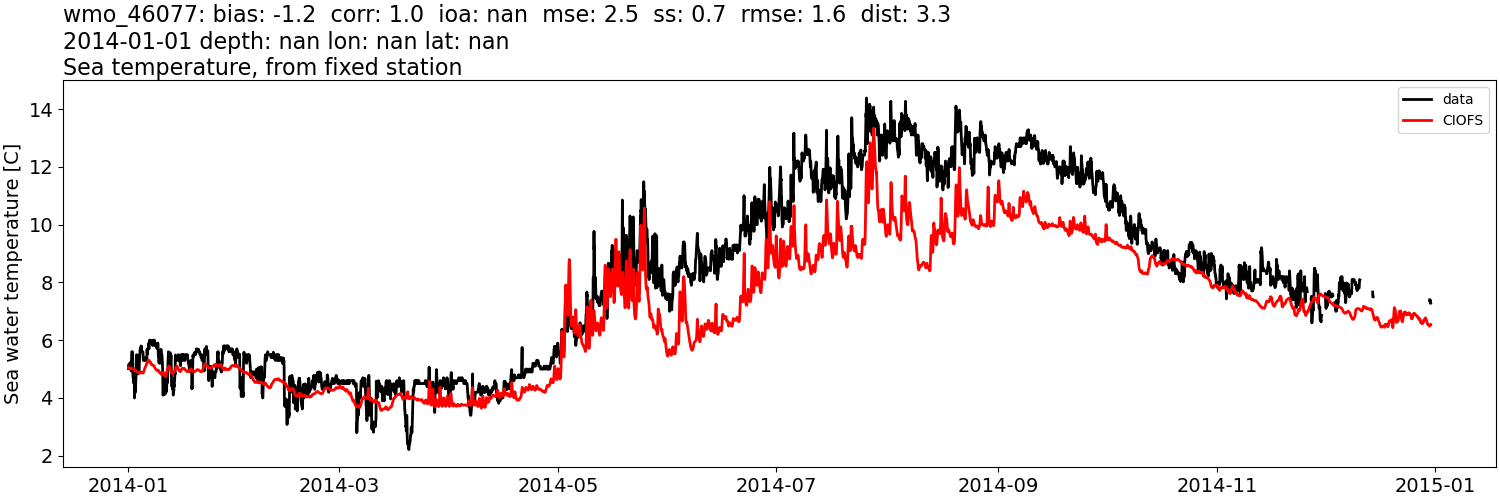
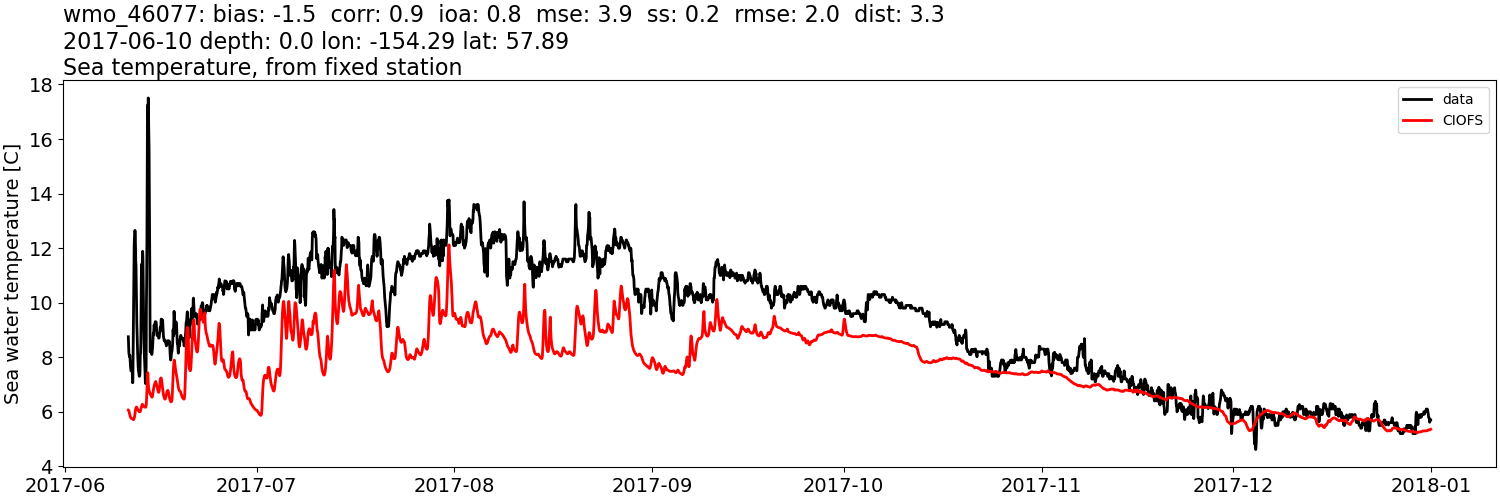
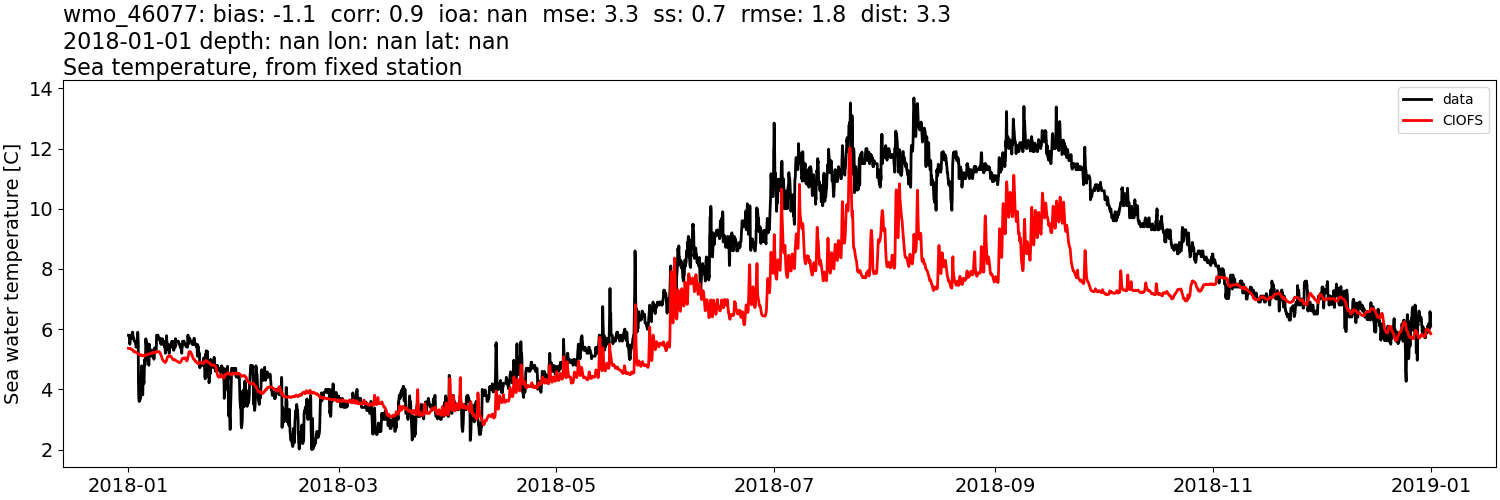
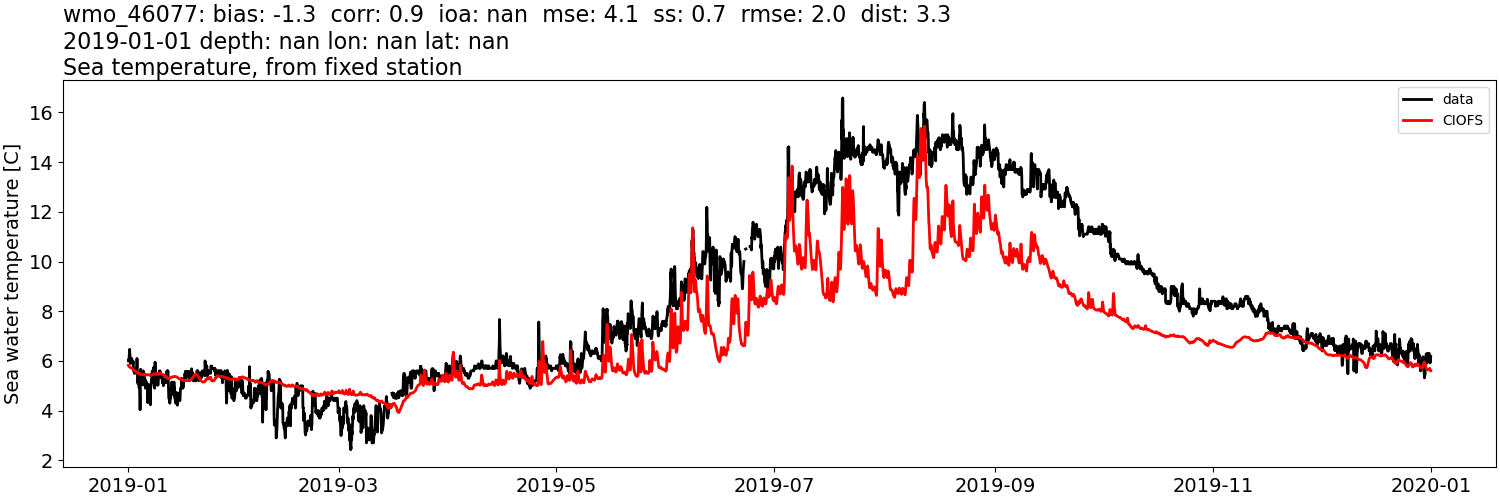
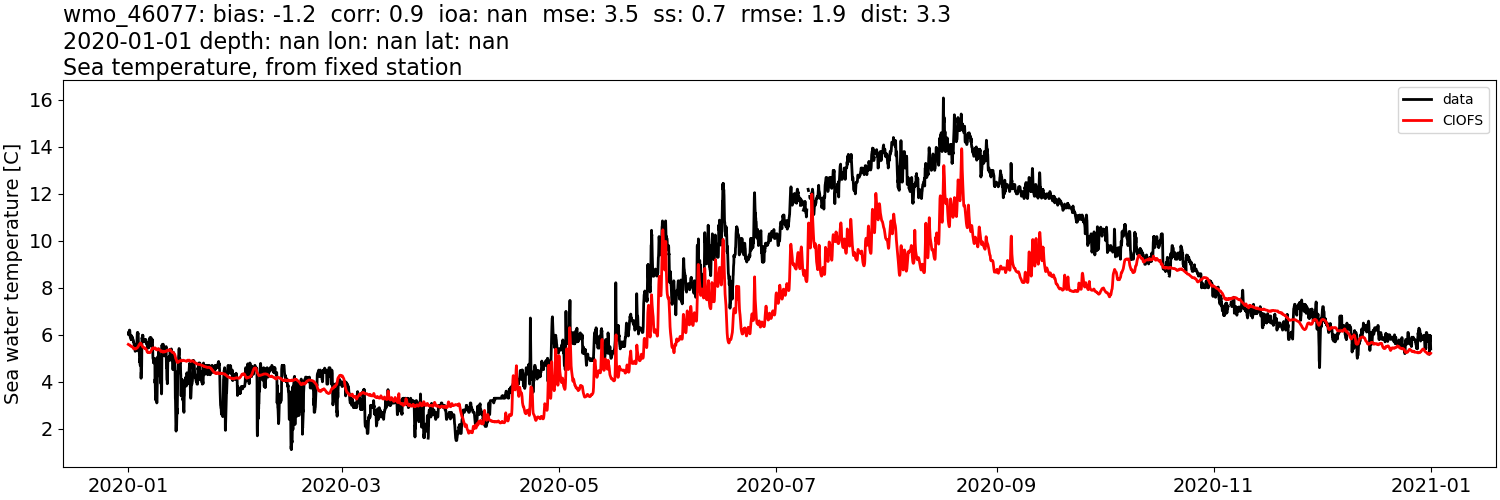
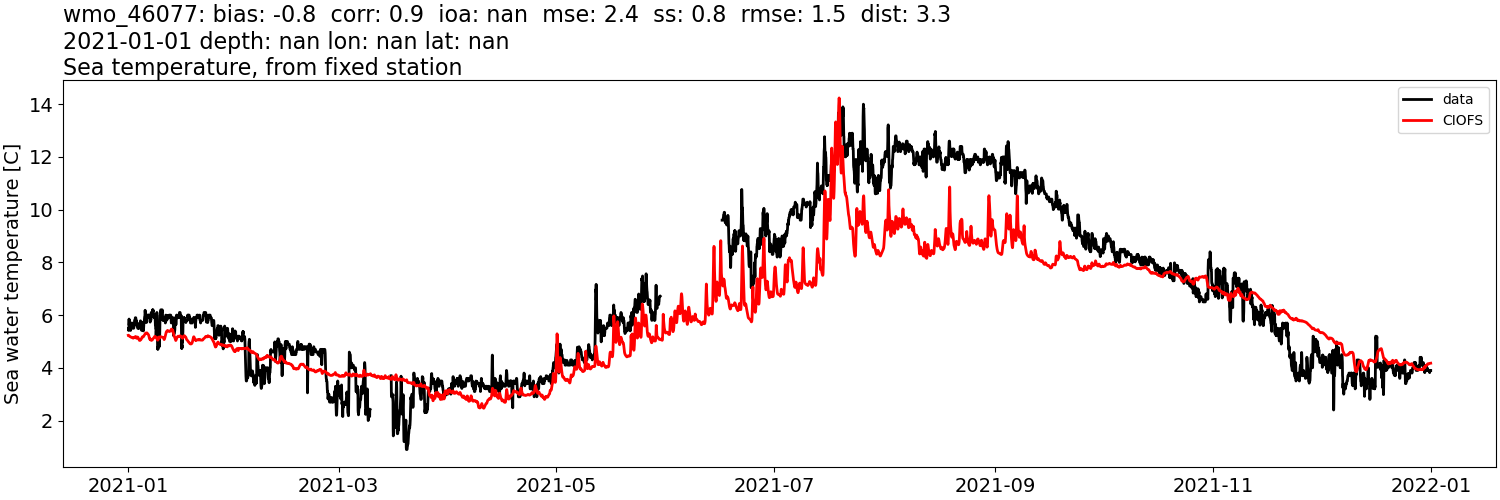
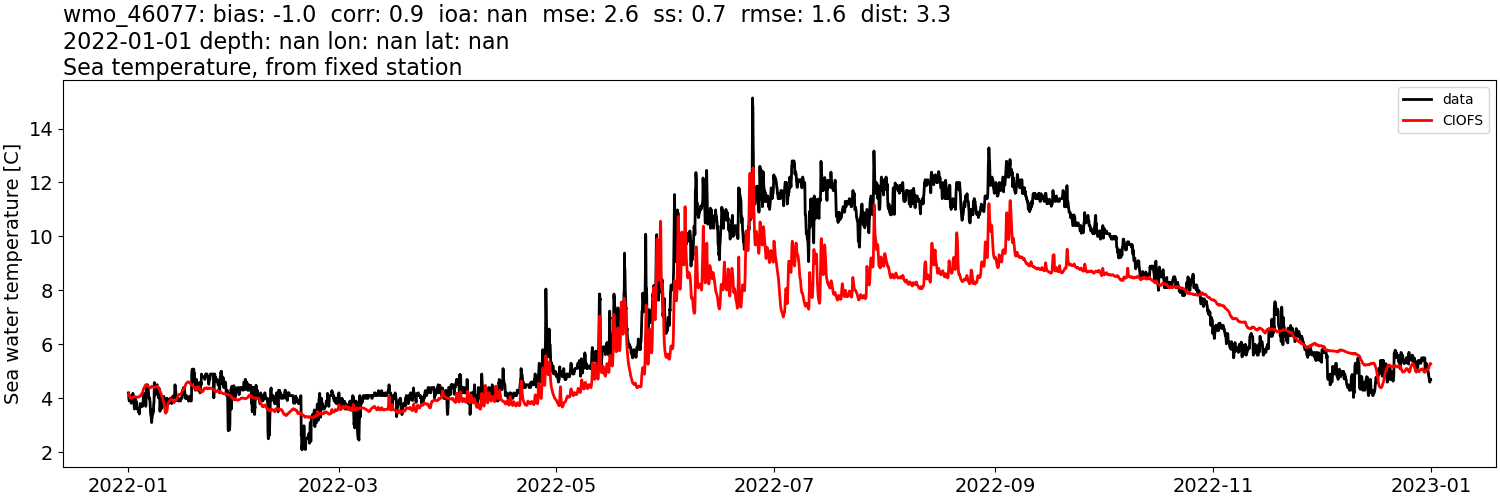
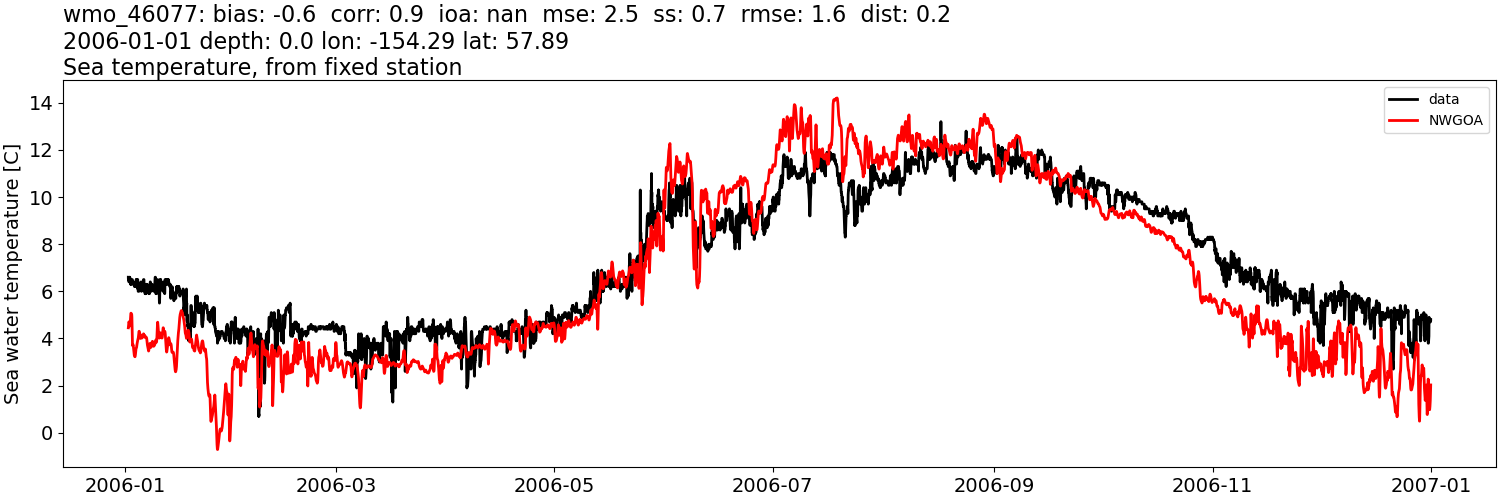
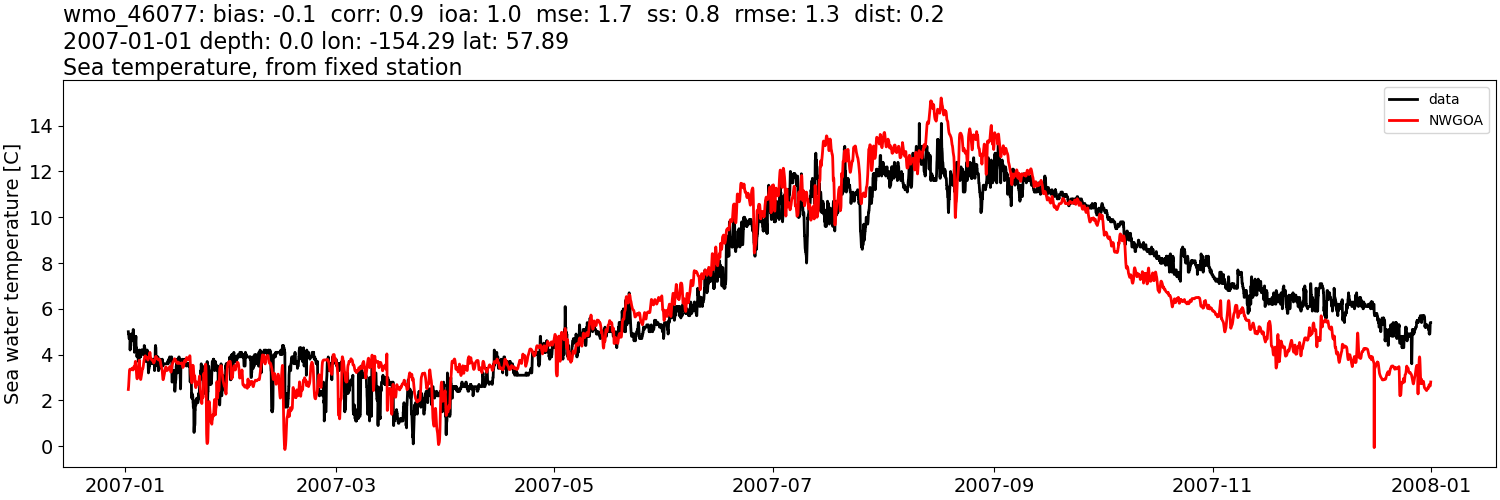
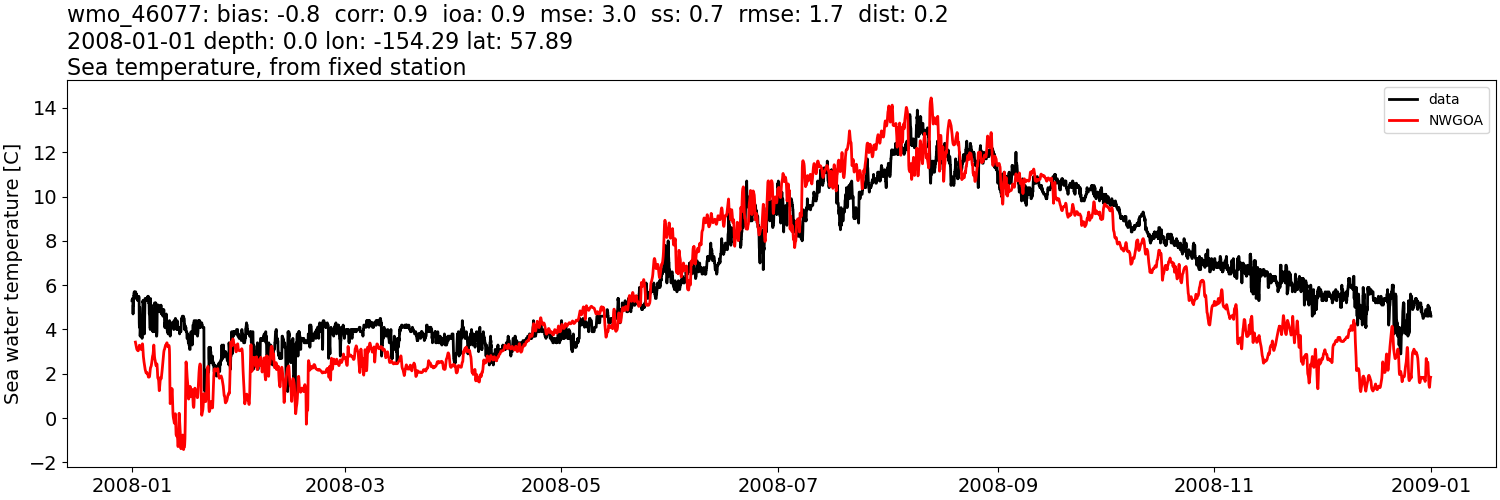
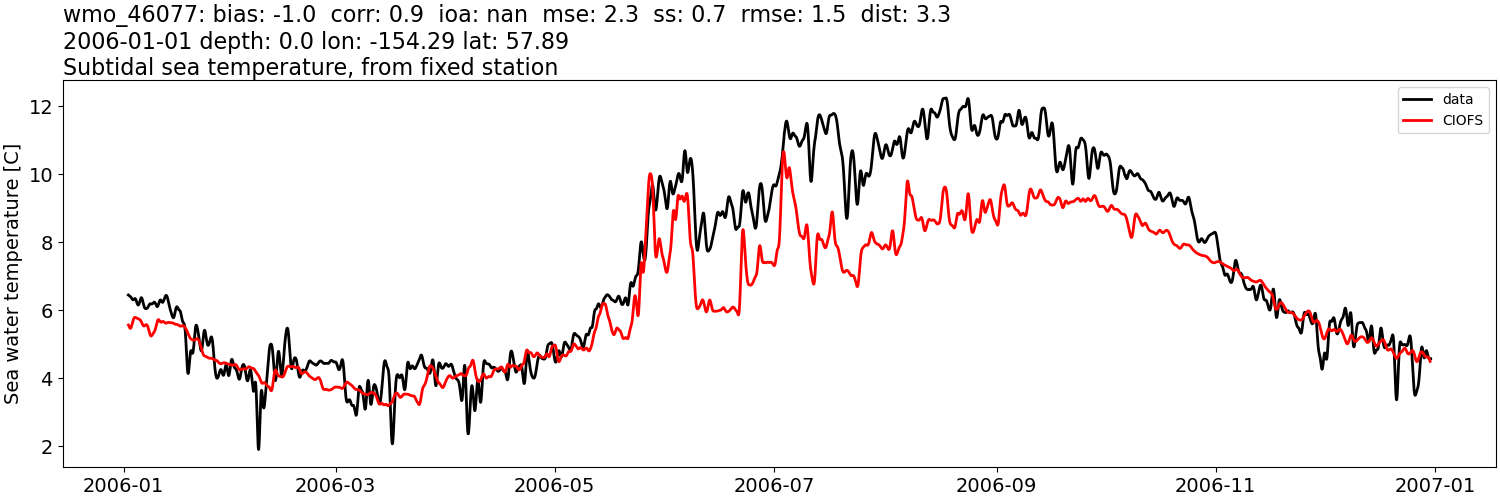
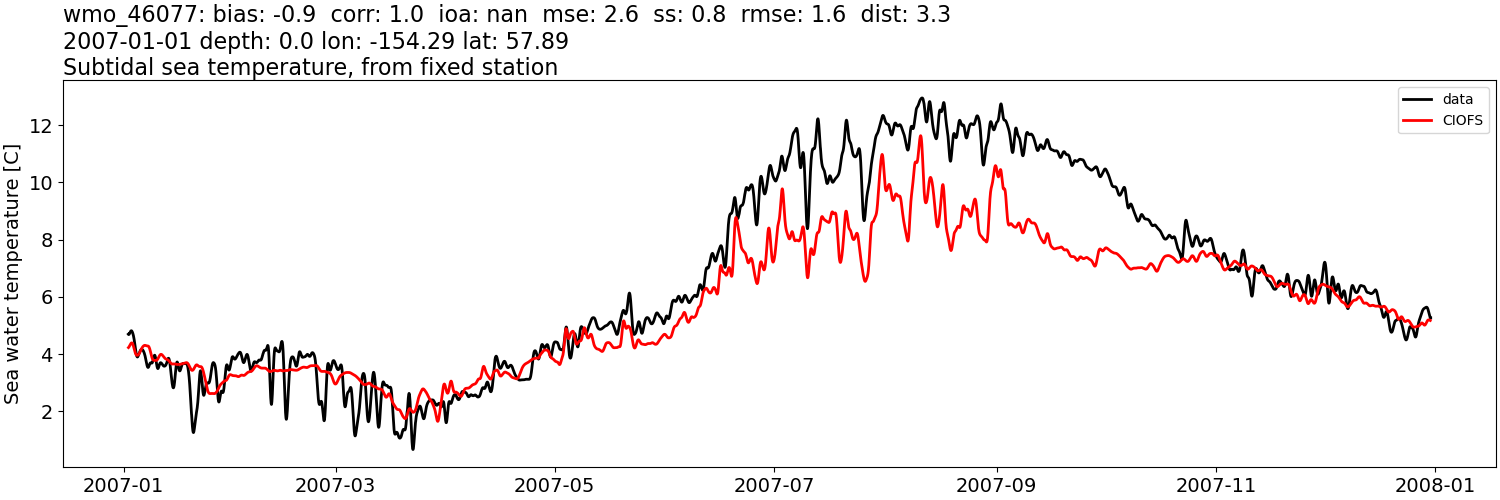
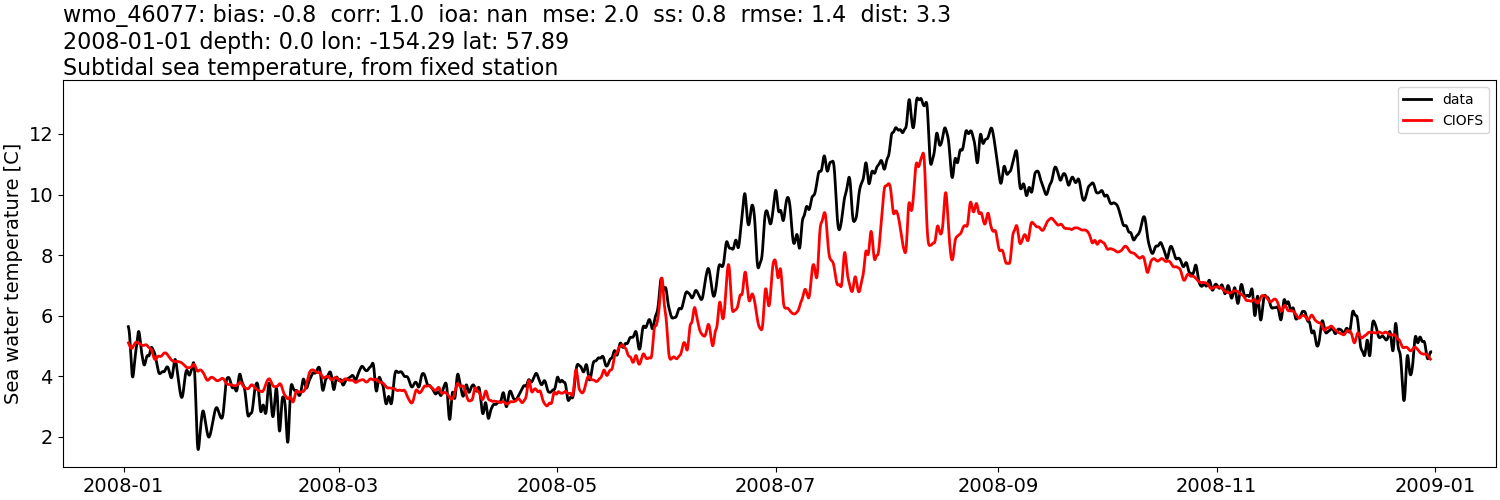
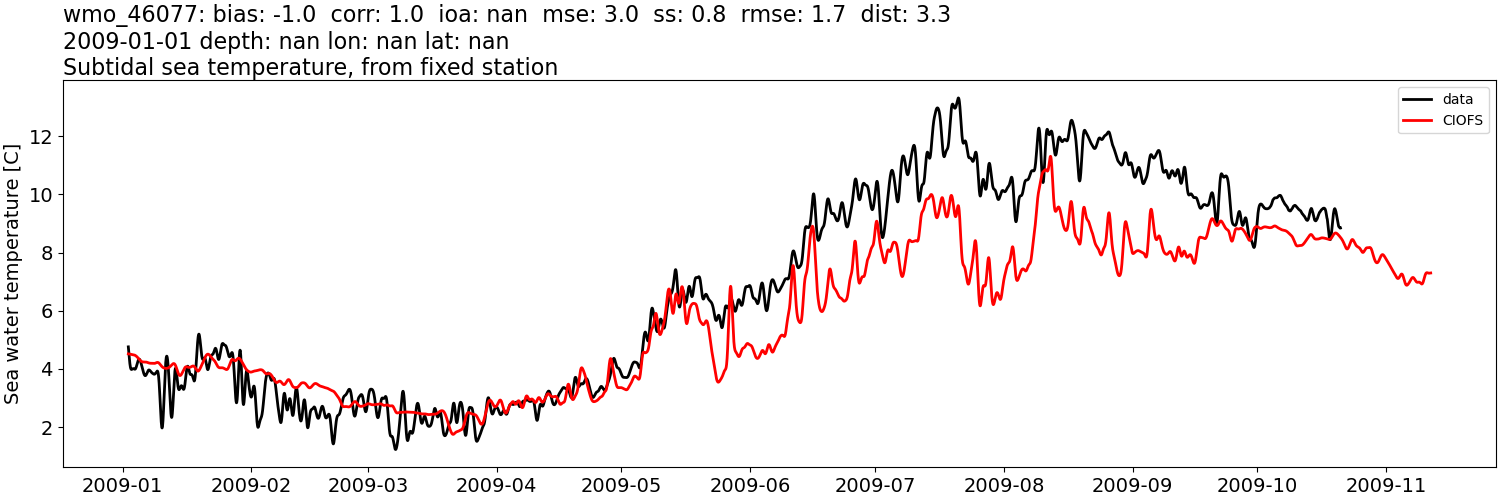
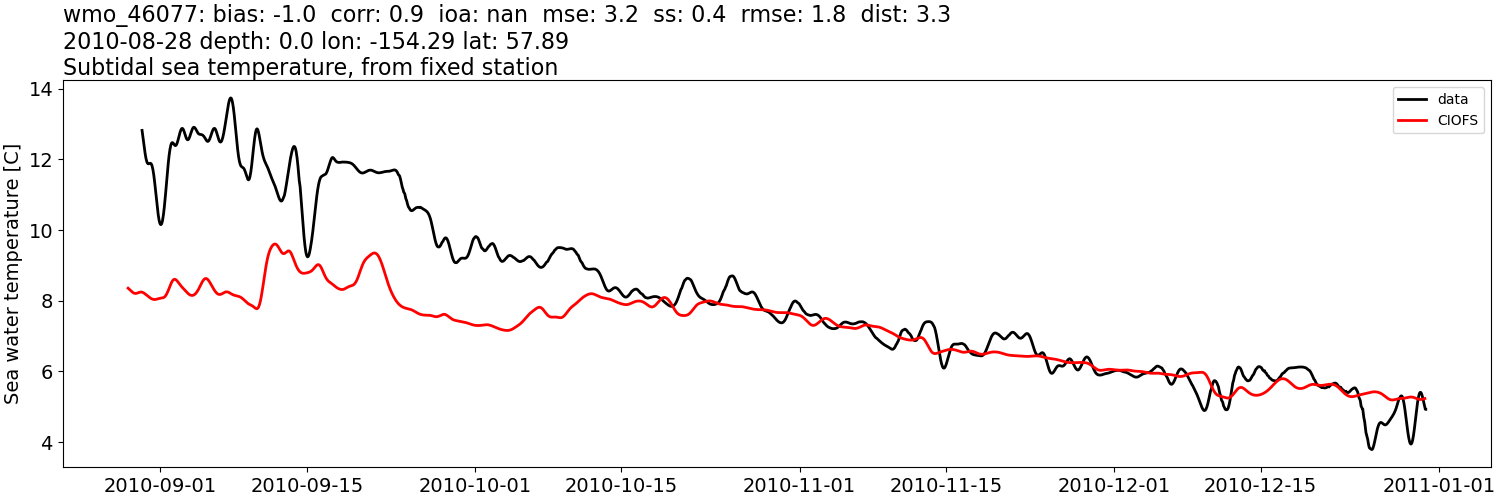
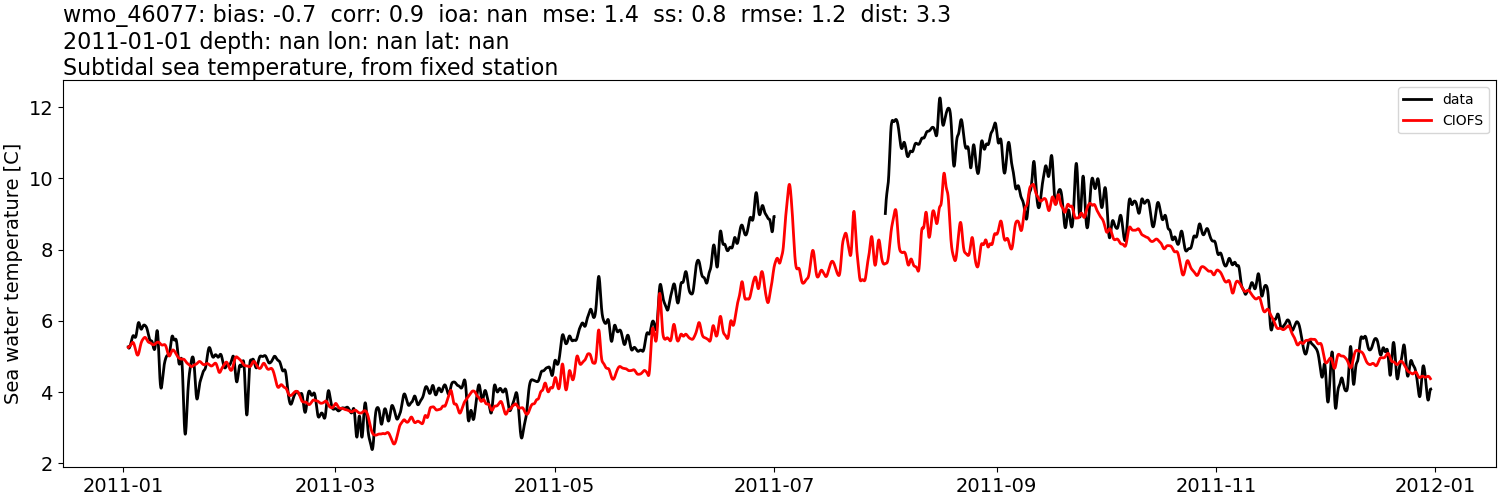
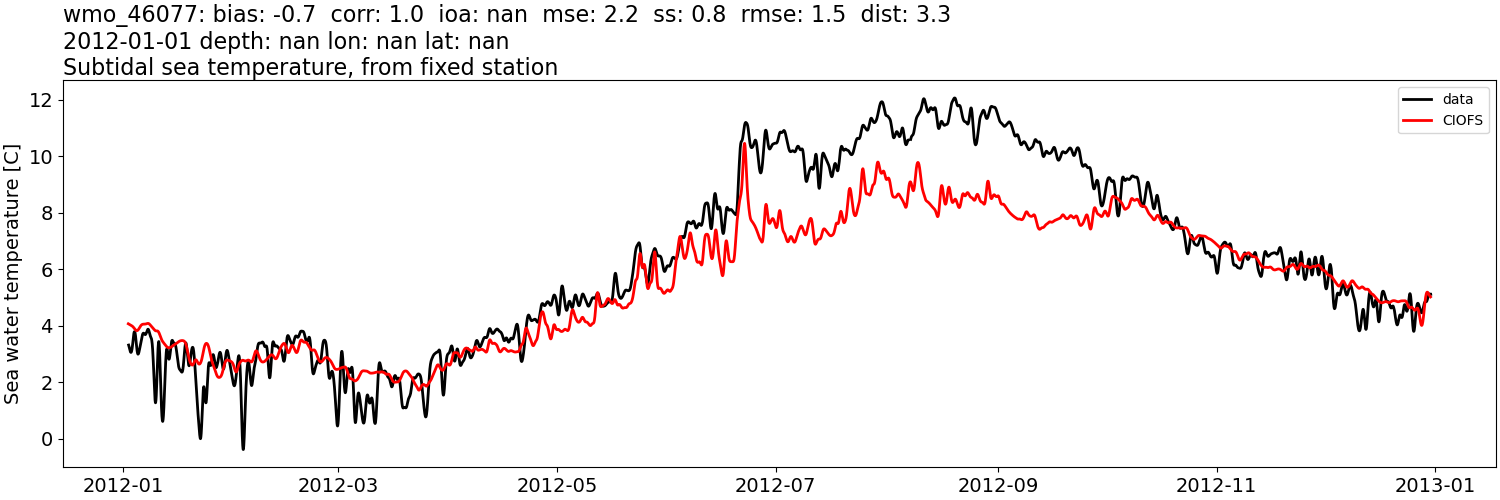
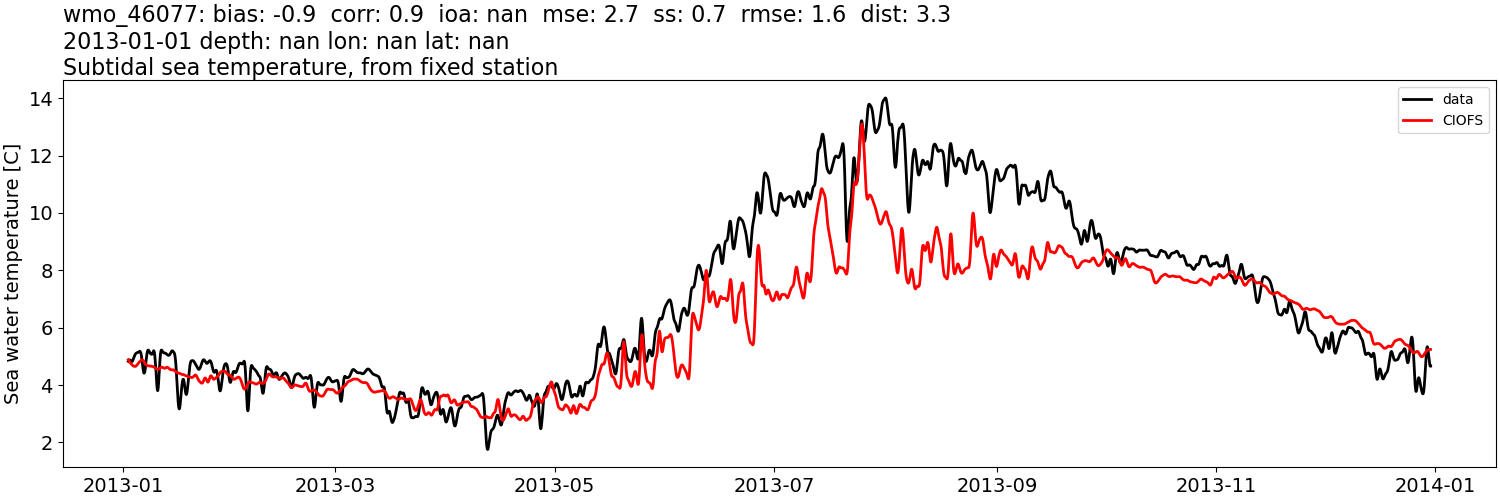
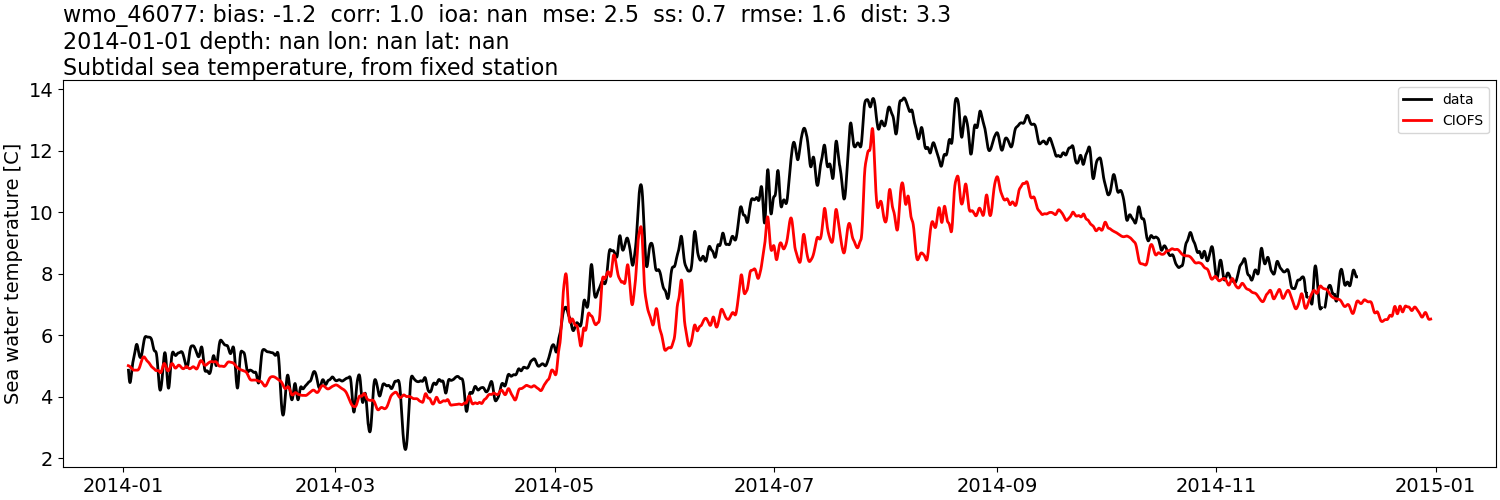
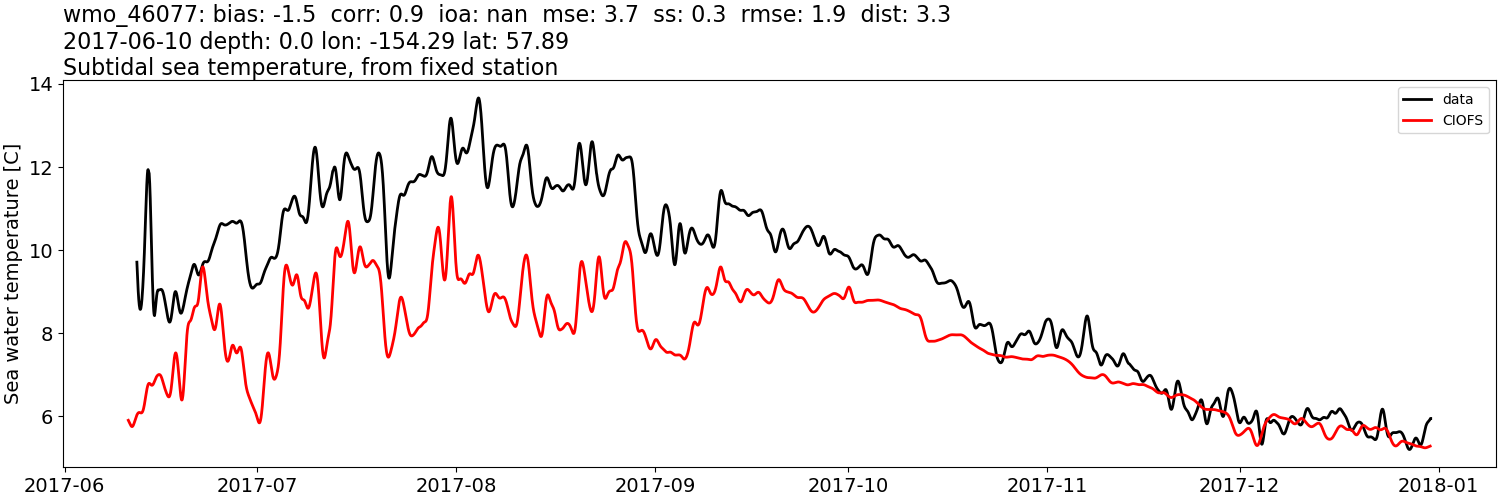
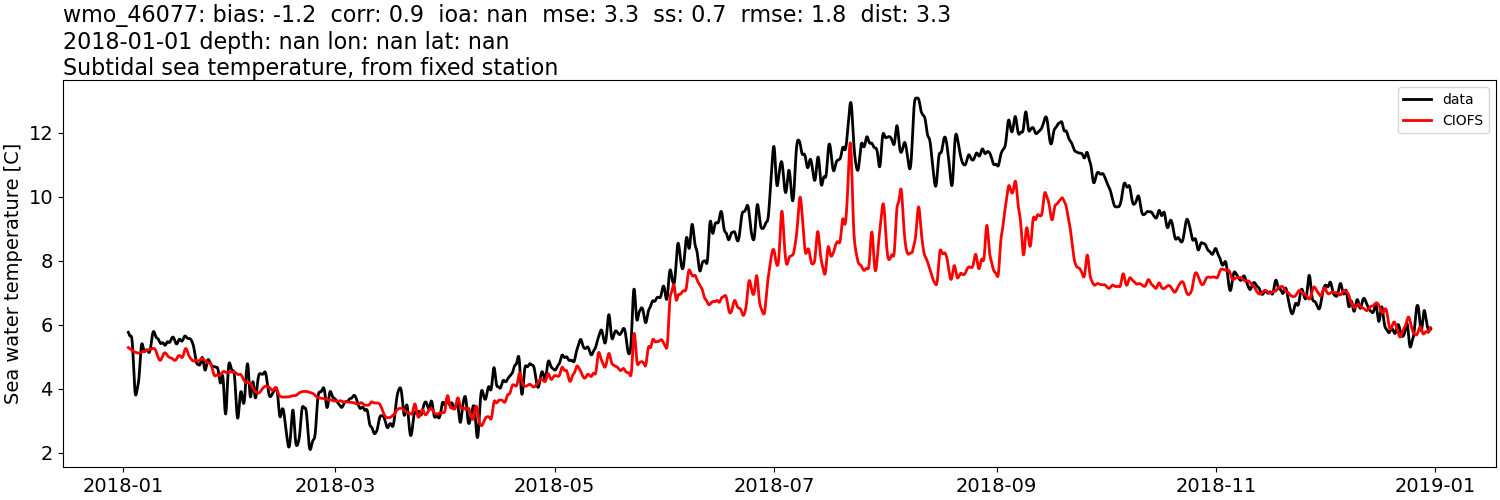
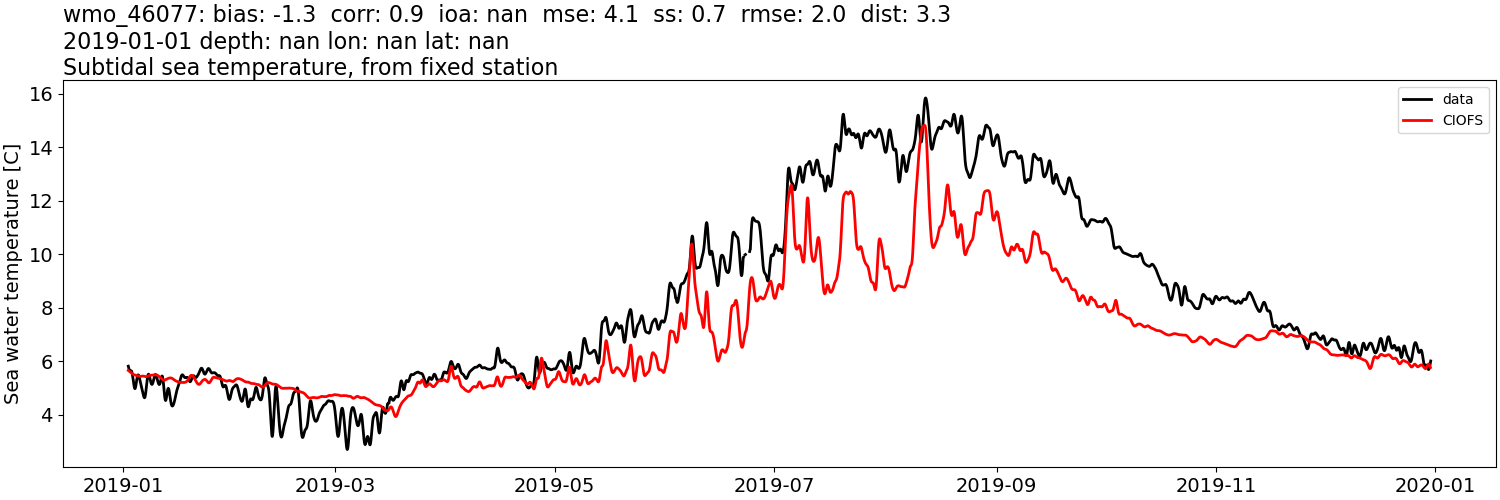
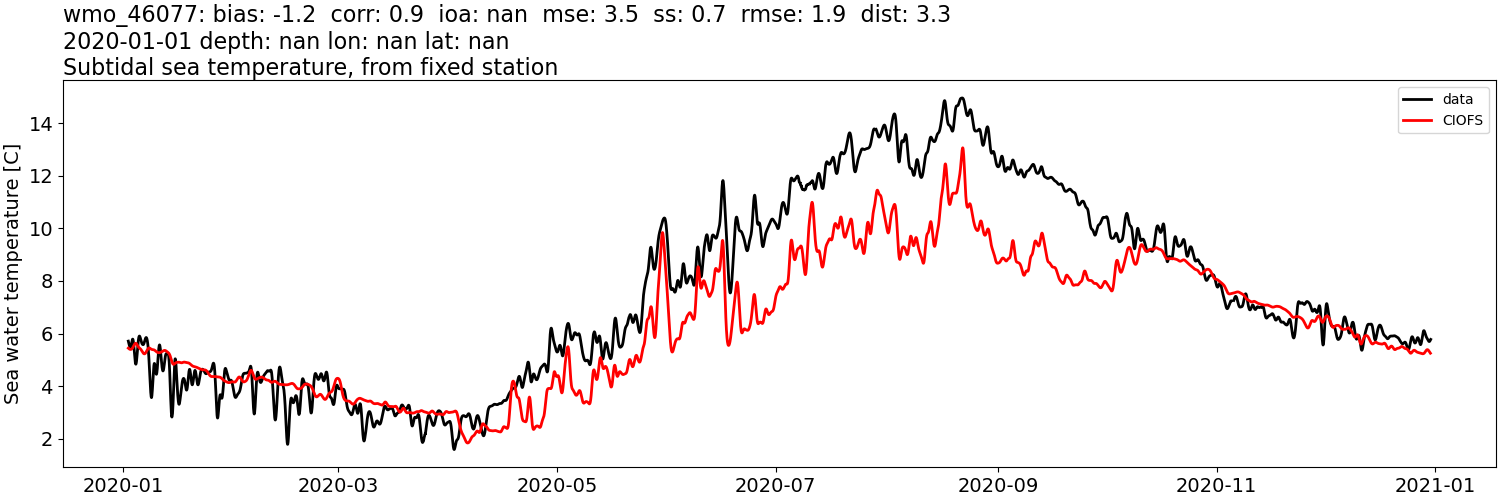
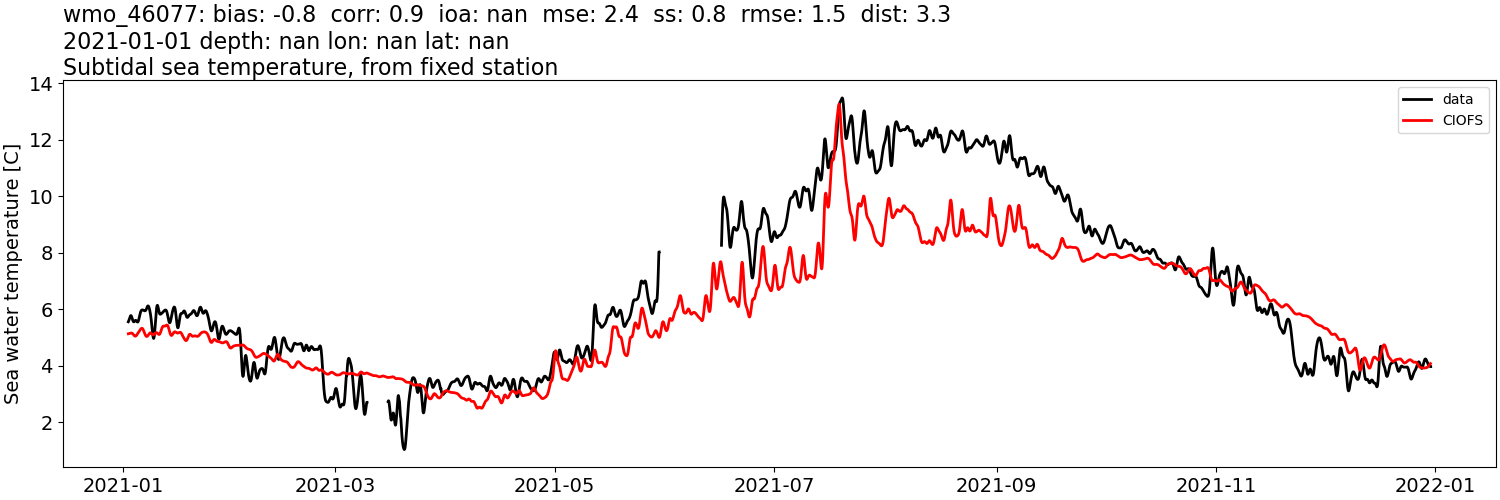
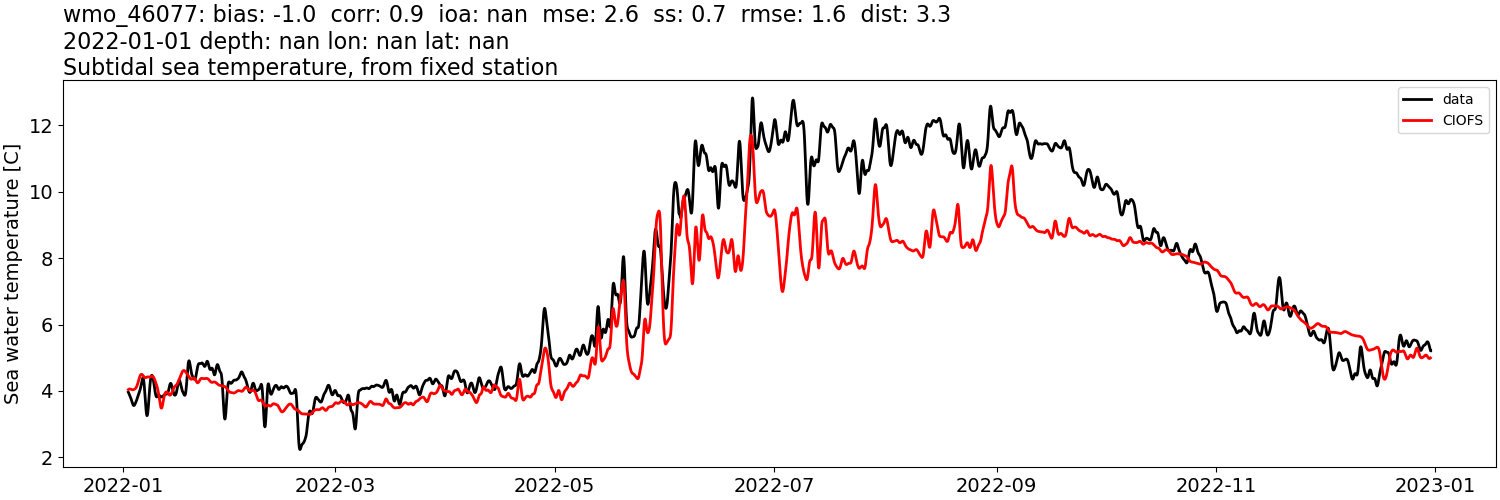
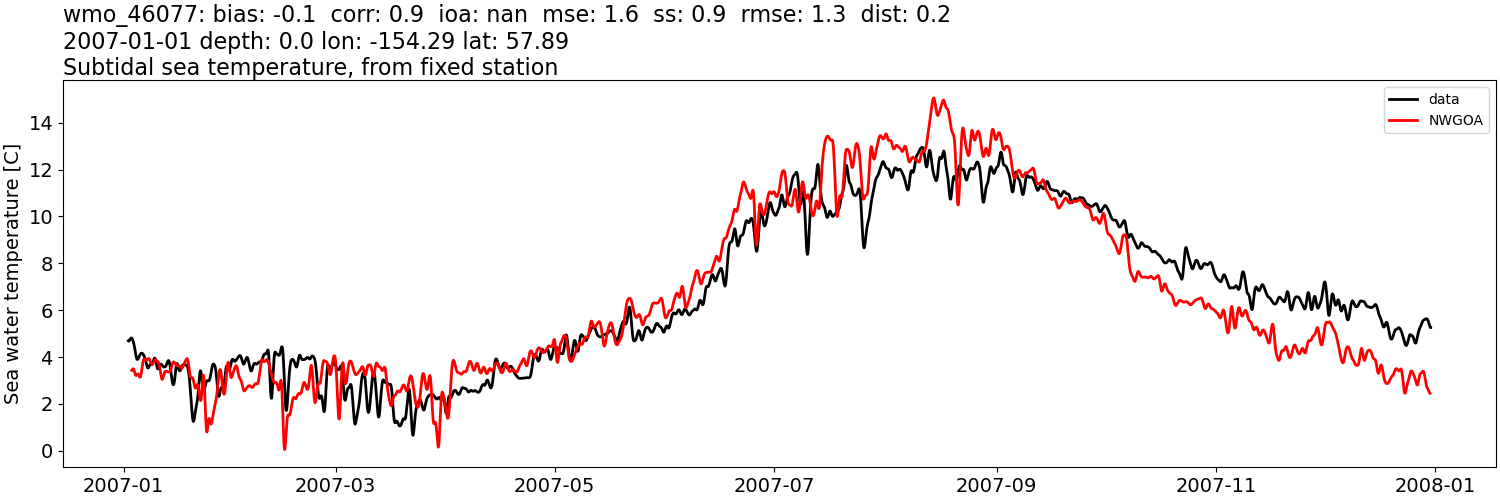
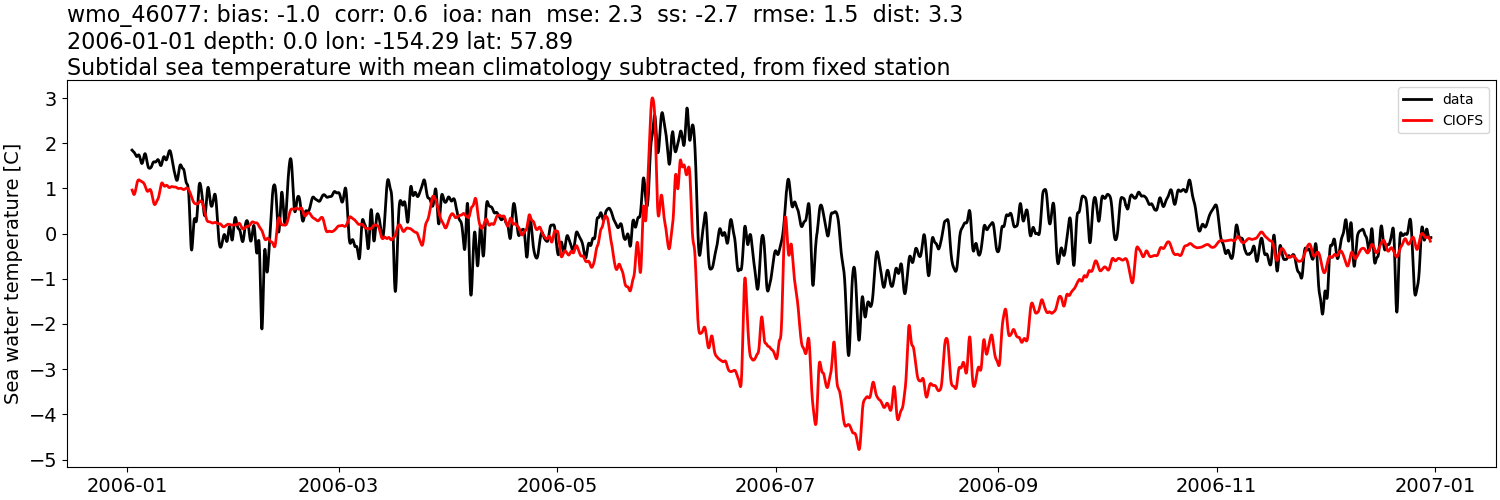
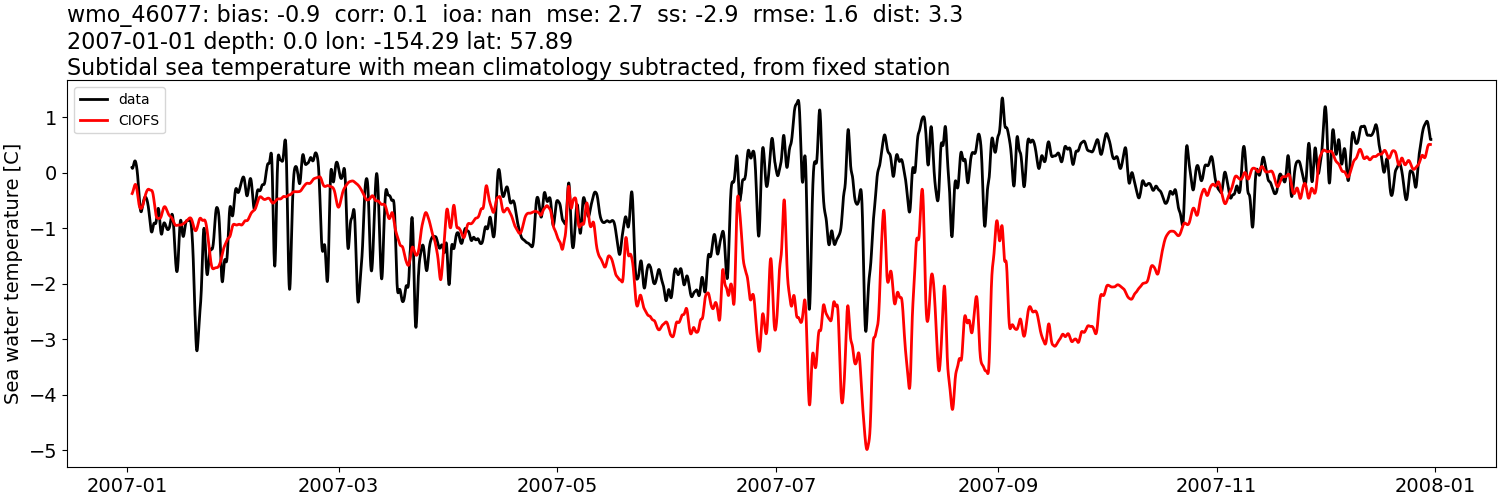
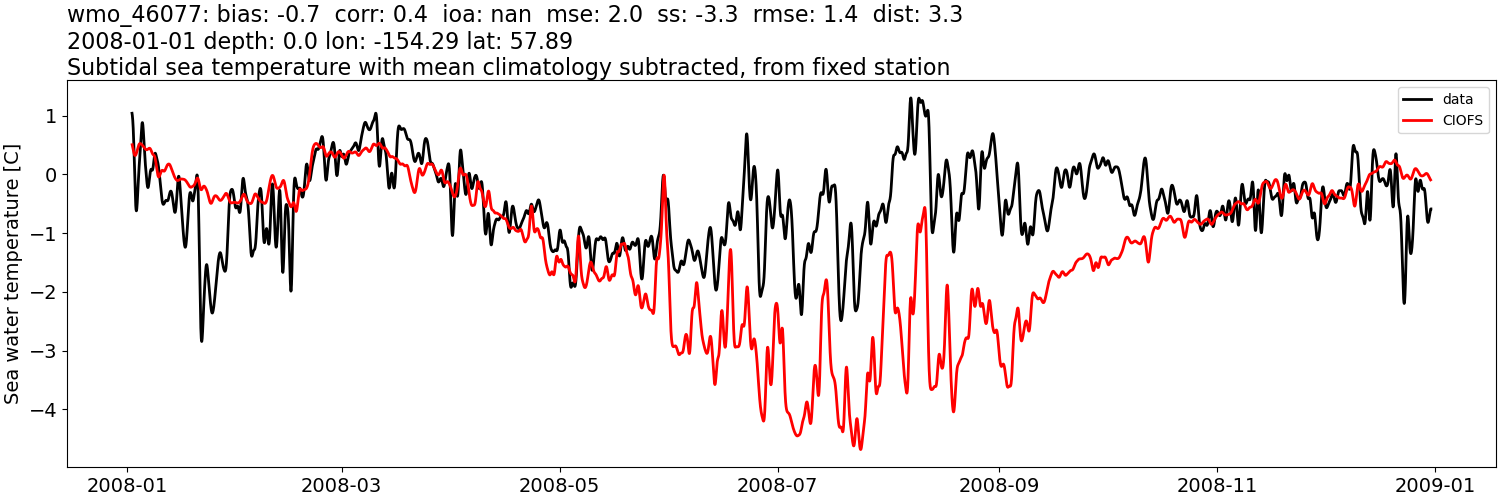
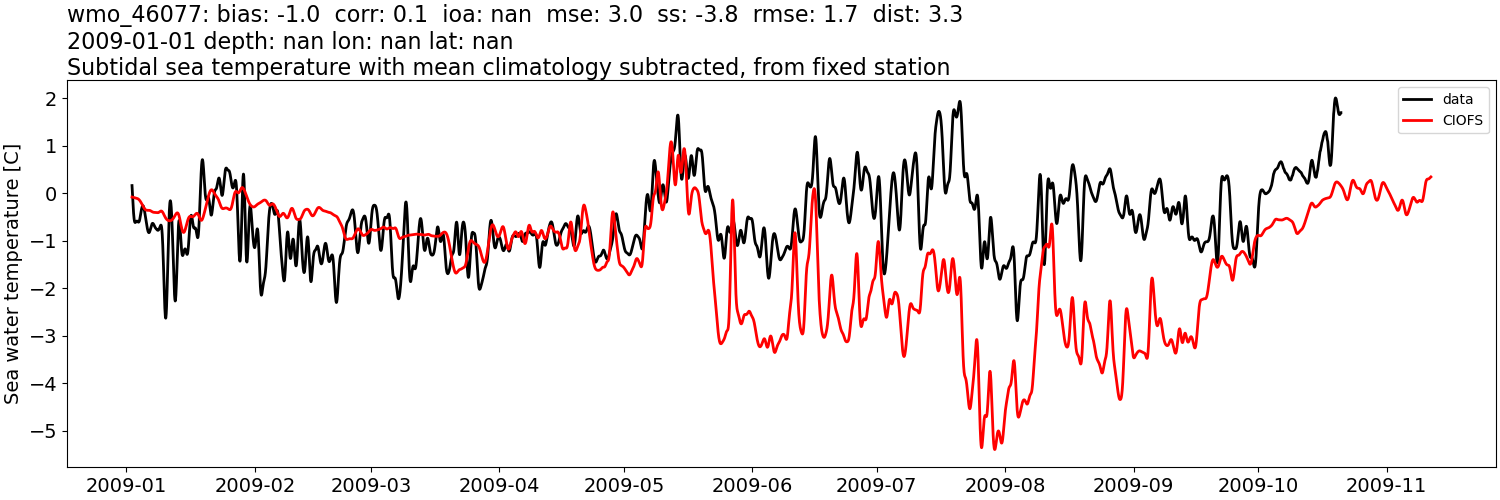
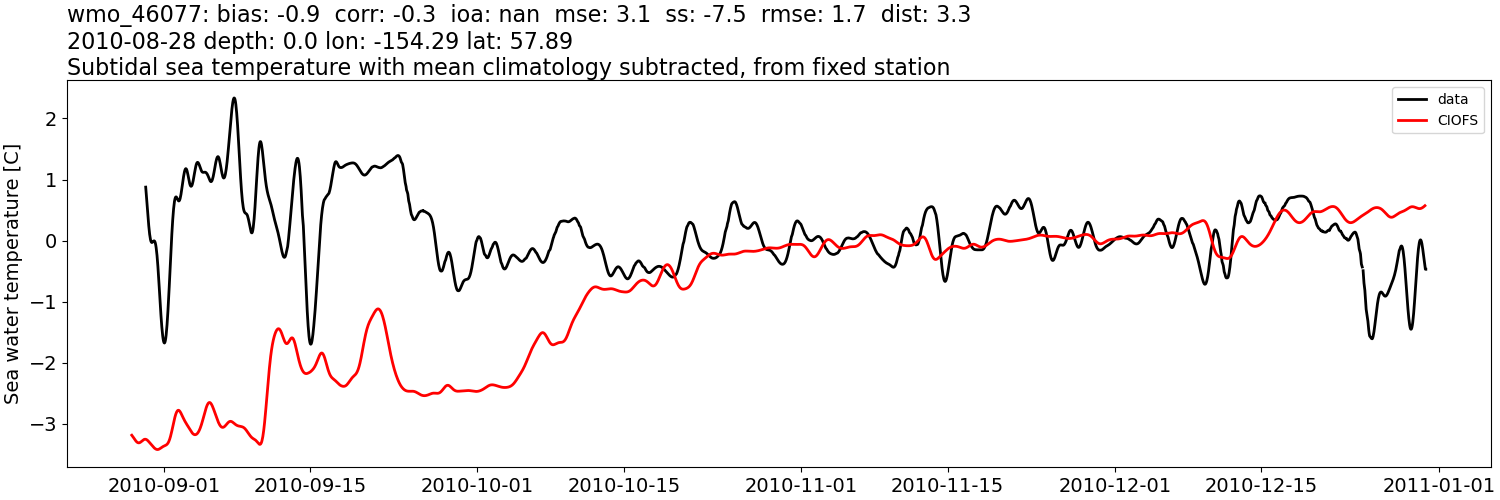
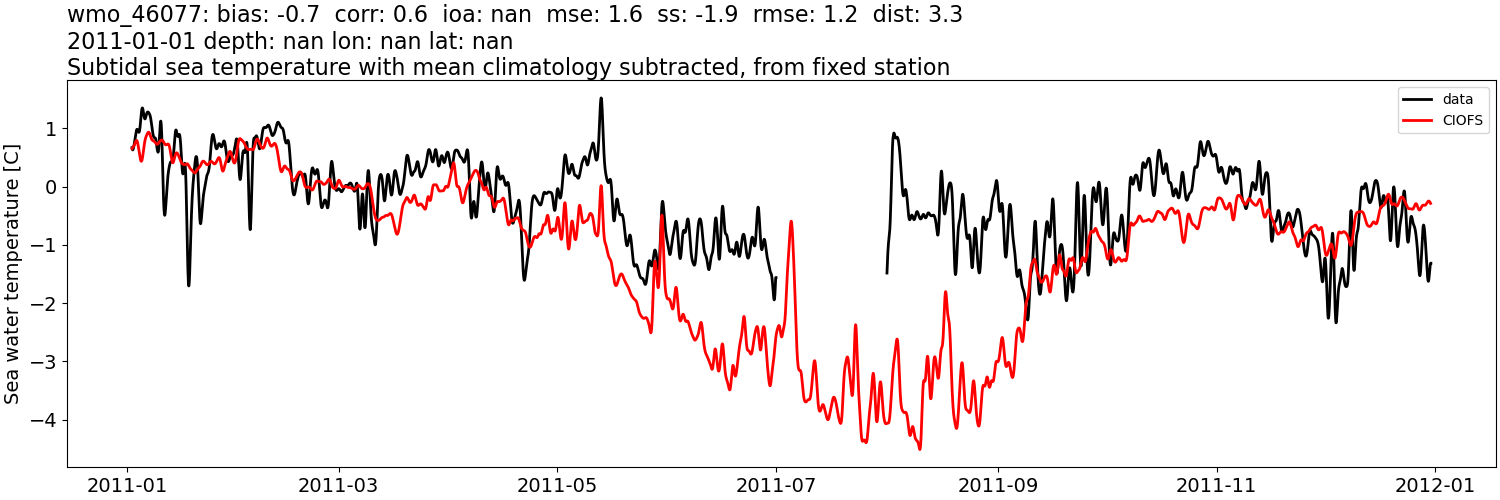
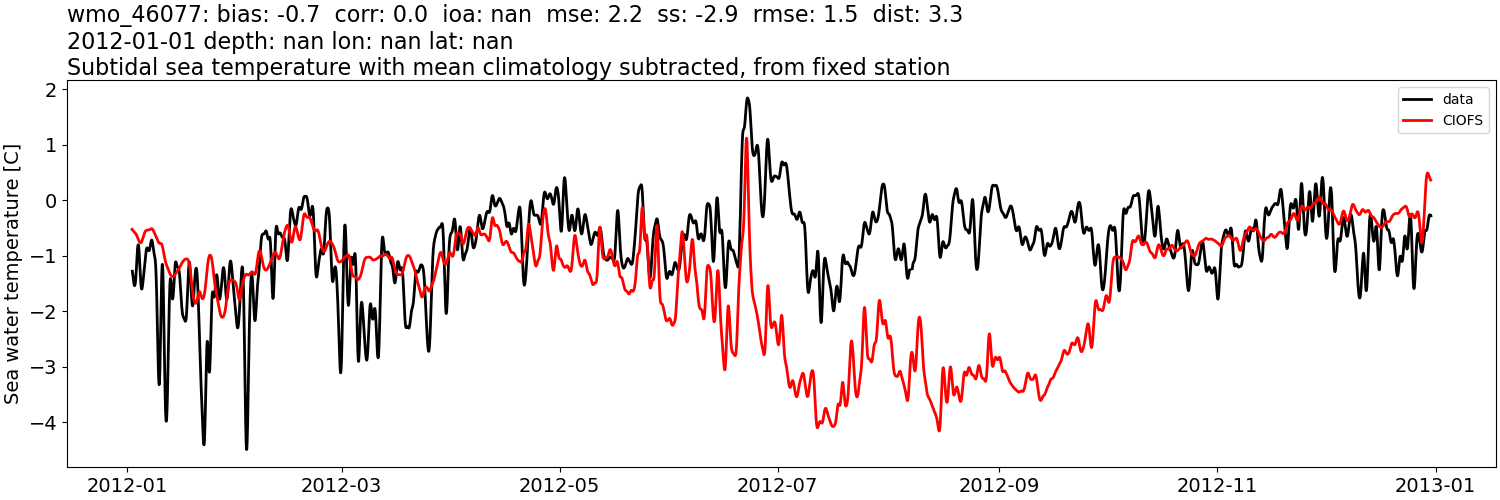
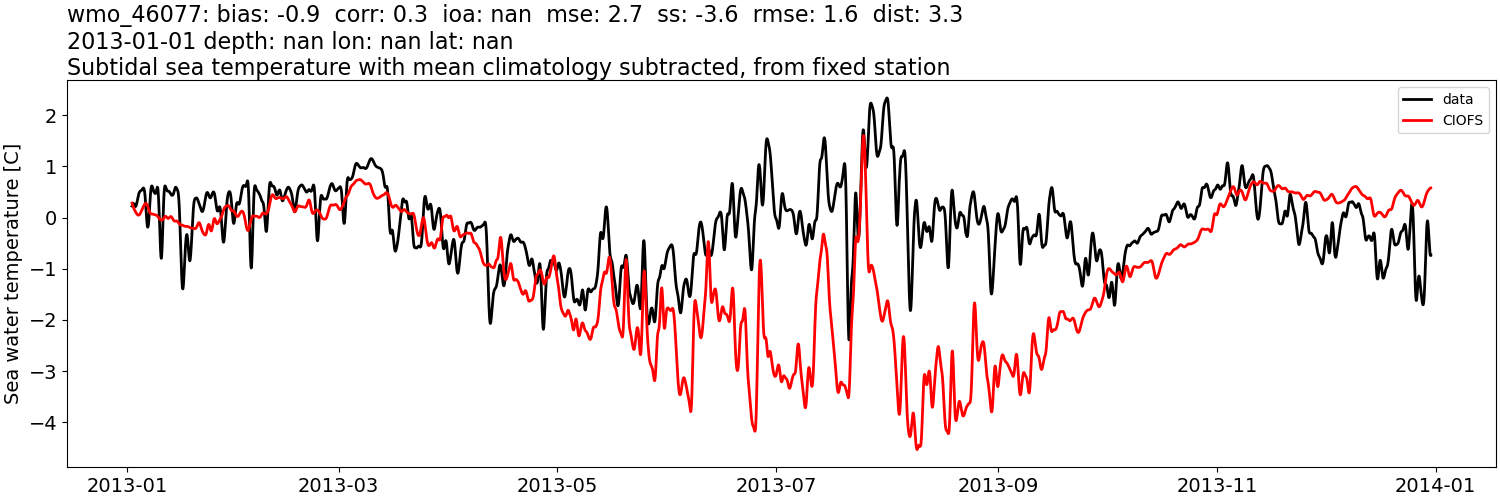
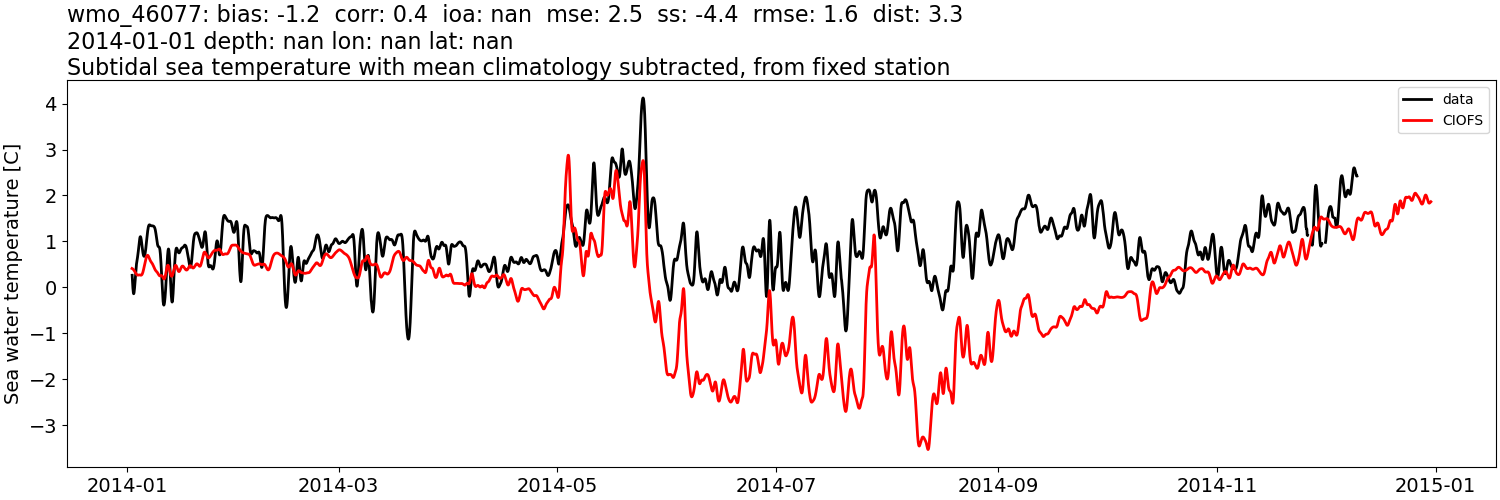
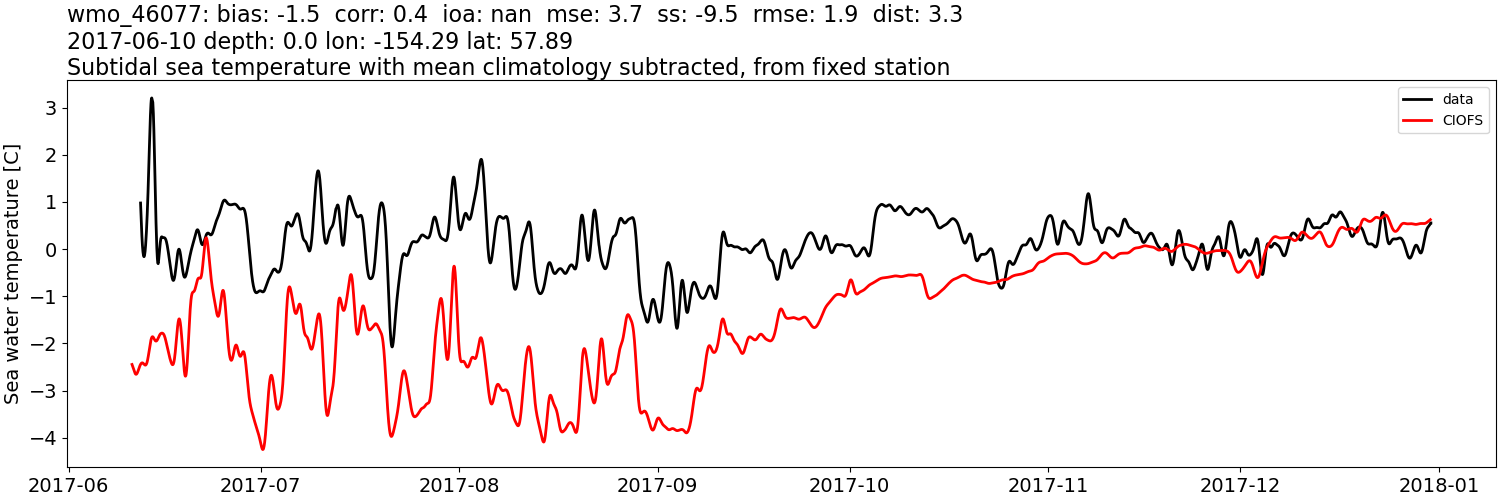
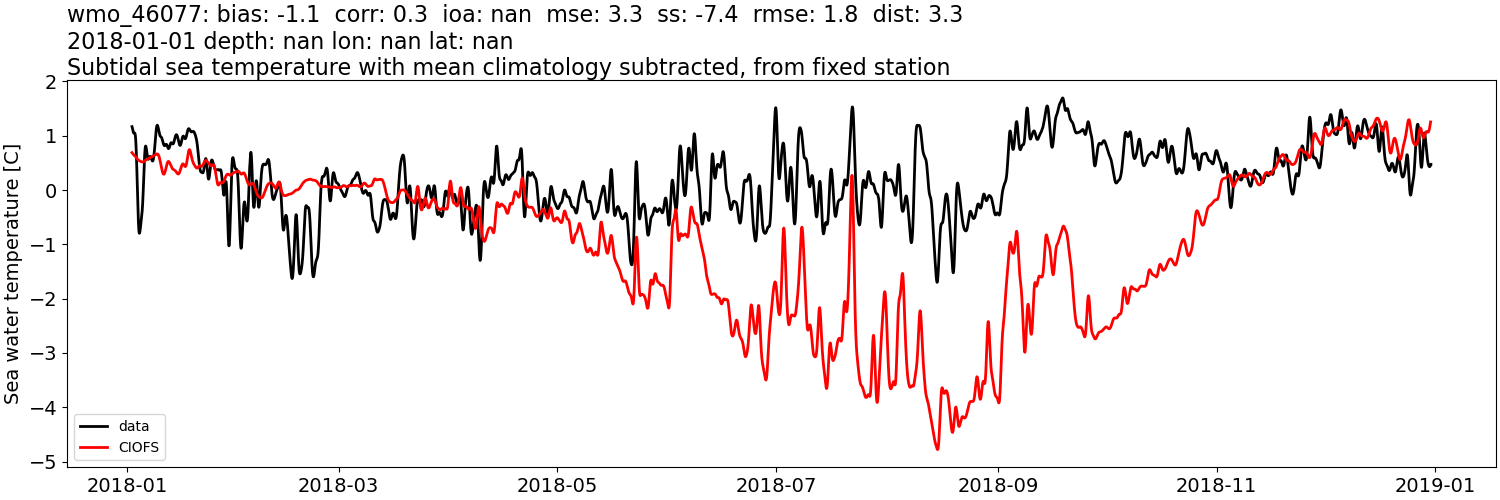
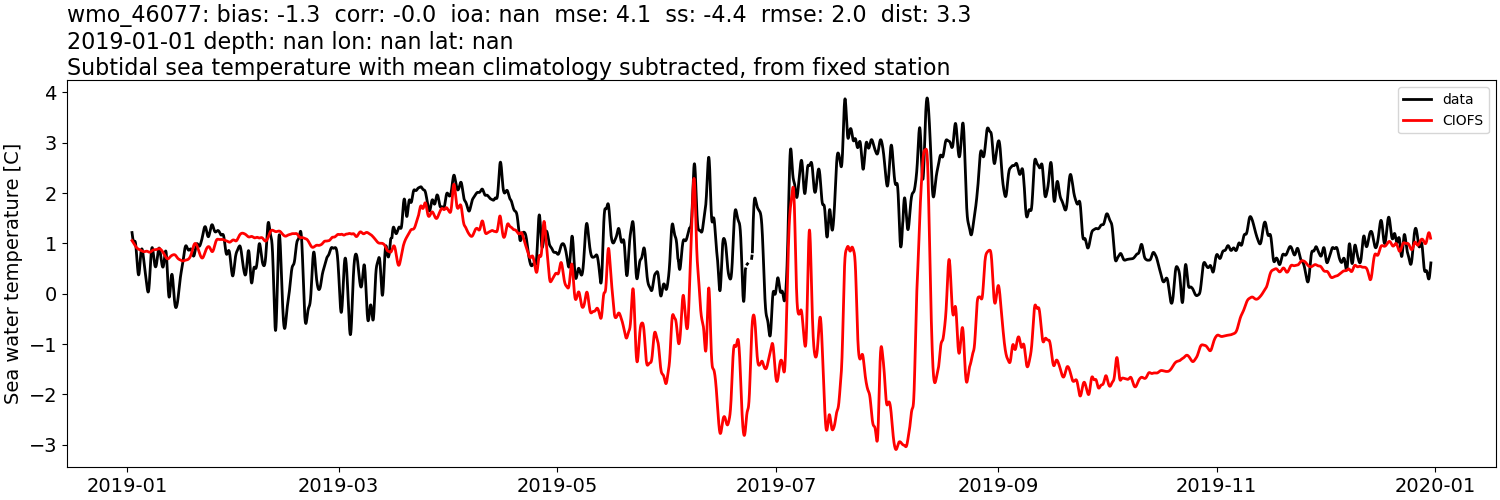
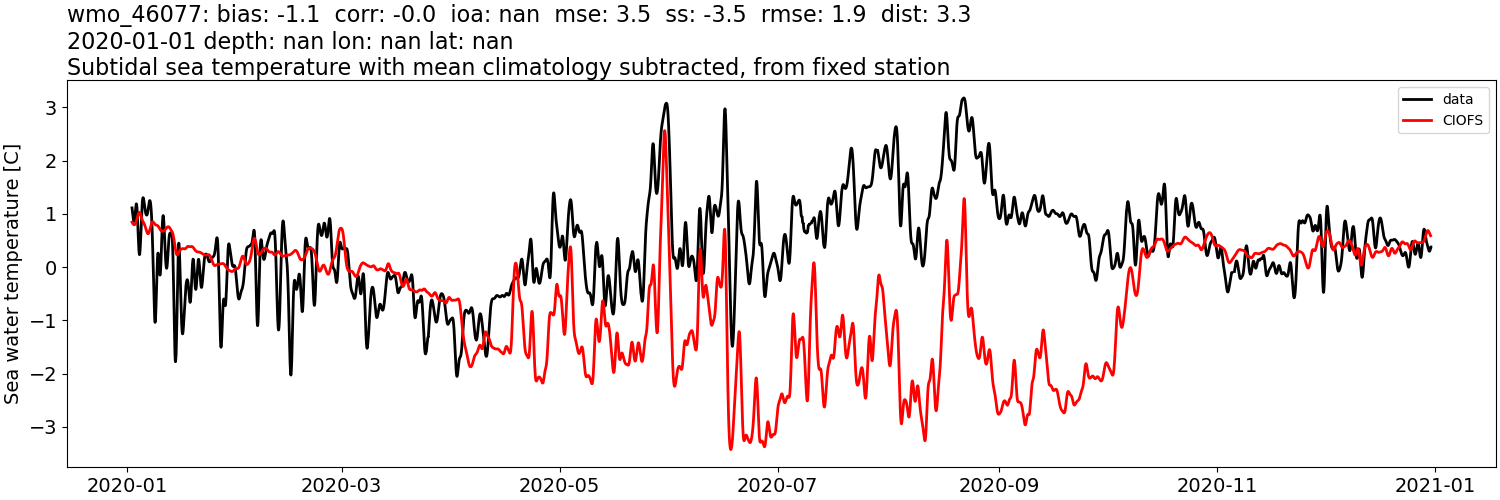
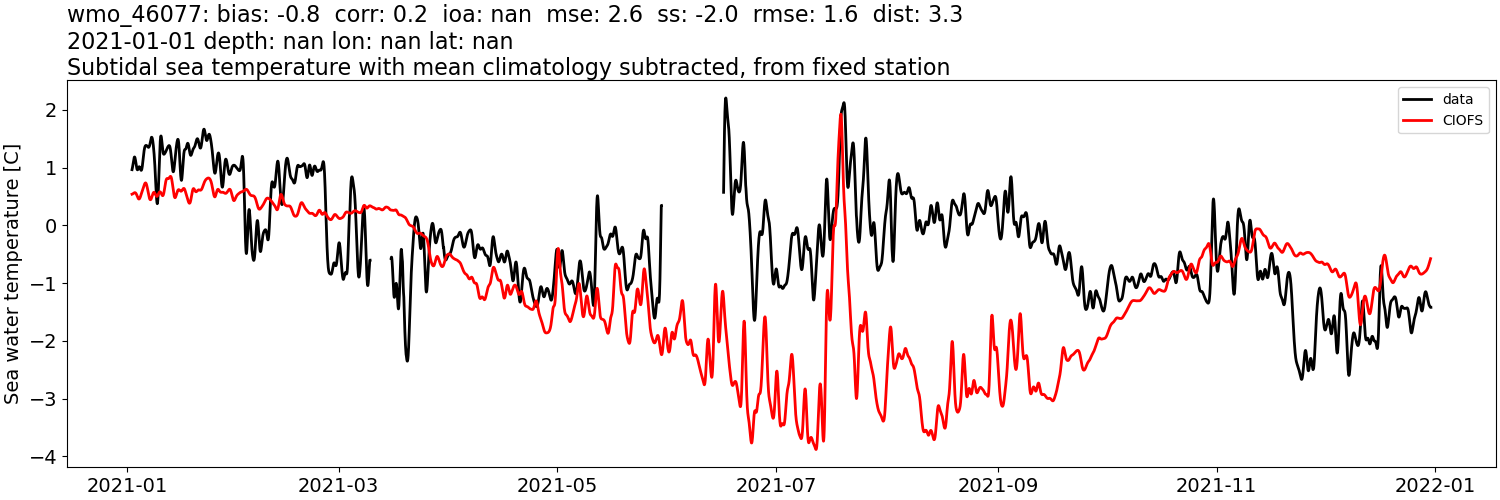
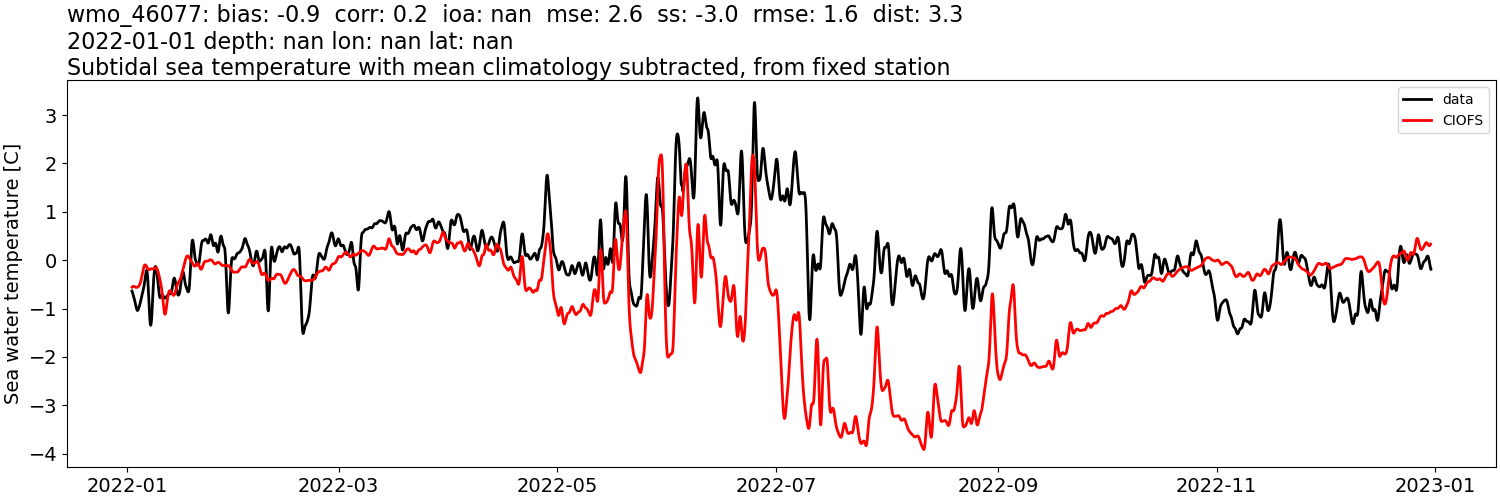
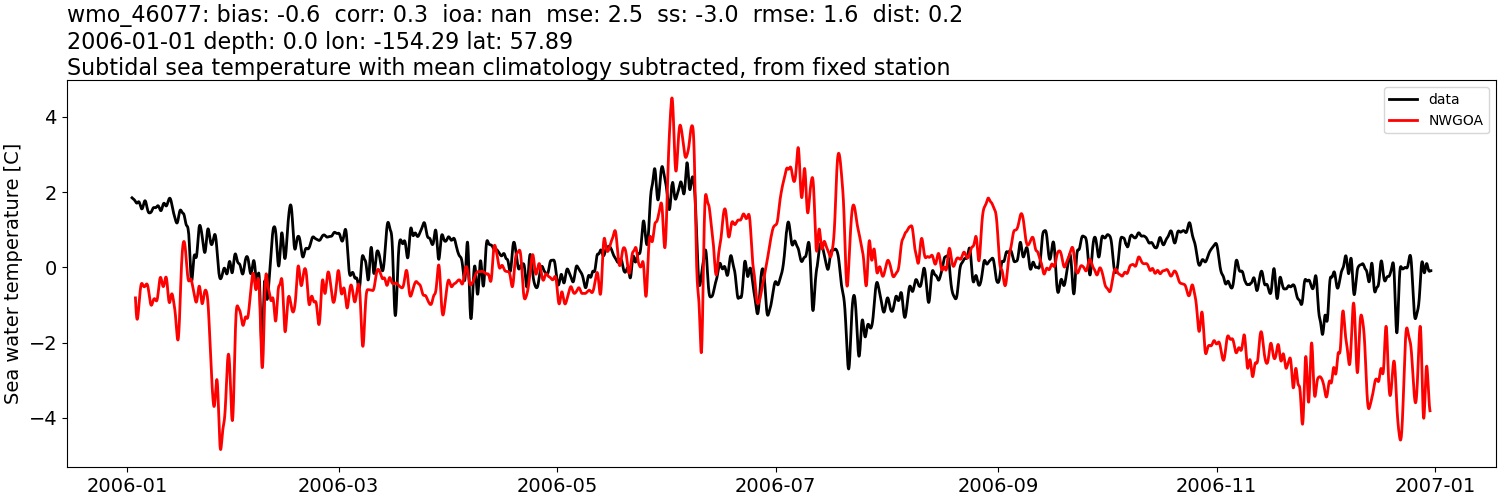
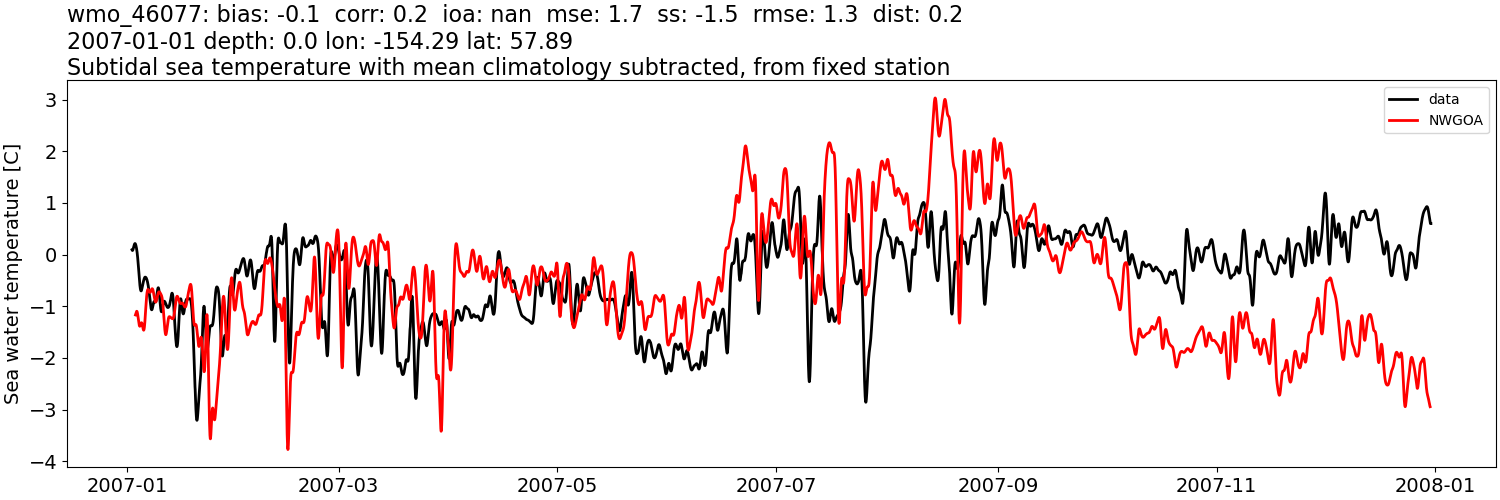
wmo_46077#
Sea water temperature:#
CIOFS#
Comparison plots by year
2006
2007
2008
2009
2010
2011
2012
2013
2014
2017
2018
2019
2020
2021
2022
NWGOA#
Comparison plots by year
2006
2007
2008
Sea water temperature: tidally-filtered#
CIOFS#
Comparison plots by year
2006
2007
2008
2009
2010
2011
2012
2013
2014
2017
2018
2019
2020
2021
2022
NWGOA#
Comparison plots by year
2006

2007
2008

Sea water temperature: tidally-filtered, then monthly mean from data subtracted#
CIOFS#
Comparison plots by year
2006
2007
2008
2009
2010
2011
2012
2013
2014
2017
2018
2019
2020
2021
2022
NWGOA#
Comparison plots by year
2006
2007
2008