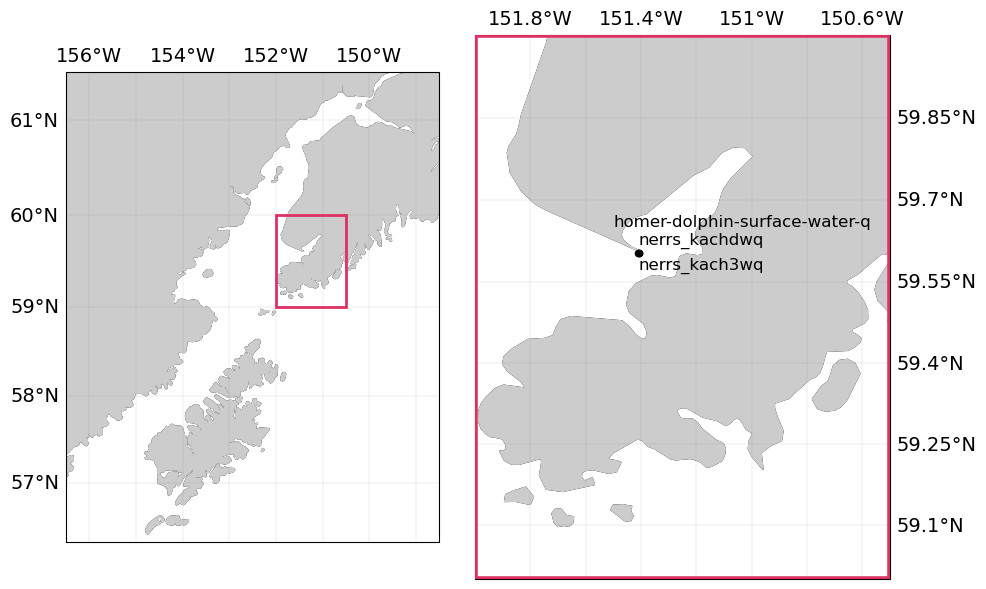
Moorings (KBNERR): Kachemak Bay, Homer stations#
moorings_kbnerr_homer
See the full dataset page for more information: Moorings (KBNERR): Kachemak Bay, Homer stations
Map of Moorings#
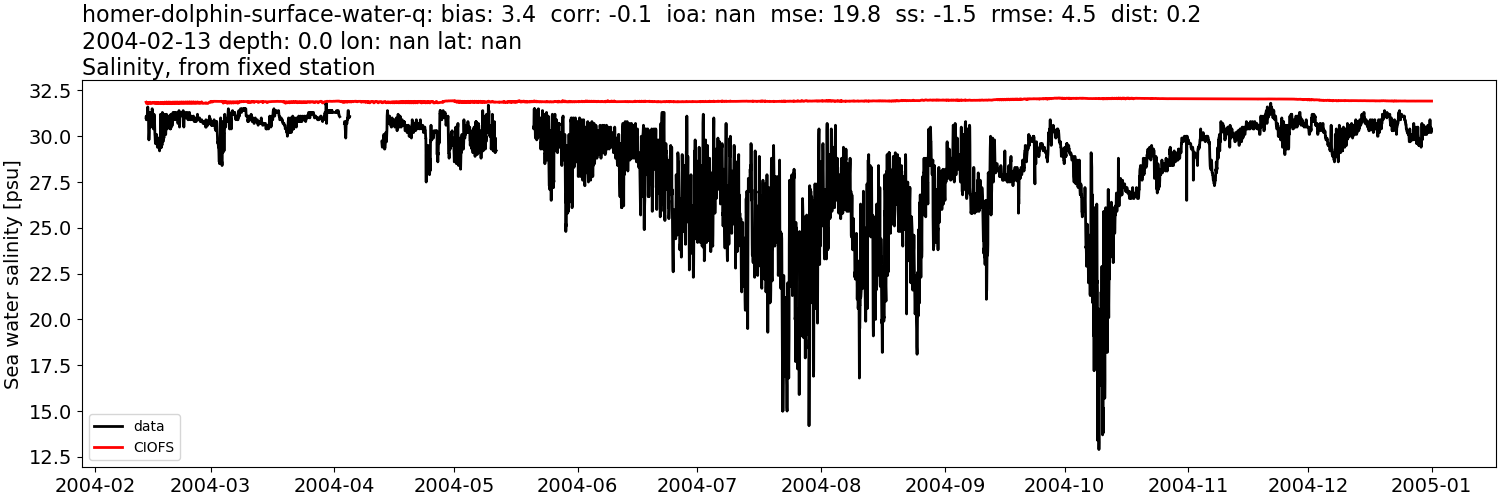
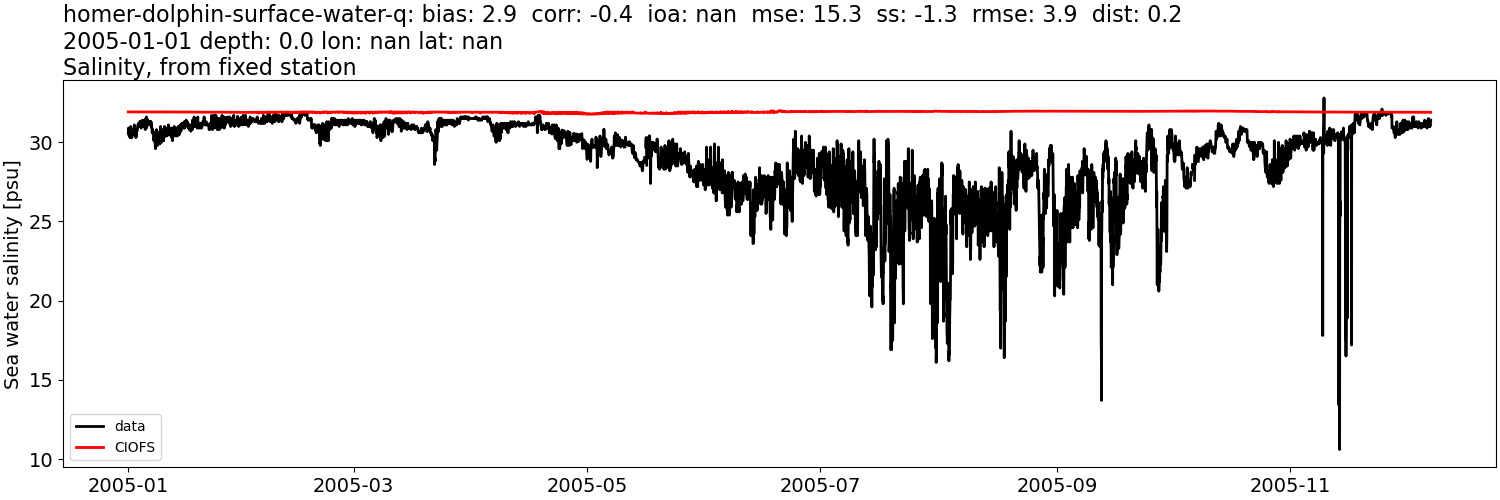
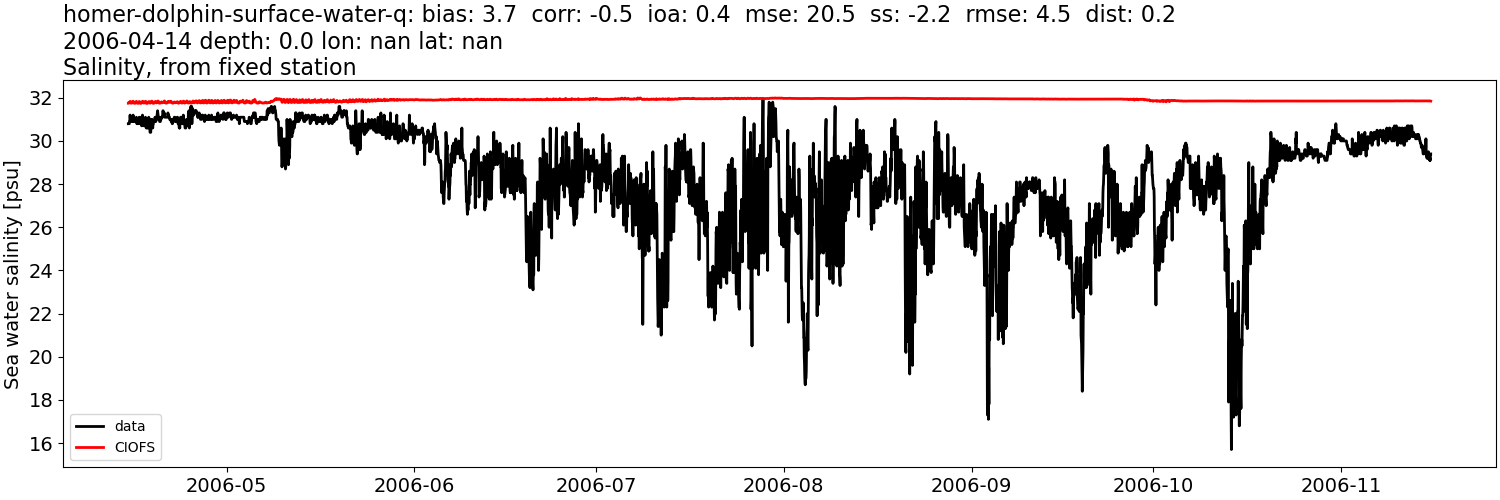
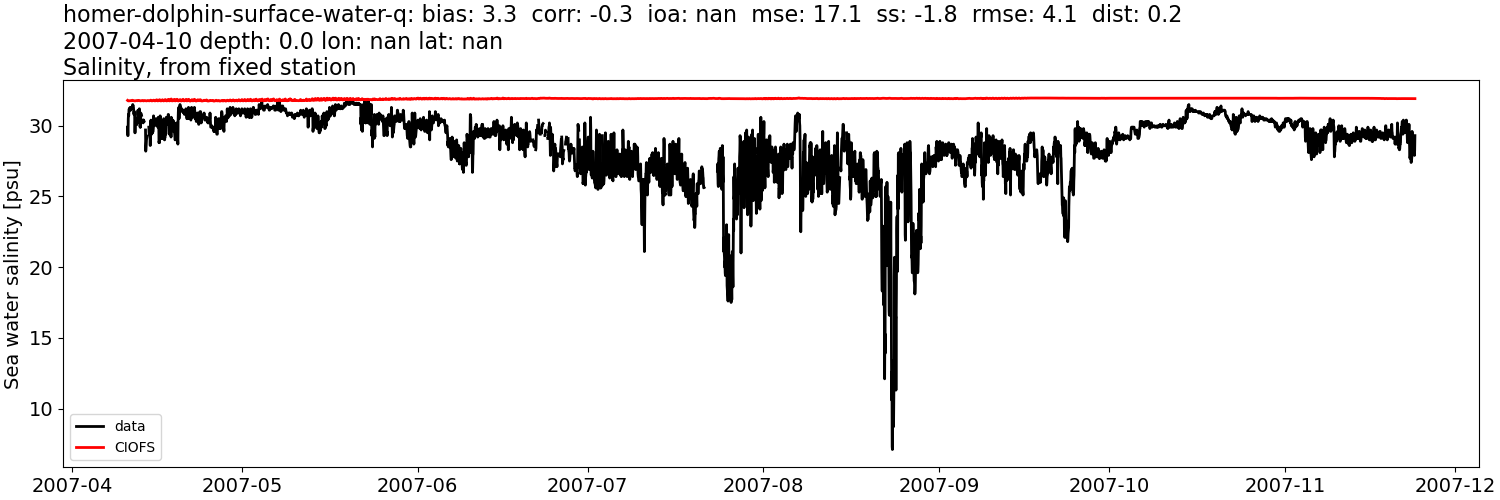
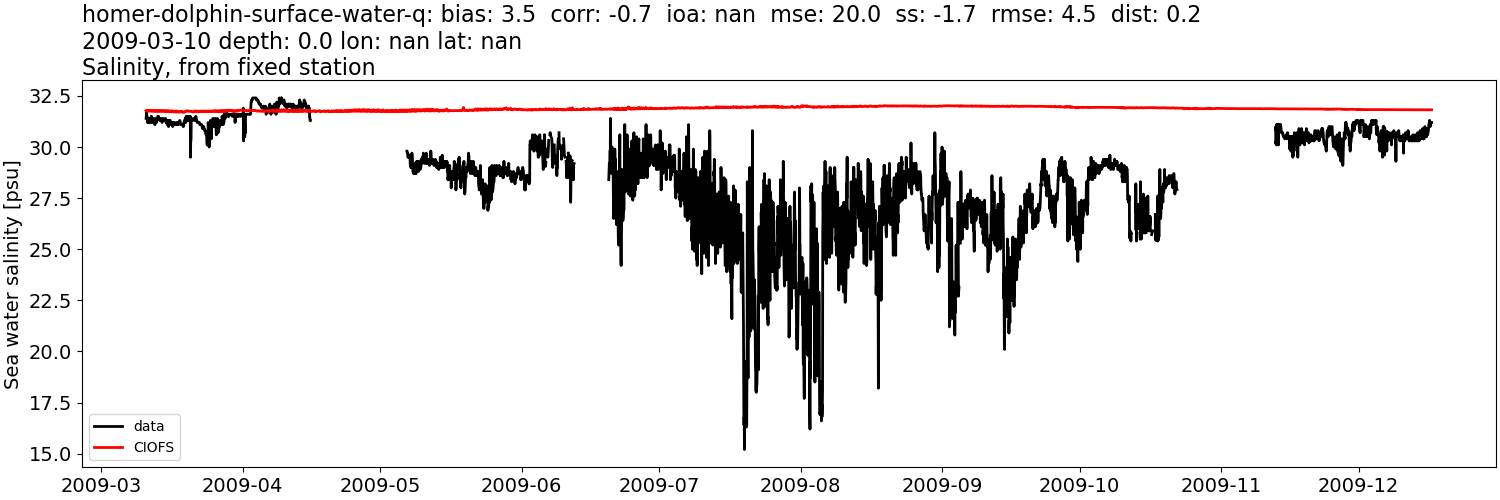
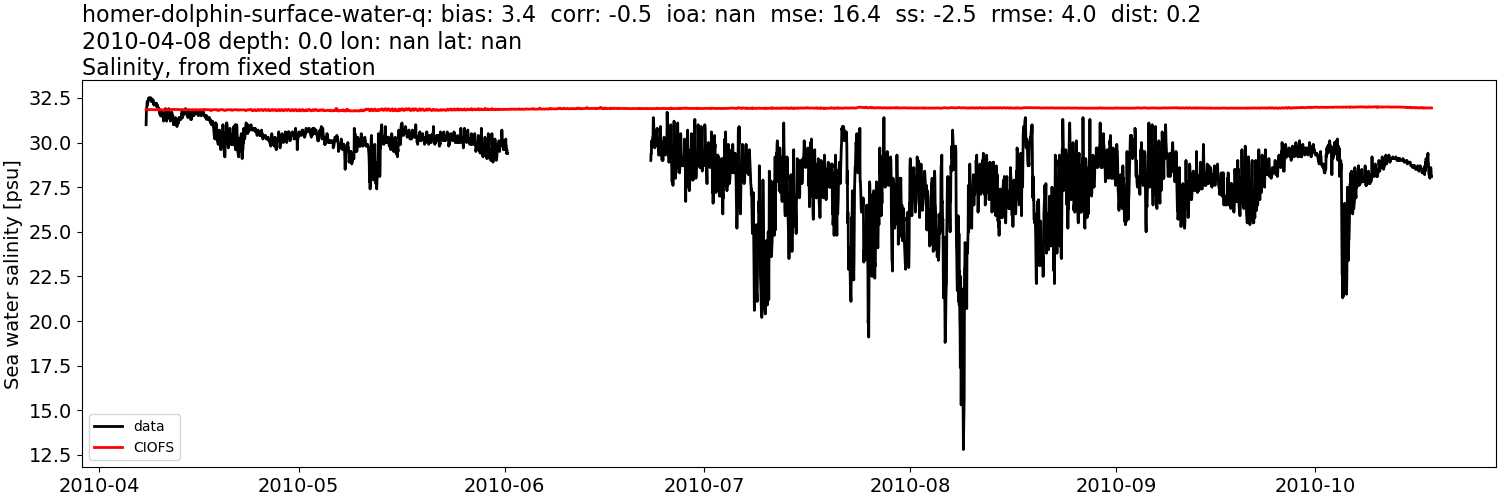
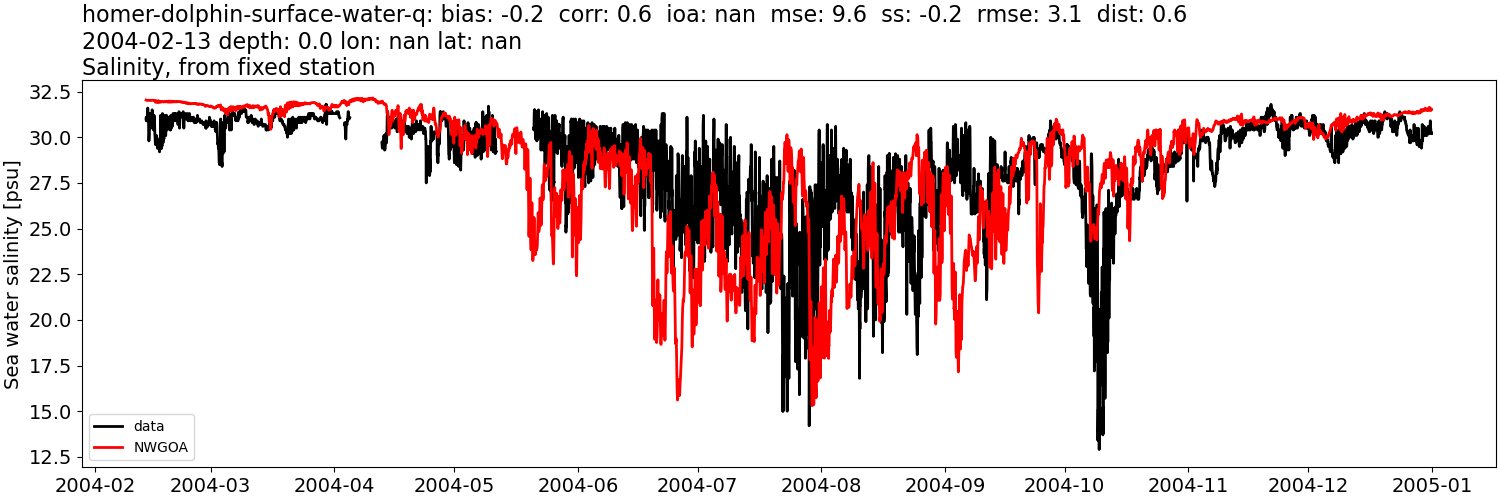
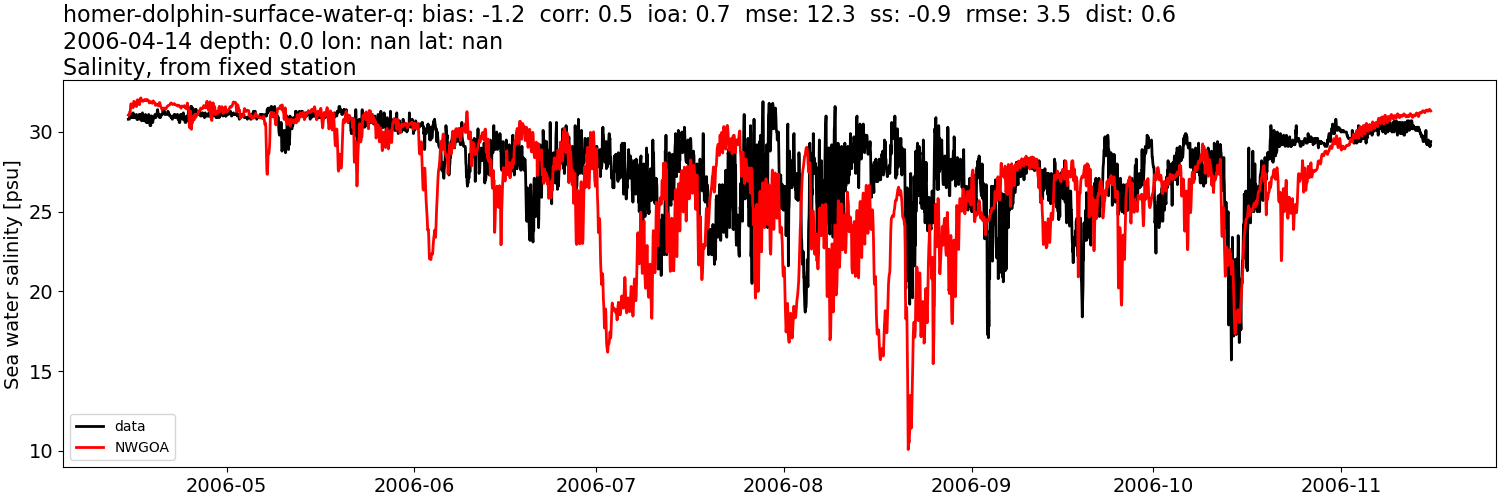
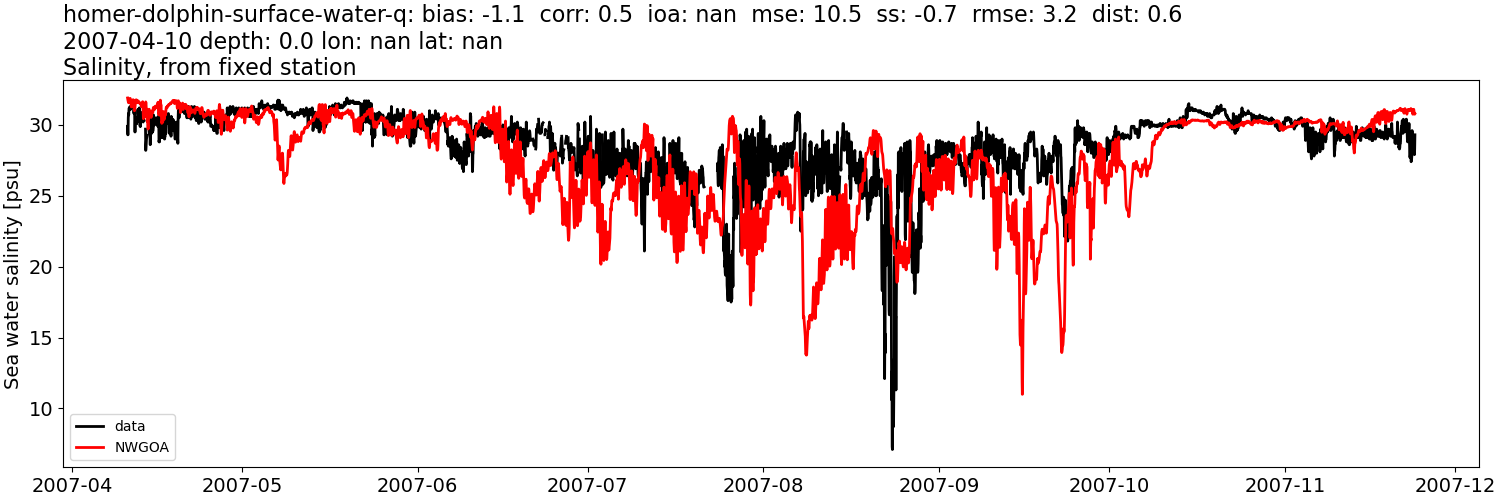
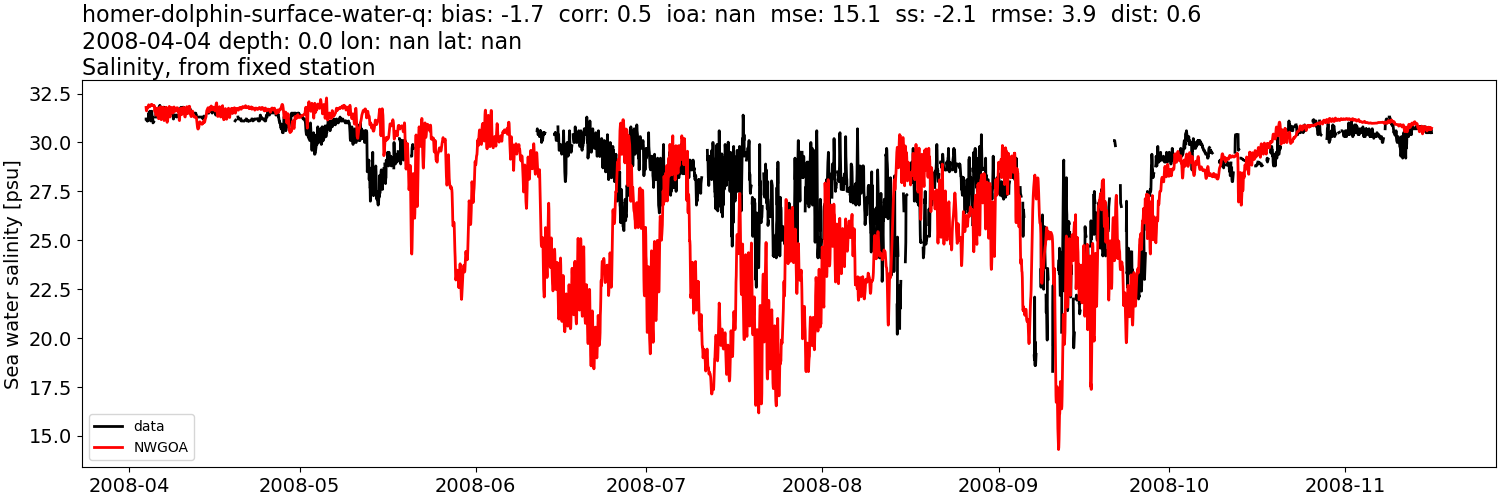
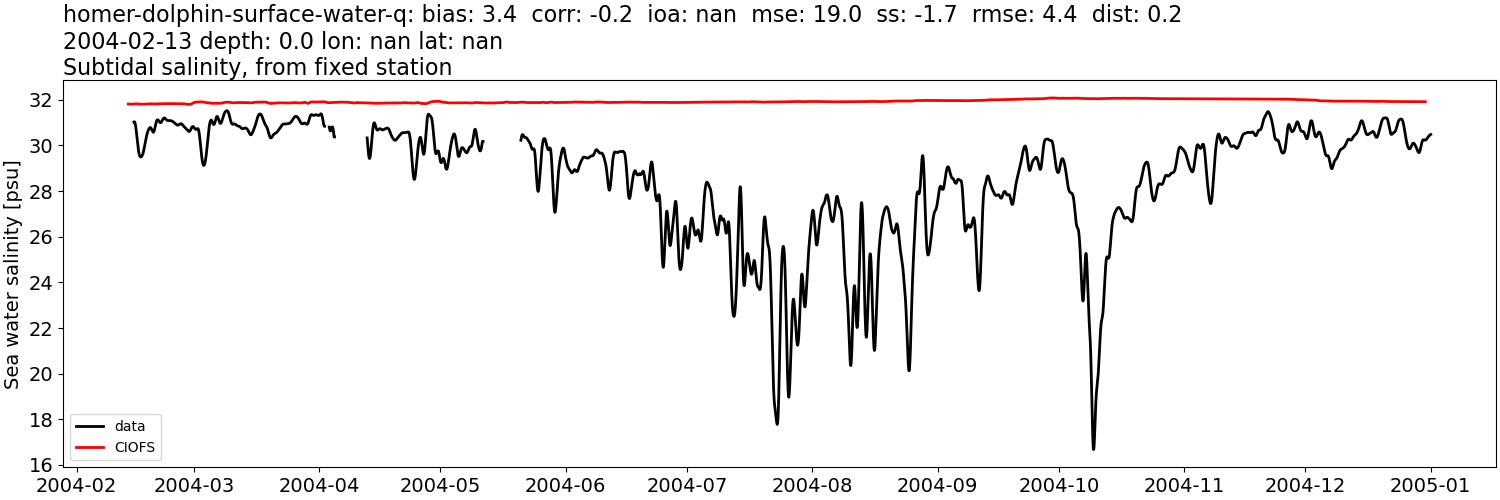
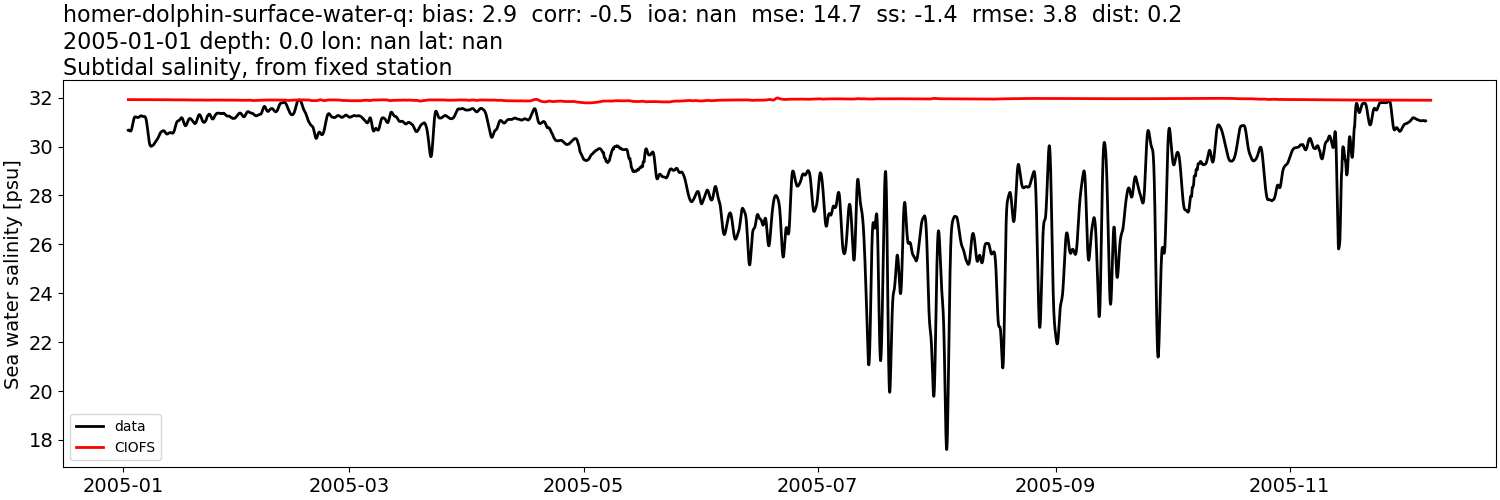
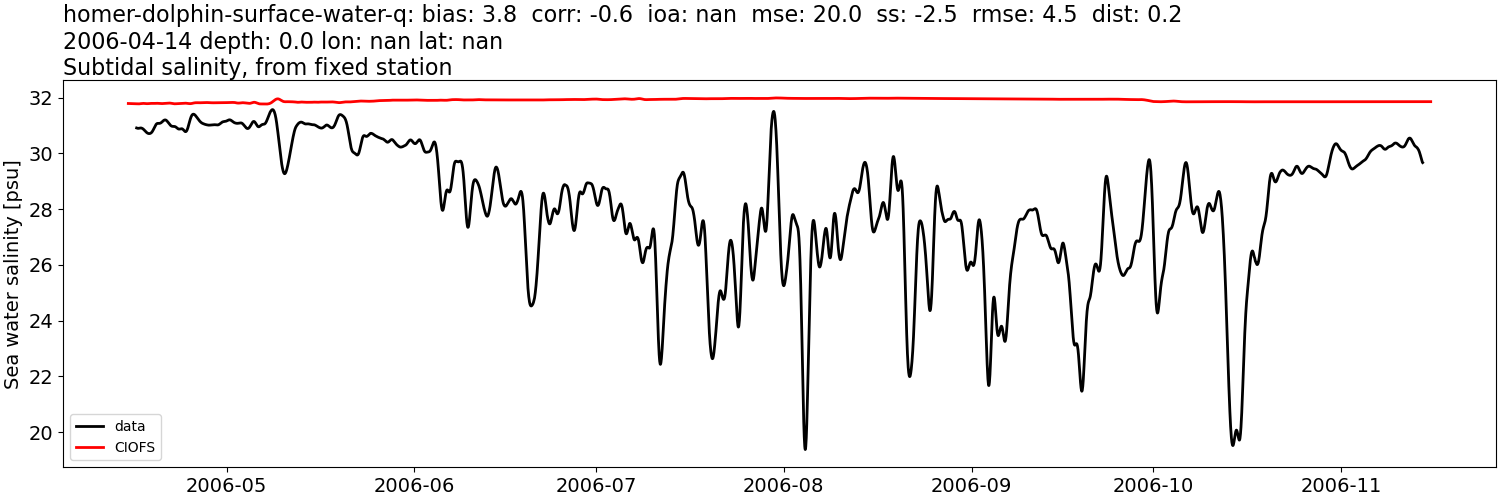
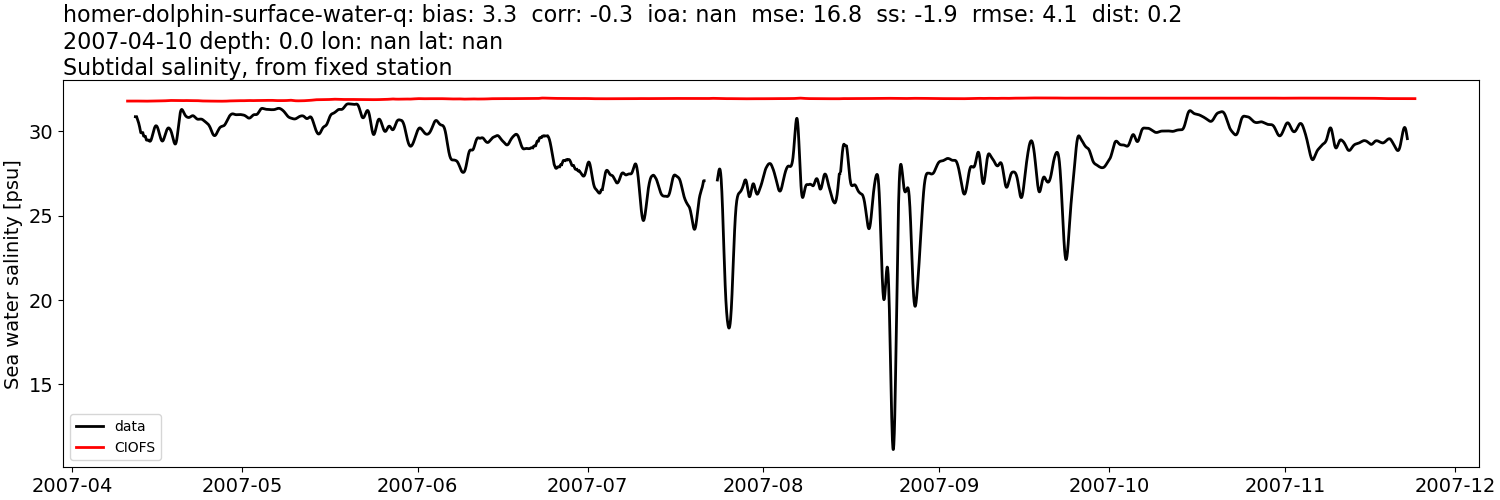
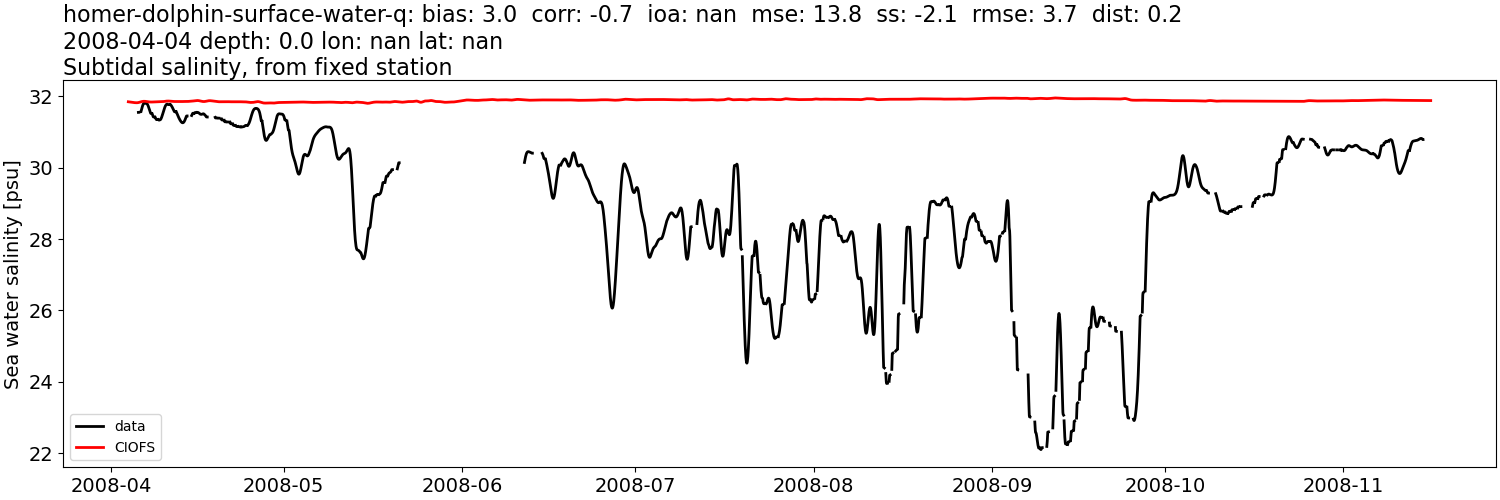
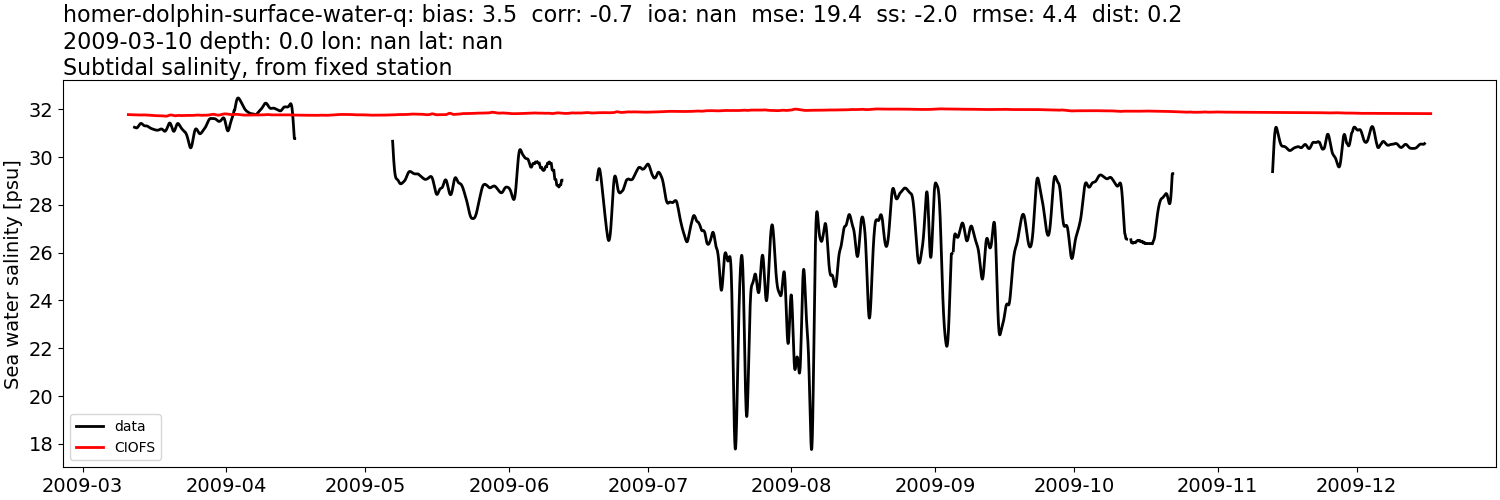
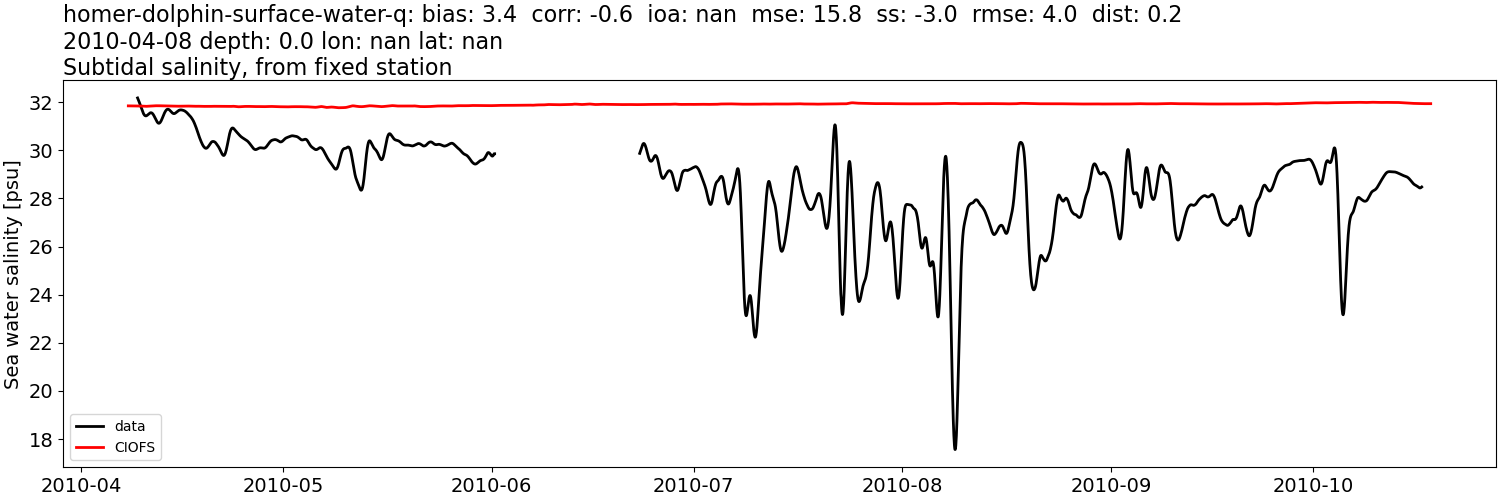
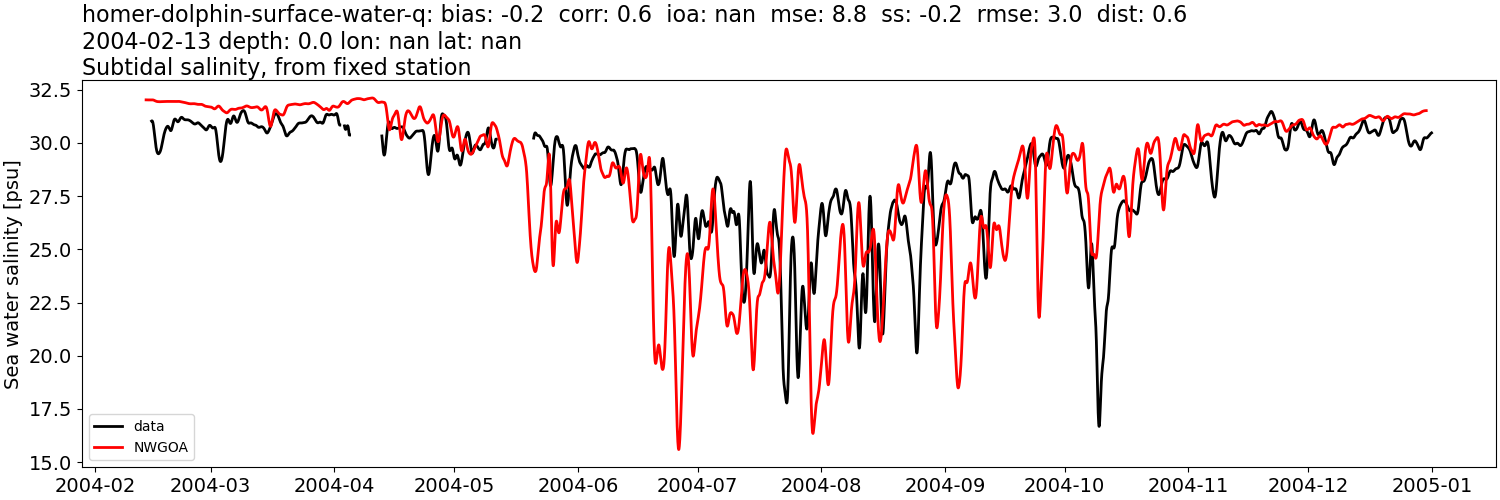
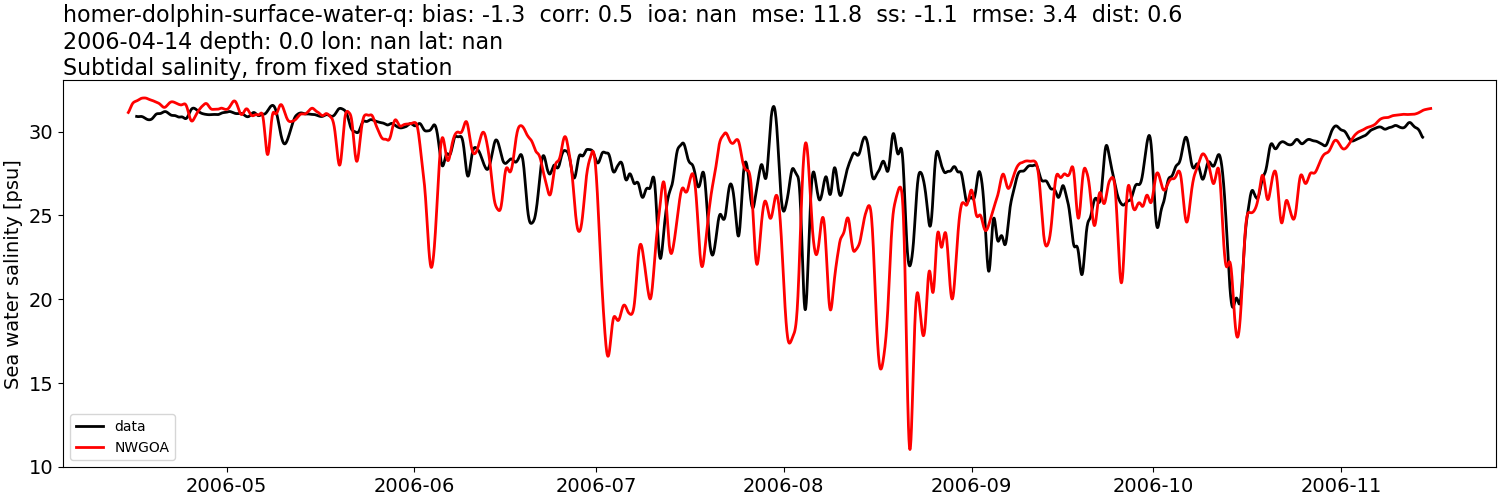
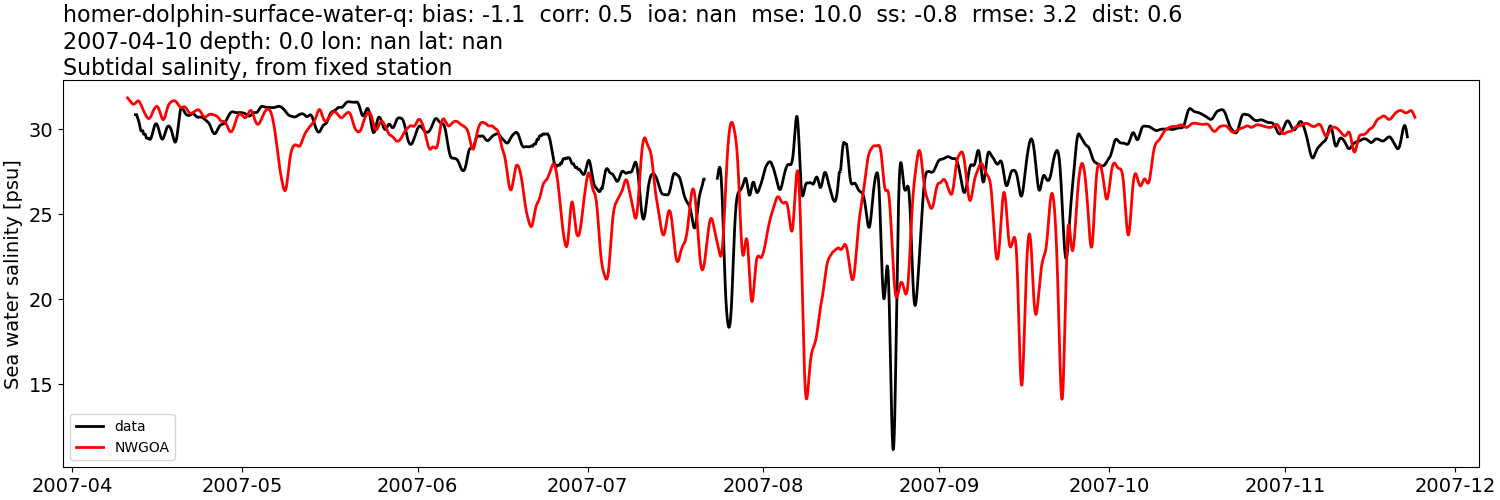
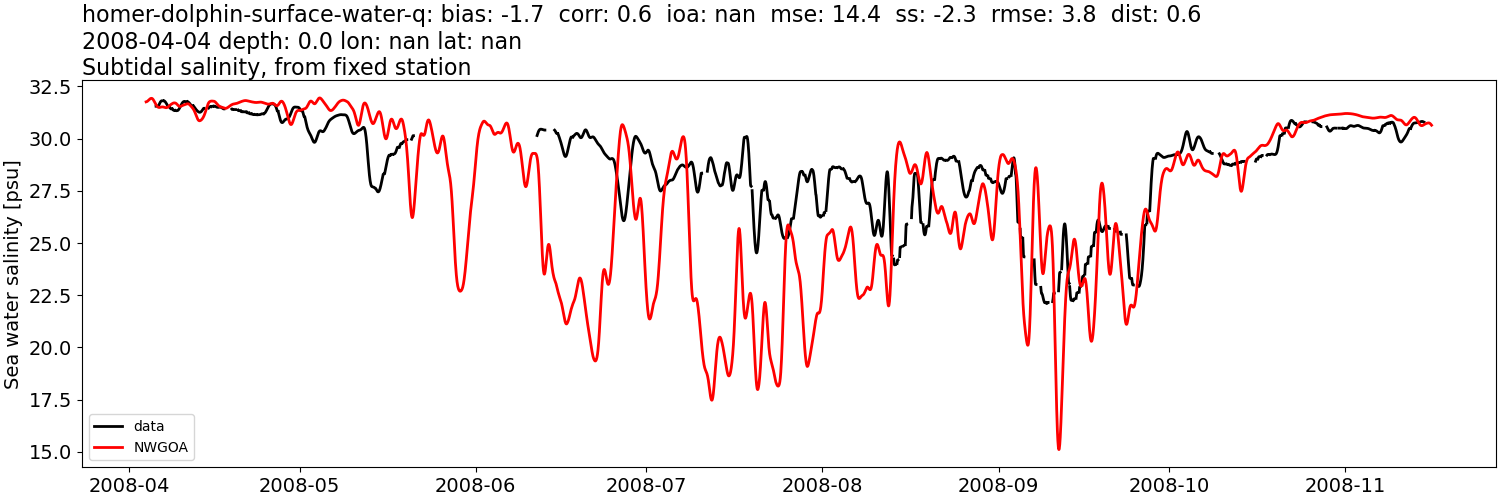
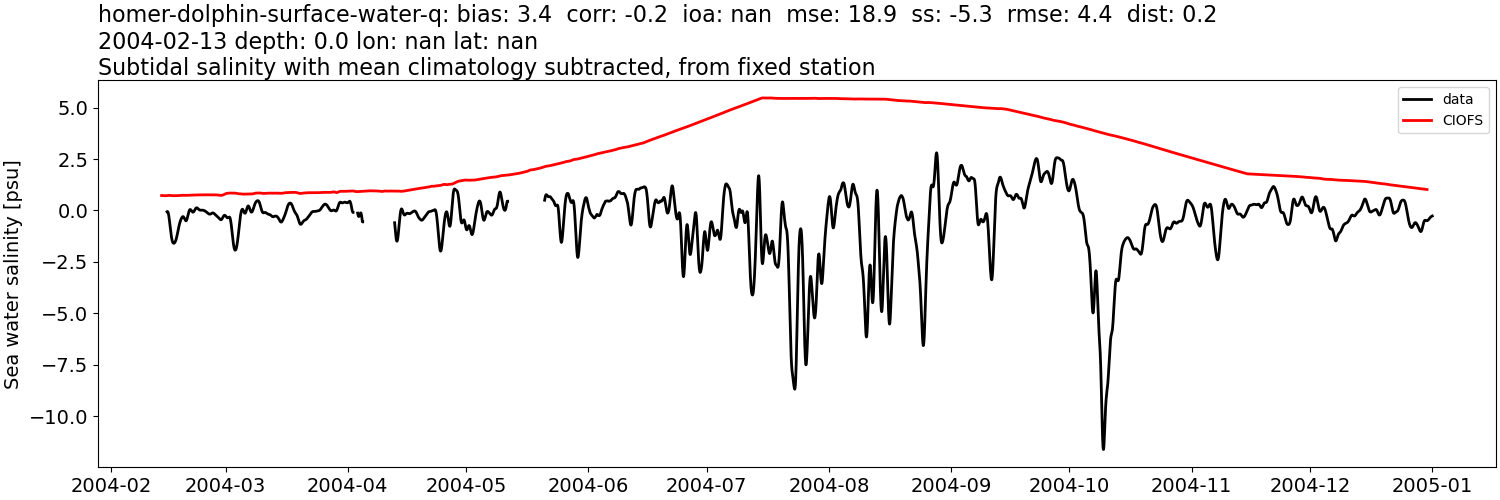
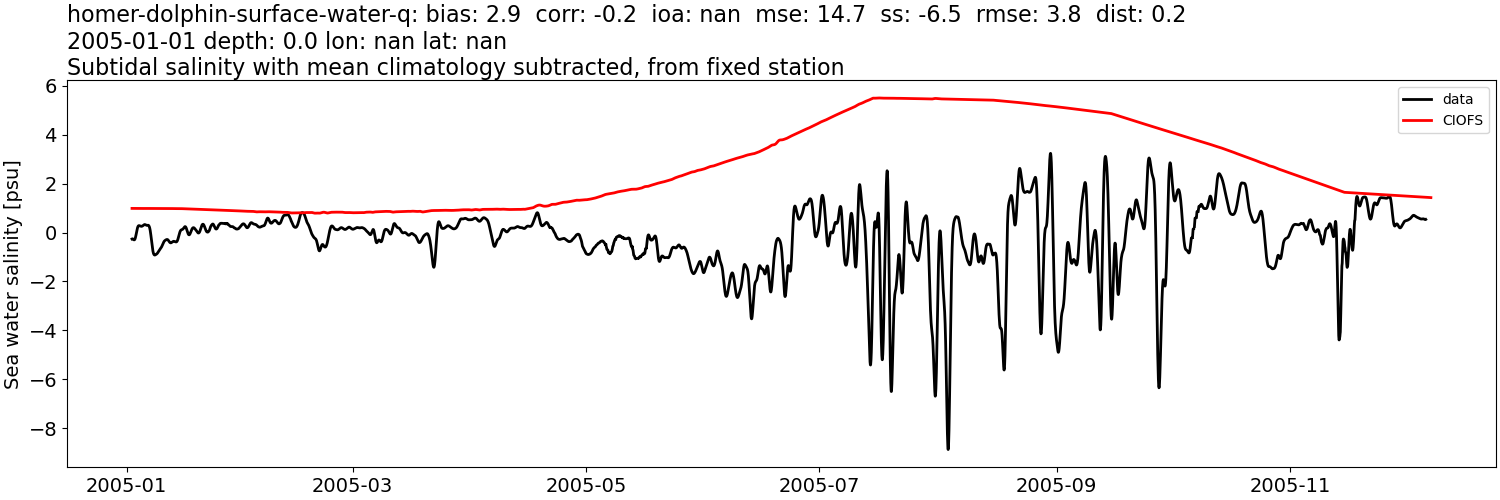
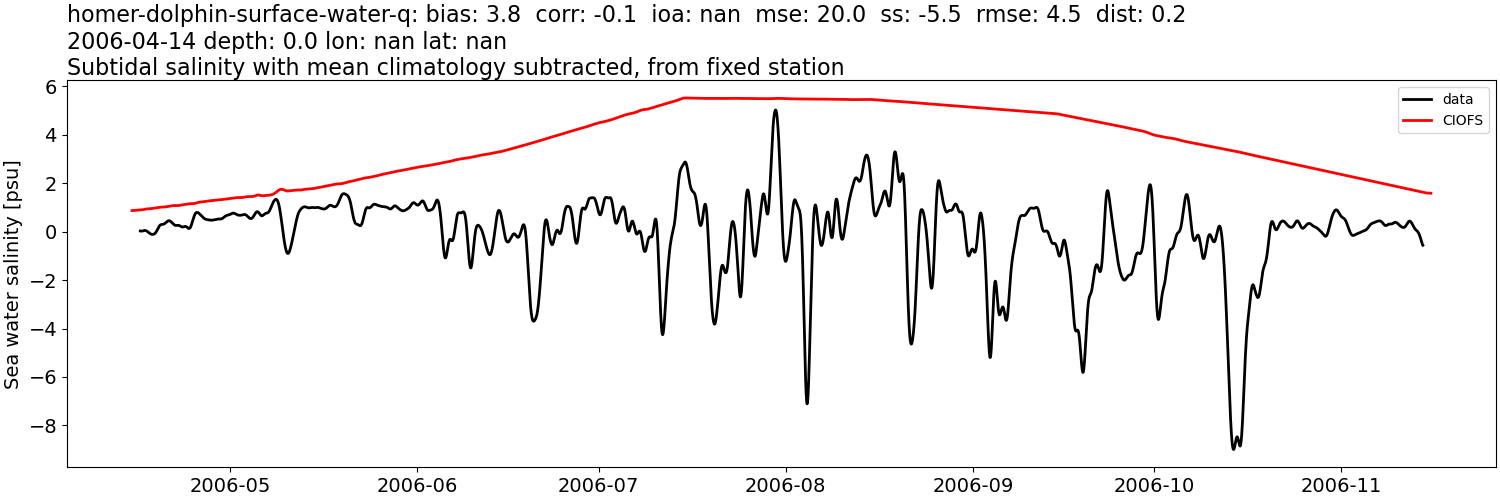
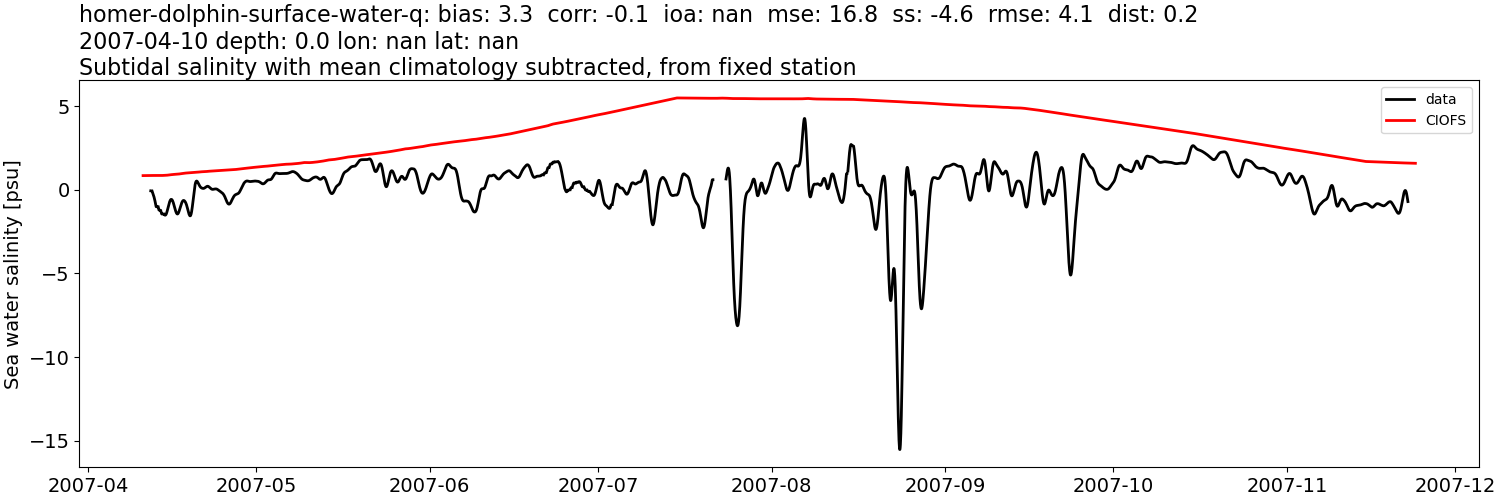
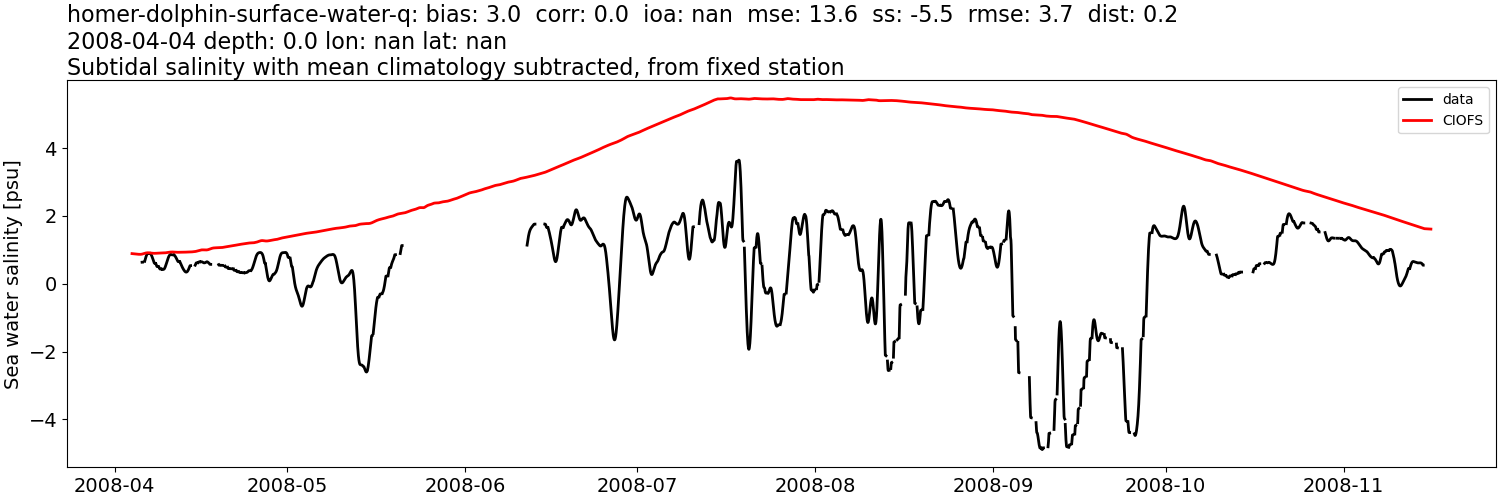
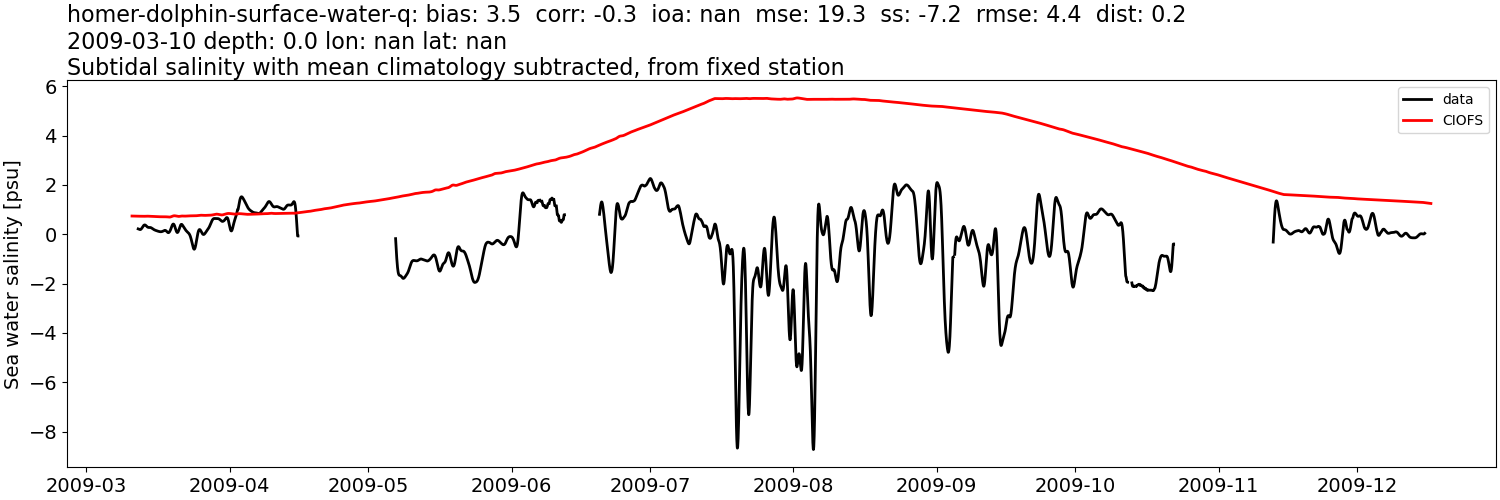
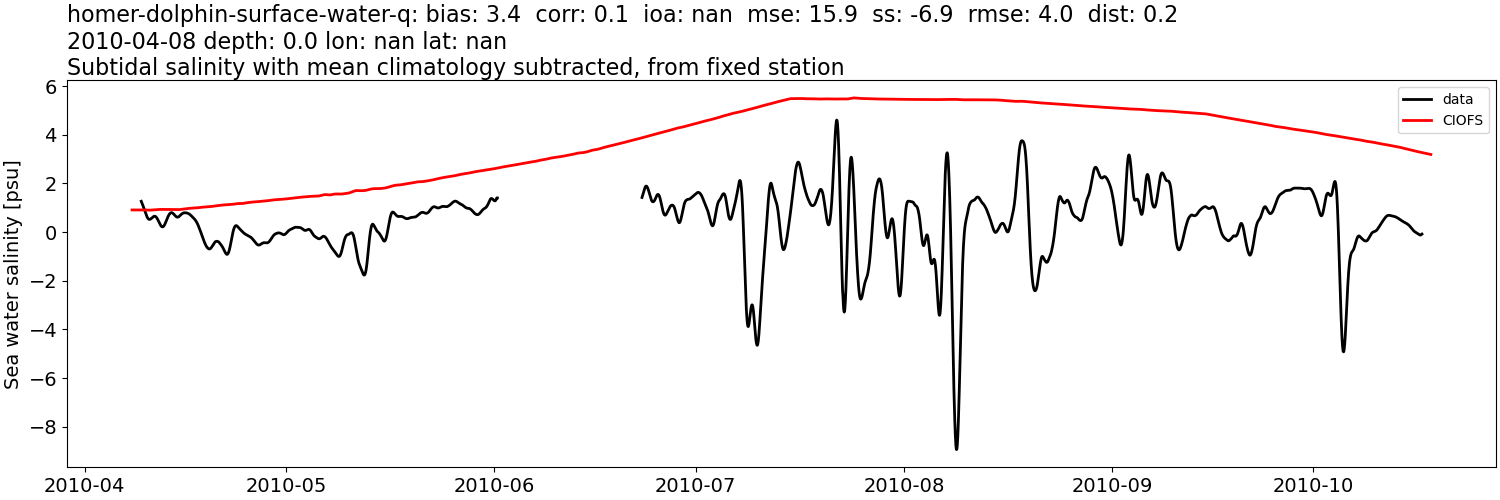
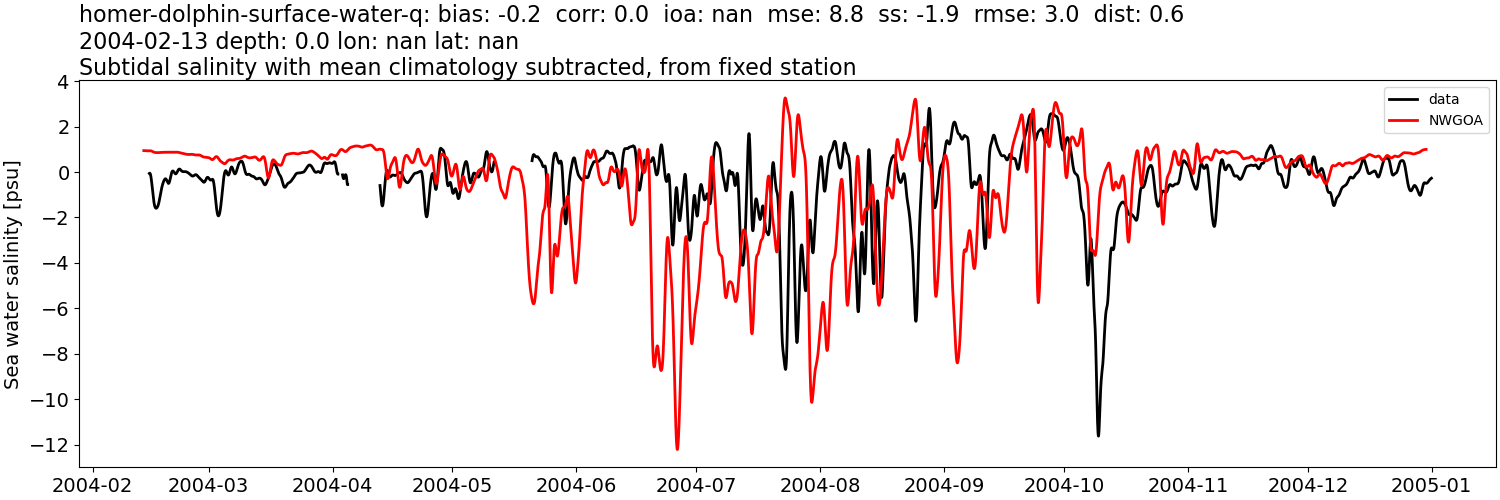
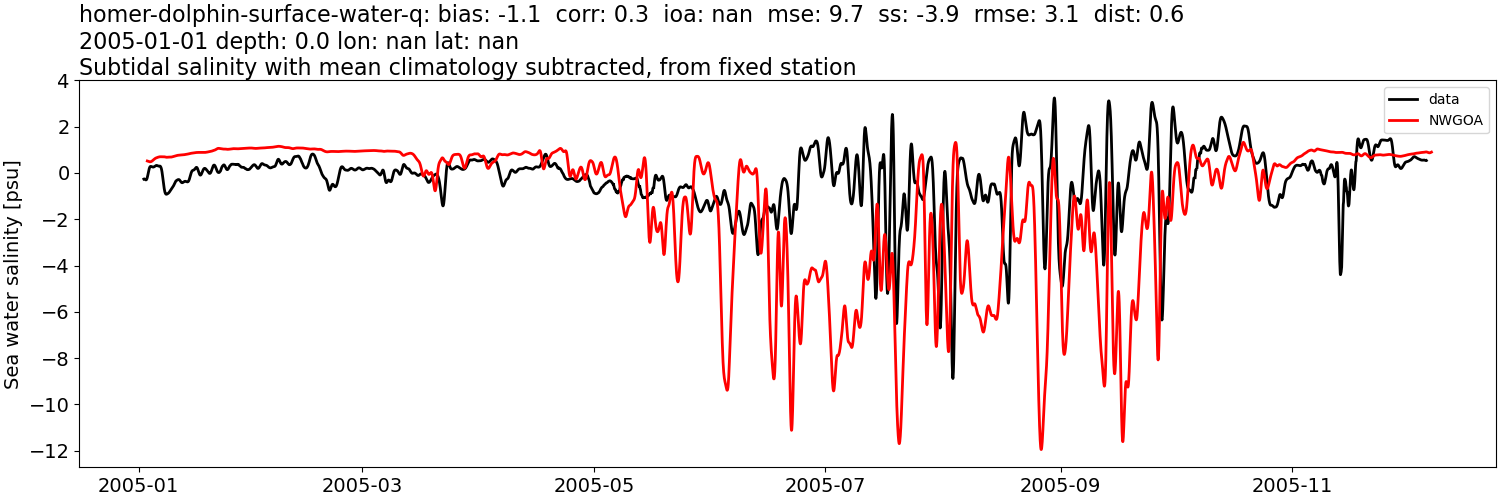
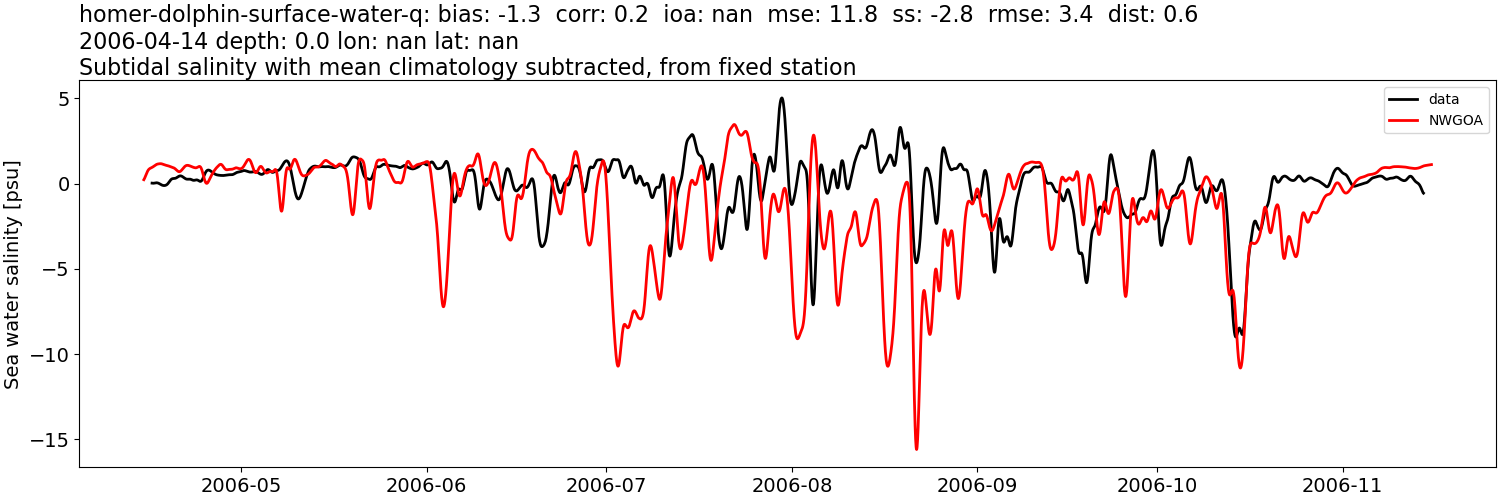
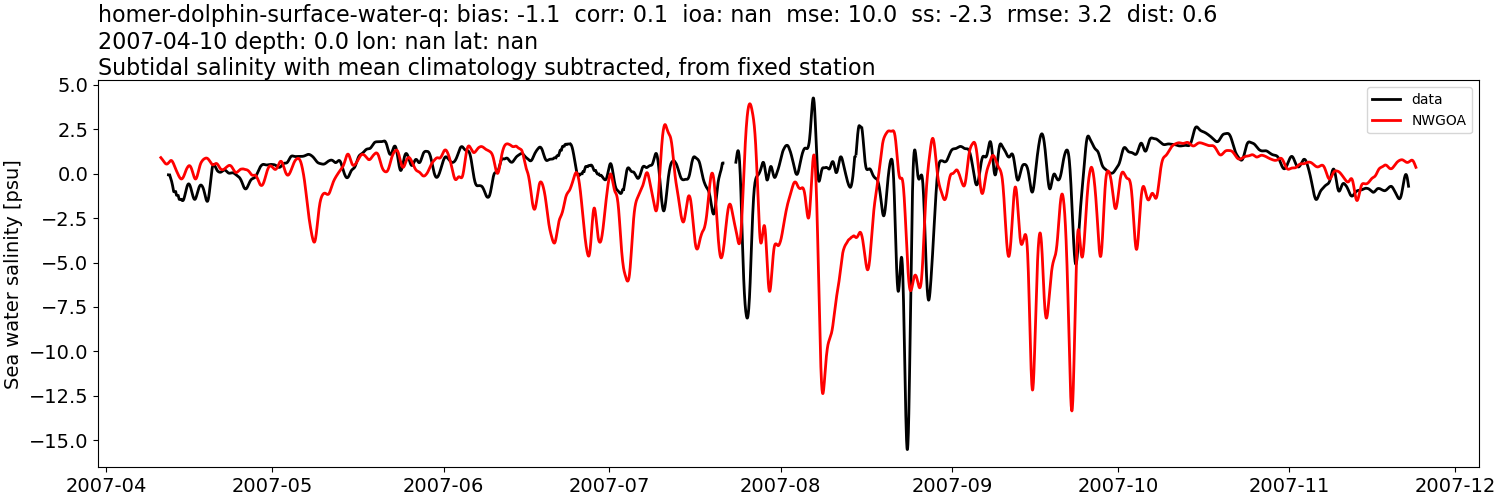
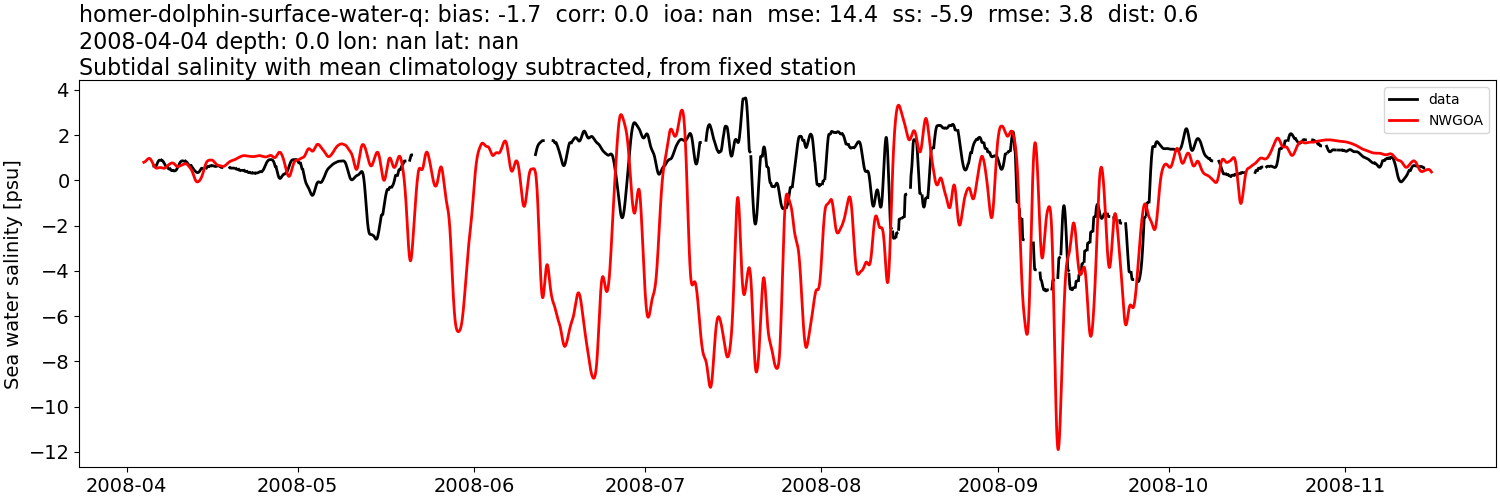
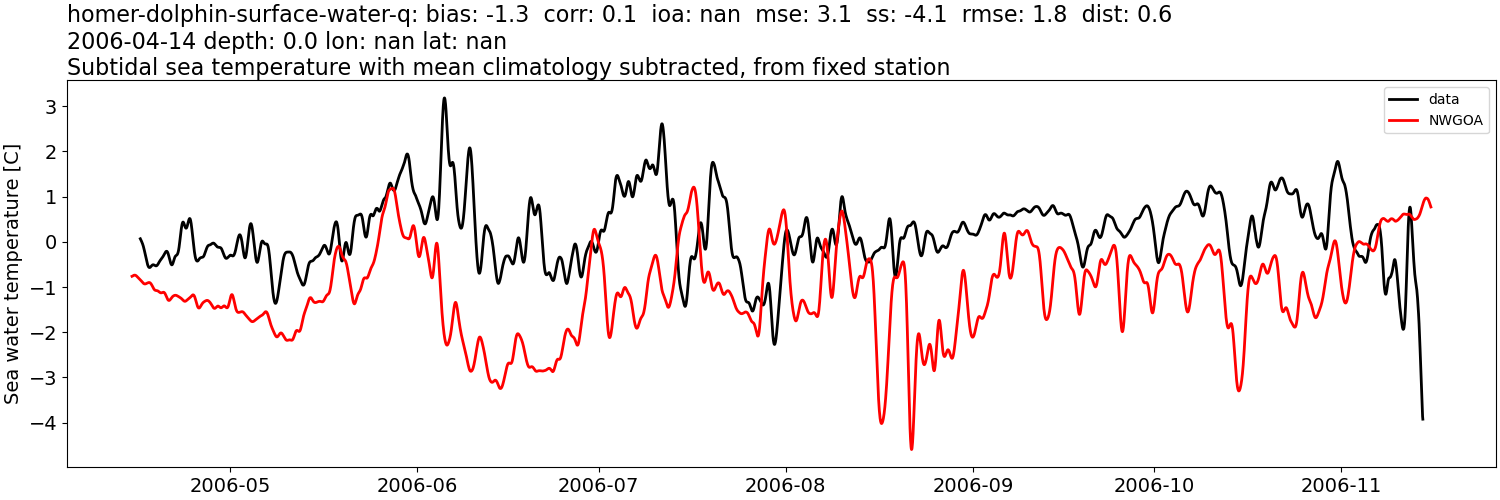
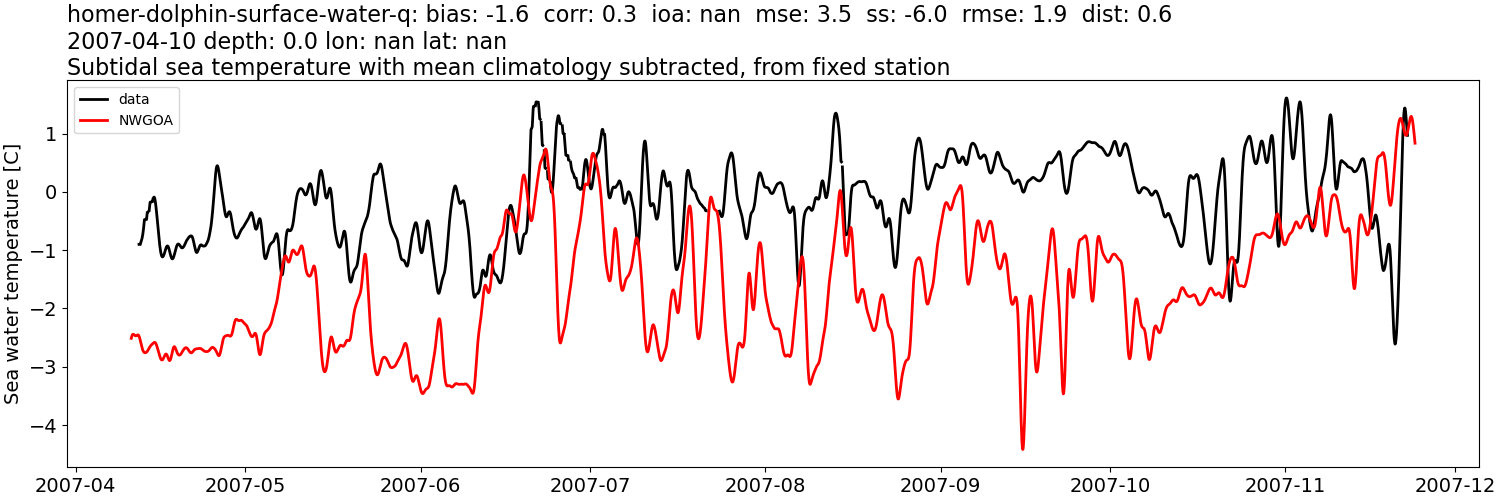
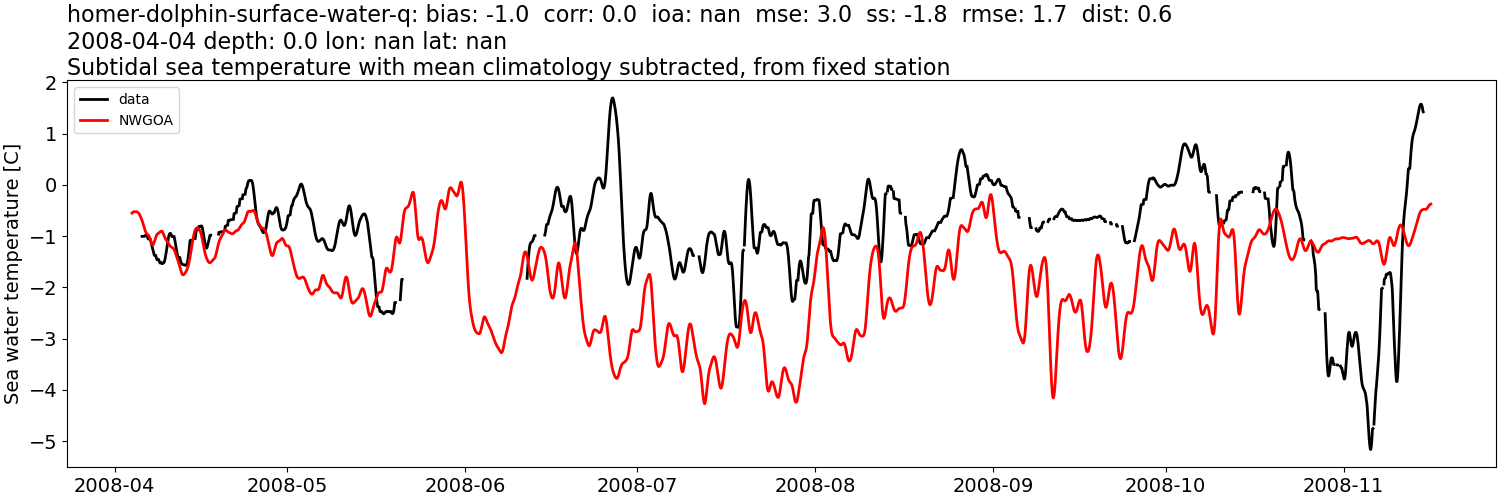
homer-dolphin-surface-water-q#
Sea water salinity:#
CIOFS#
Comparison plots by year
2004
2005
2006
2007
2008

2009
2010
NWGOA#
Comparison plots by year
2004
2005

2006
2007
2008
Sea water salinity: tidally-filtered#
CIOFS#
Comparison plots by year
2004
2005
2006
2007
2008
2009
2010
NWGOA#
Comparison plots by year
2004
2005

2006
2007
2008
Sea water salinity: tidally-filtered, then monthly mean from data subtracted#
CIOFS#
Comparison plots by year
2004
2005
2006
2007
2008
2009
2010
NWGOA#
Comparison plots by year
2004
2005
2006
2007
2008
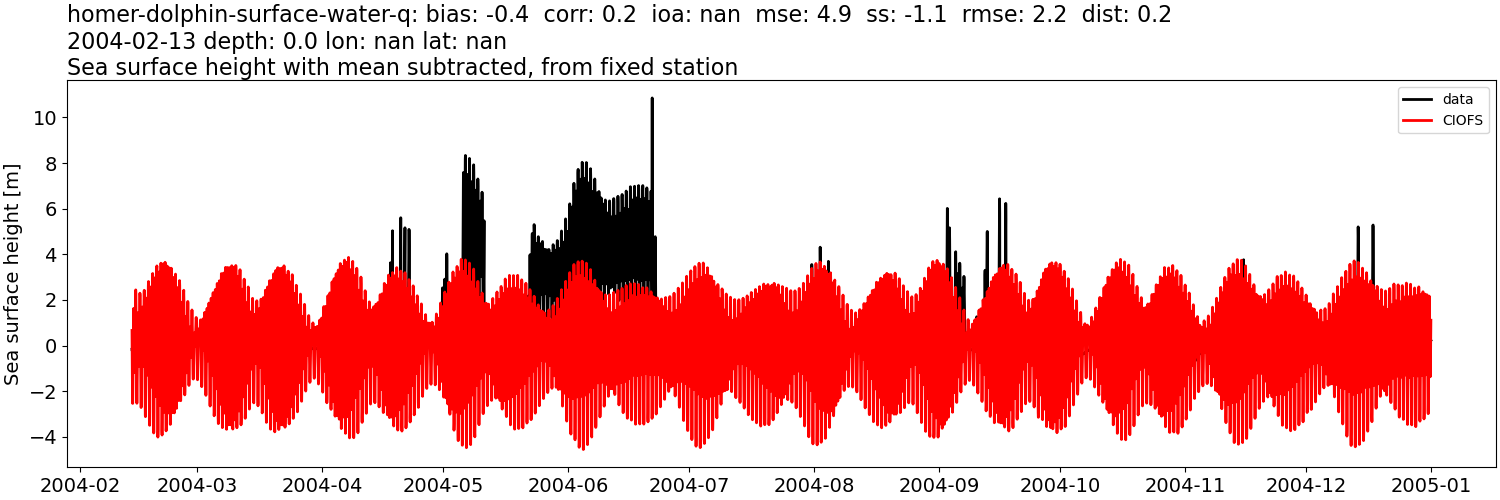
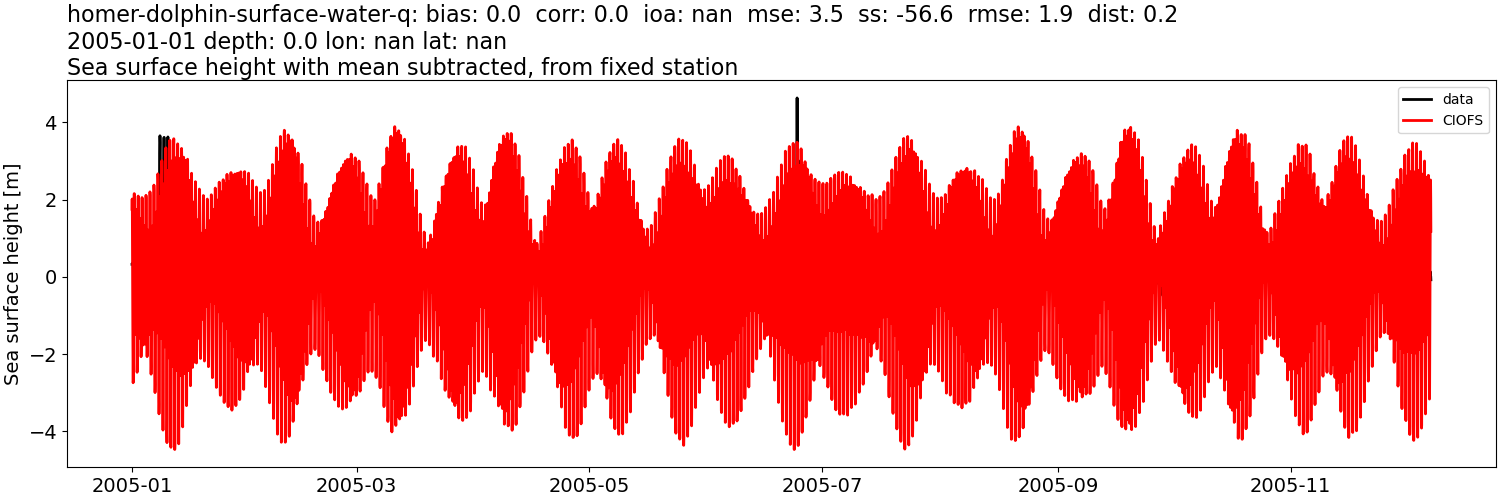
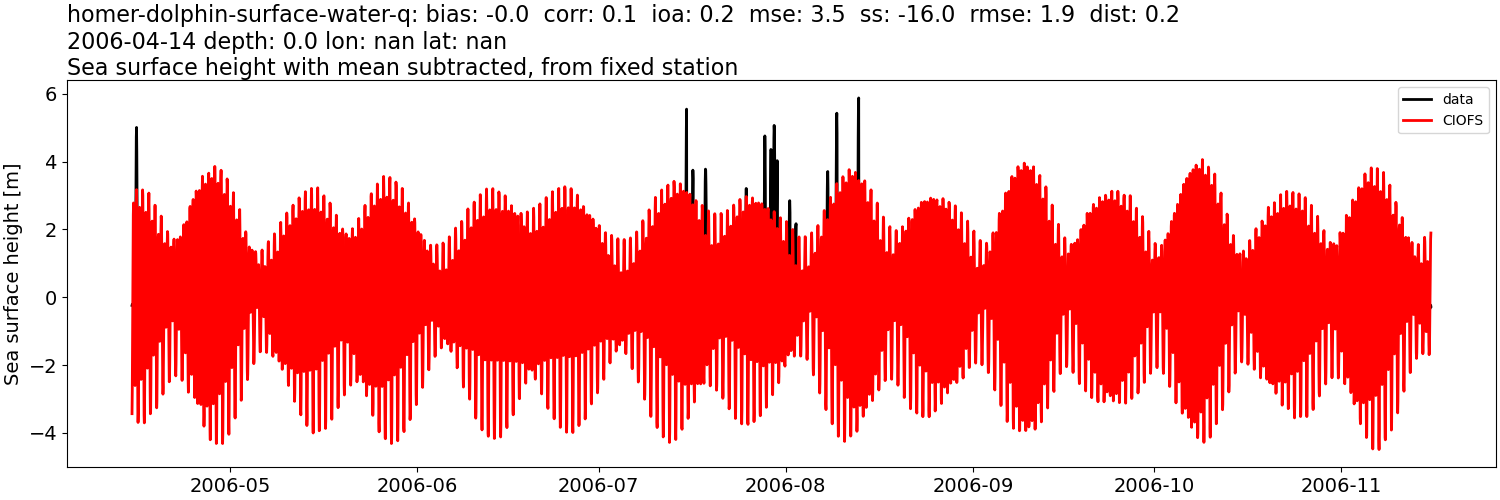
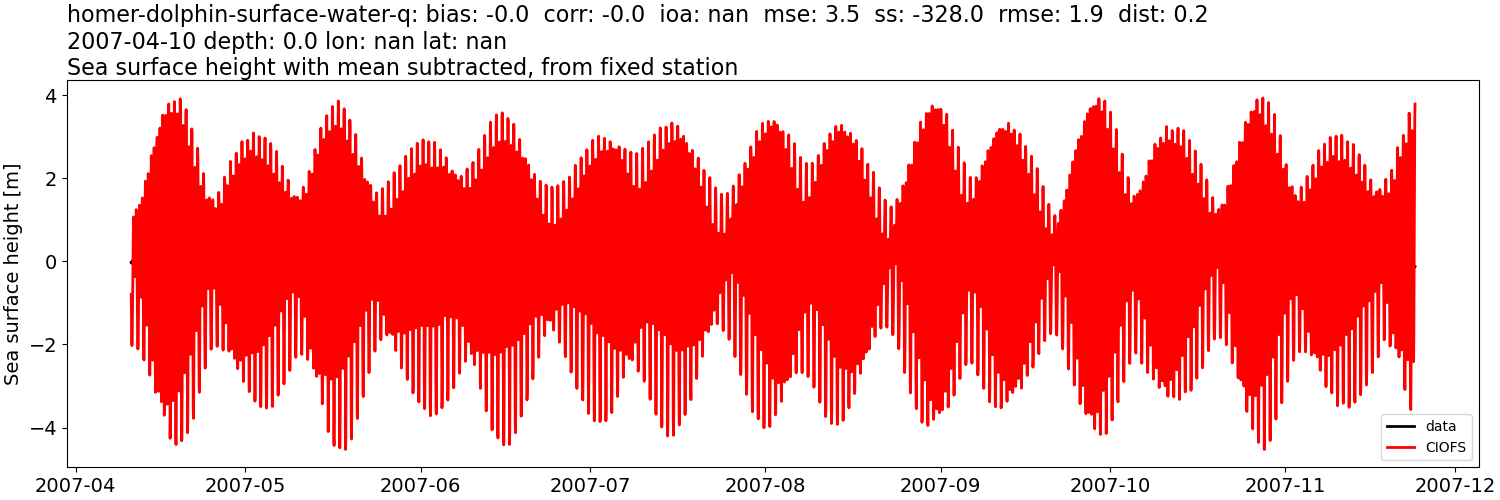
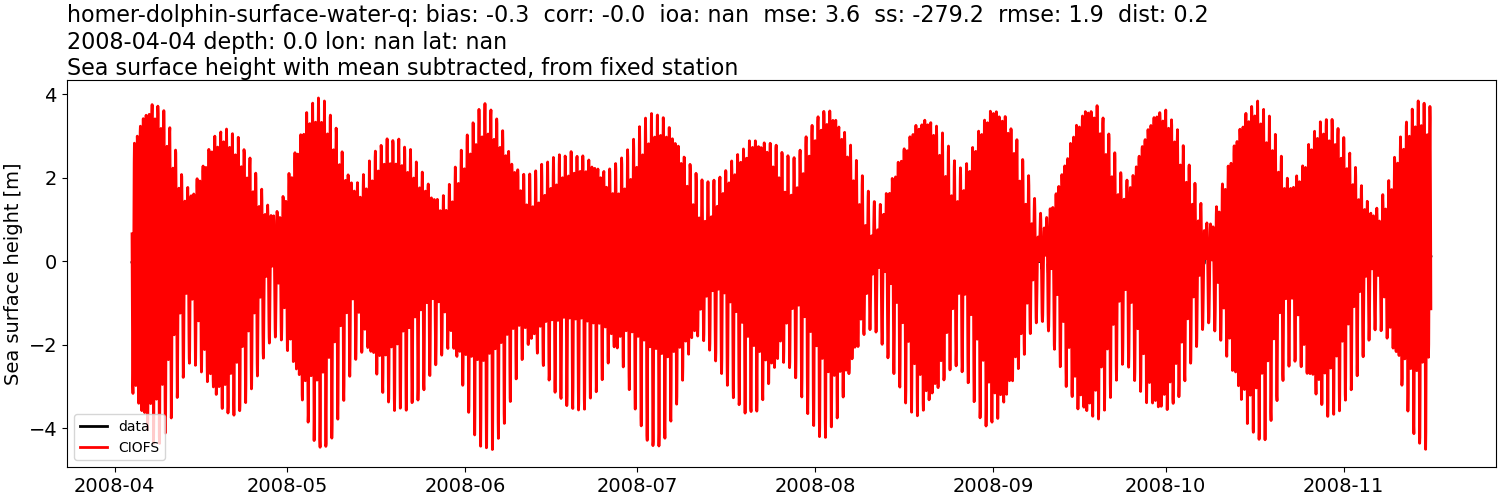
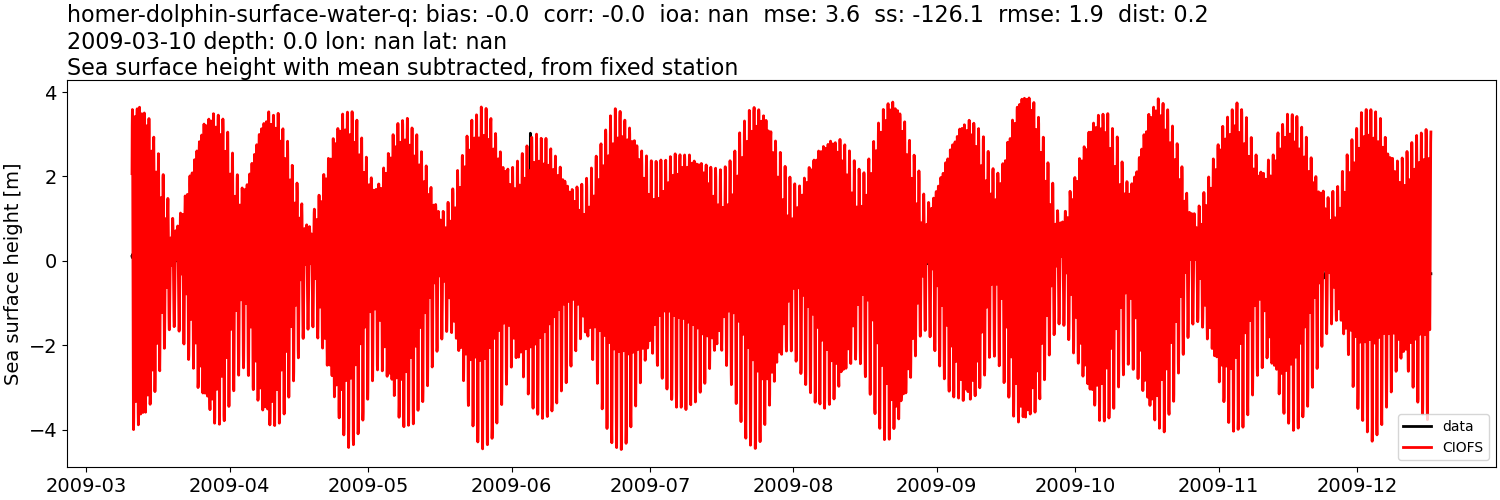
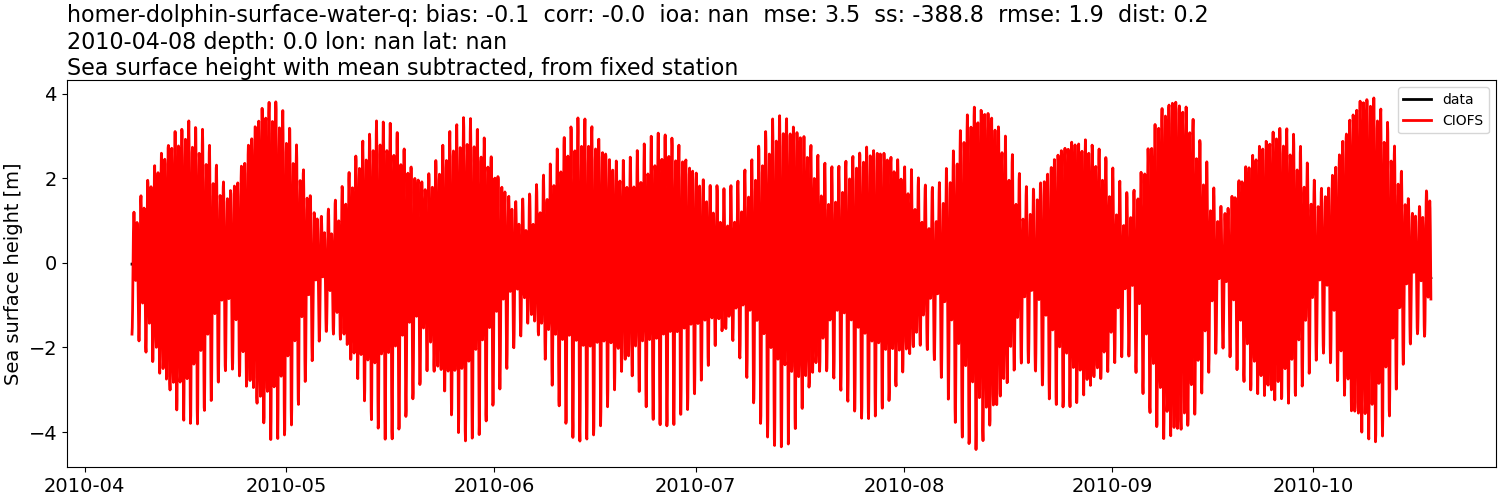
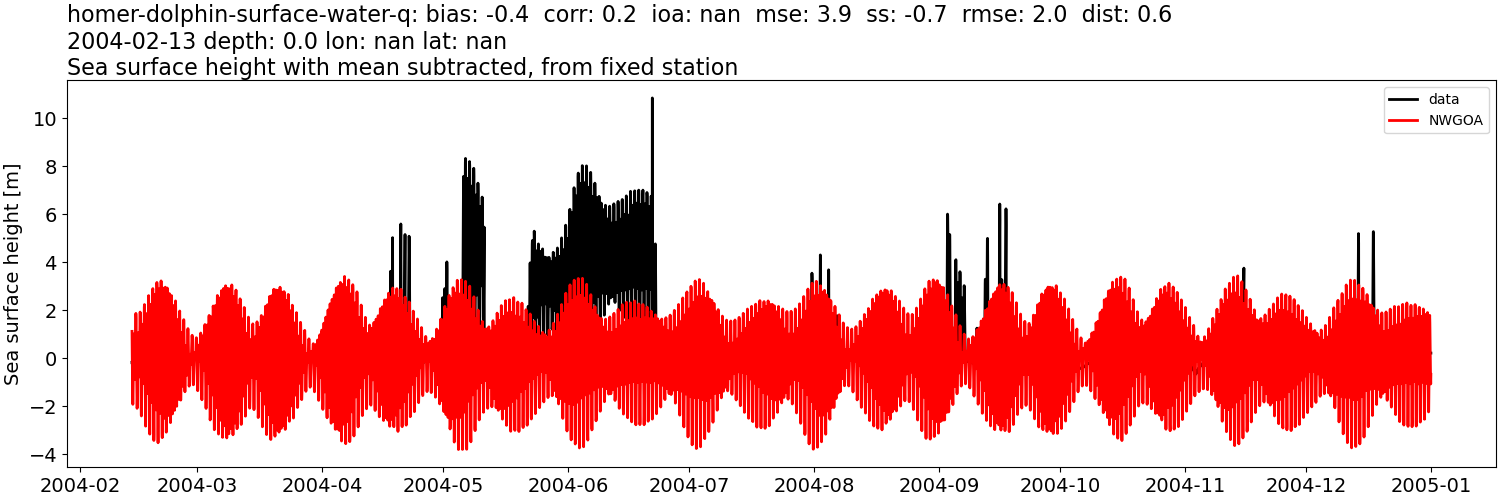
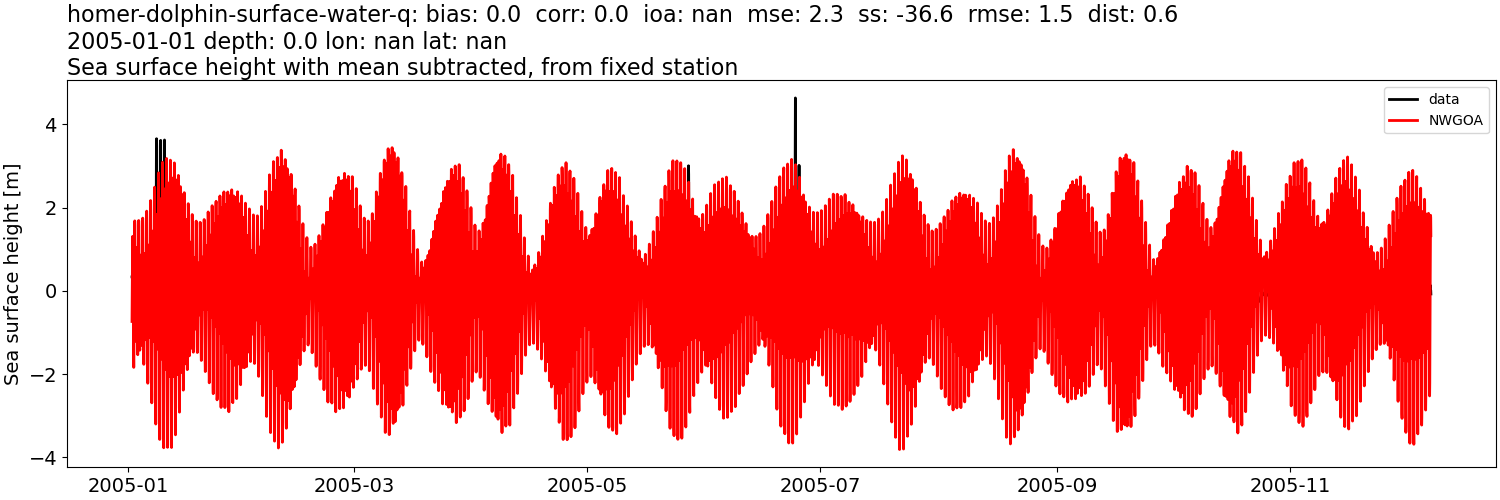
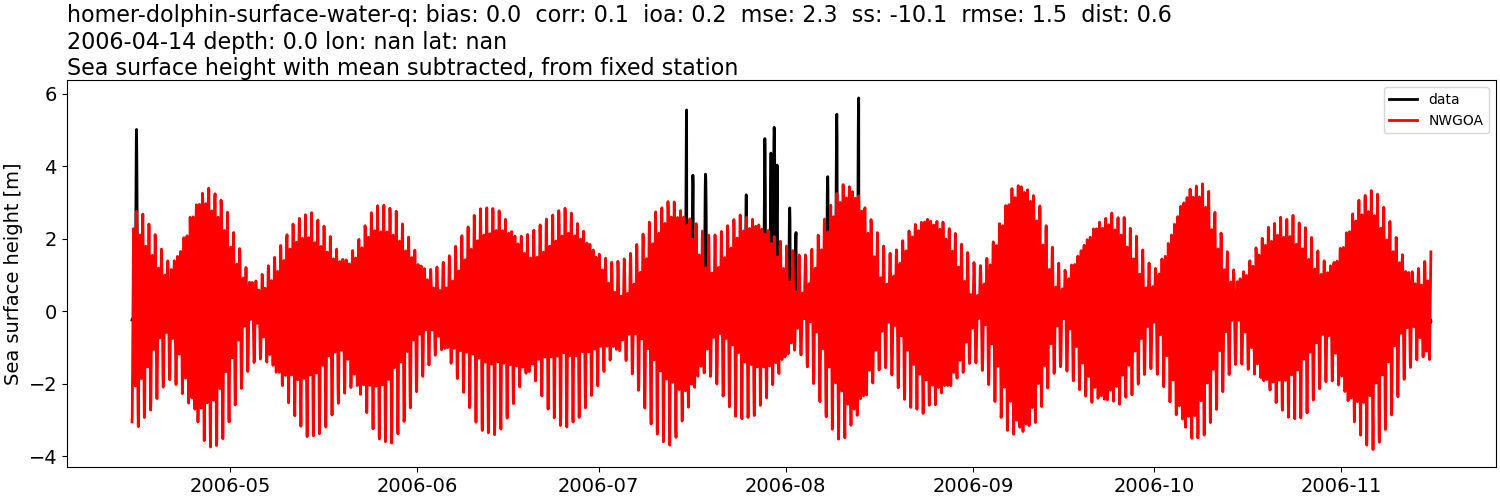
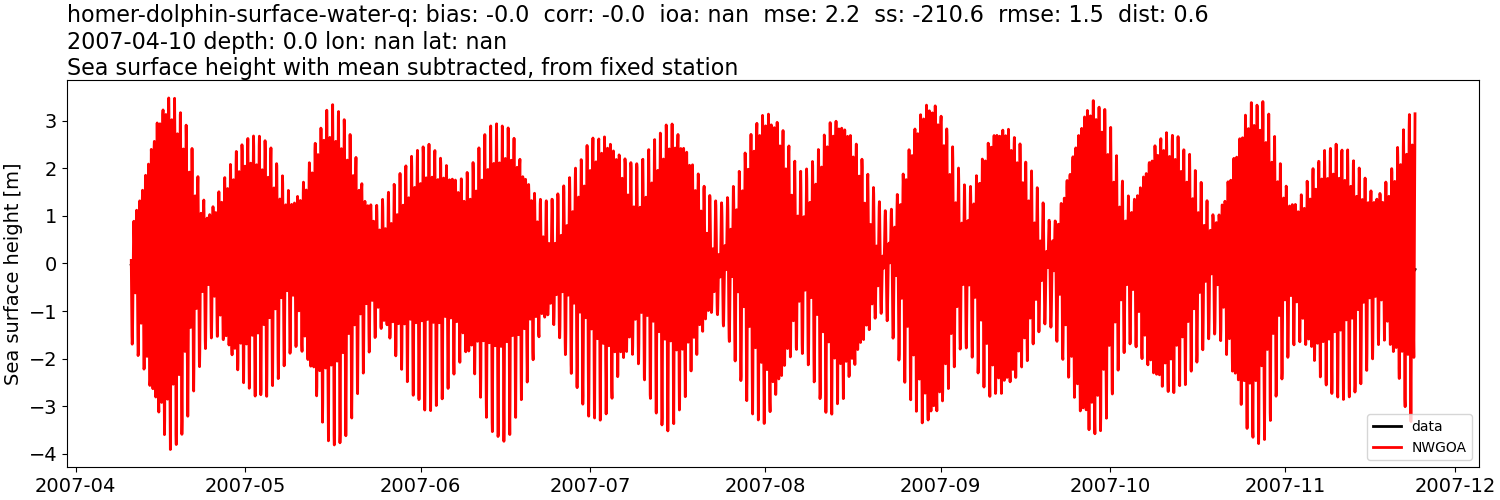
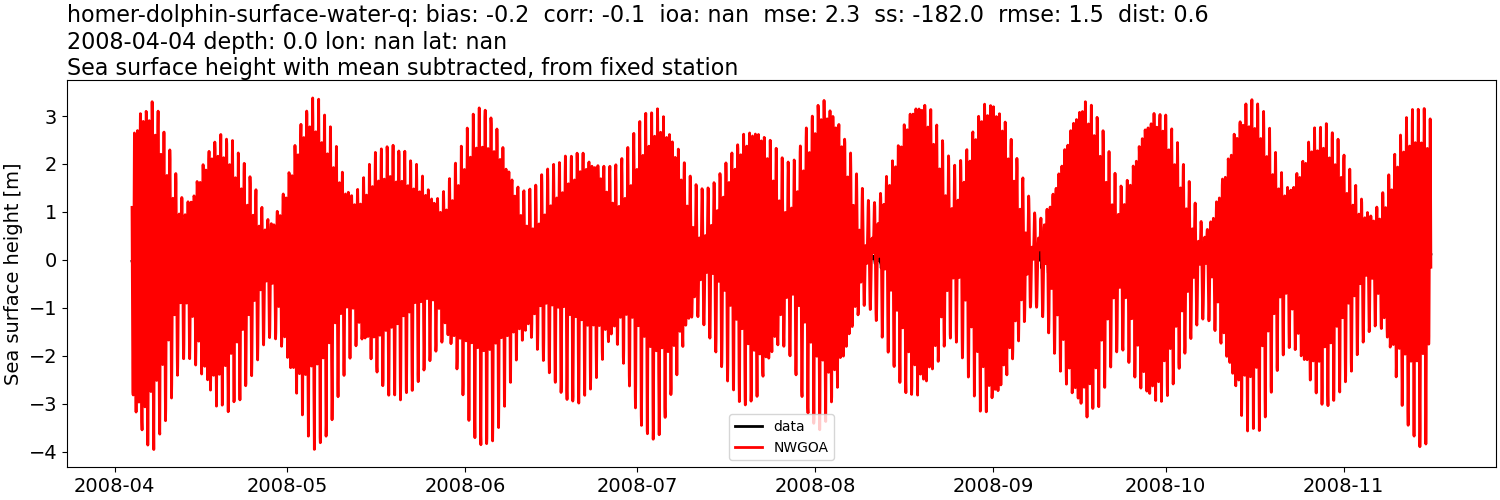
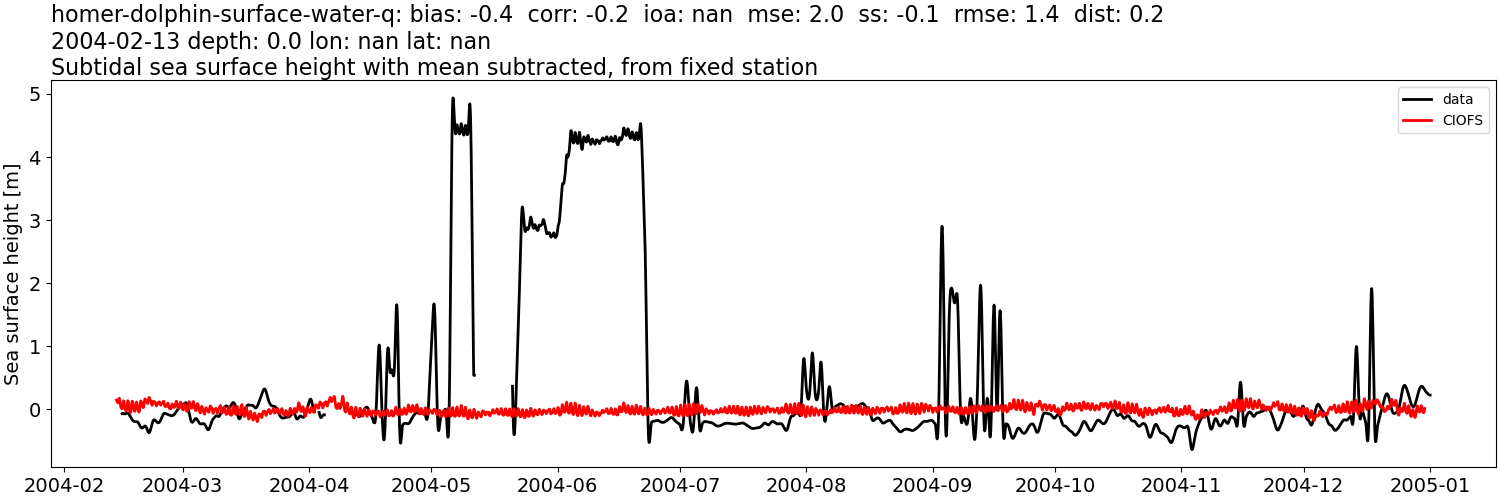
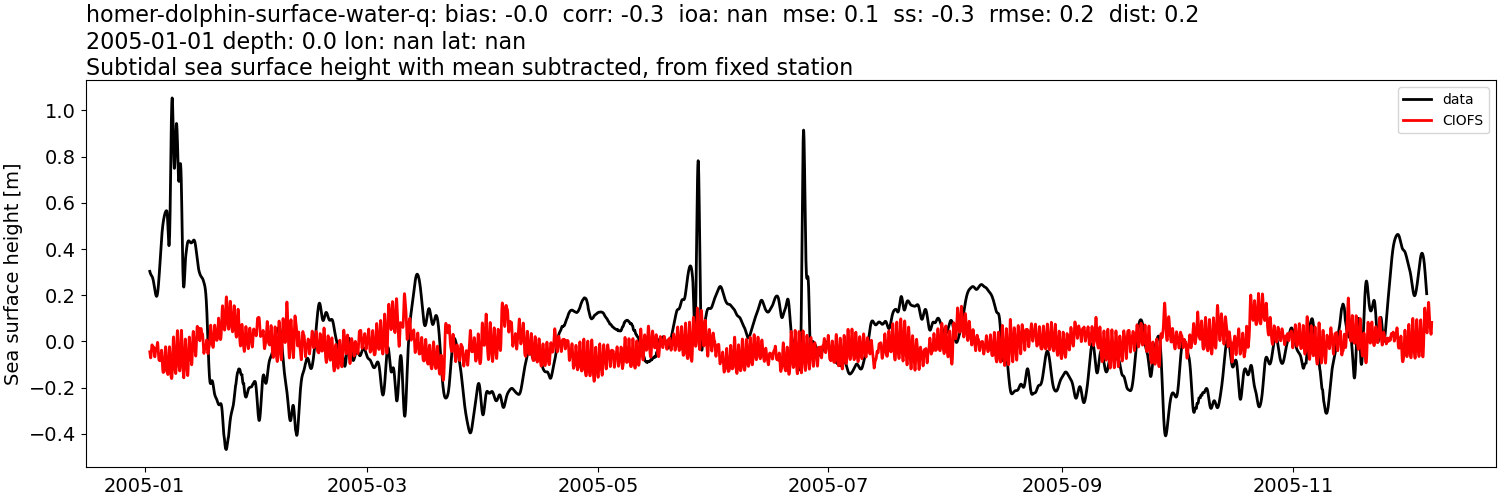
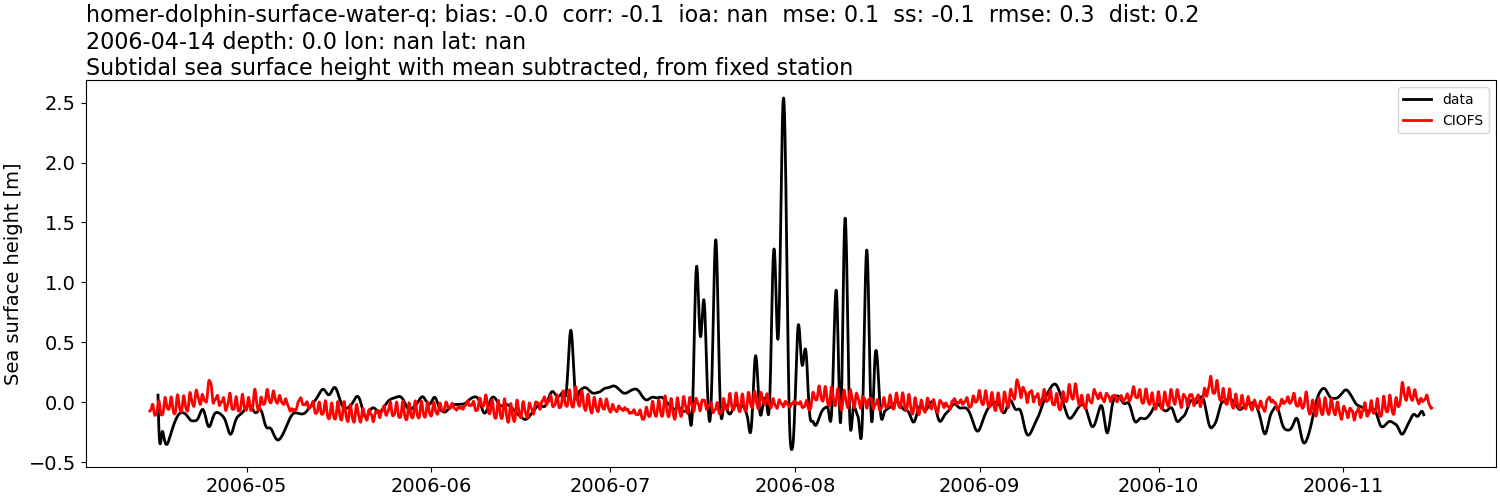
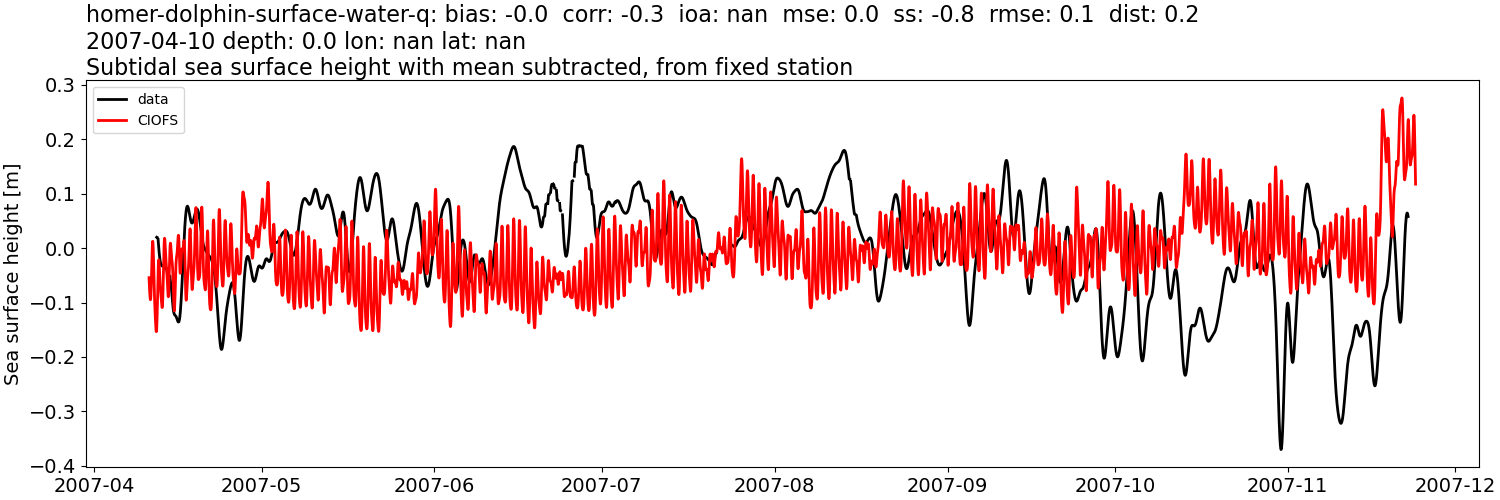
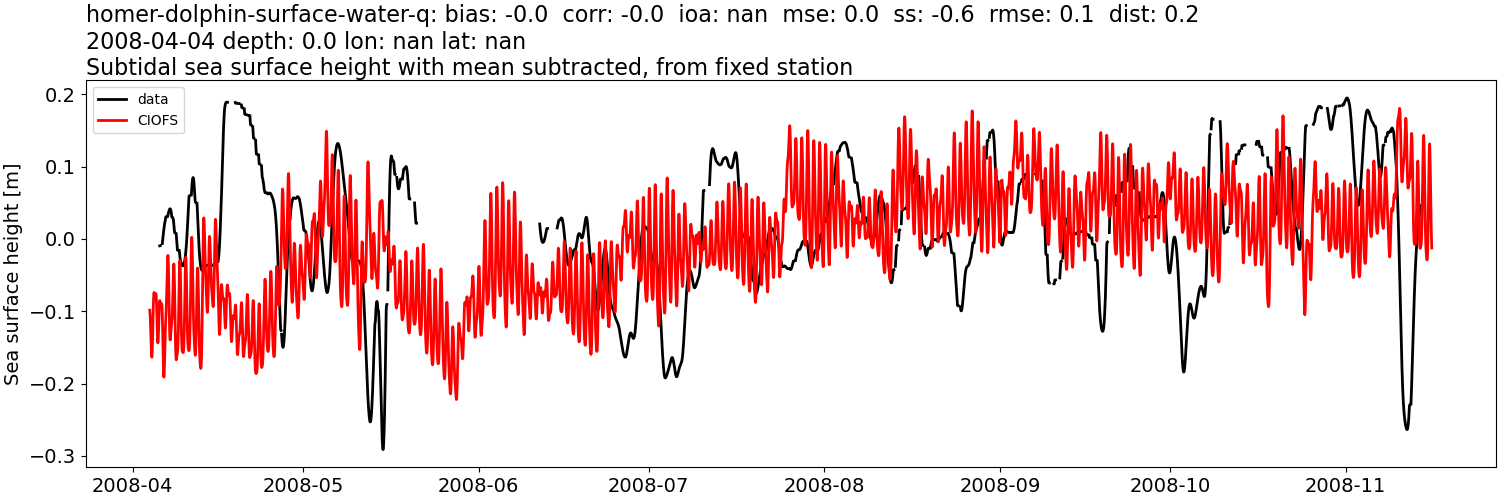
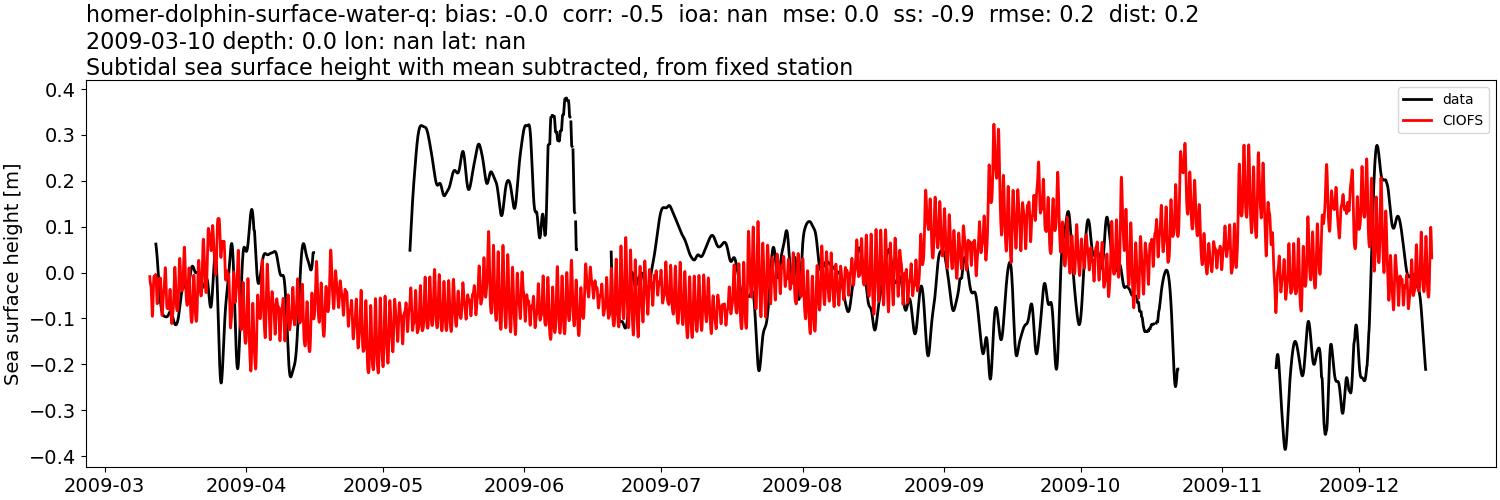
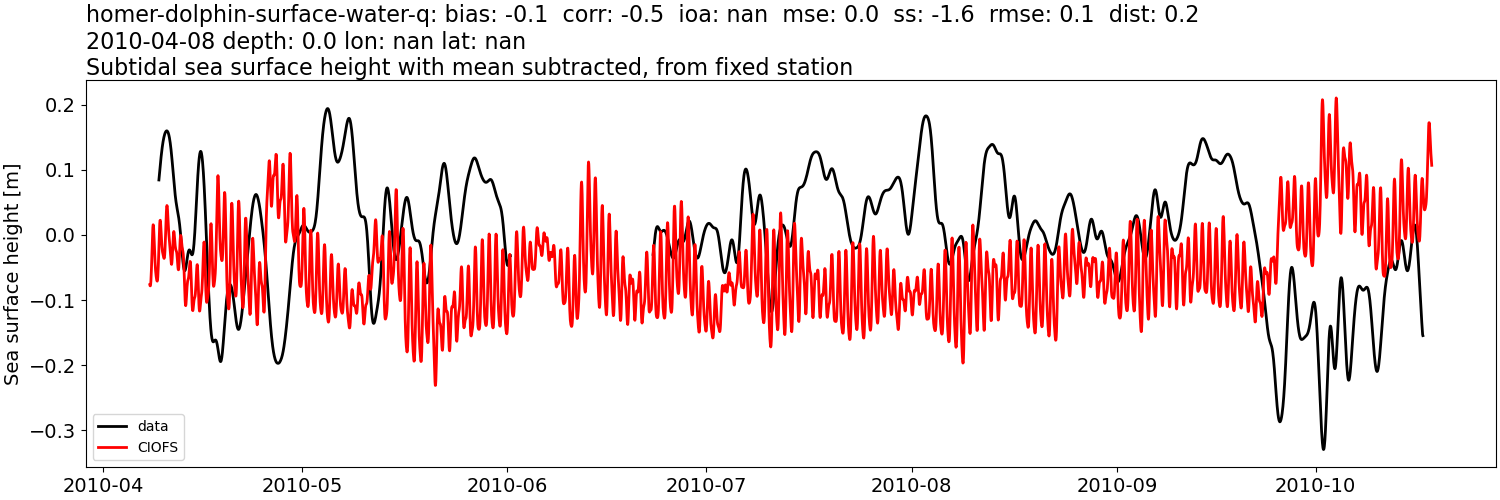
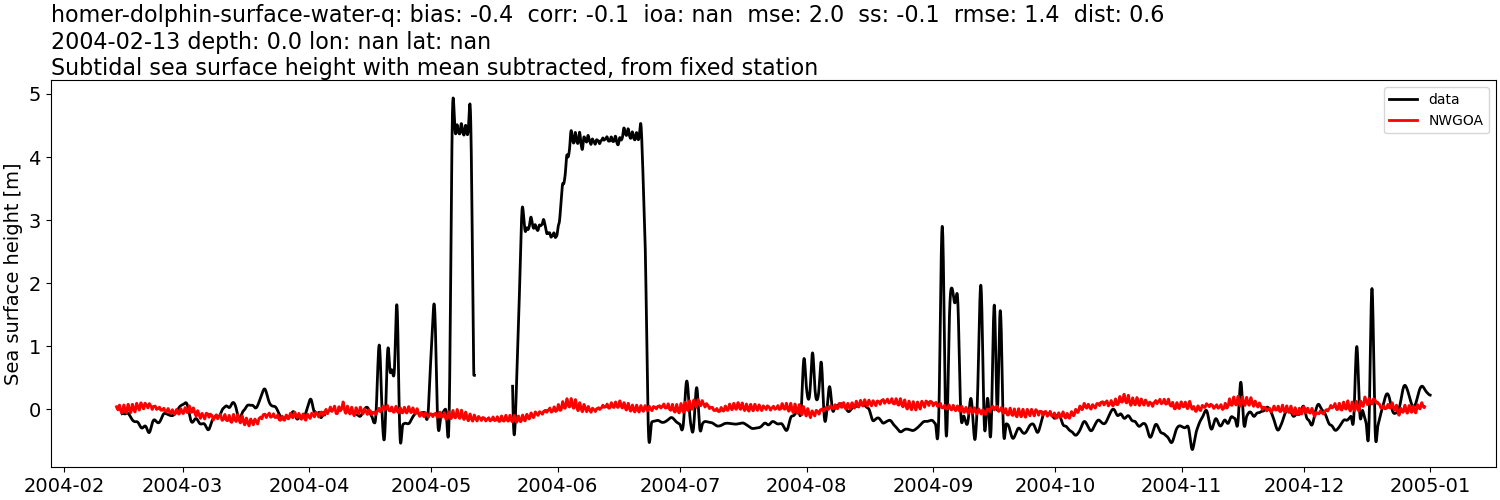
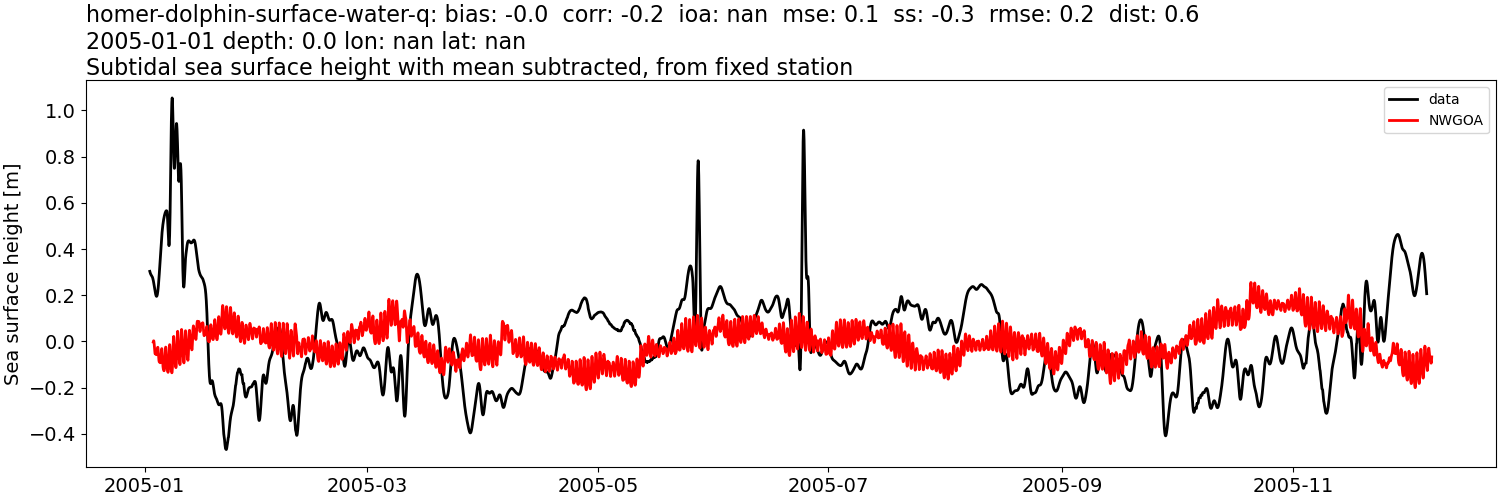
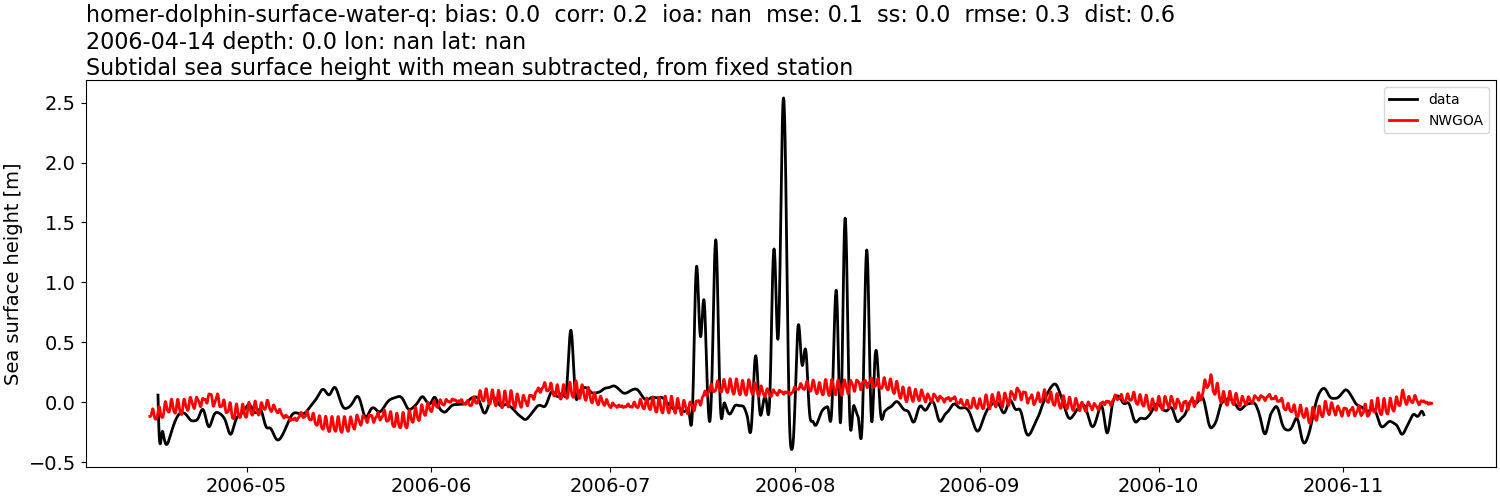
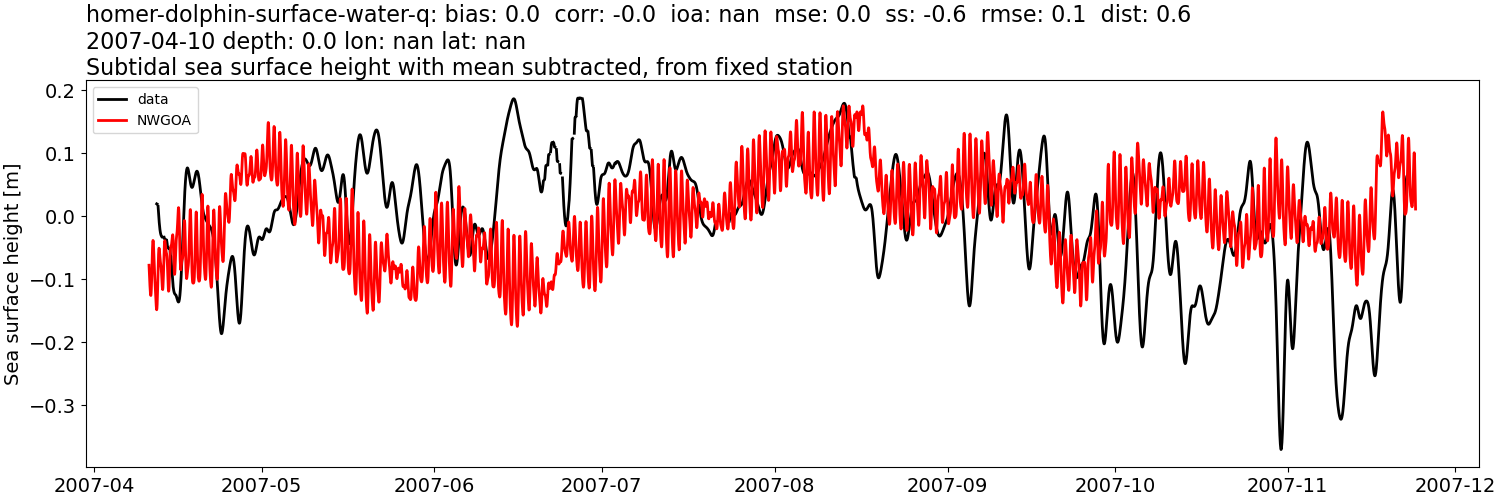
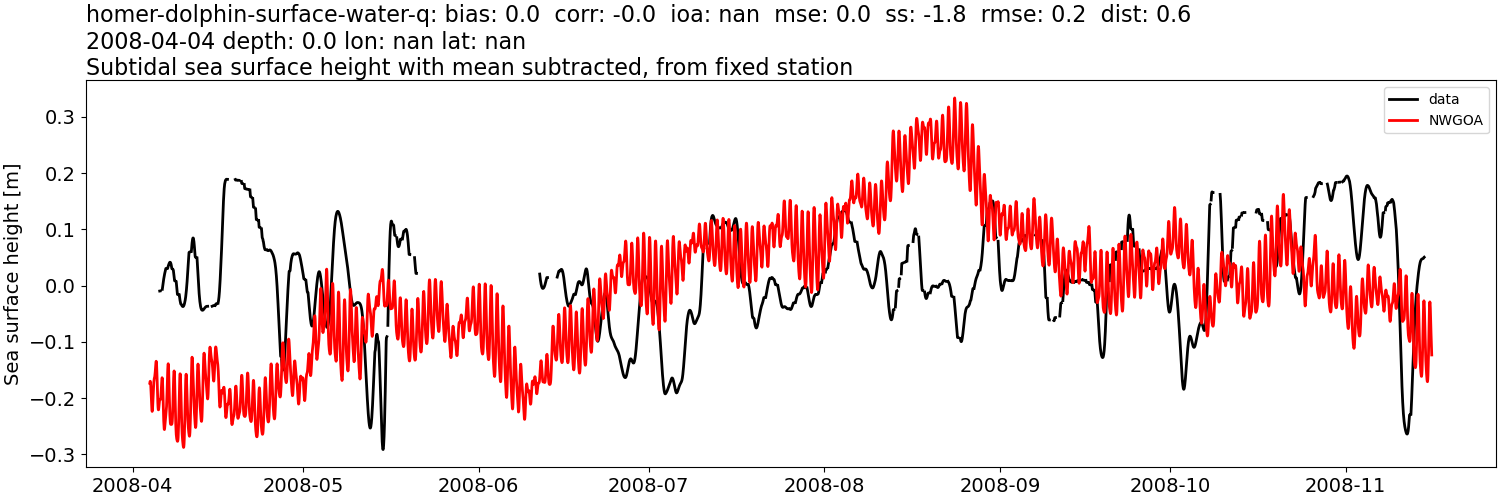
Sea surface height: mean subtracted#
CIOFS#
Comparison plots by year
2004
2005
2006
2007
2008
2009
2010
NWGOA#
Comparison plots by year
2004
2005
2006
2007
2008
Sea surface height: mean subtracted, then tidally-filtered#
CIOFS#
Comparison plots by year
2004
2005
2006
2007
2008
2009
2010
NWGOA#
Comparison plots by year
2004
2005
2006
2007
2008
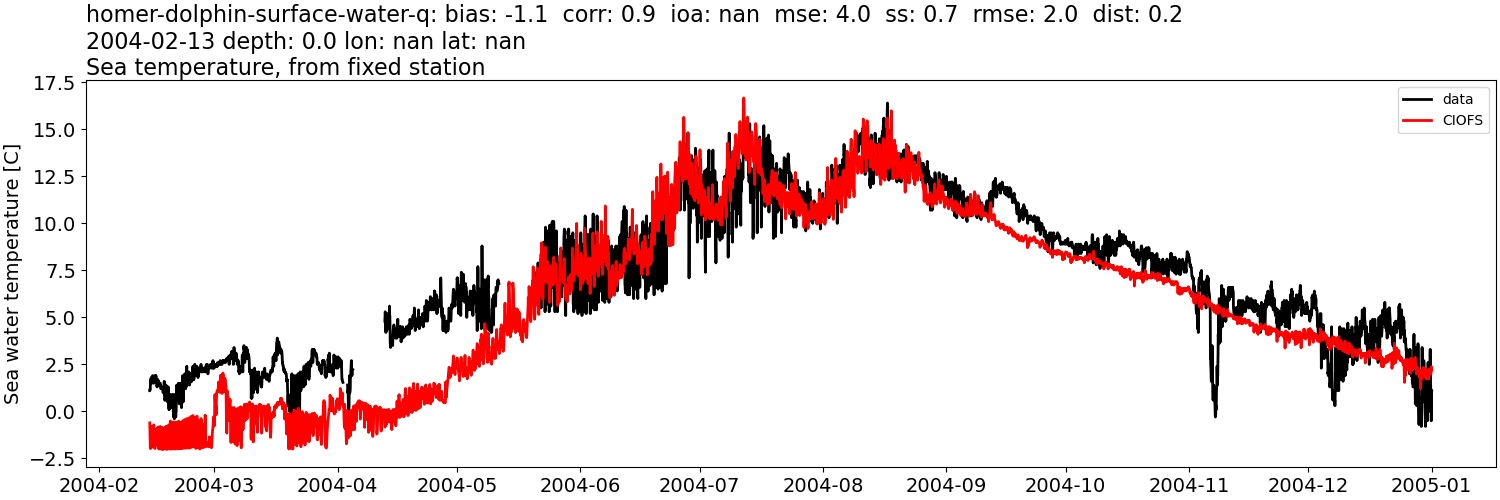
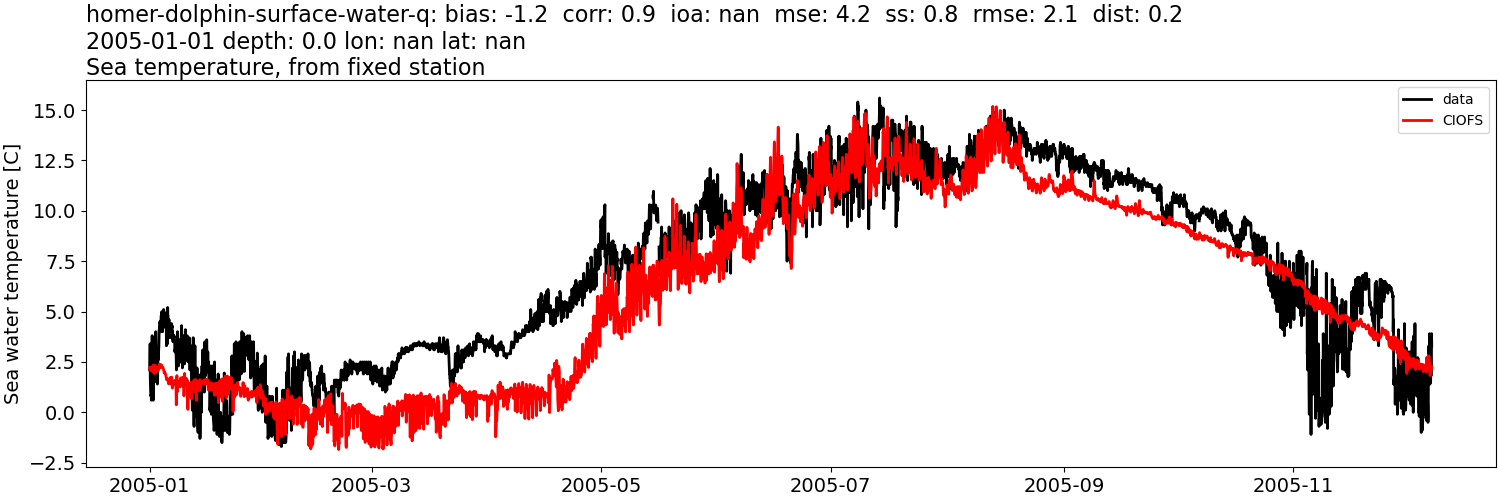
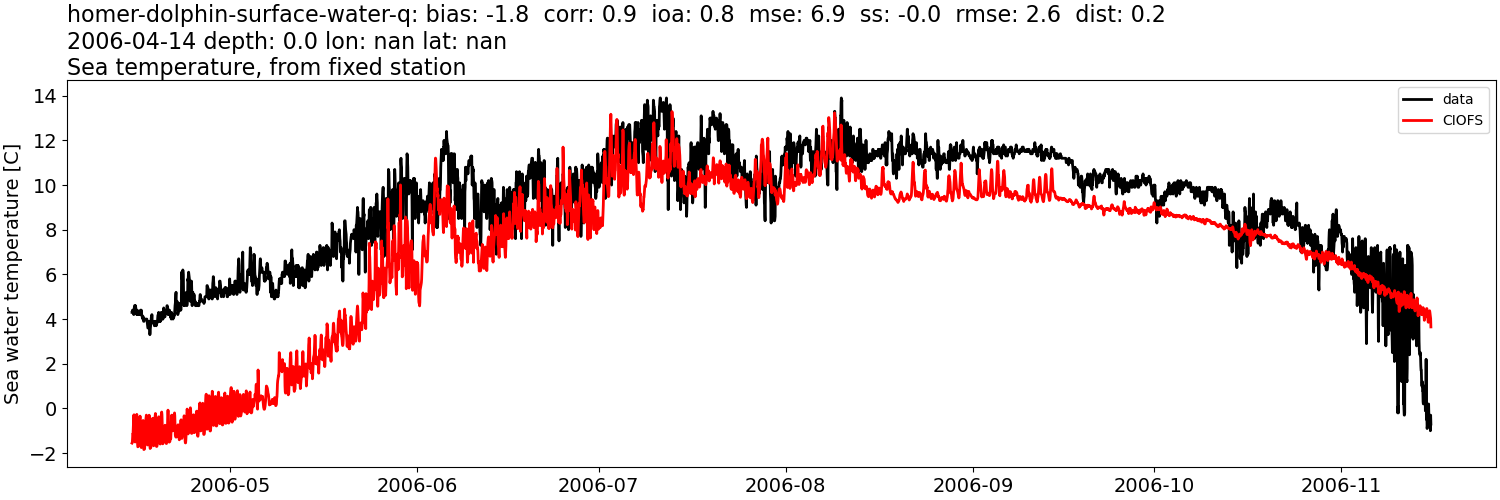
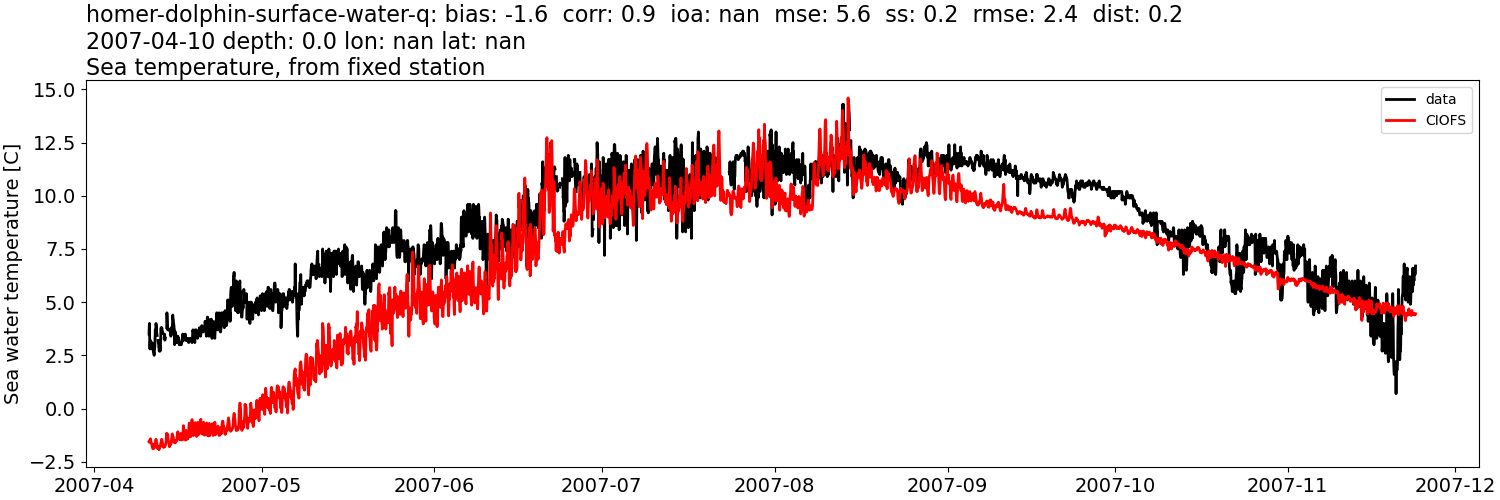
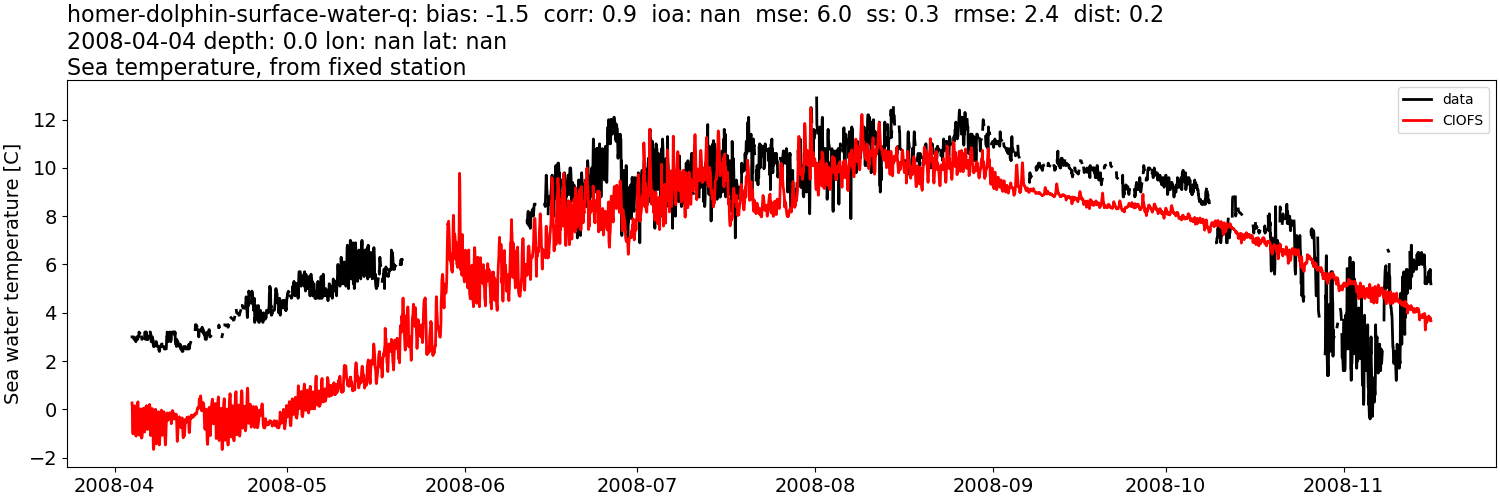
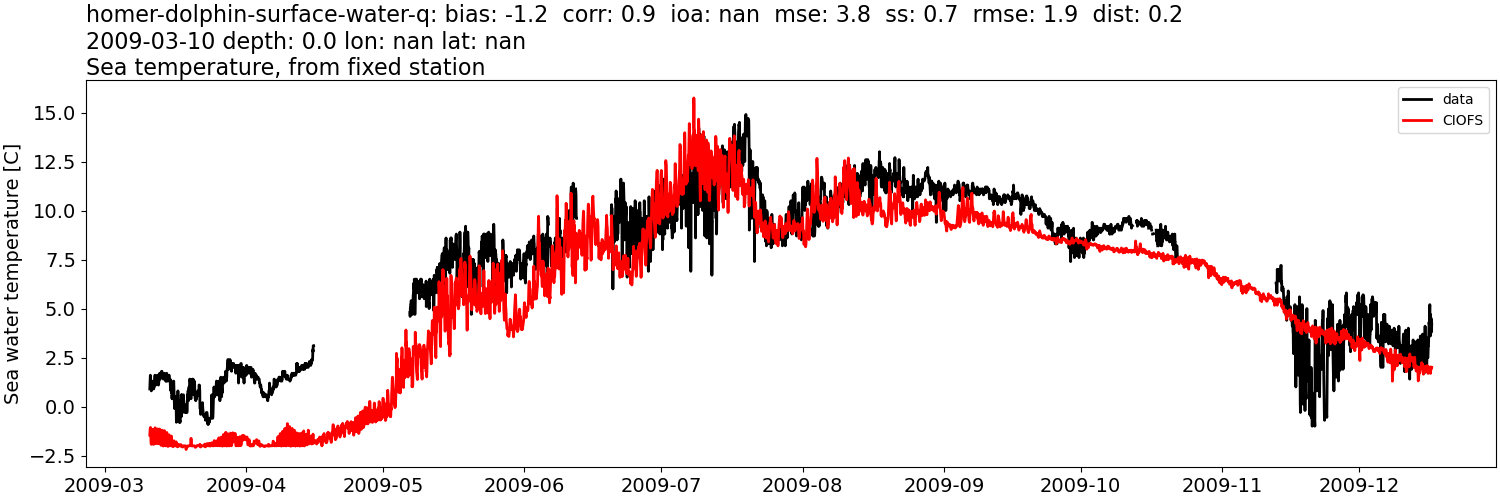
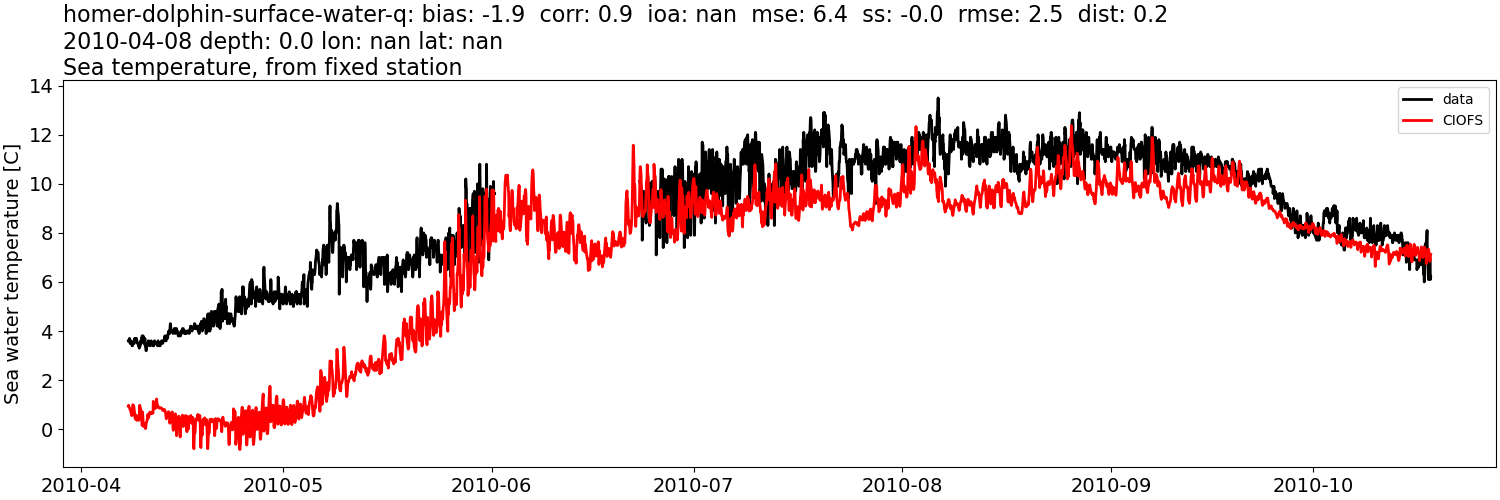
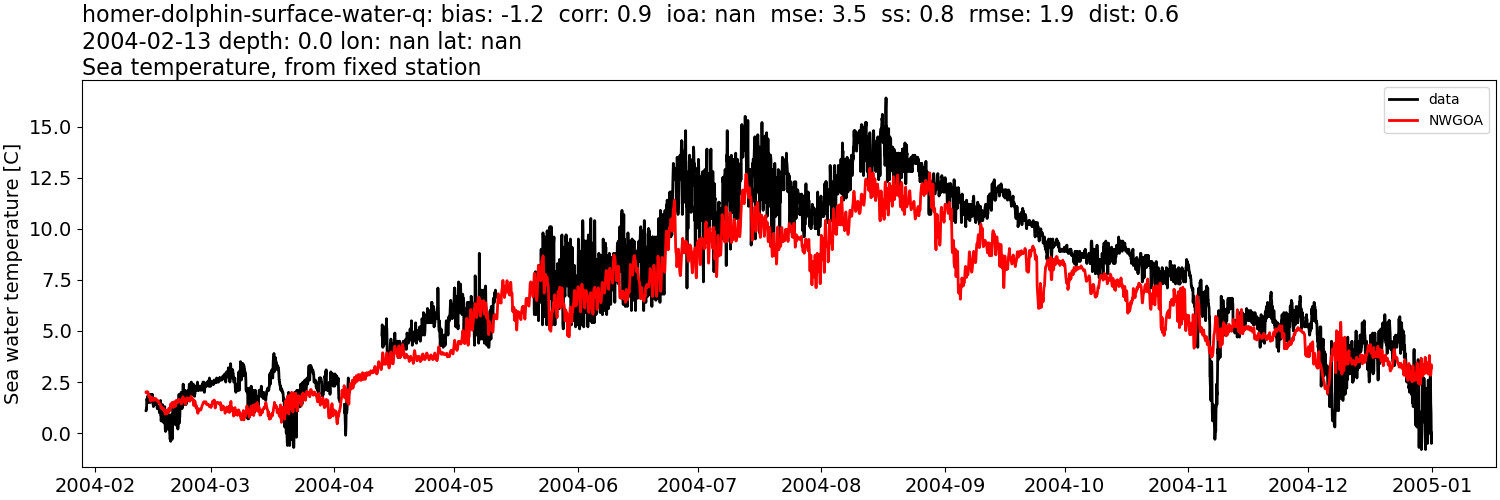
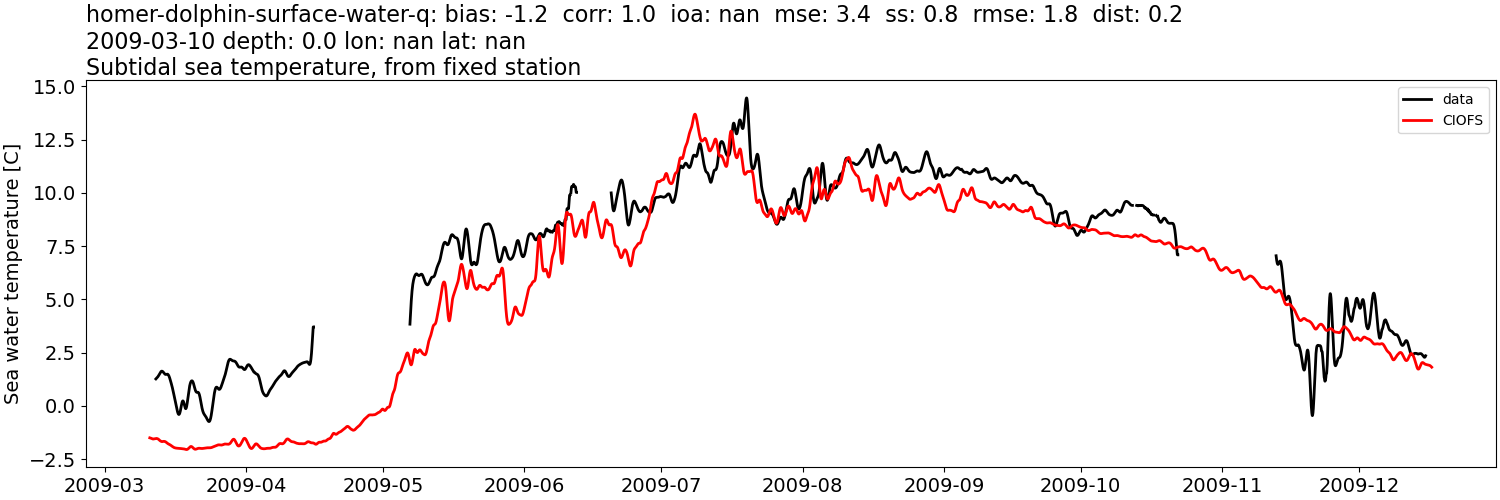
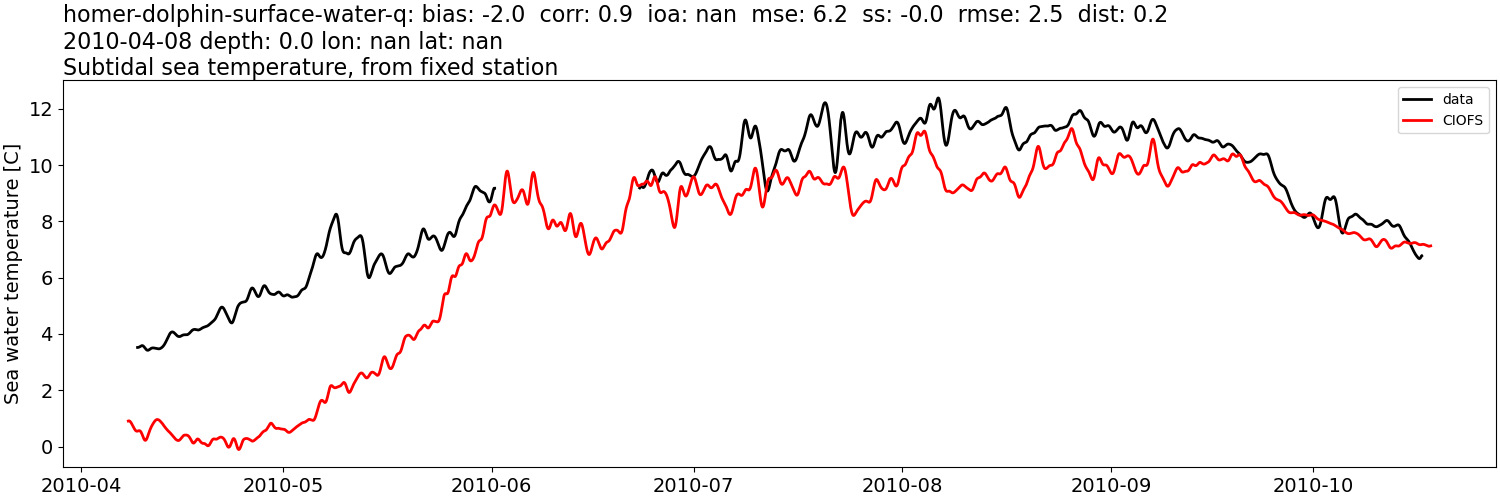
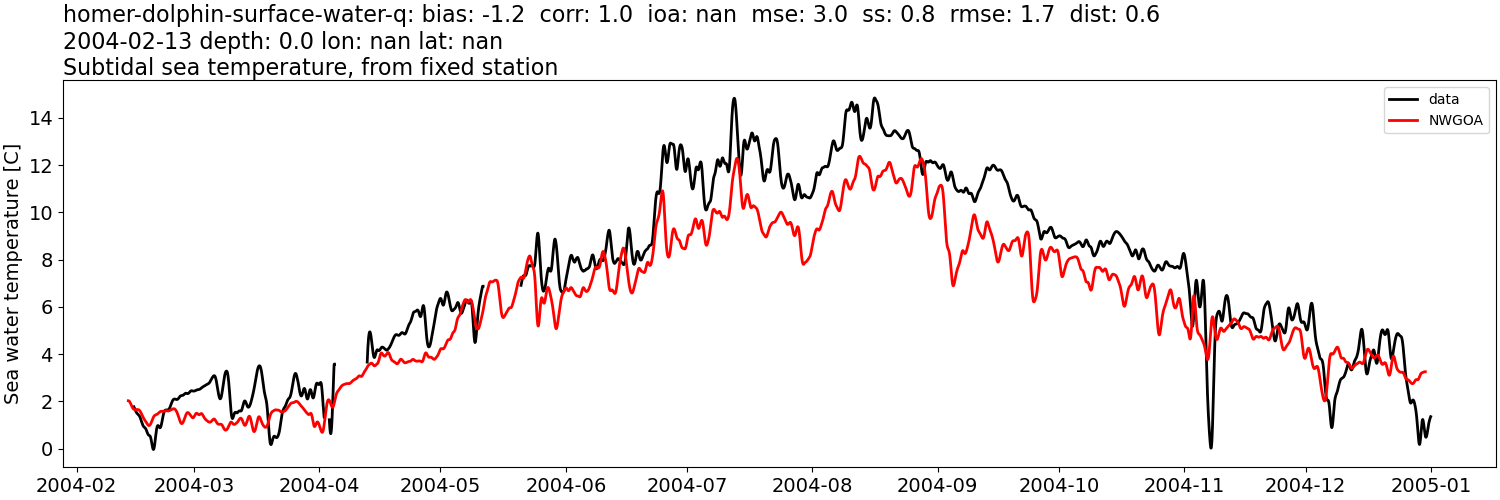
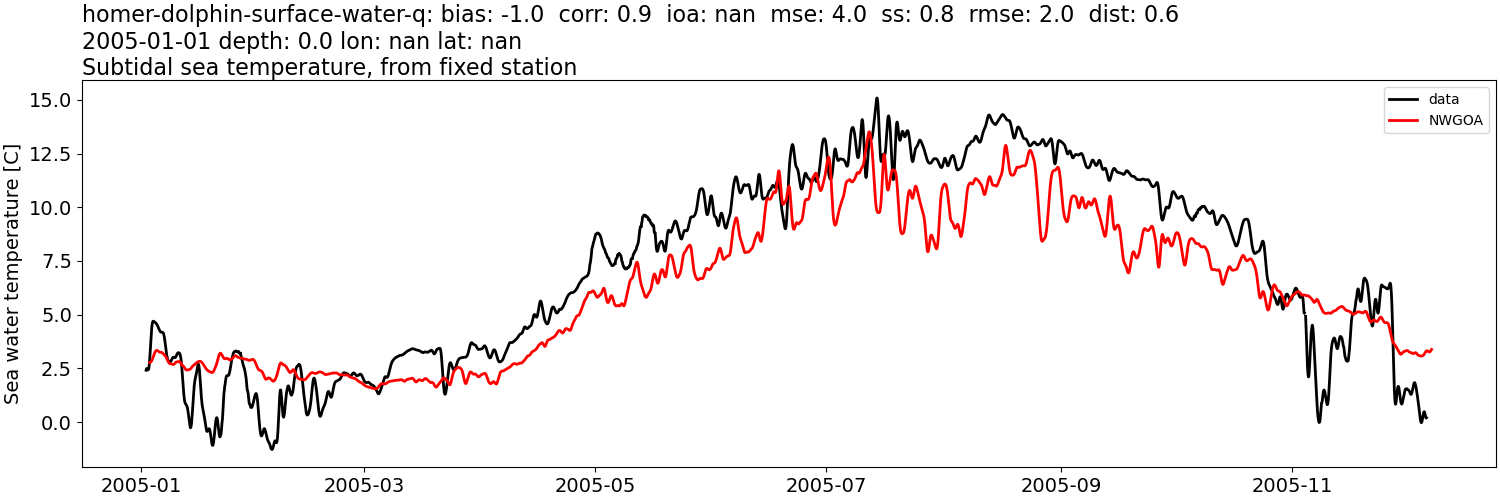
Sea water temperature:#
CIOFS#
Comparison plots by year
2004
2005
2006
2007
2008
2009
2010
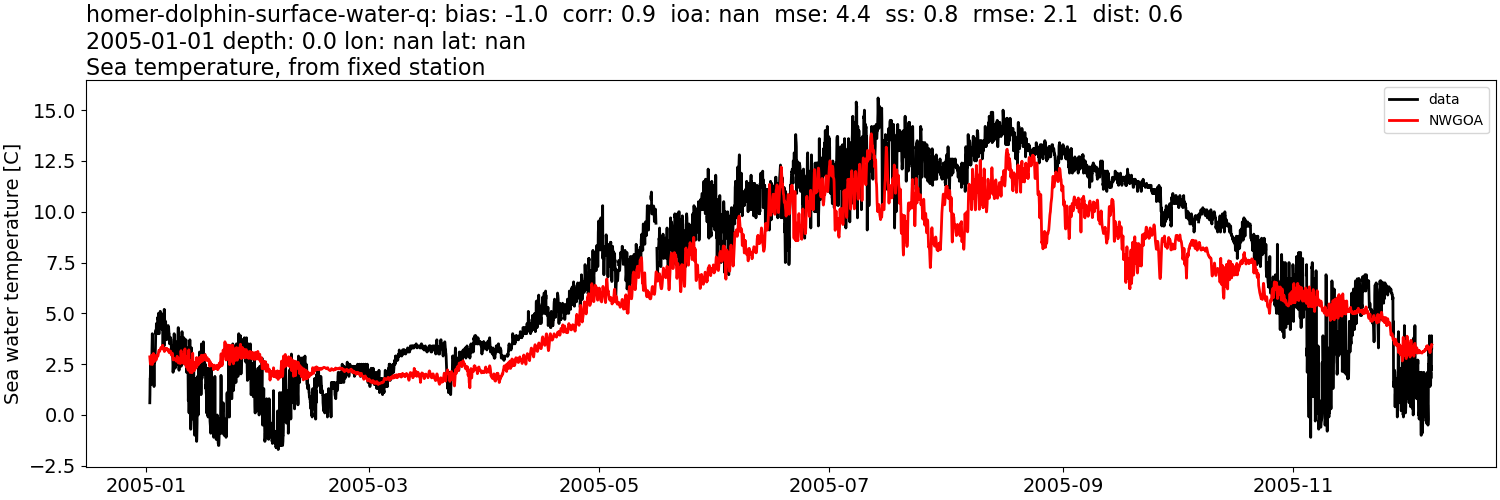
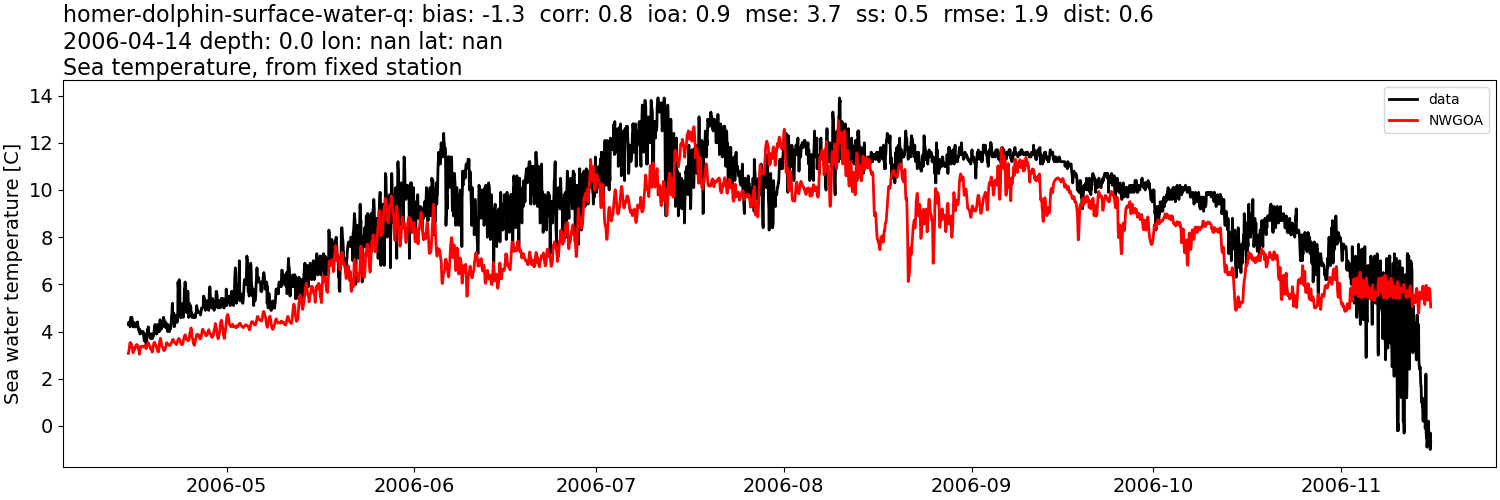
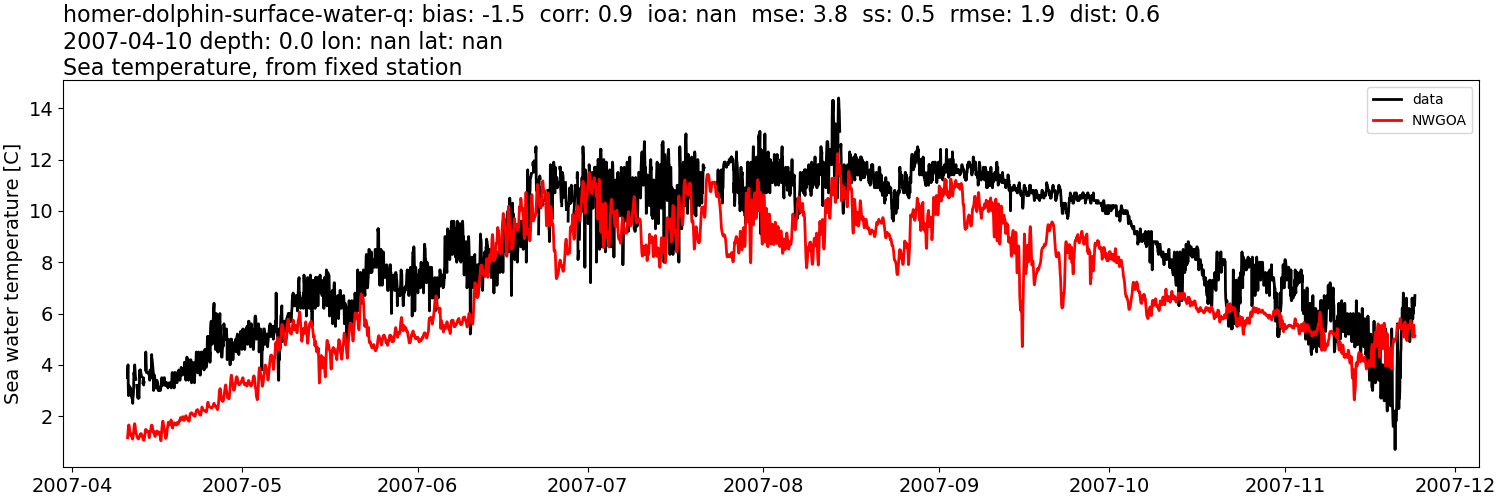
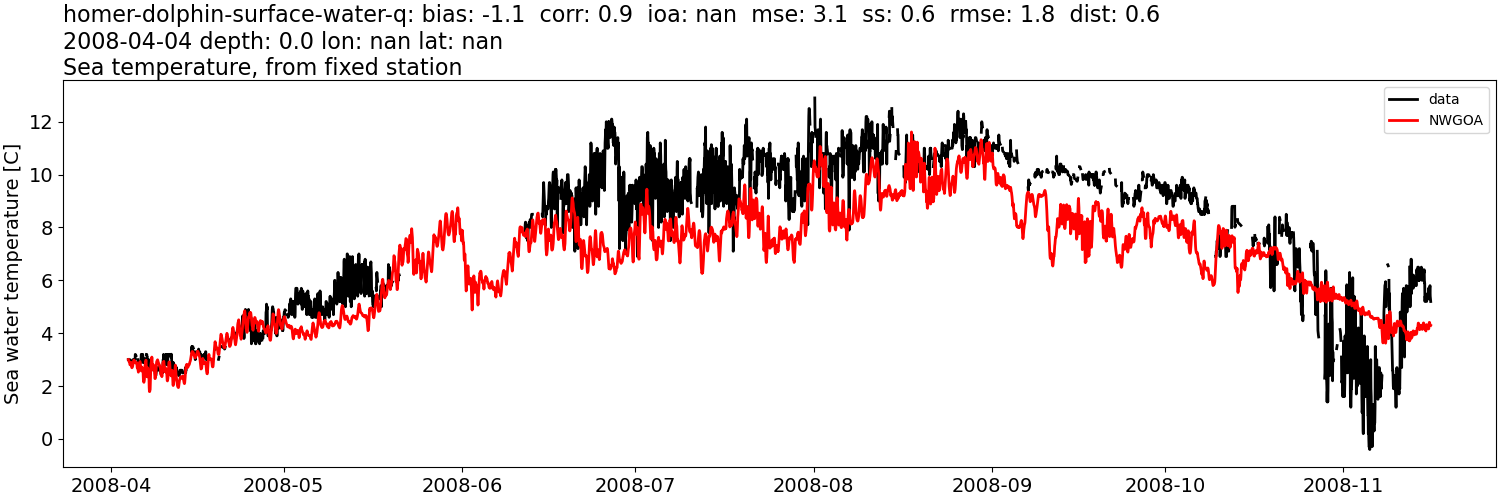
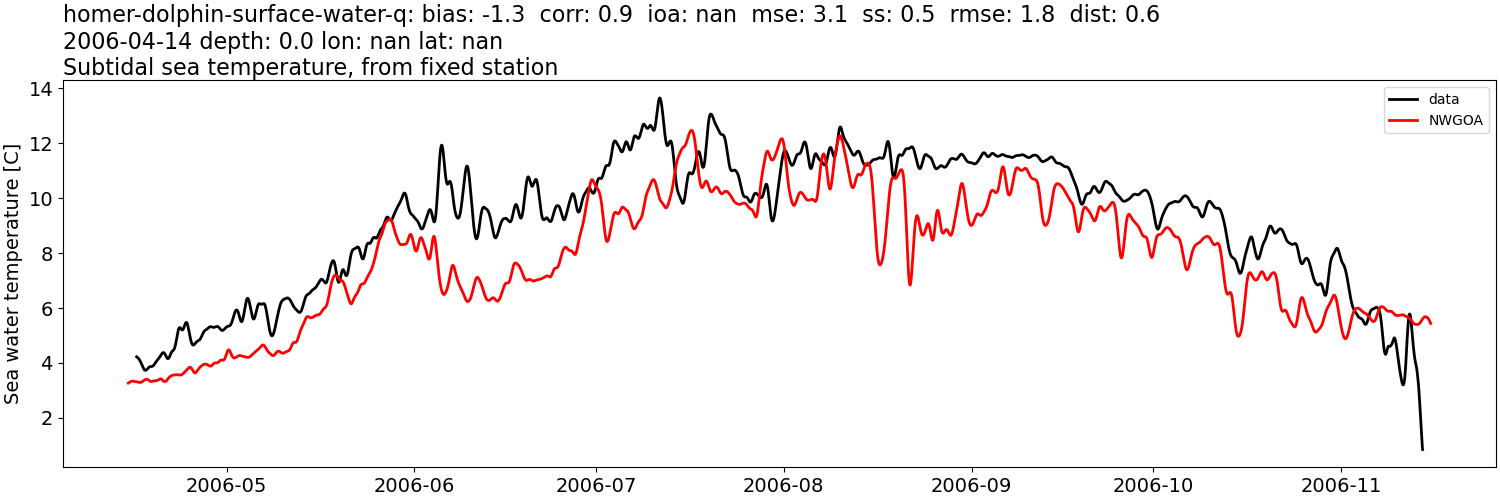
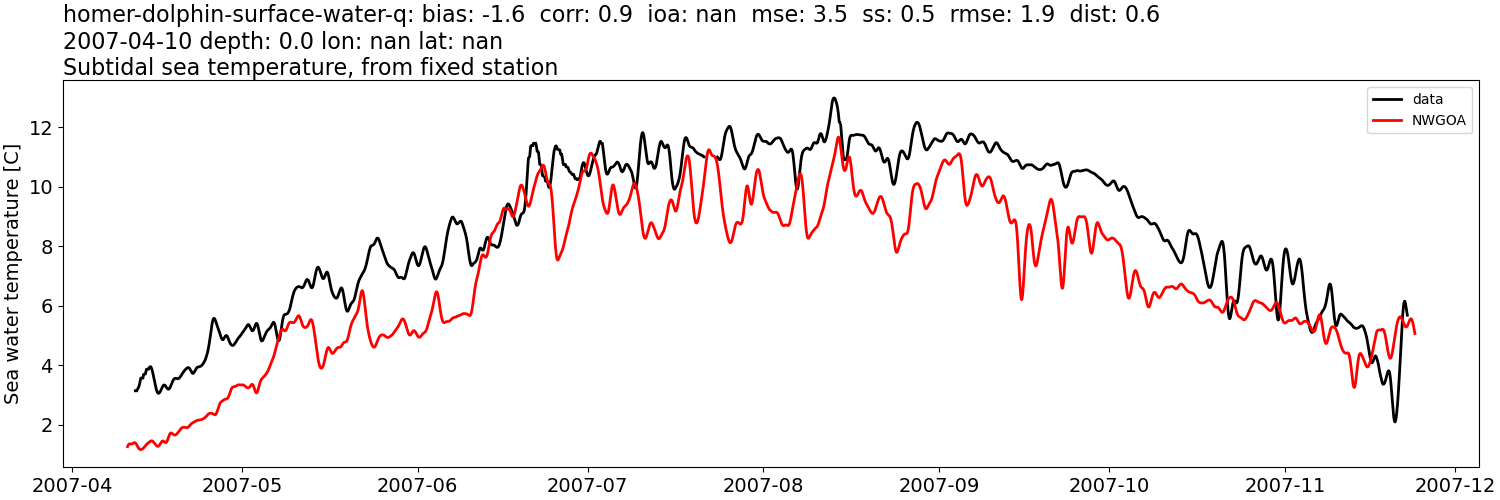
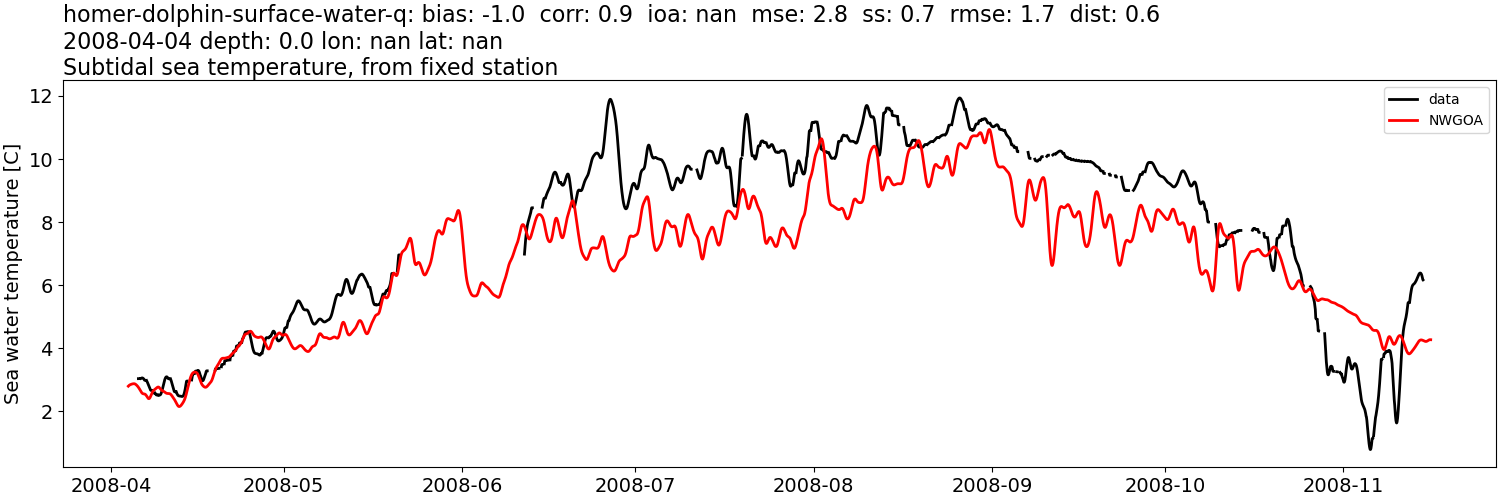
NWGOA#
Comparison plots by year
2004
2005
2006
2007
2008
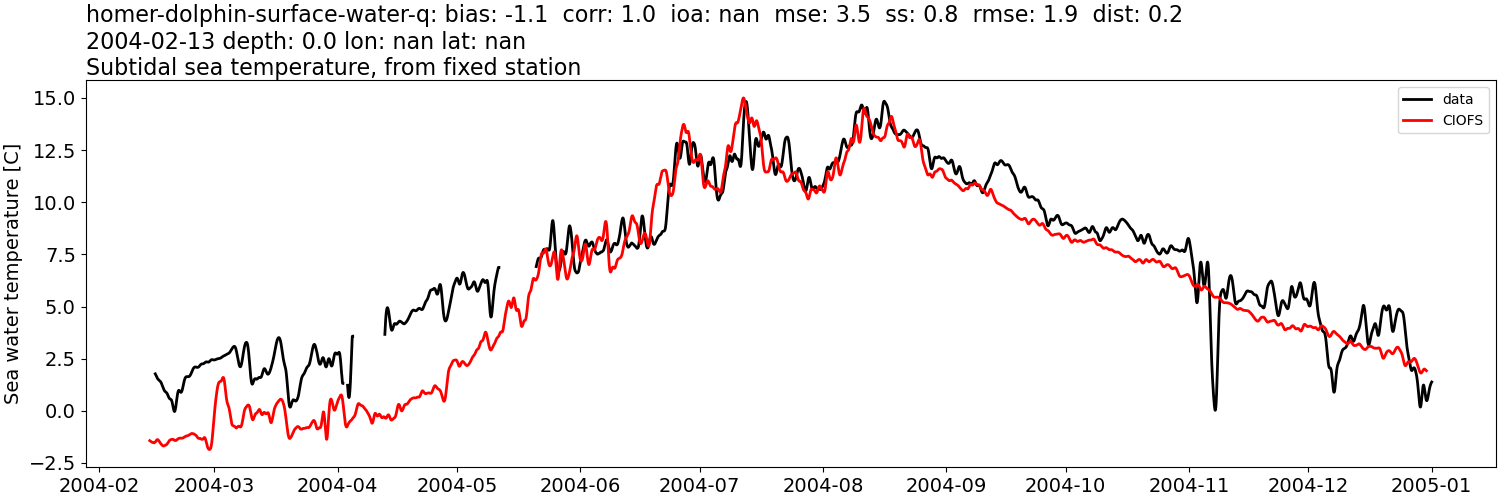
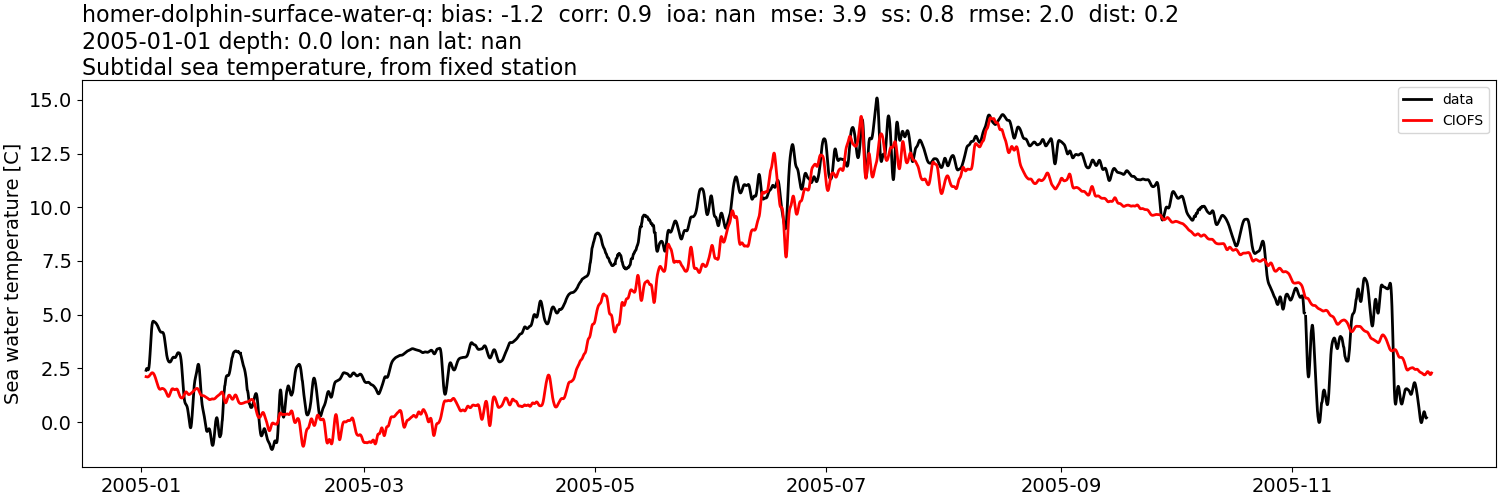
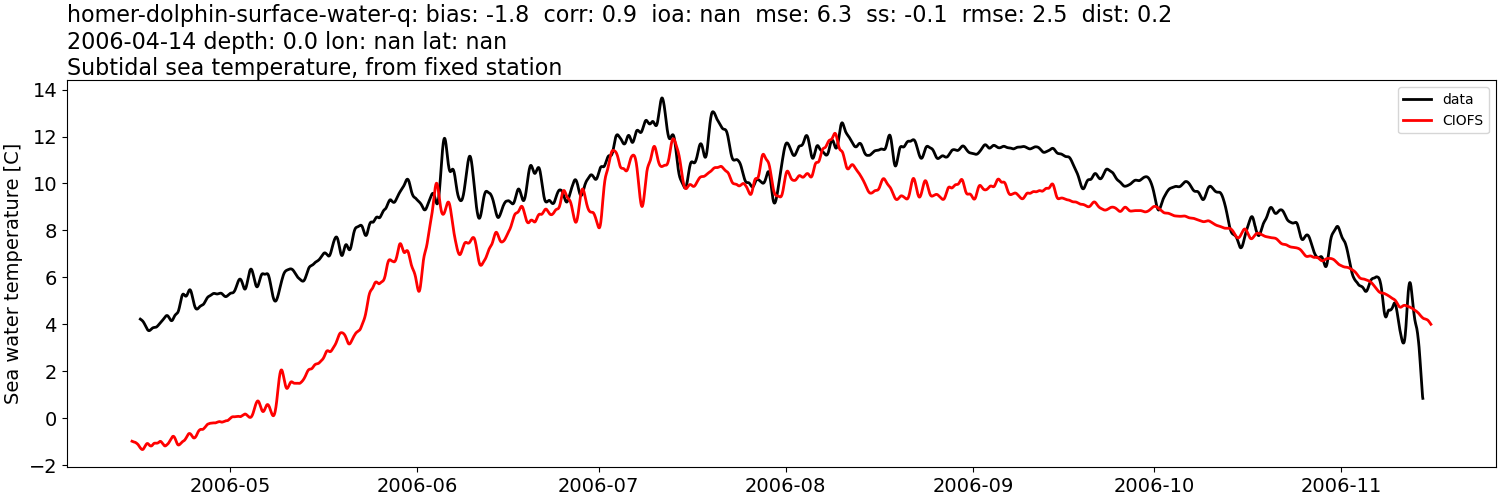
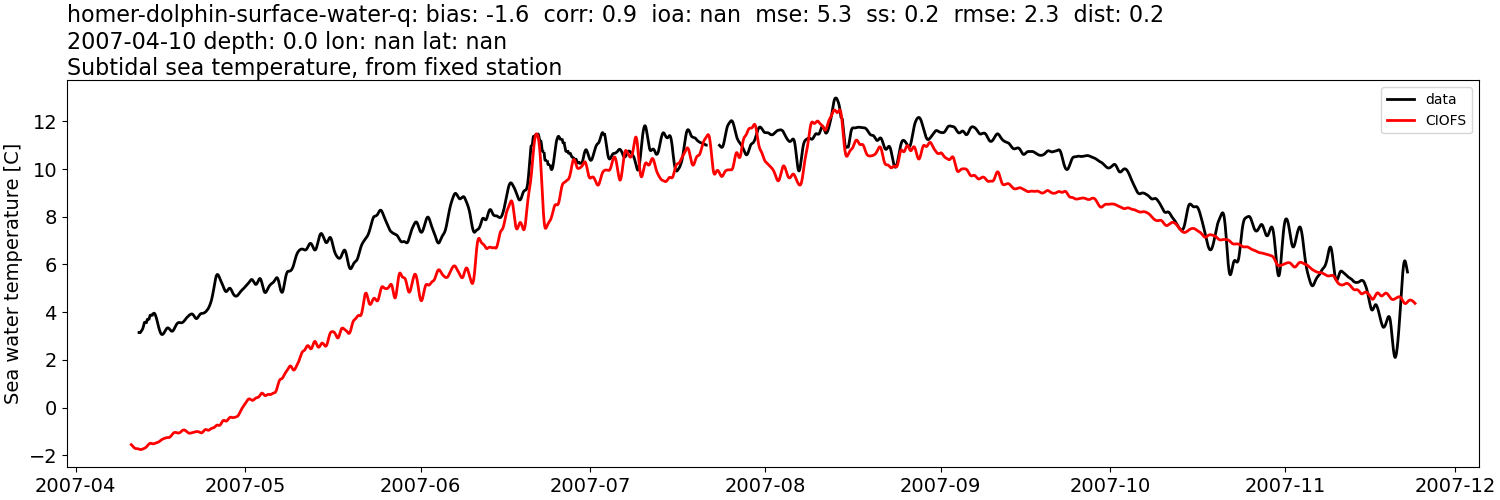
Sea water temperature: tidally-filtered#
CIOFS#
Comparison plots by year
2004
2005
2006
2007
2008

2009
2010
NWGOA#
Comparison plots by year
2004
2005
2006
2007
2008
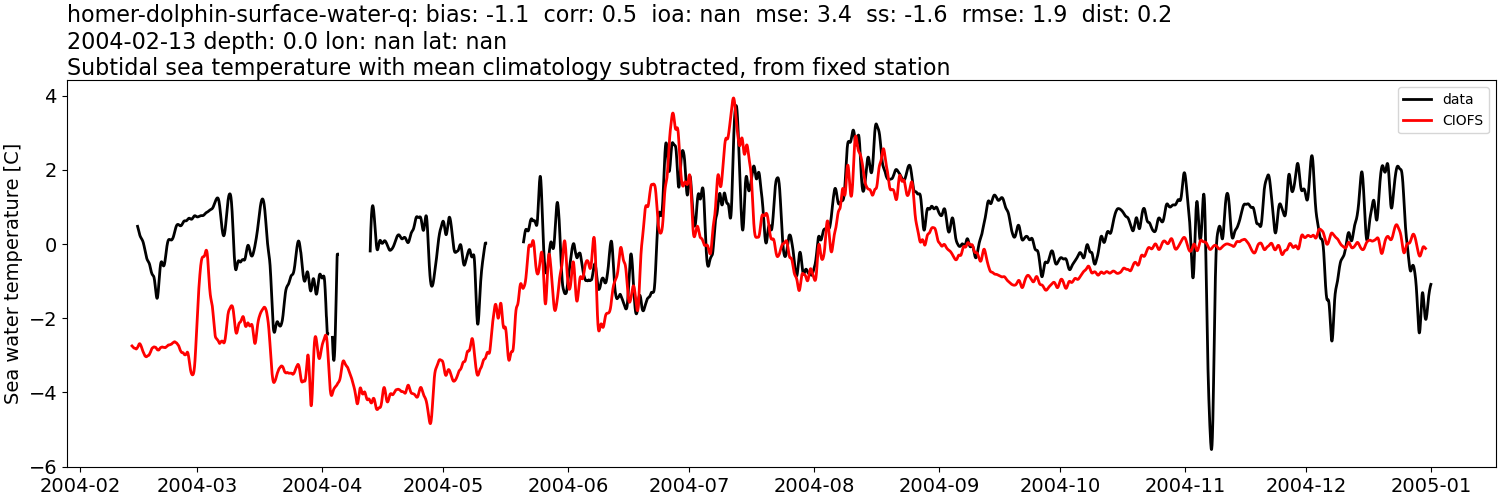
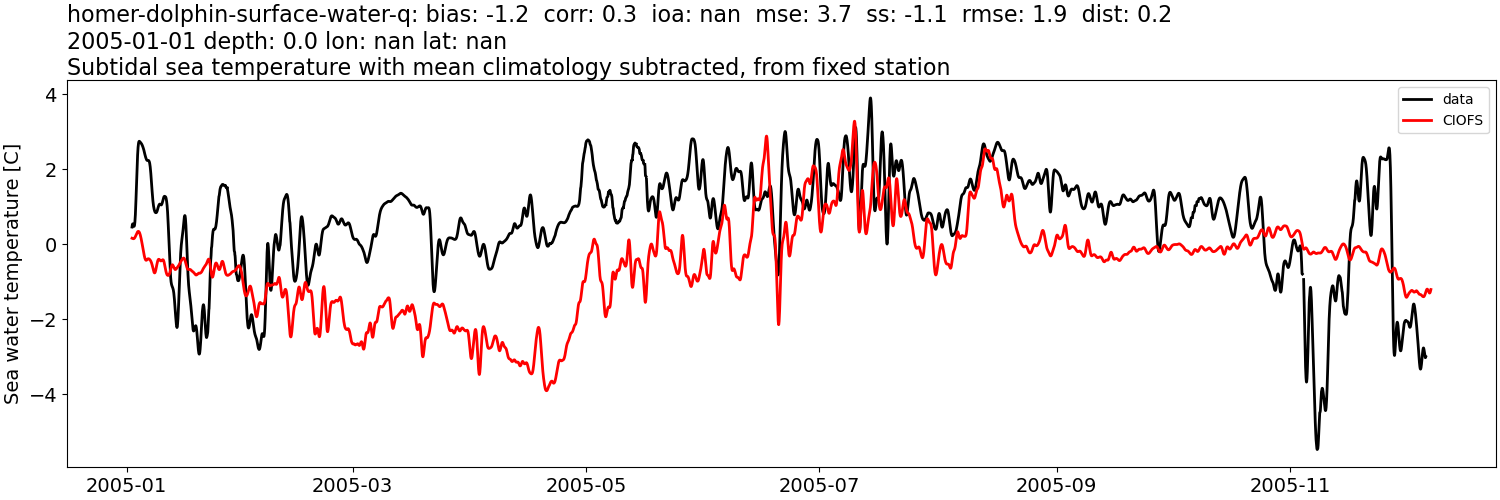
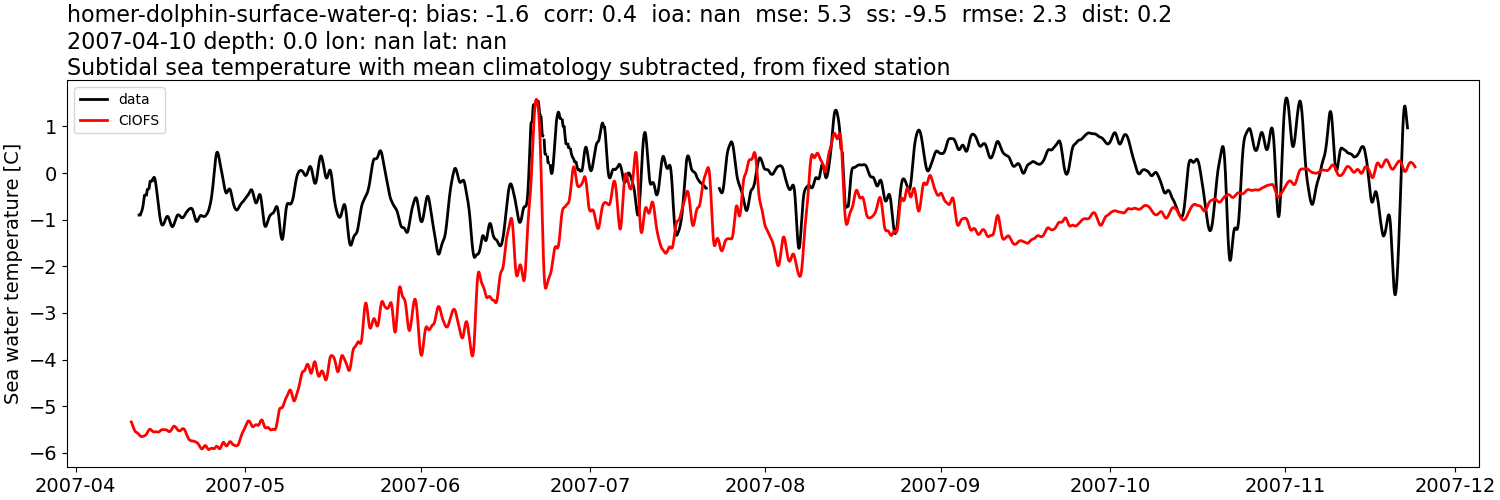
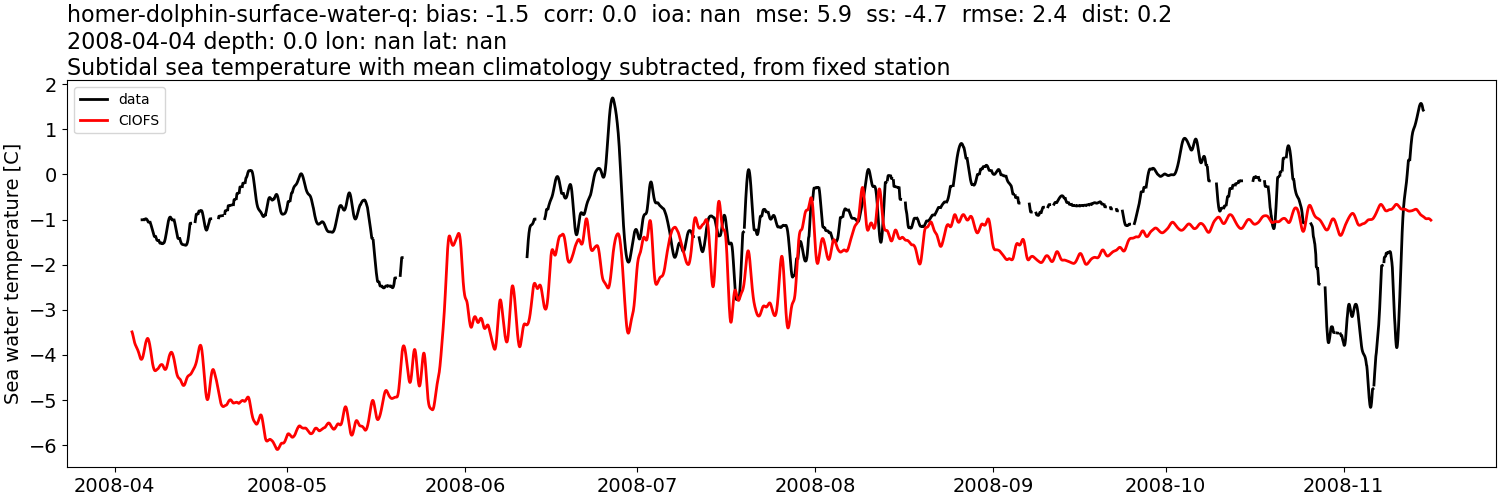
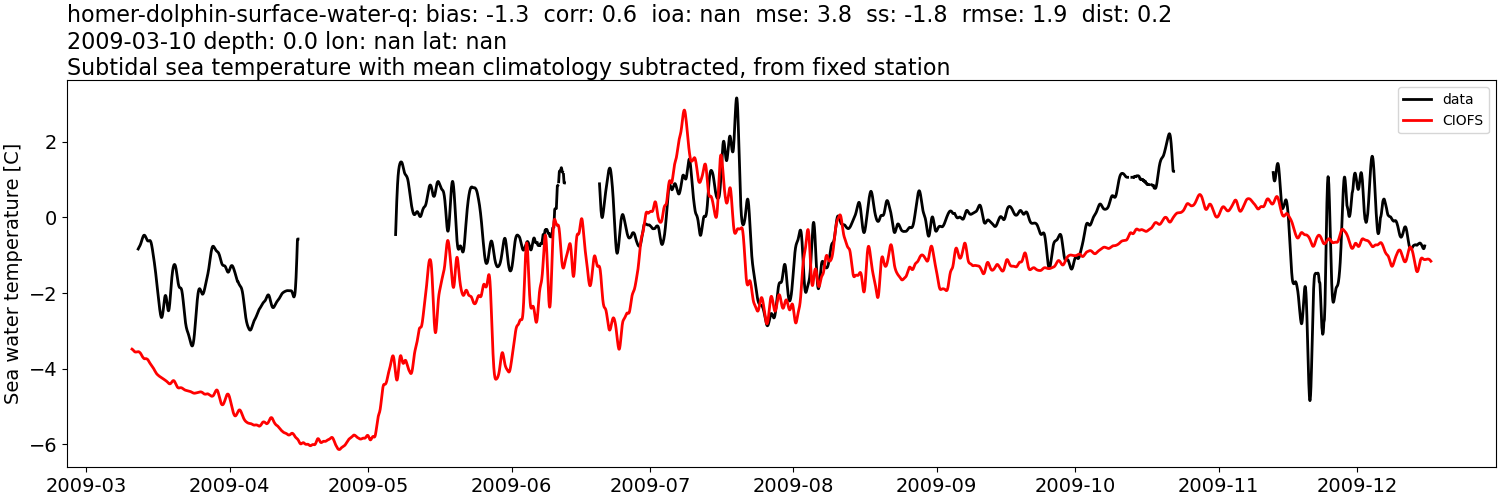
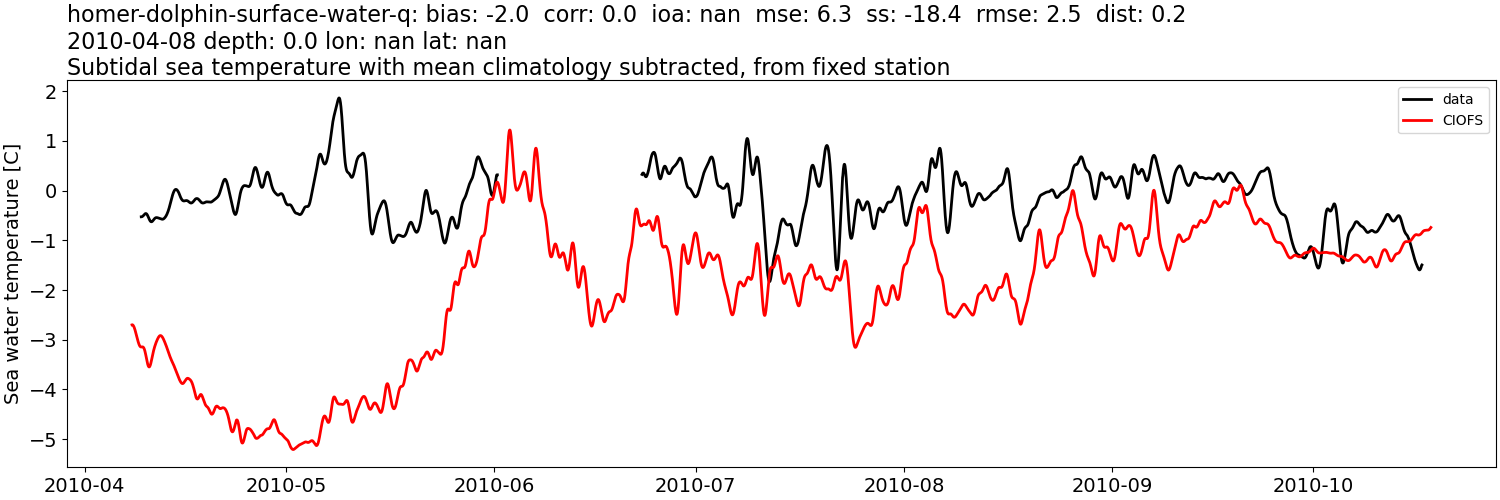
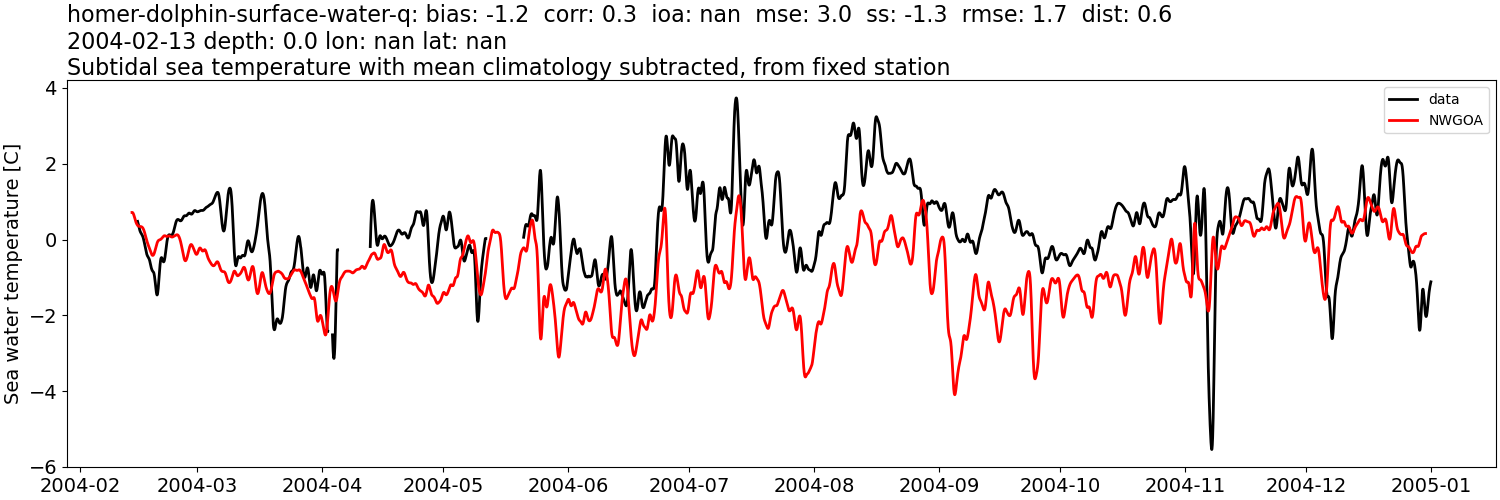
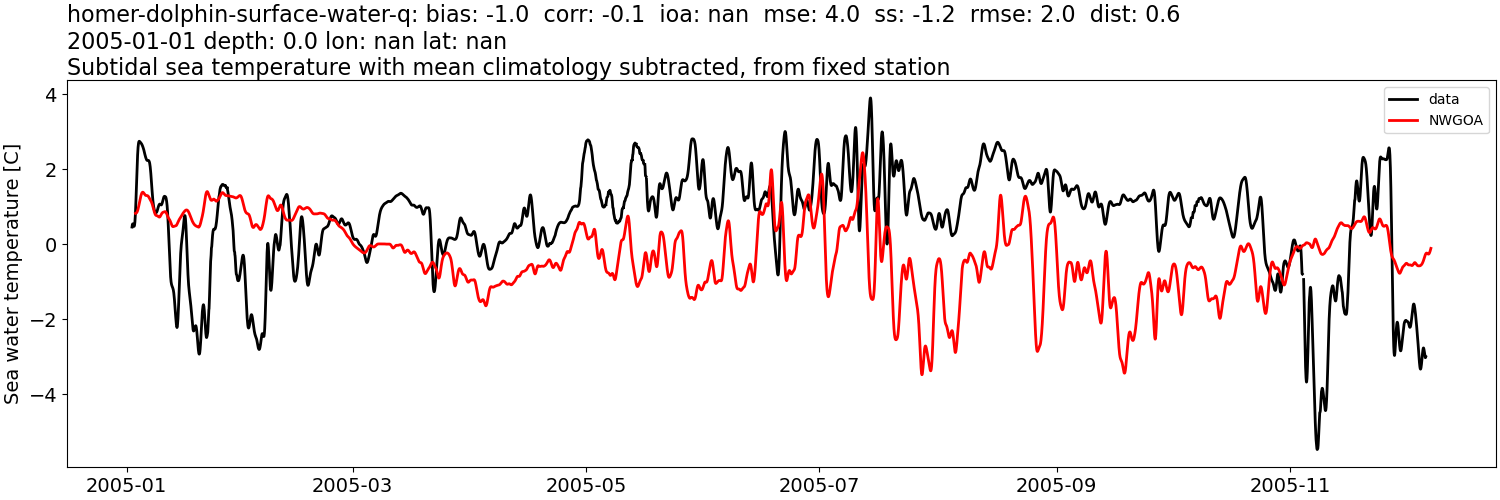
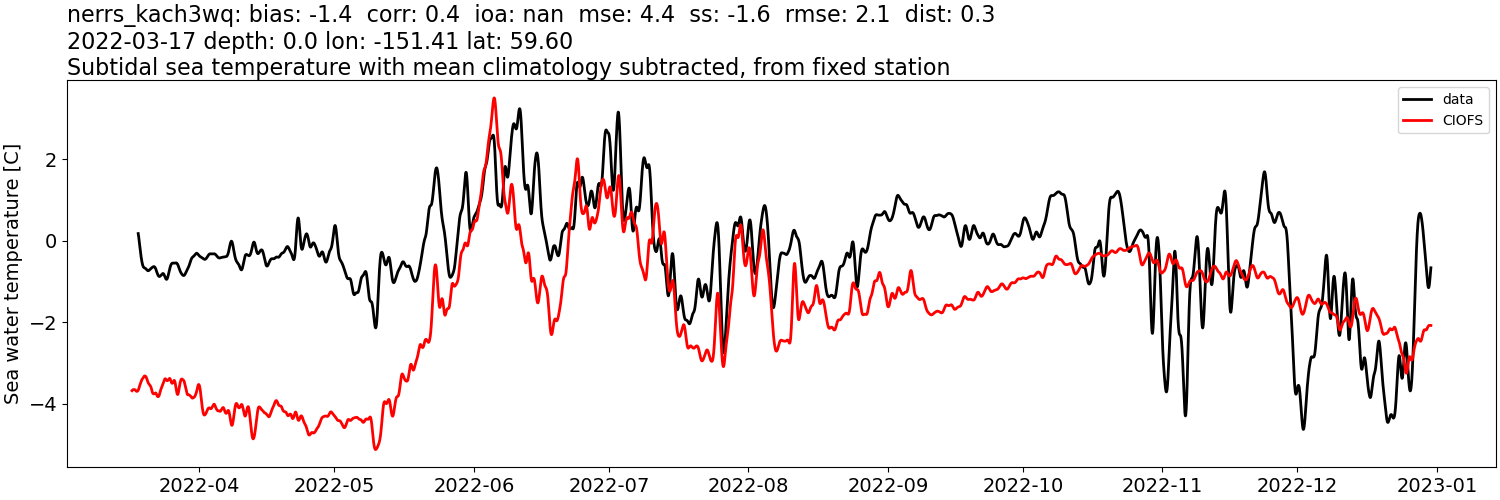
Sea water temperature: tidally-filtered, then monthly mean from data subtracted#
CIOFS#
Comparison plots by year
2004
2005
2006

2007
2008
2009
2010
NWGOA#
Comparison plots by year
2004
2005
2006
2007
2008
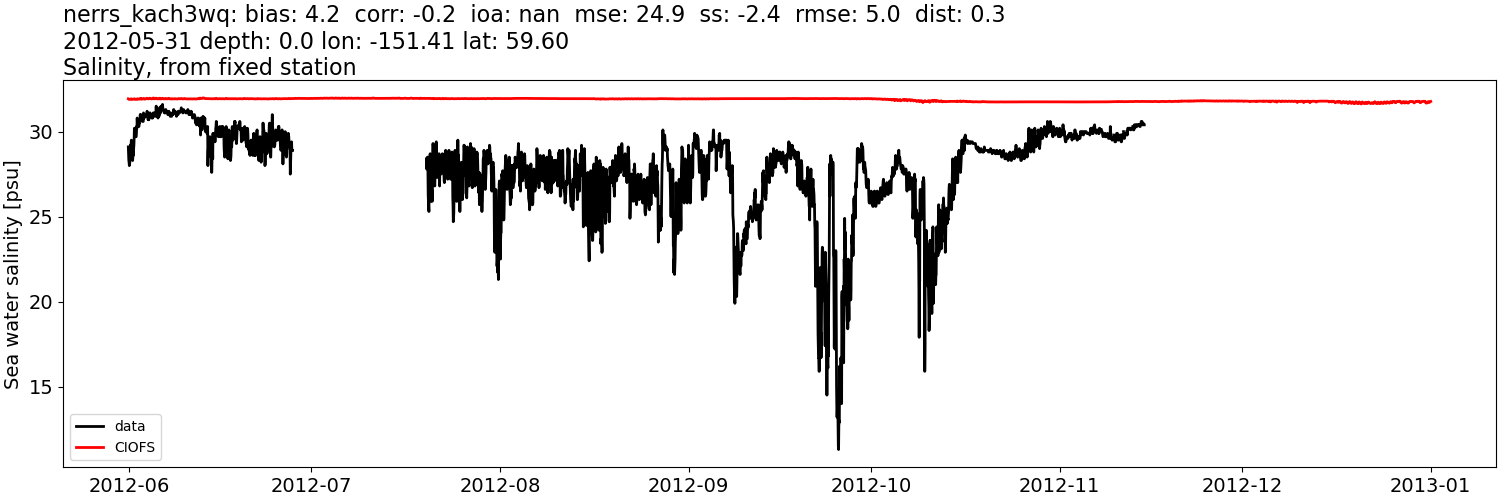
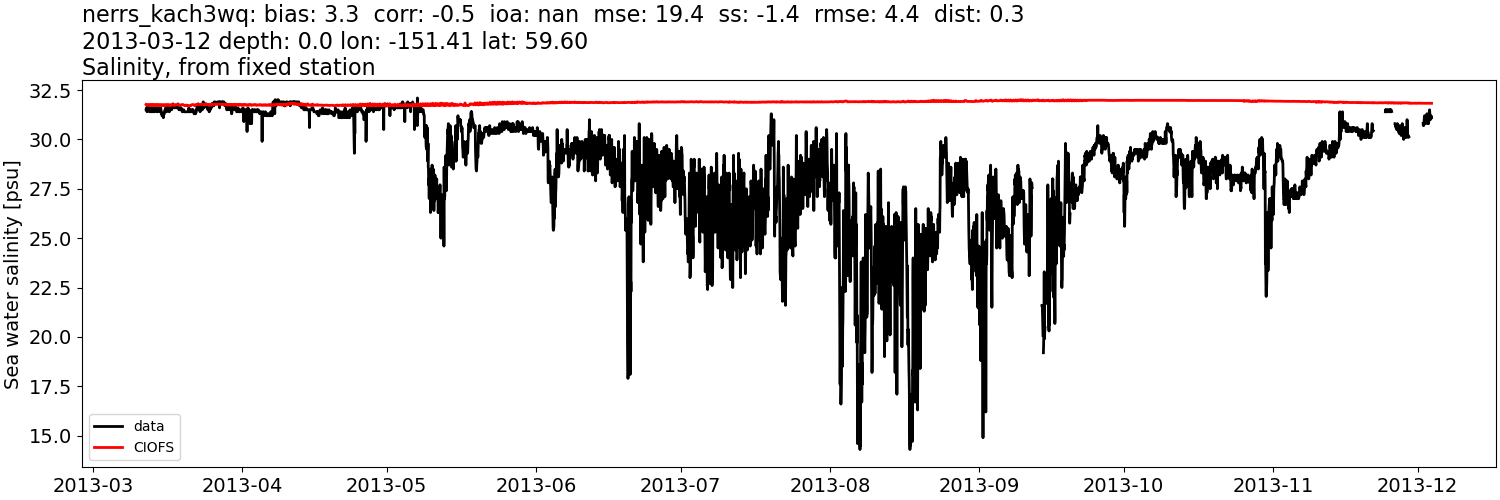
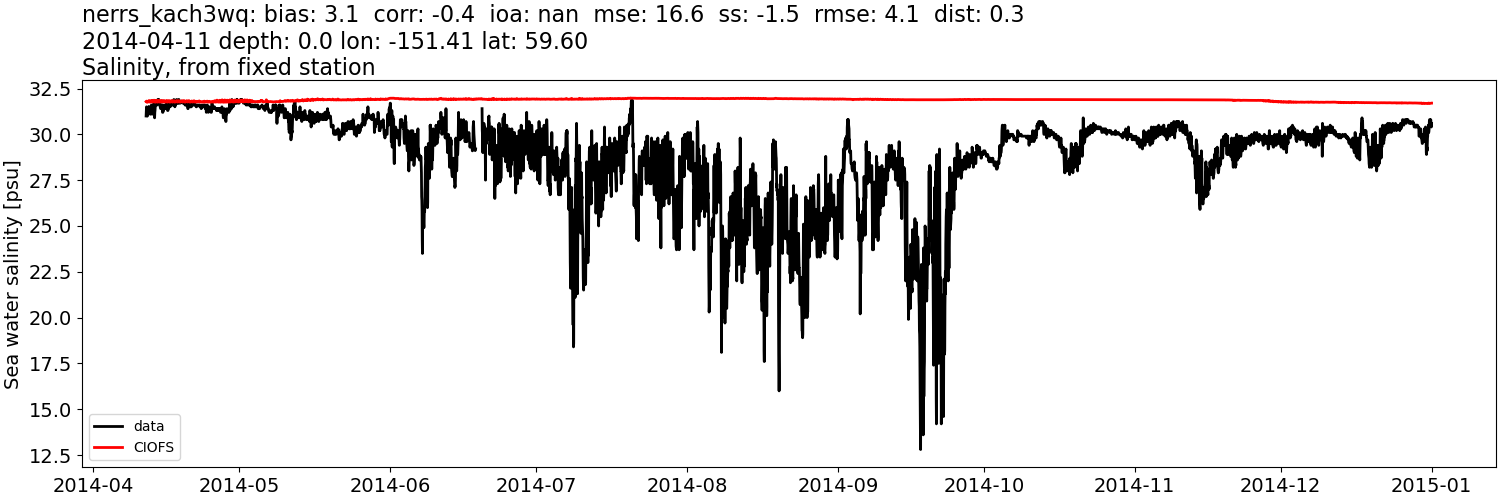
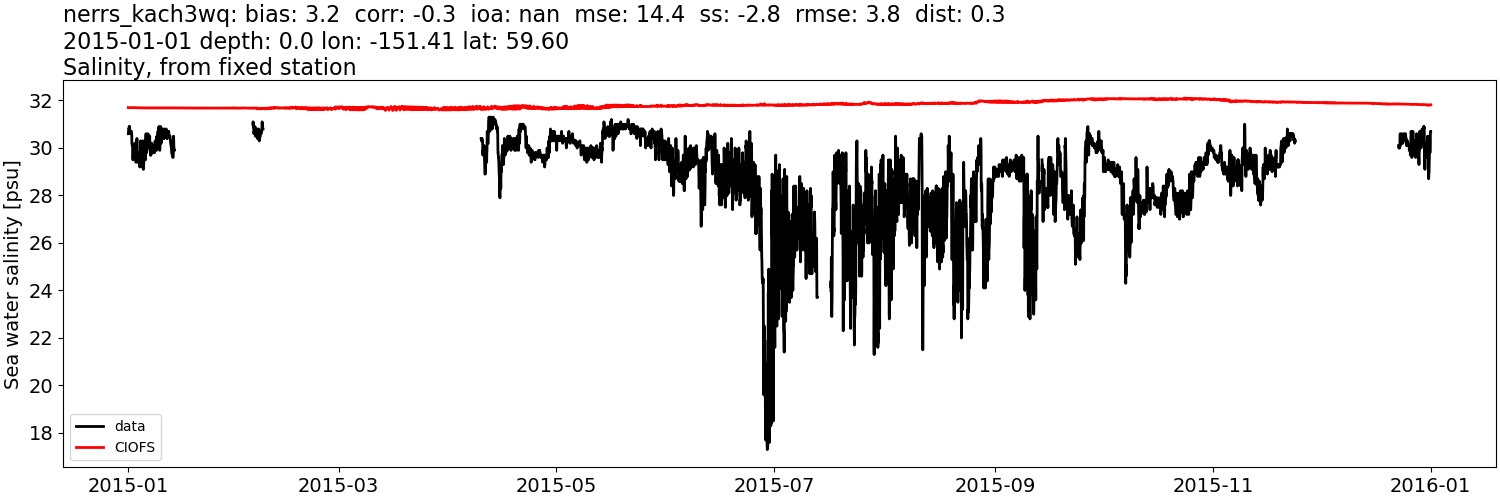
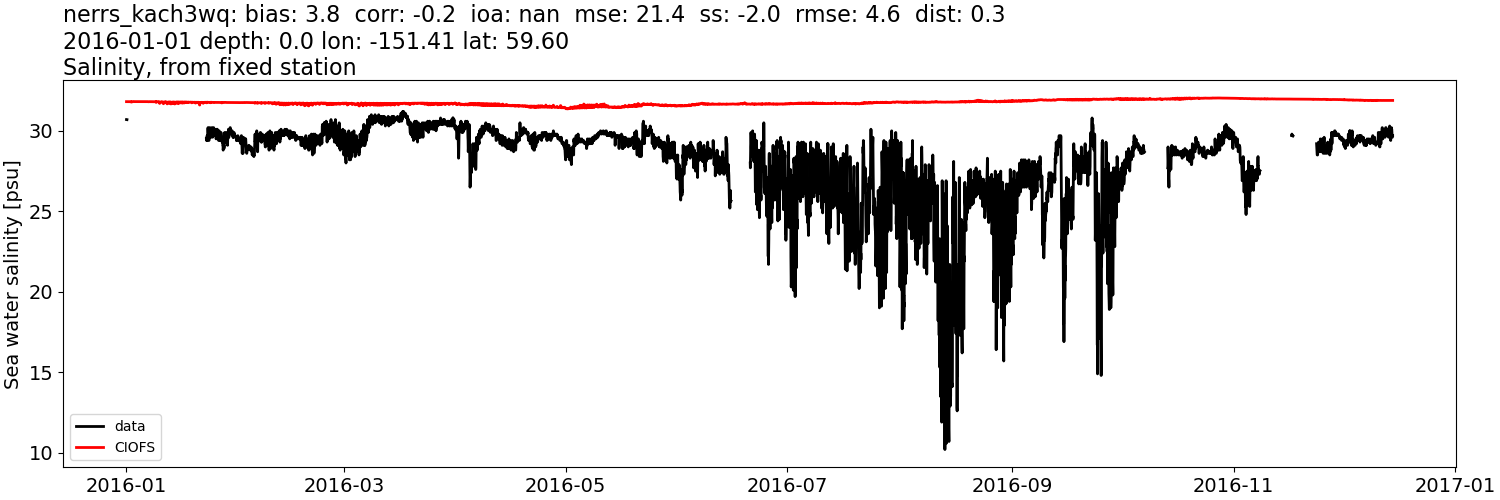
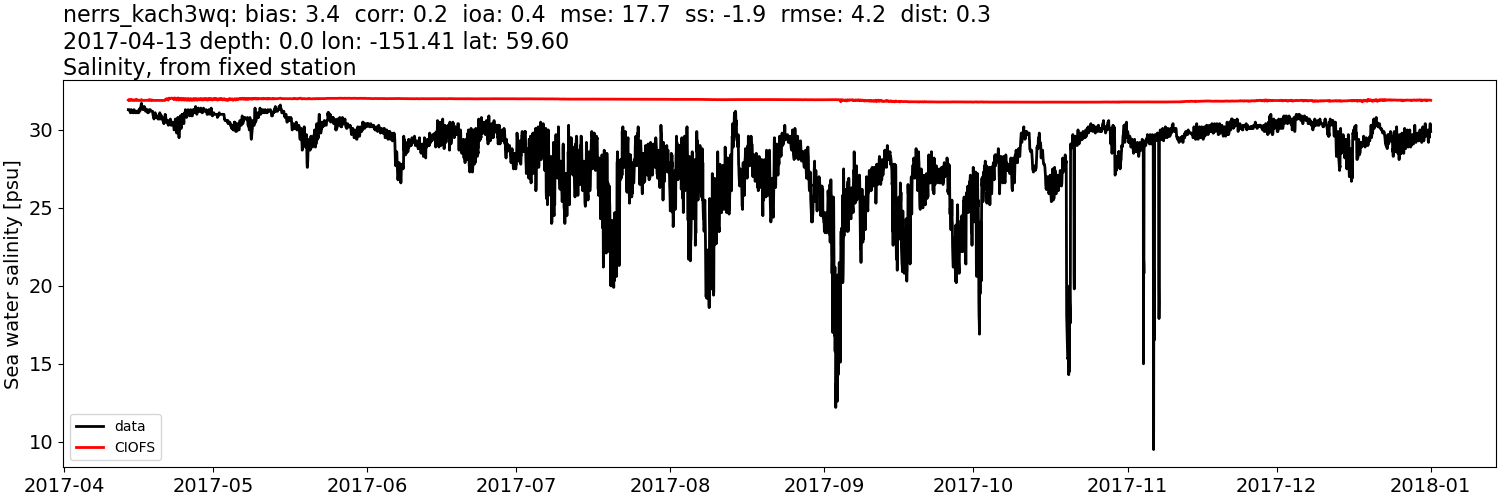
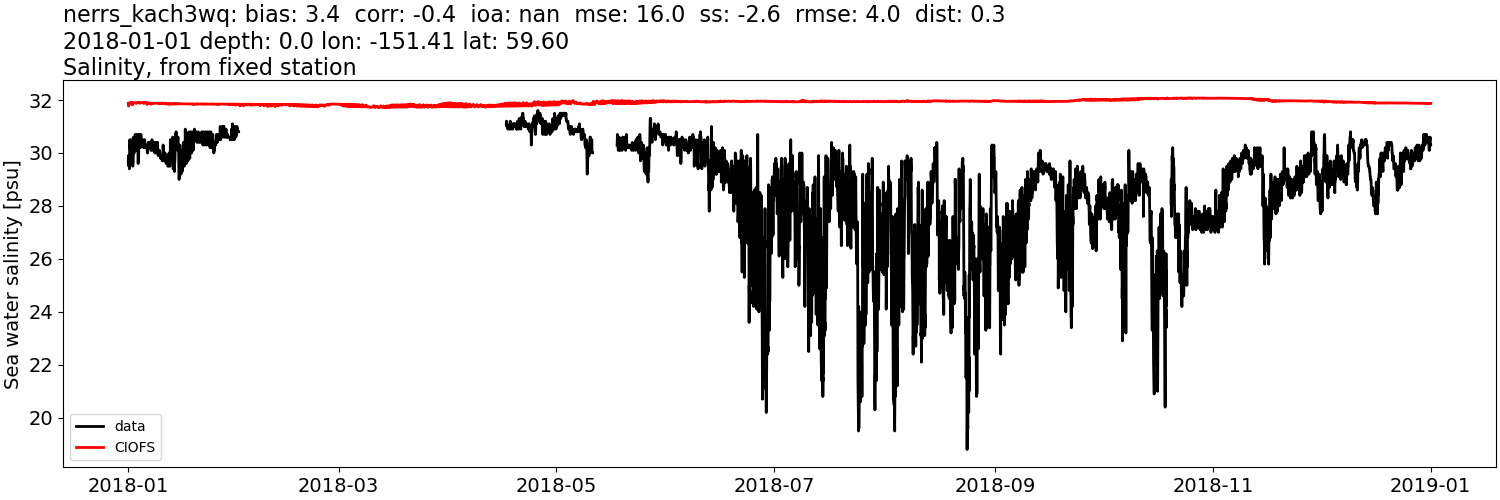
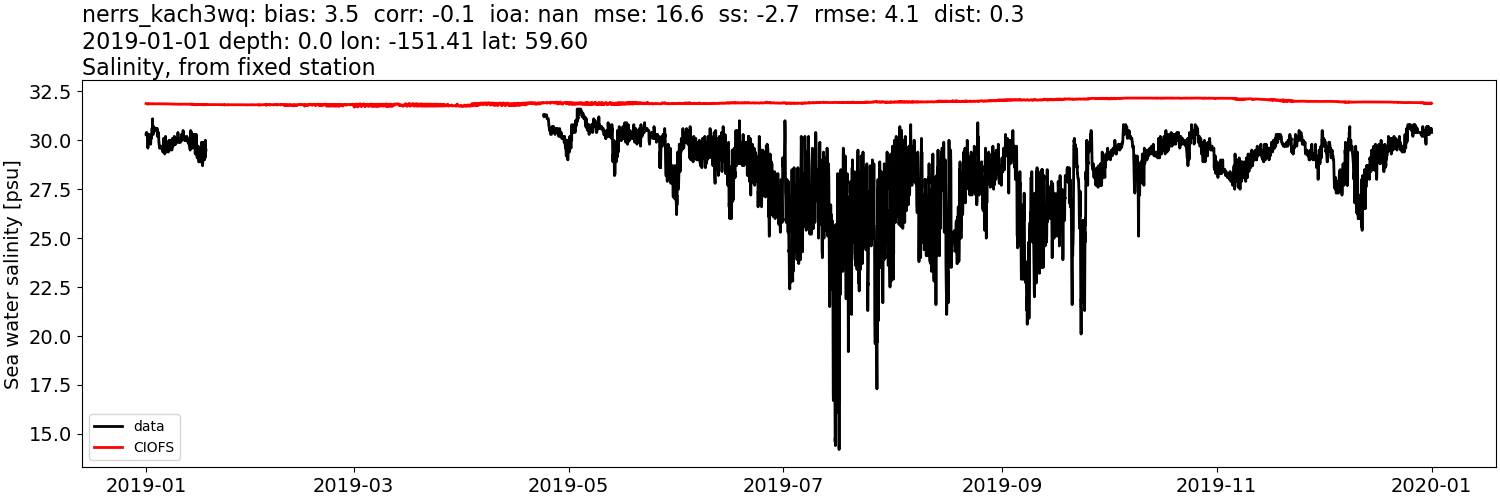
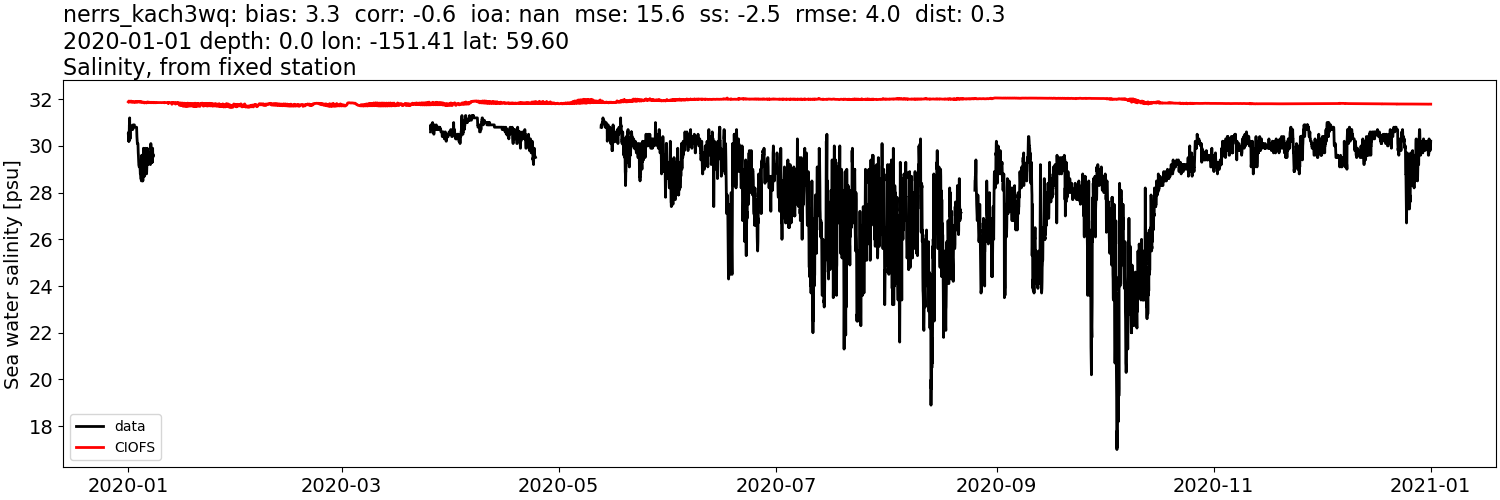
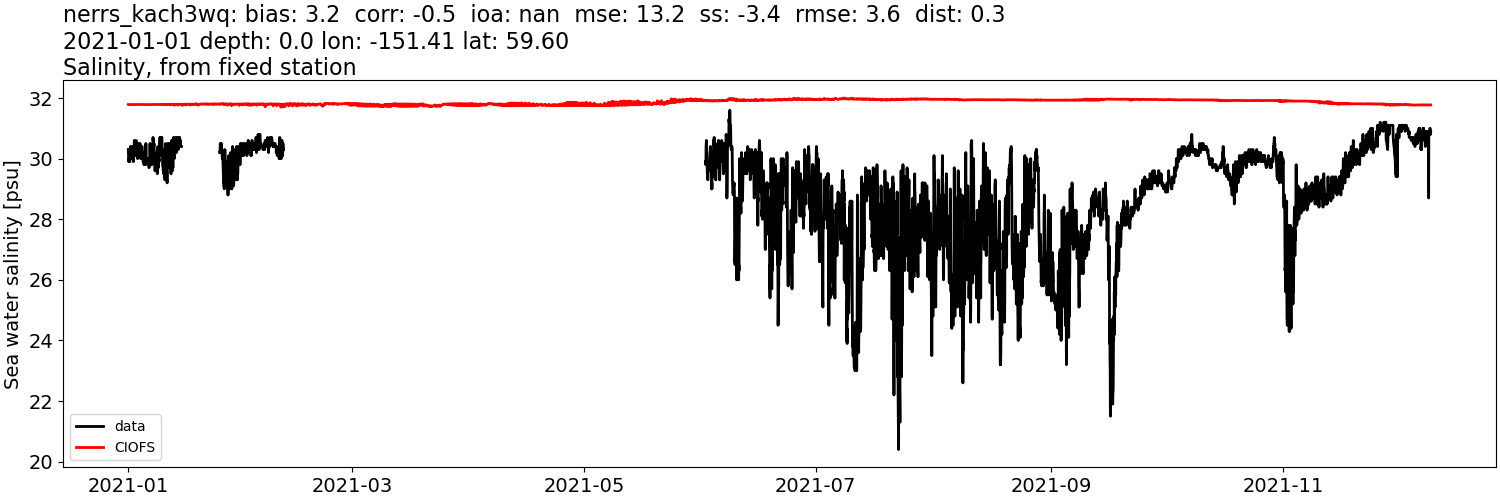
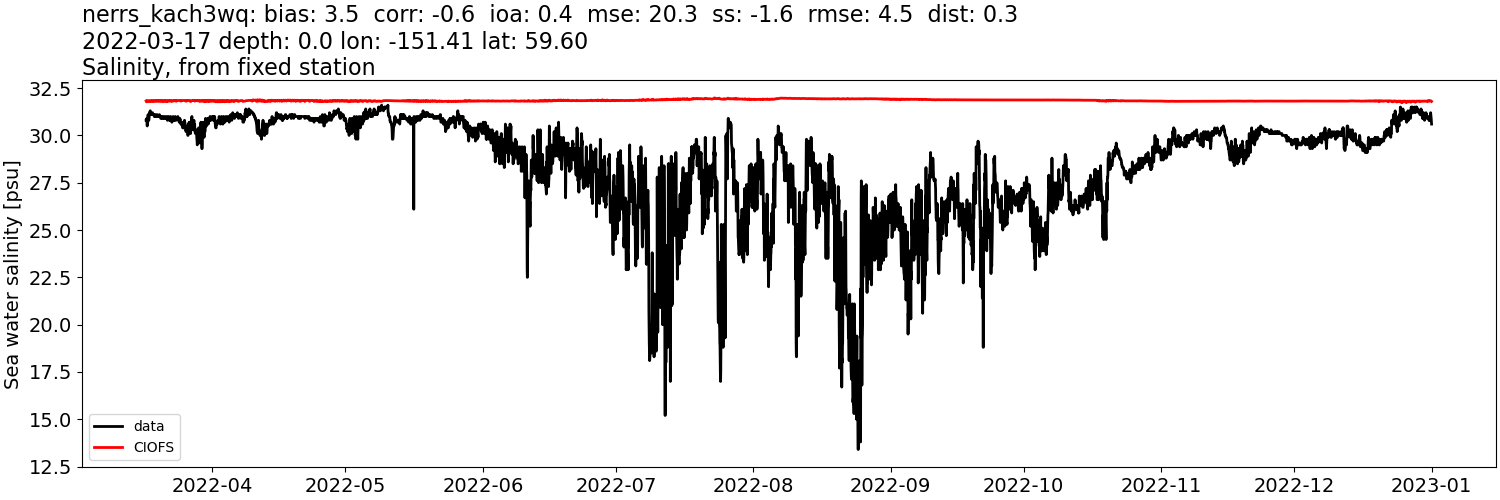
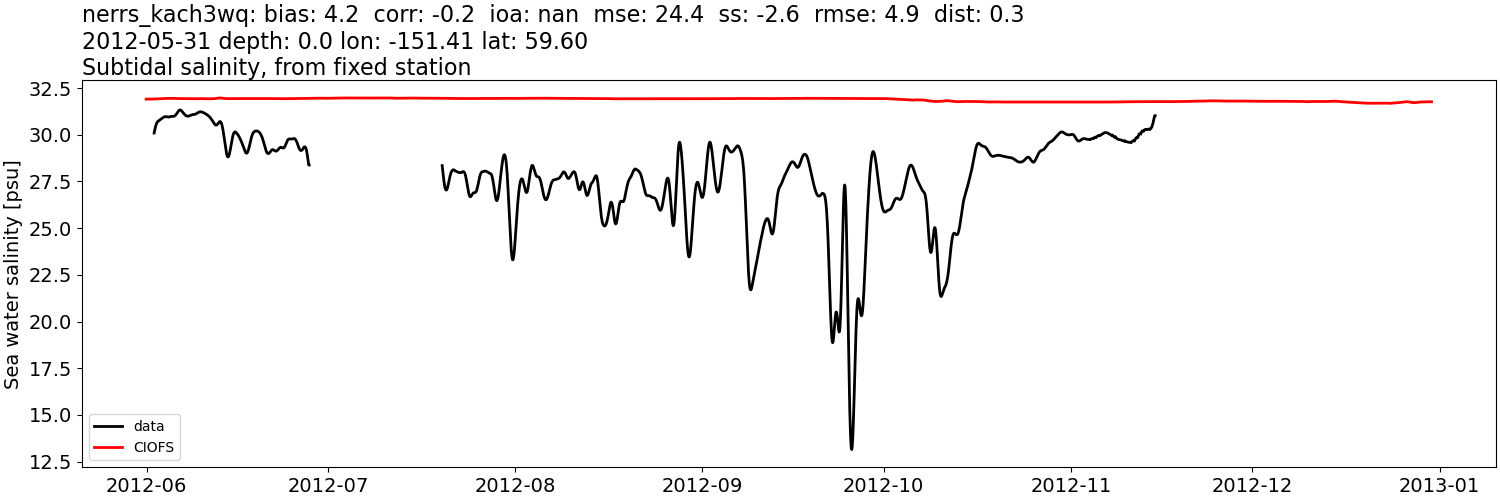
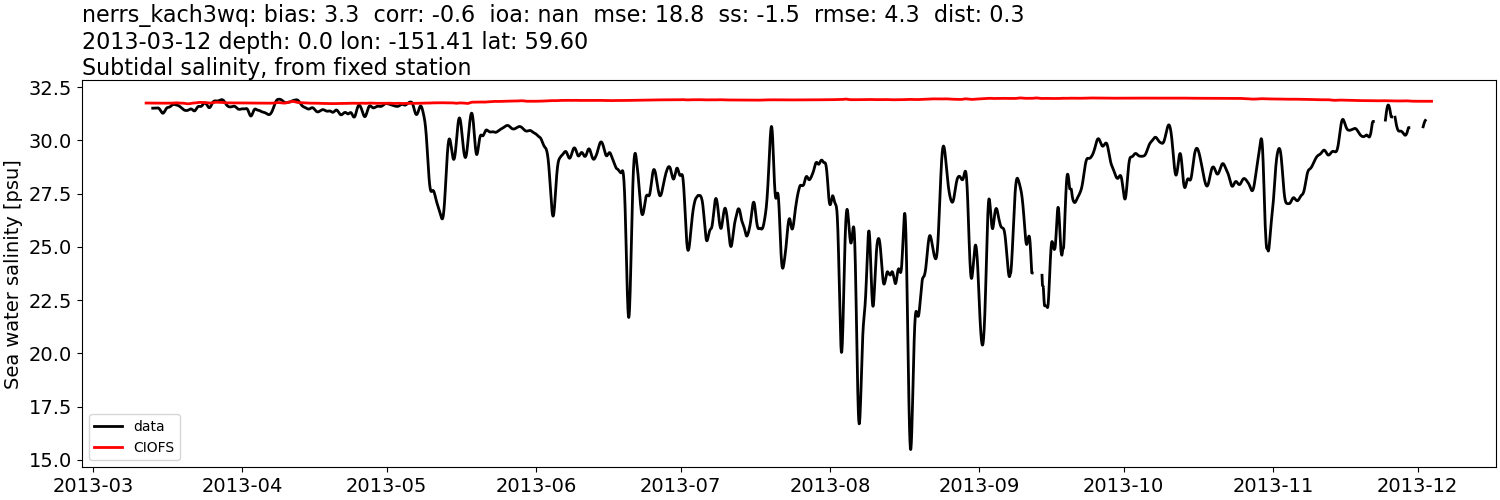
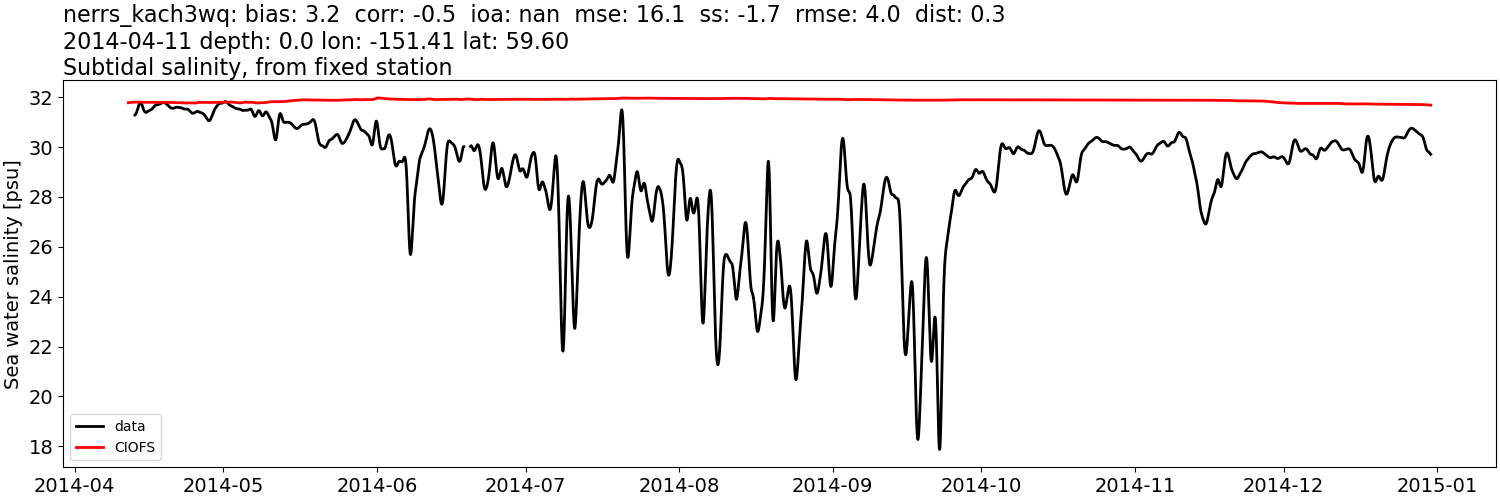
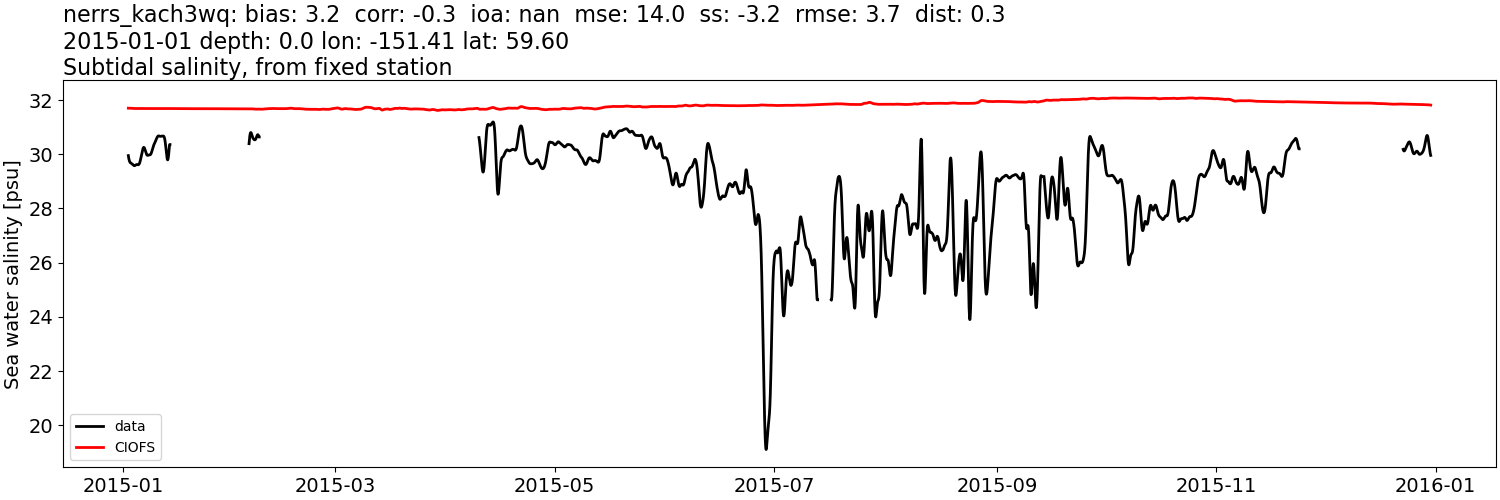
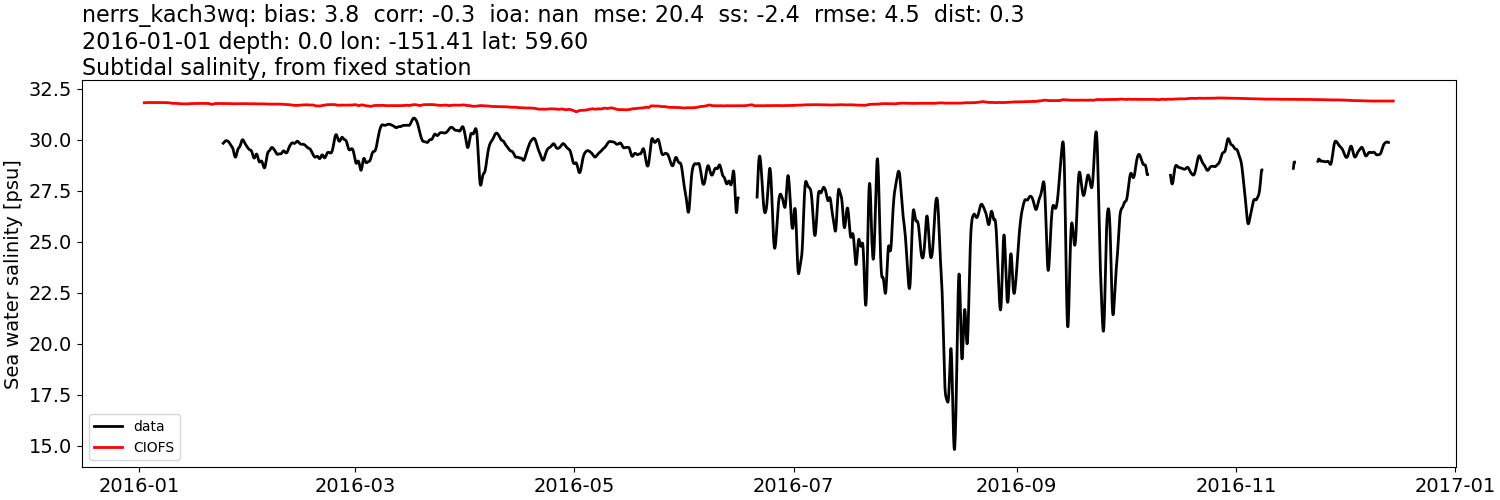
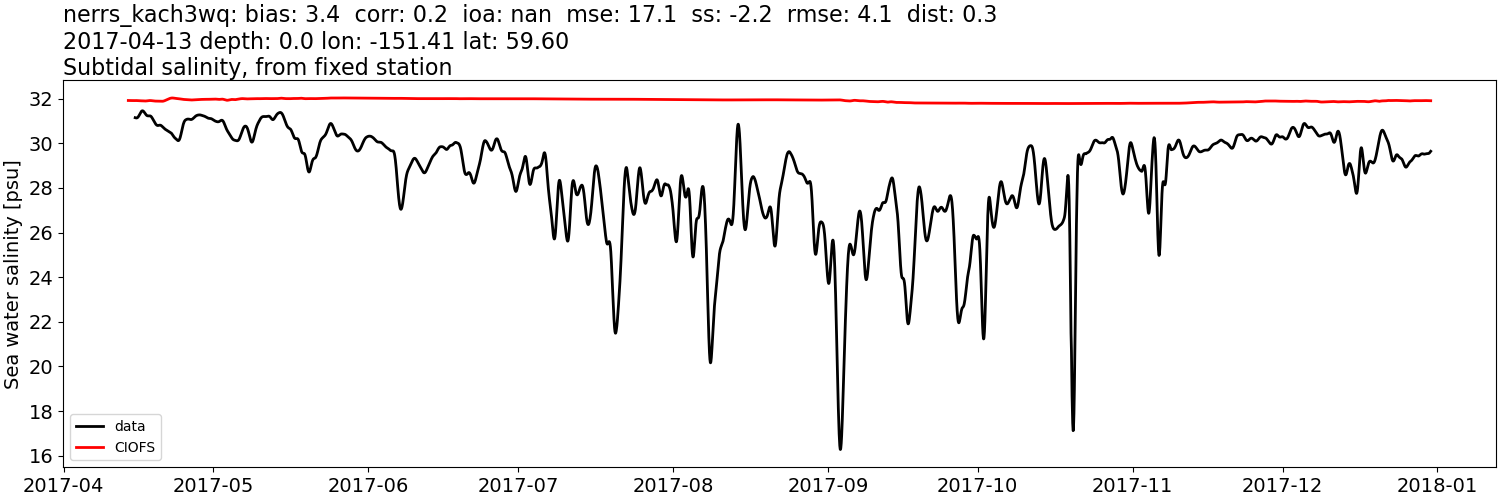
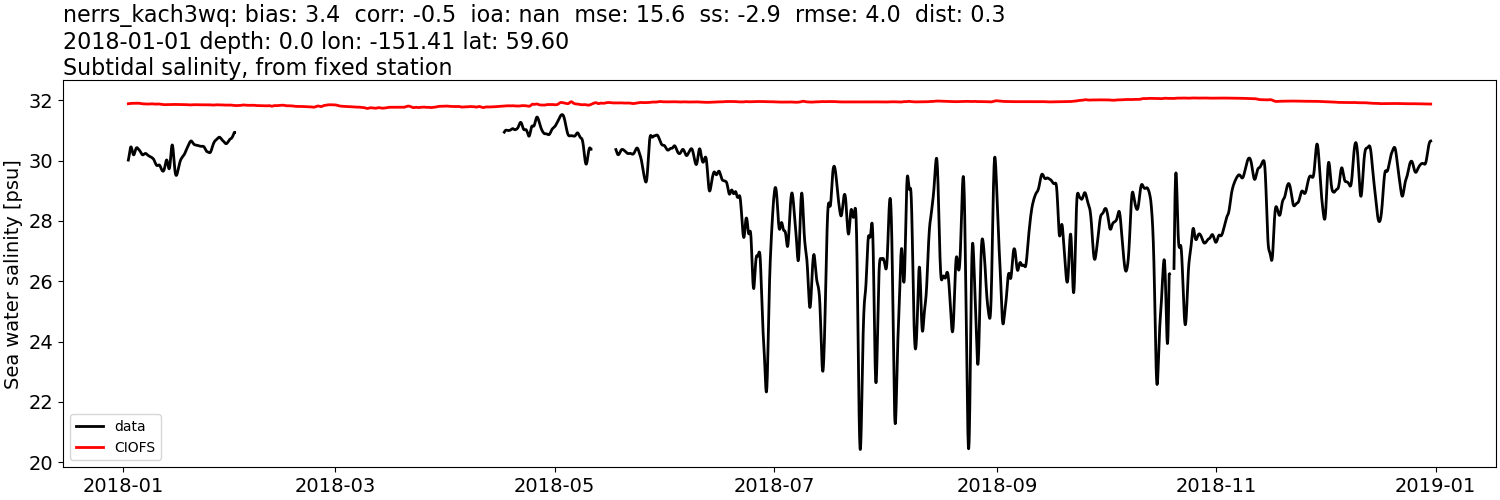
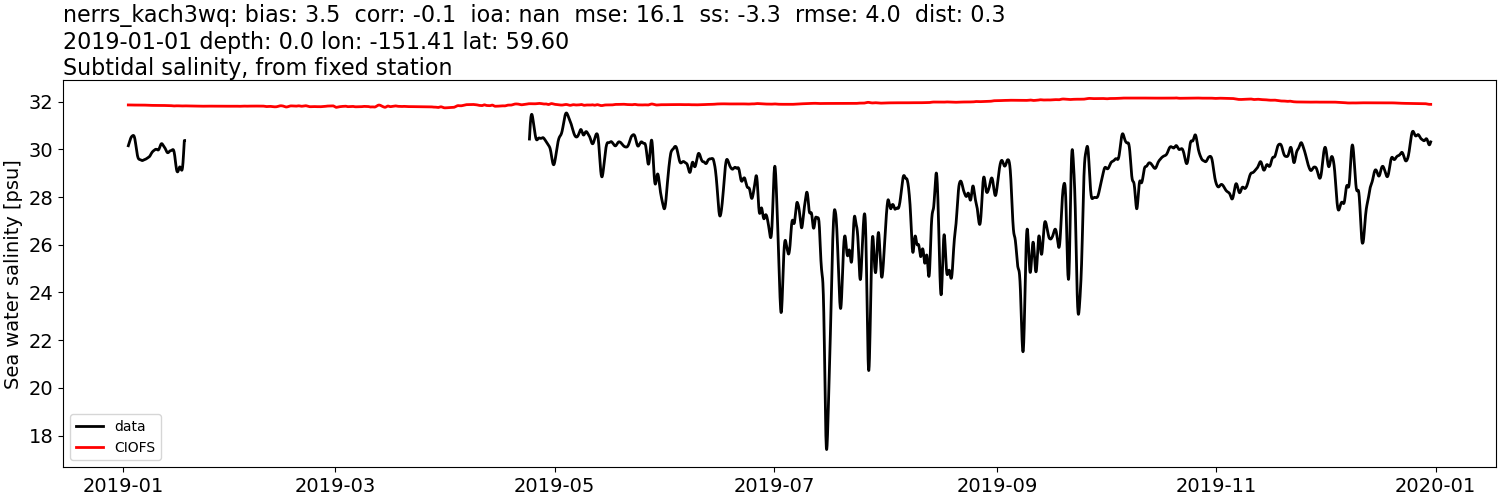
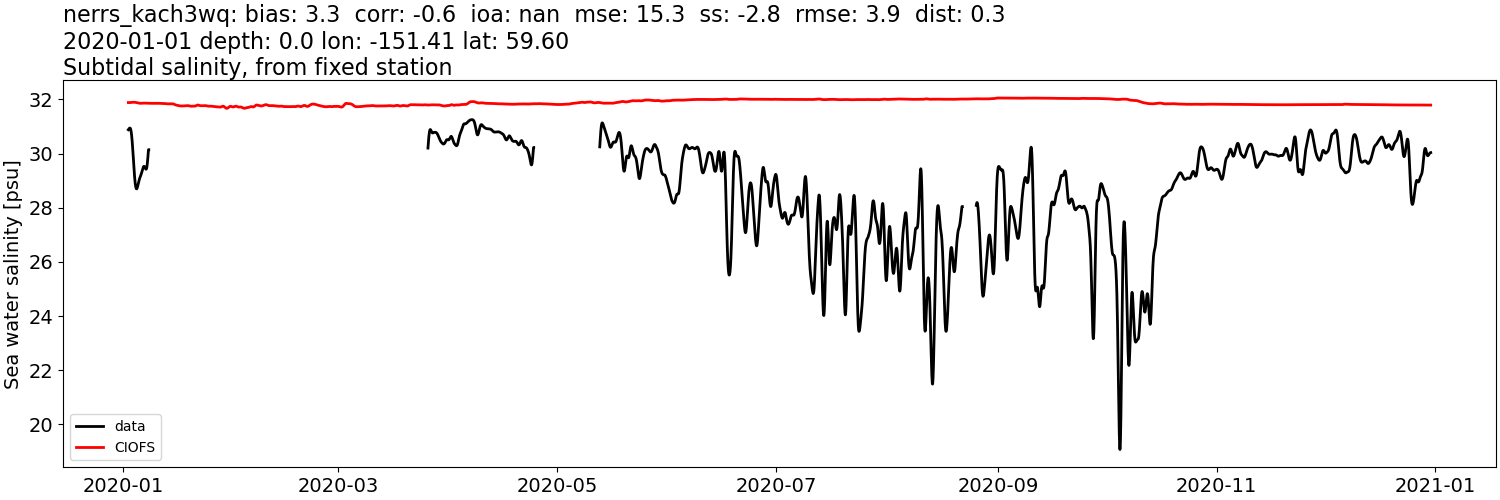
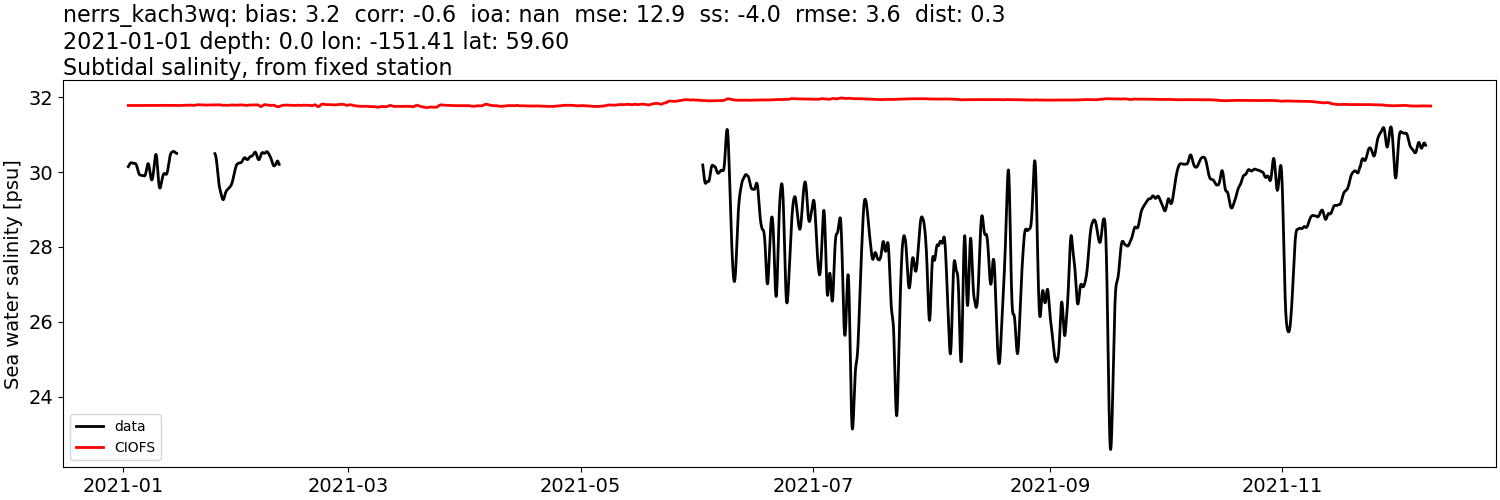
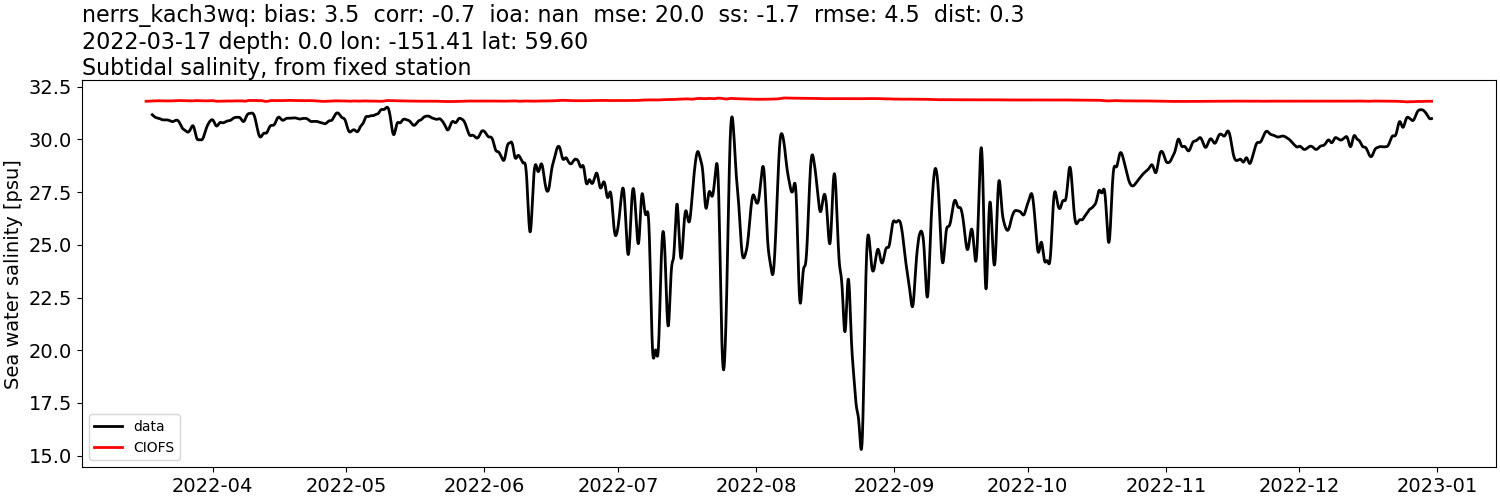
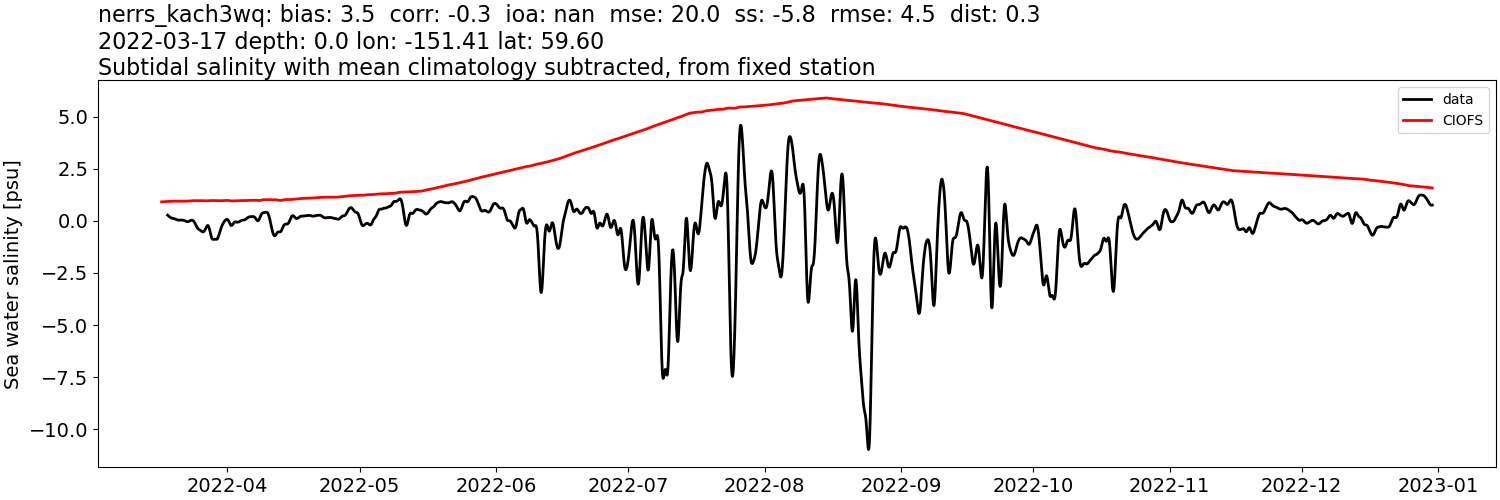
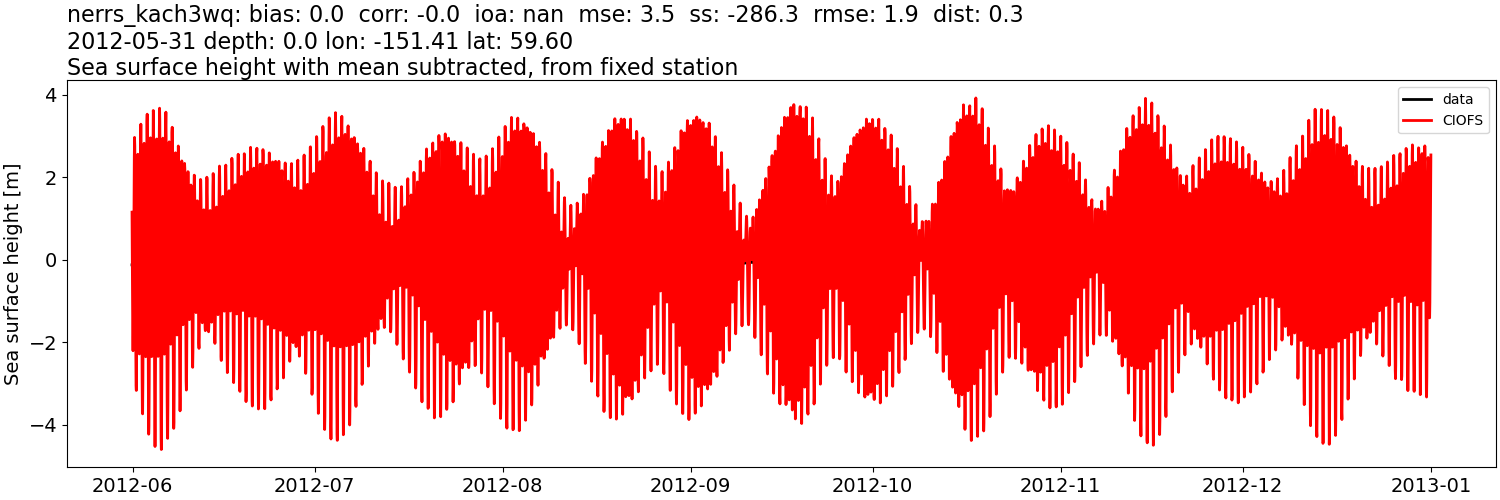
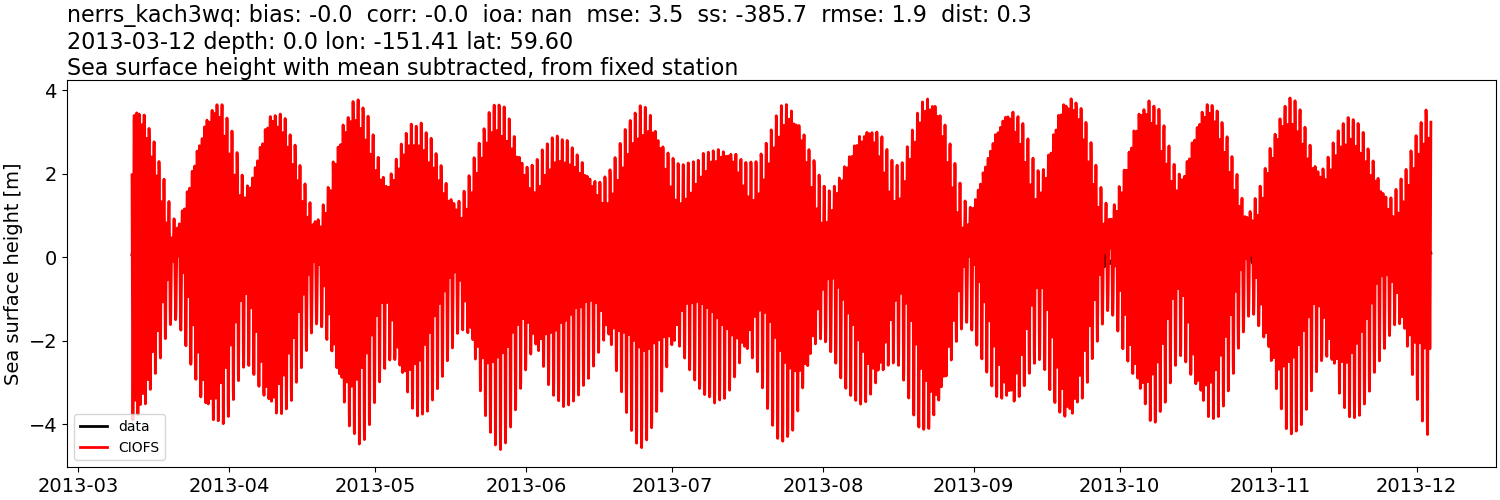
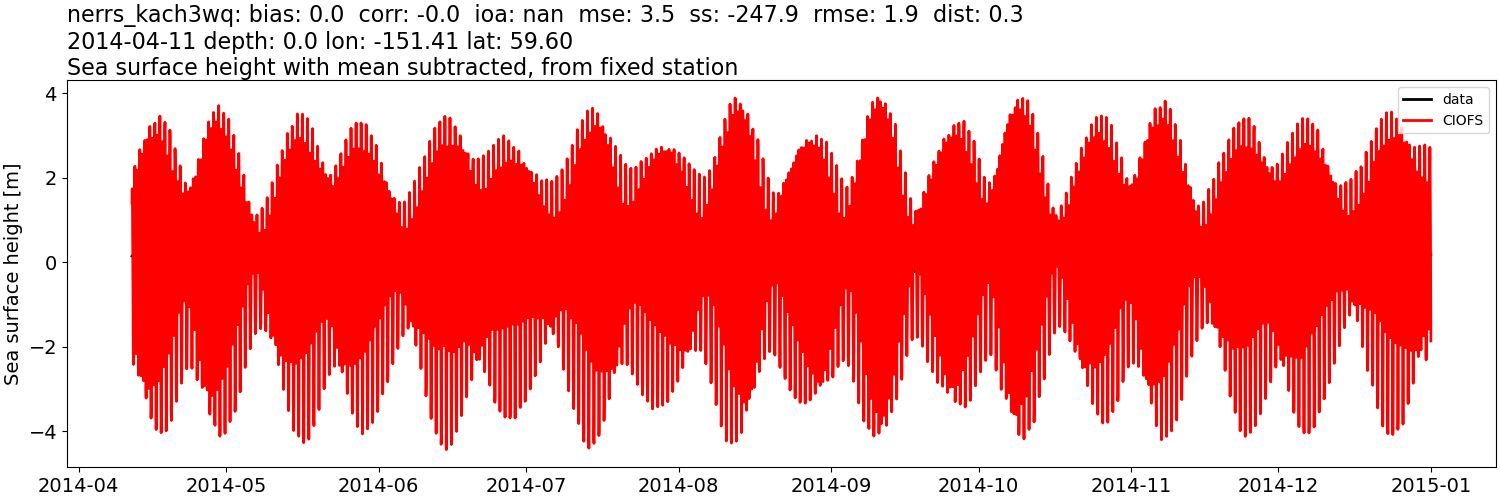
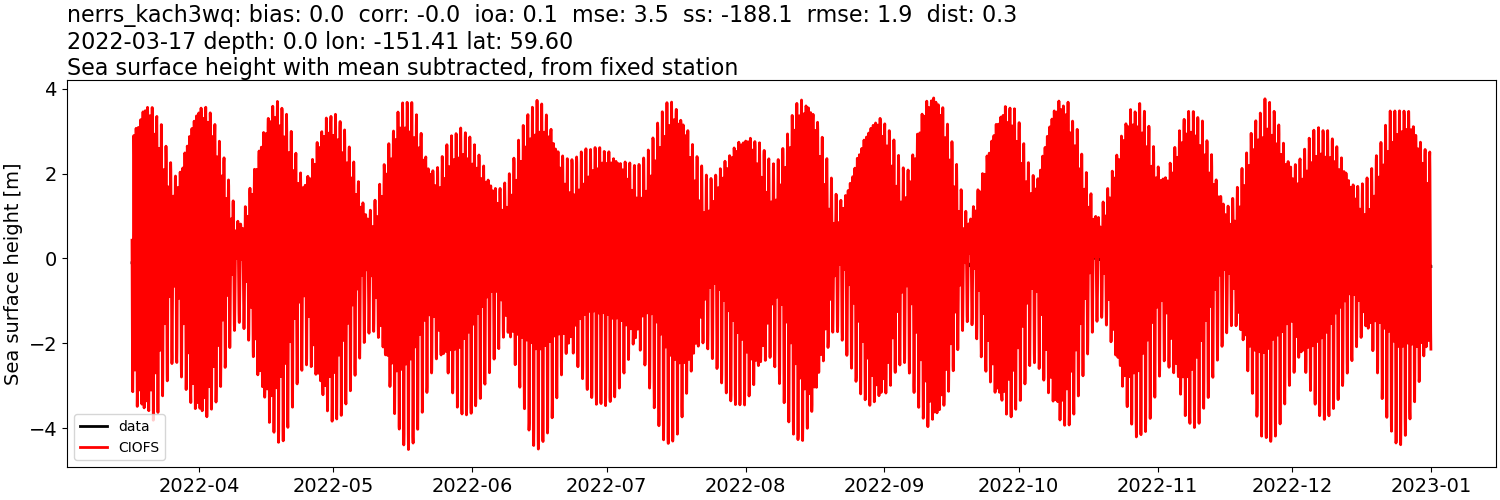
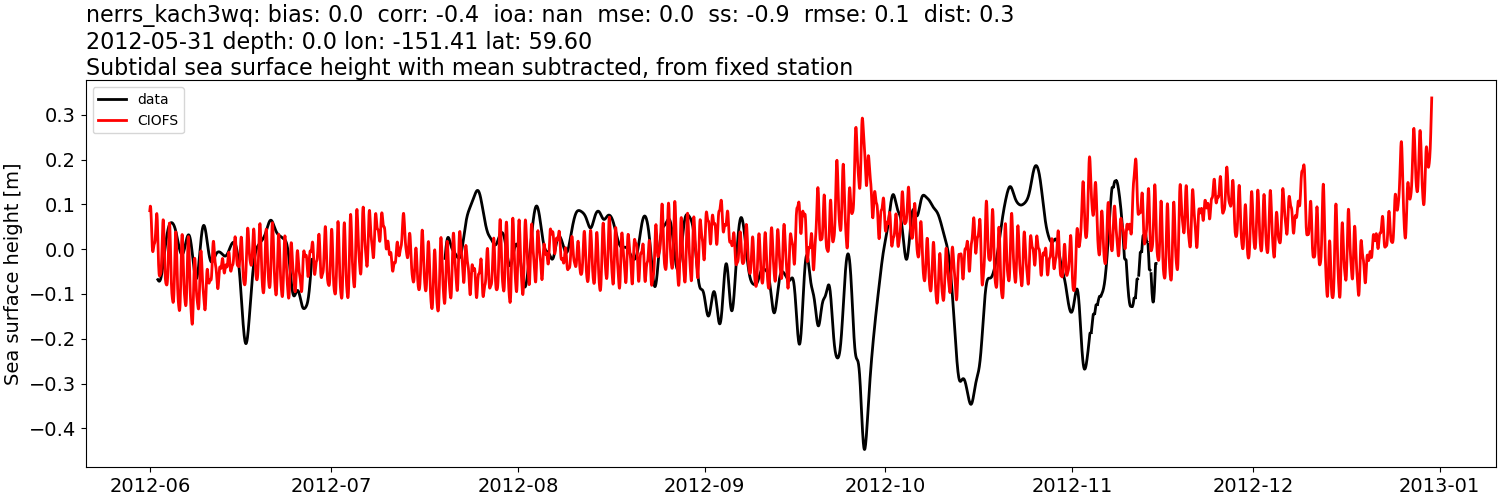
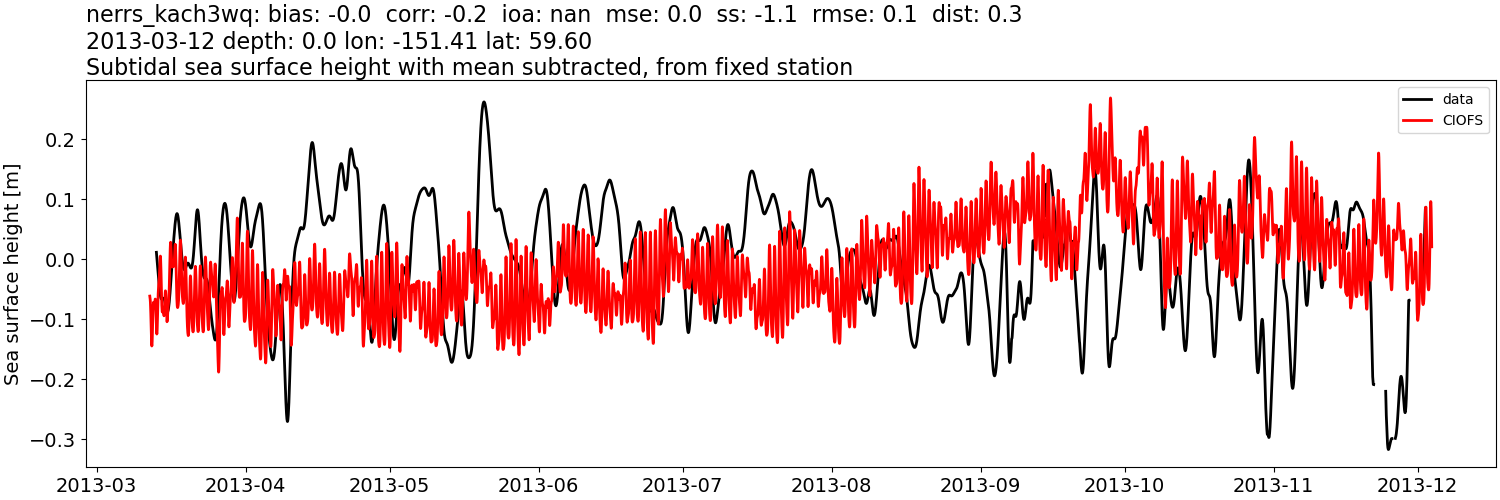
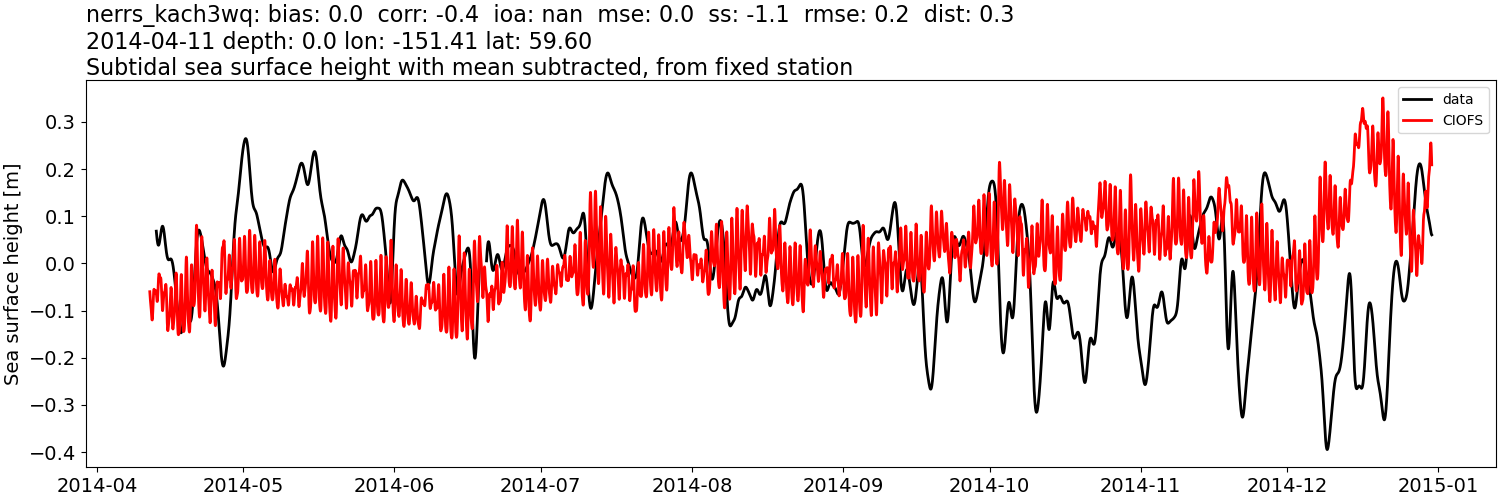
nerrs_kach3wq#
NWGOA: Data time range is 2012-05-31 to 2023-09-06 but model ends 2009-01-01.
Sea water salinity:#
CIOFS#
Comparison plots by year
2012
2013
2014
2015
2016
2017
2018
2019
2020
2021
2022
Sea water salinity: tidally-filtered#
CIOFS#
Comparison plots by year
2012
2013
2014
2015
2016
2017
2018
2019
2020
2021
2022
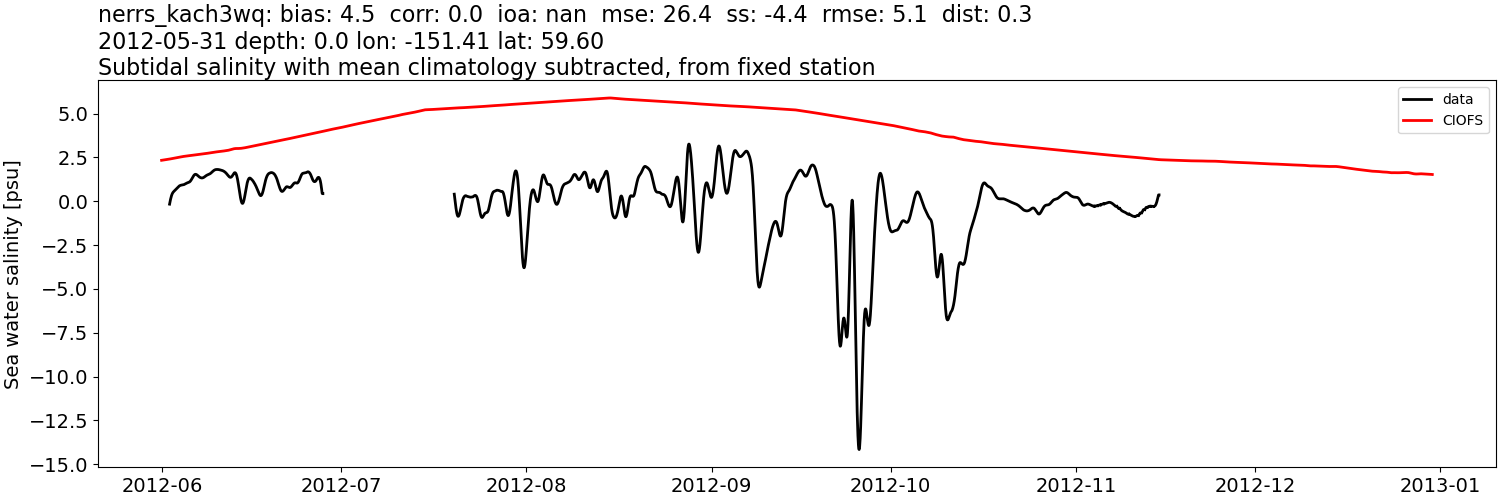
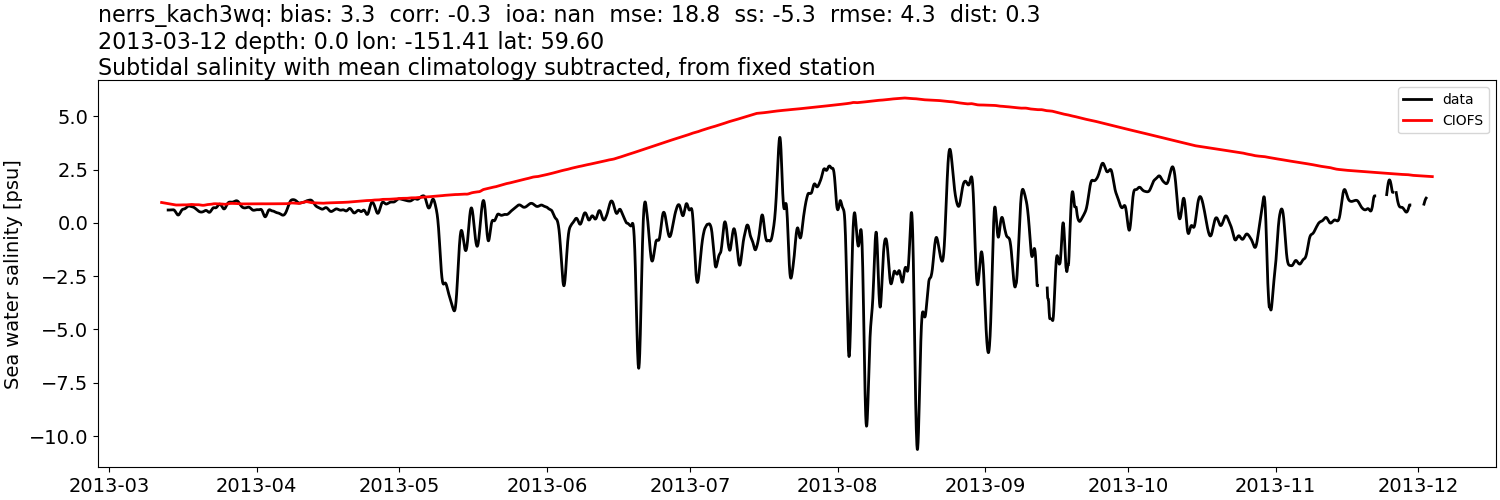
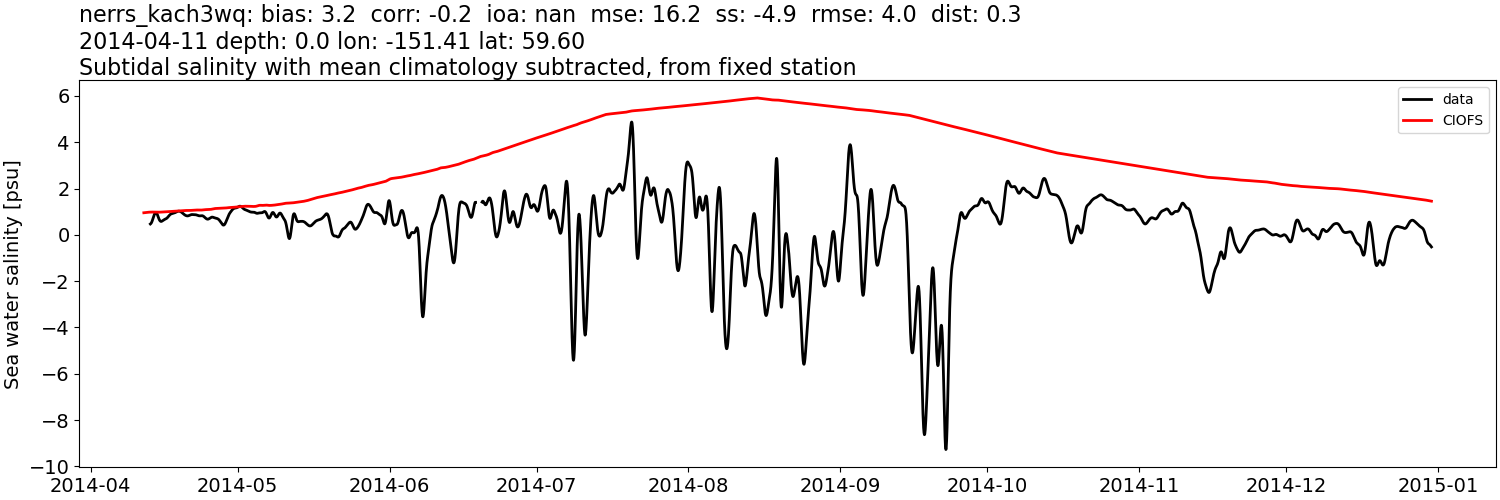
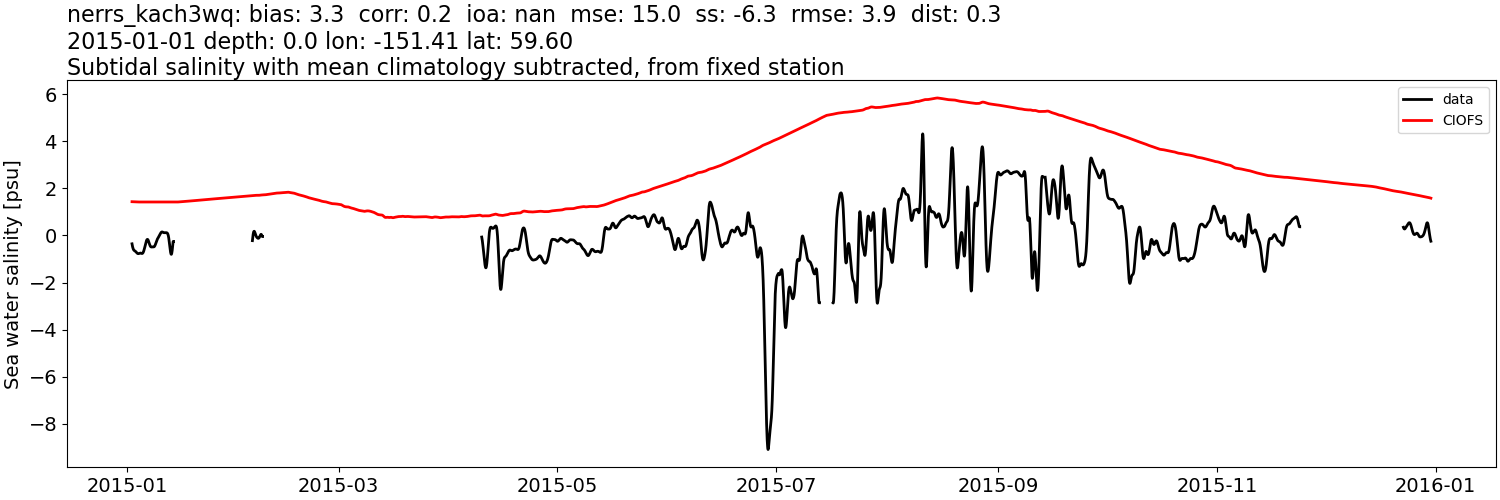
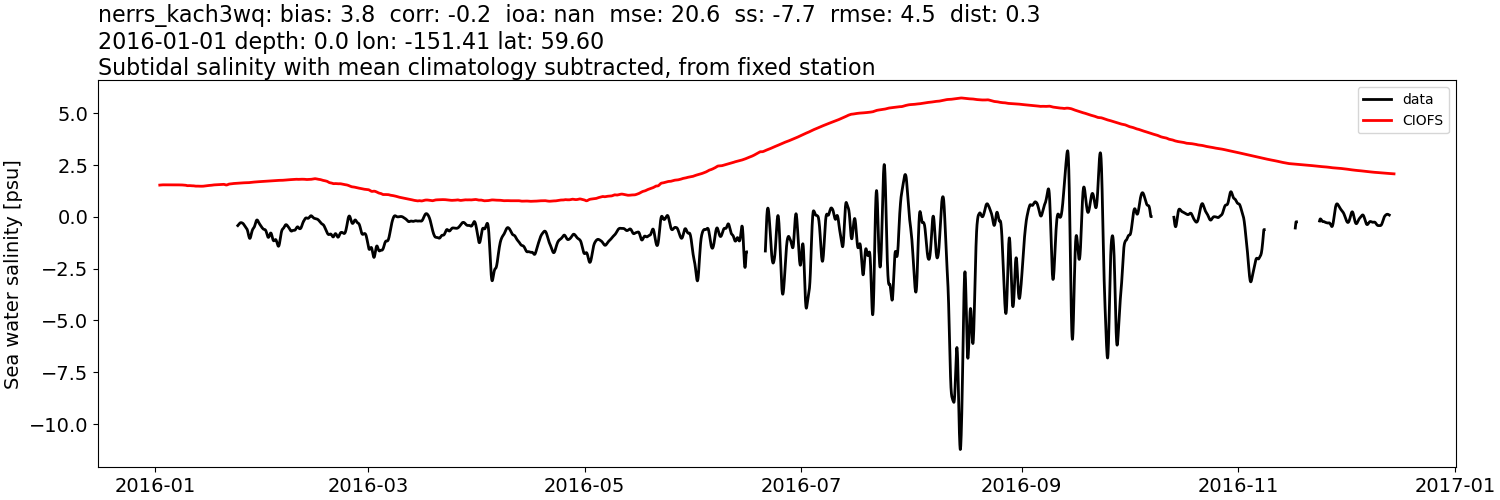
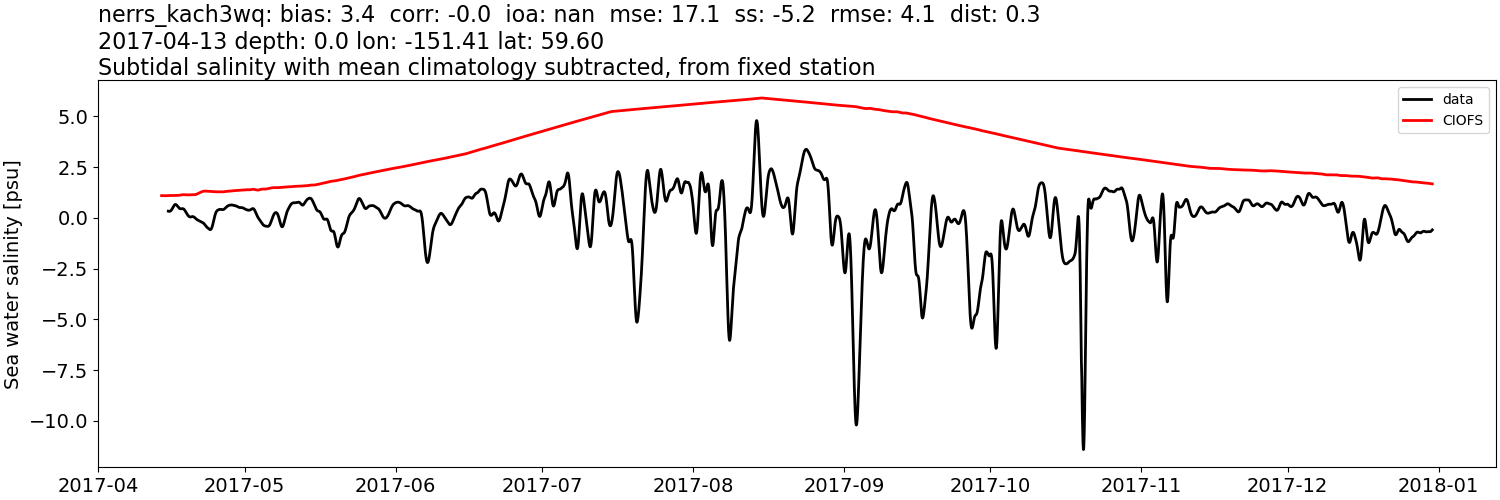
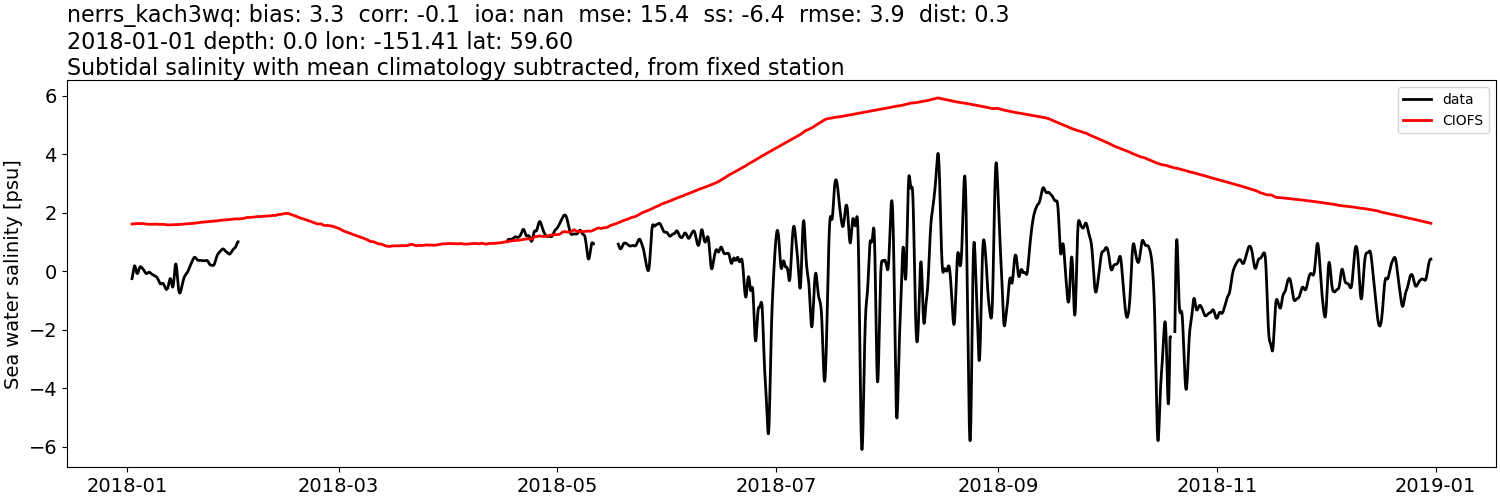
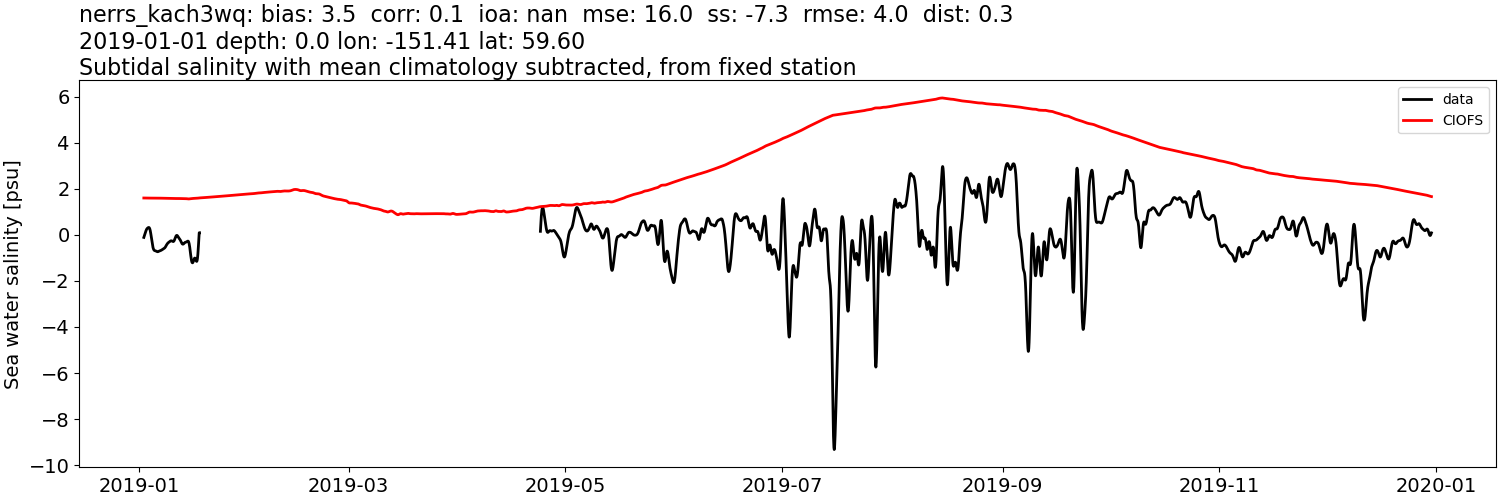
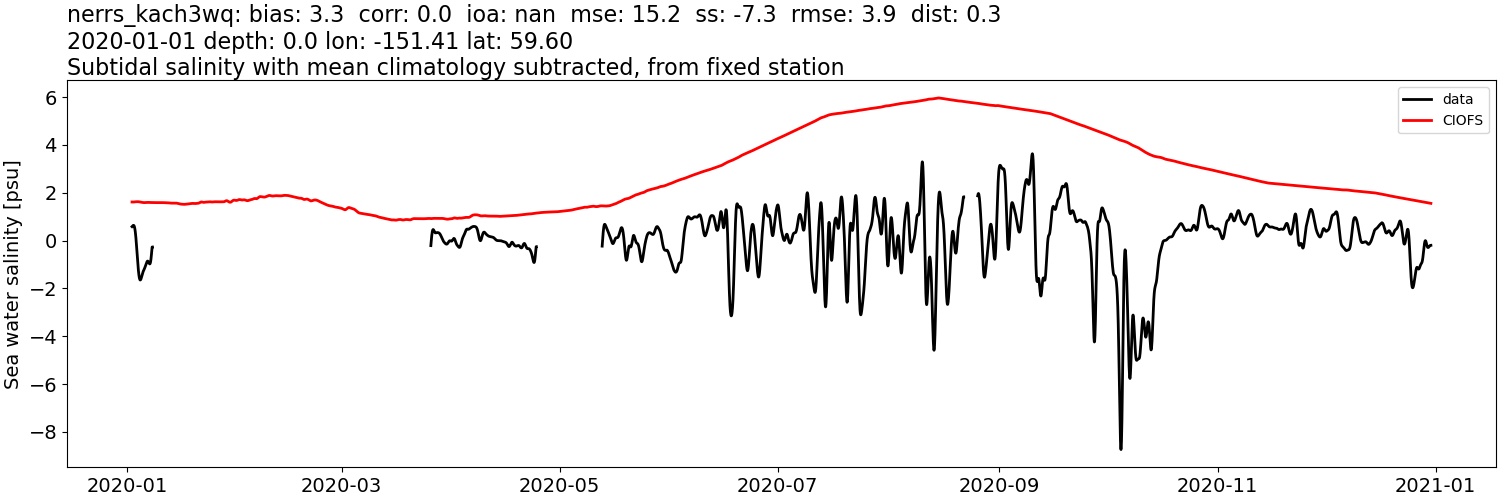
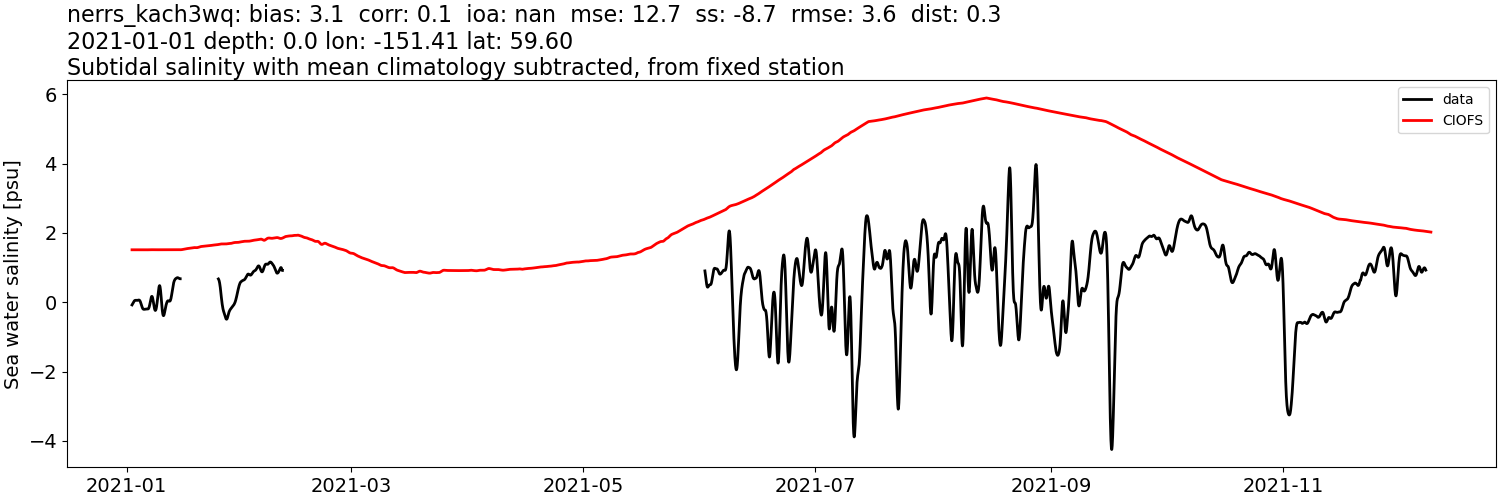
Sea water salinity: tidally-filtered, then monthly mean from data subtracted#
CIOFS#
Comparison plots by year
2012
2013
2014
2015
2016
2017
2018
2019
2020
2021
2022
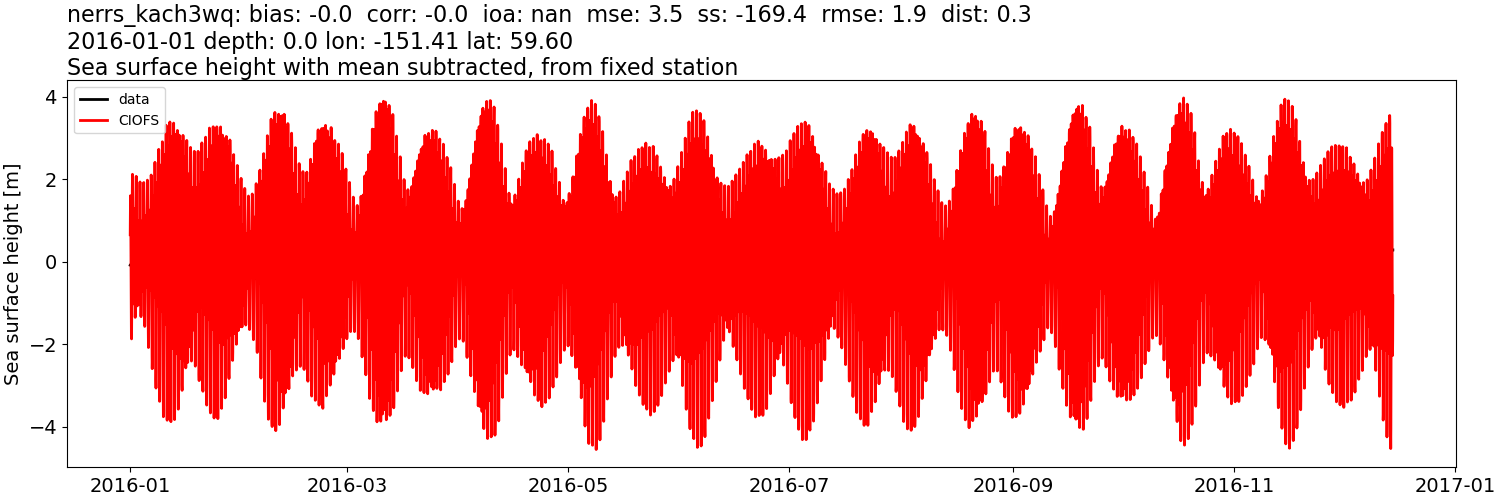
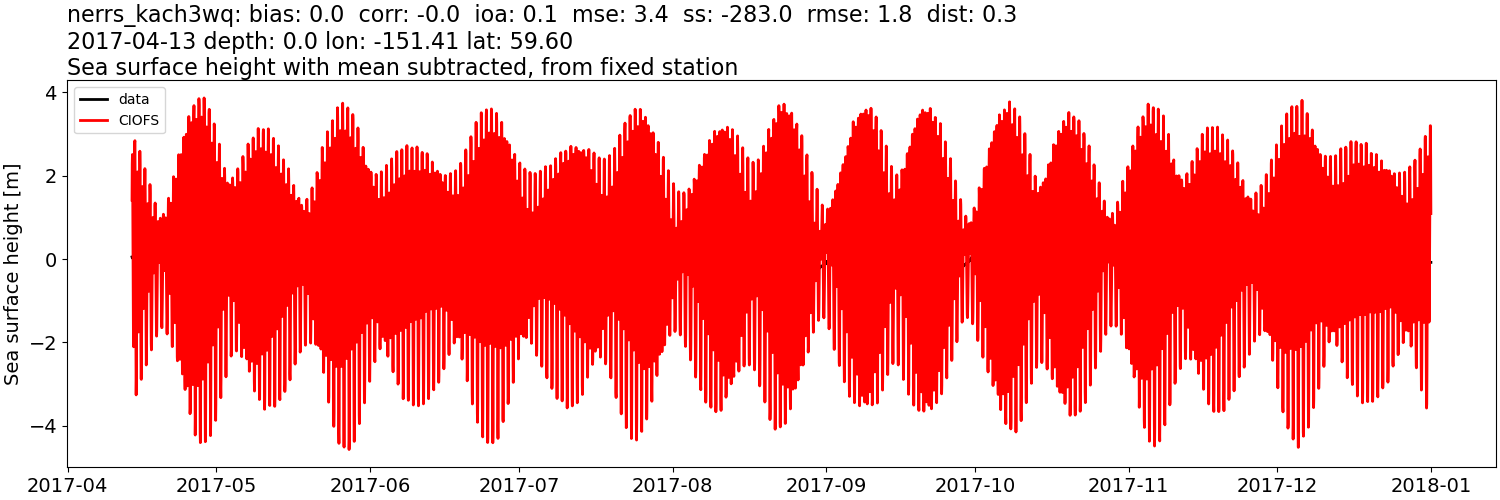
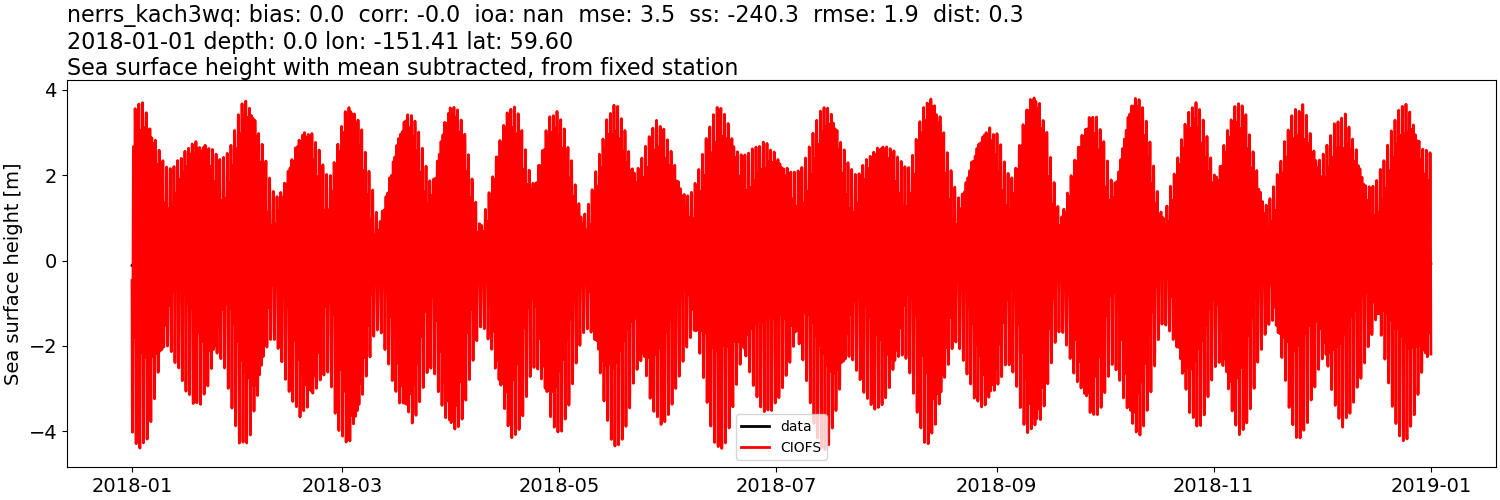
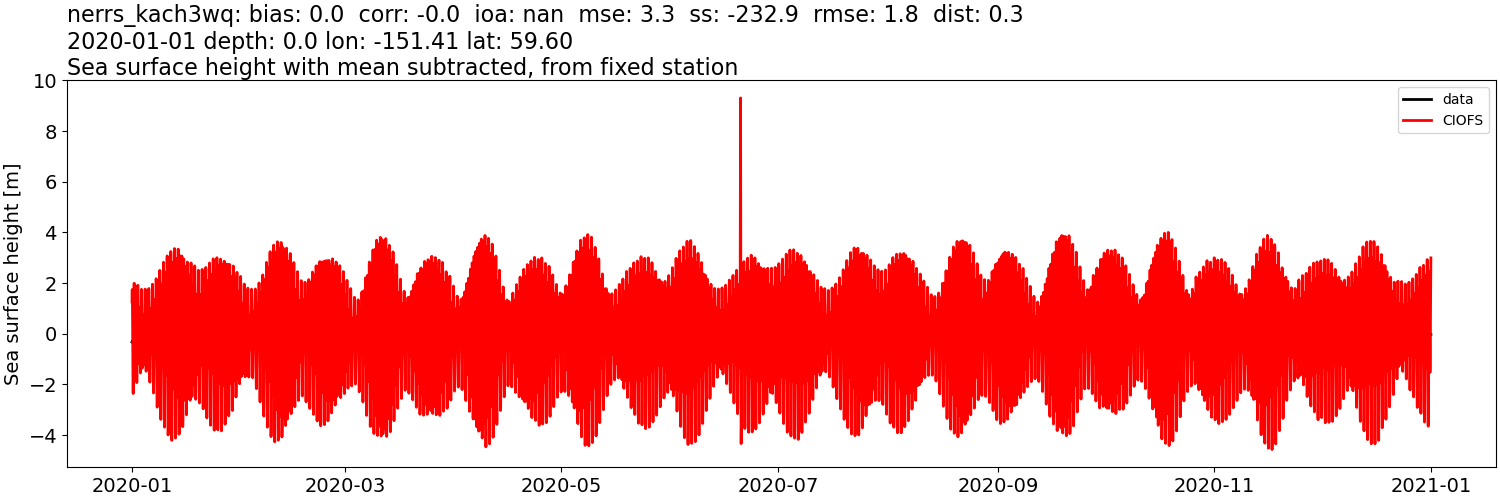
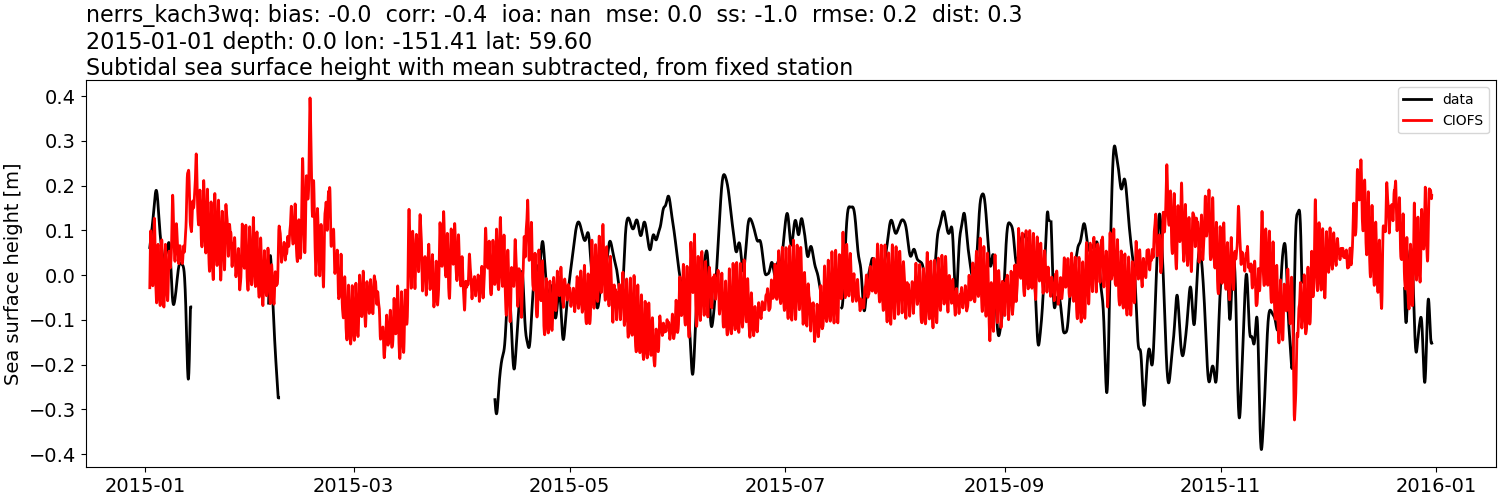
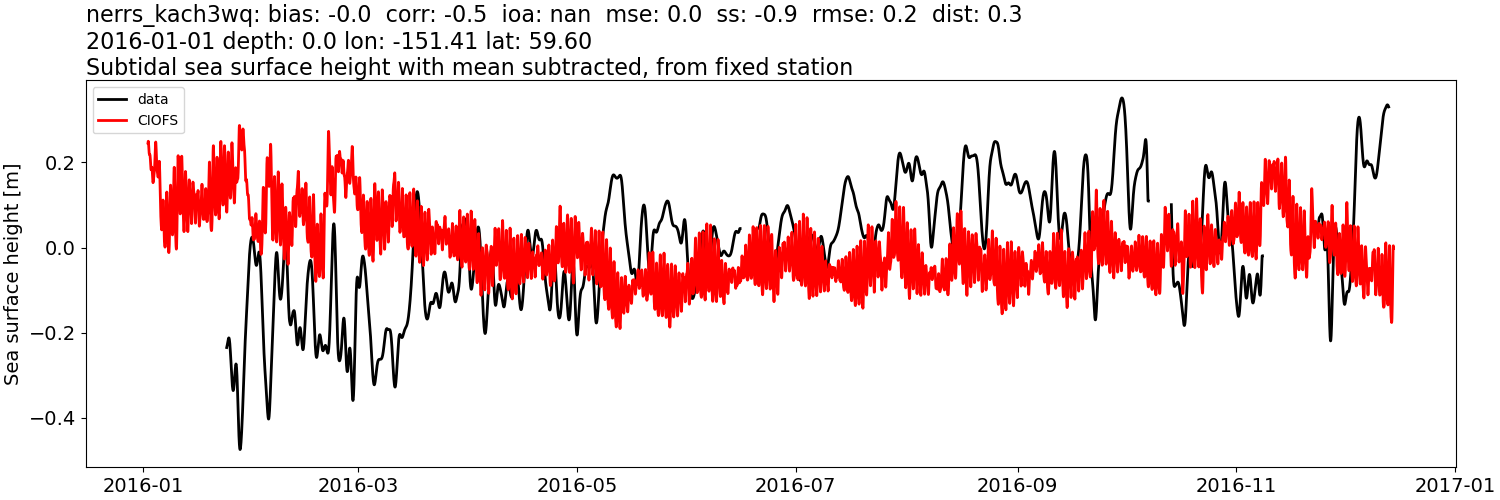
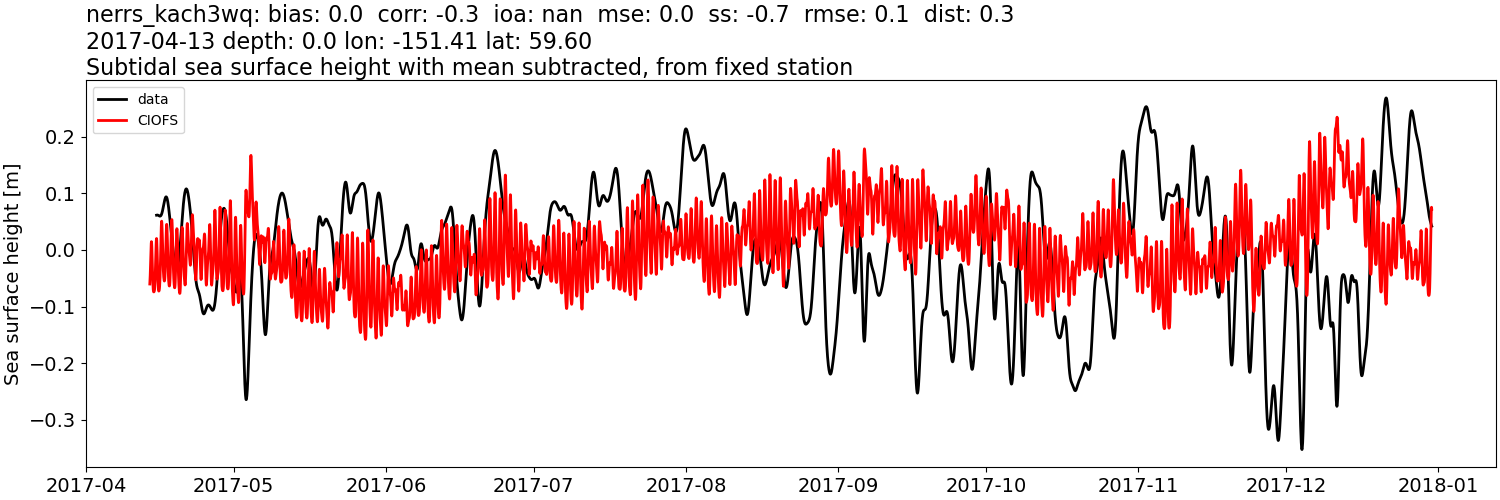
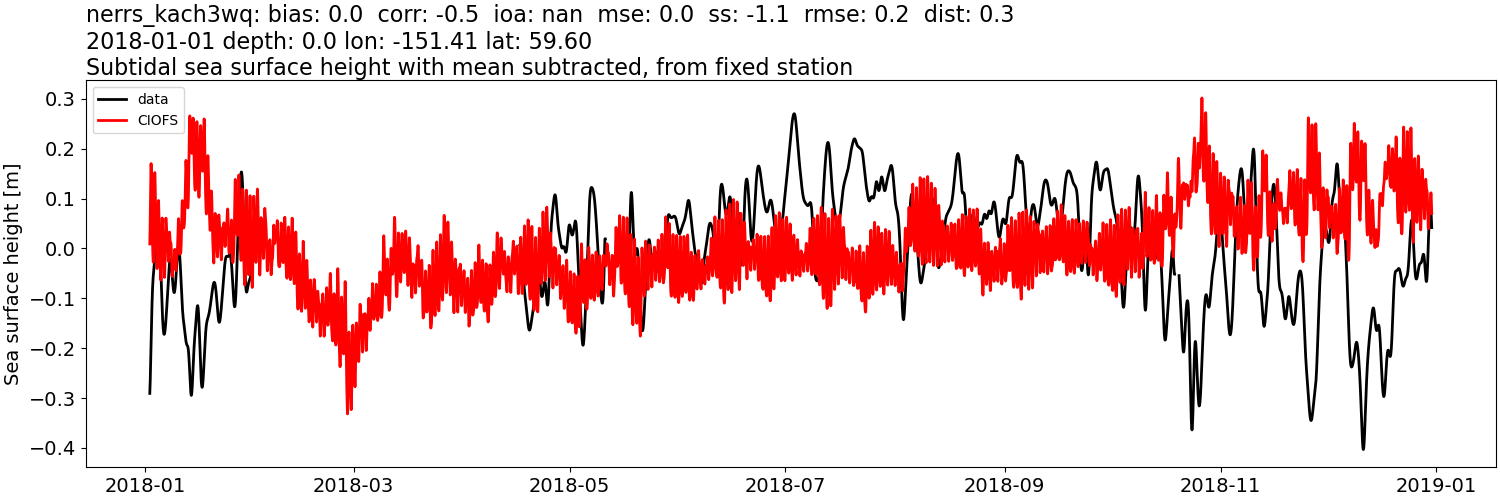
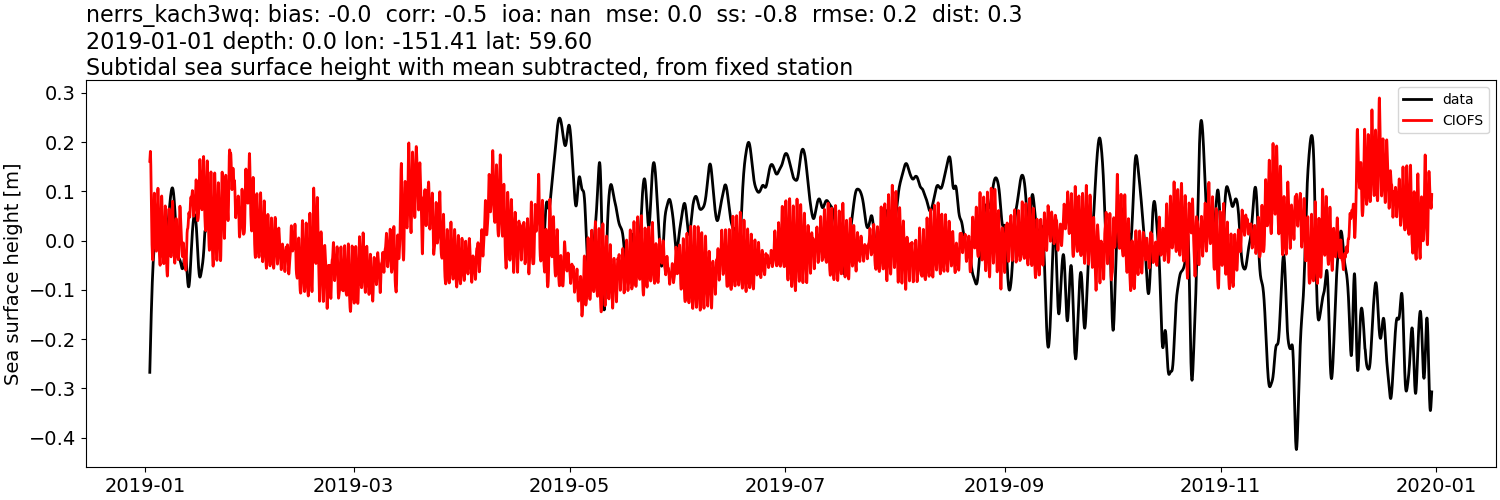
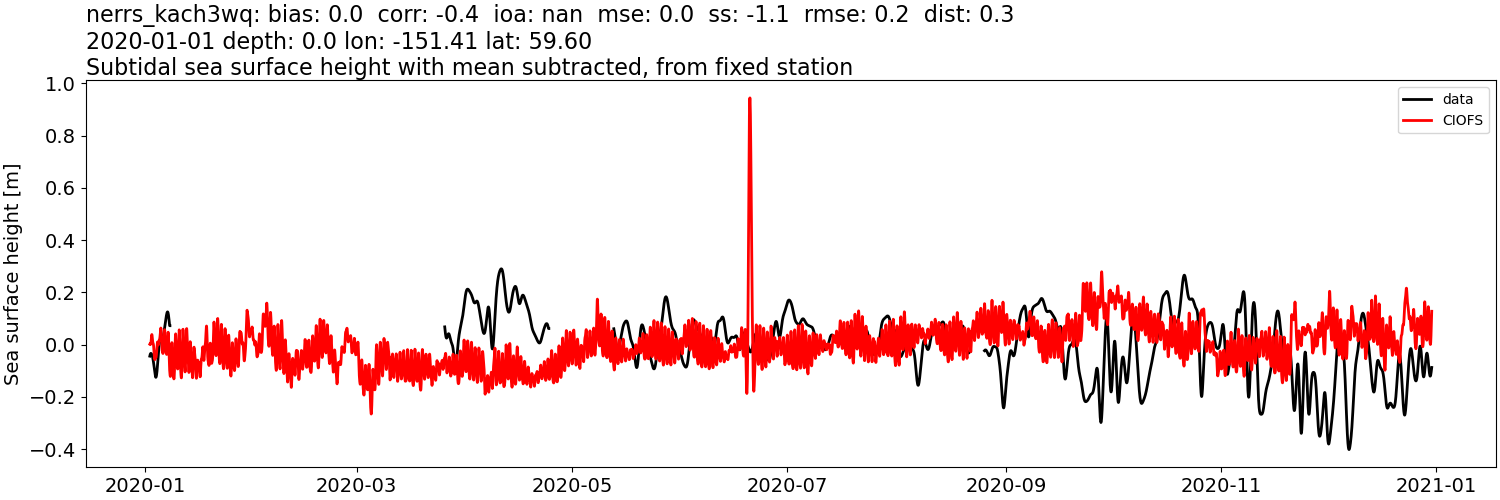
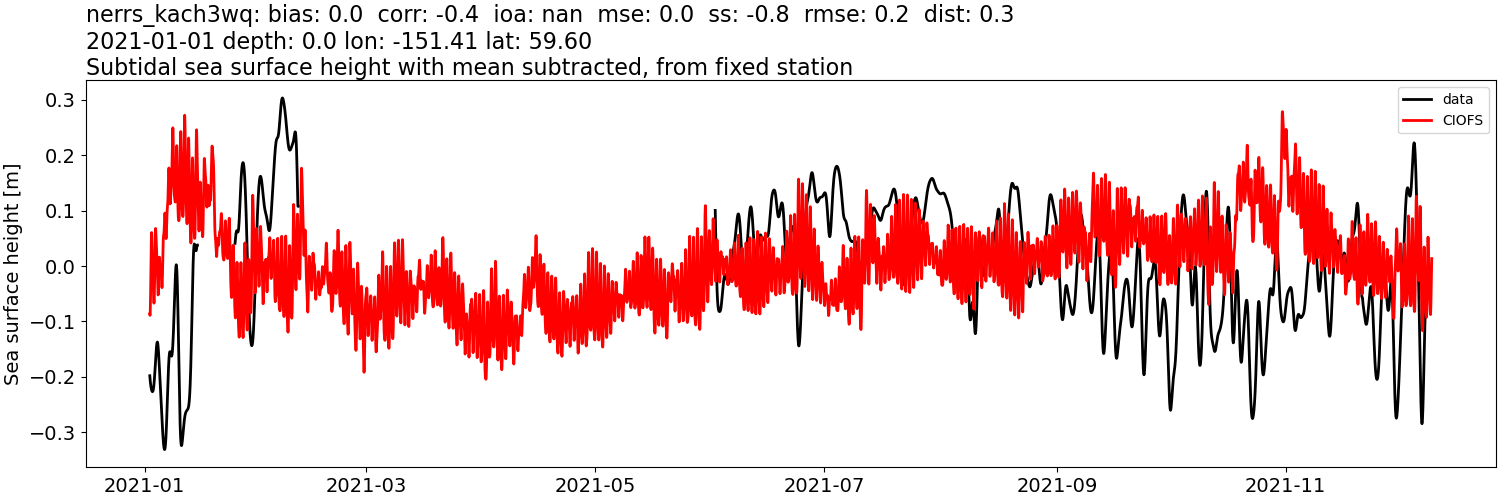
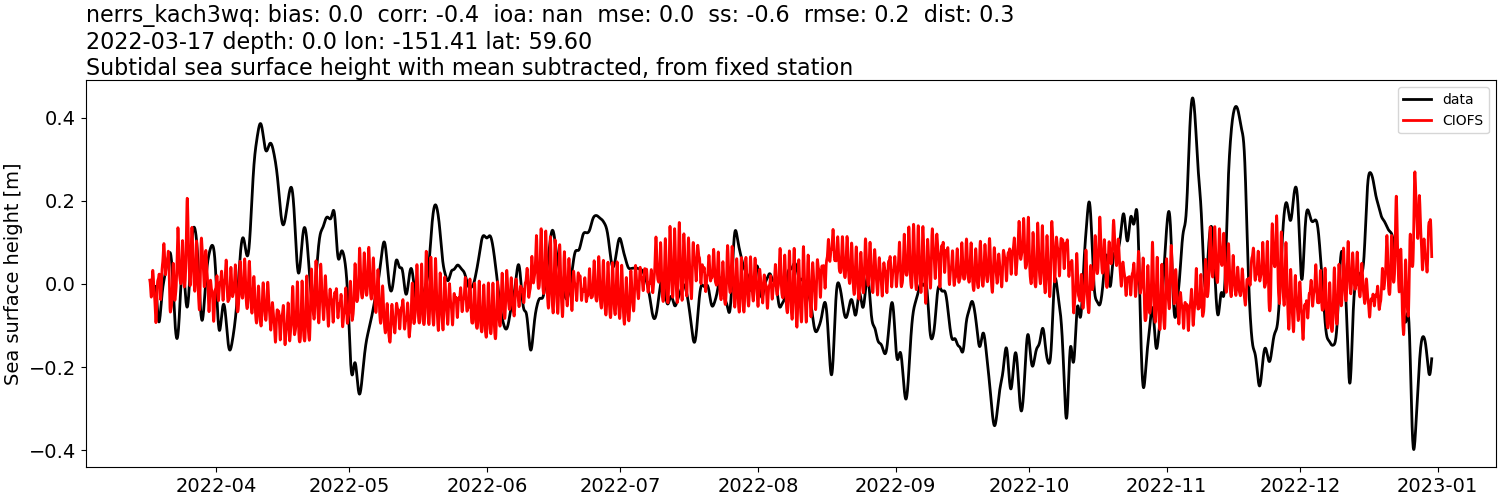
Sea surface height: mean subtracted#
CIOFS#
Comparison plots by year
2012
2013
2014
2015

2016
2017
2018
2019

2020
2021

2022
Sea surface height: mean subtracted, then tidally-filtered#
CIOFS#
Comparison plots by year
2012
2013
2014
2015
2016
2017
2018
2019
2020
2021
2022
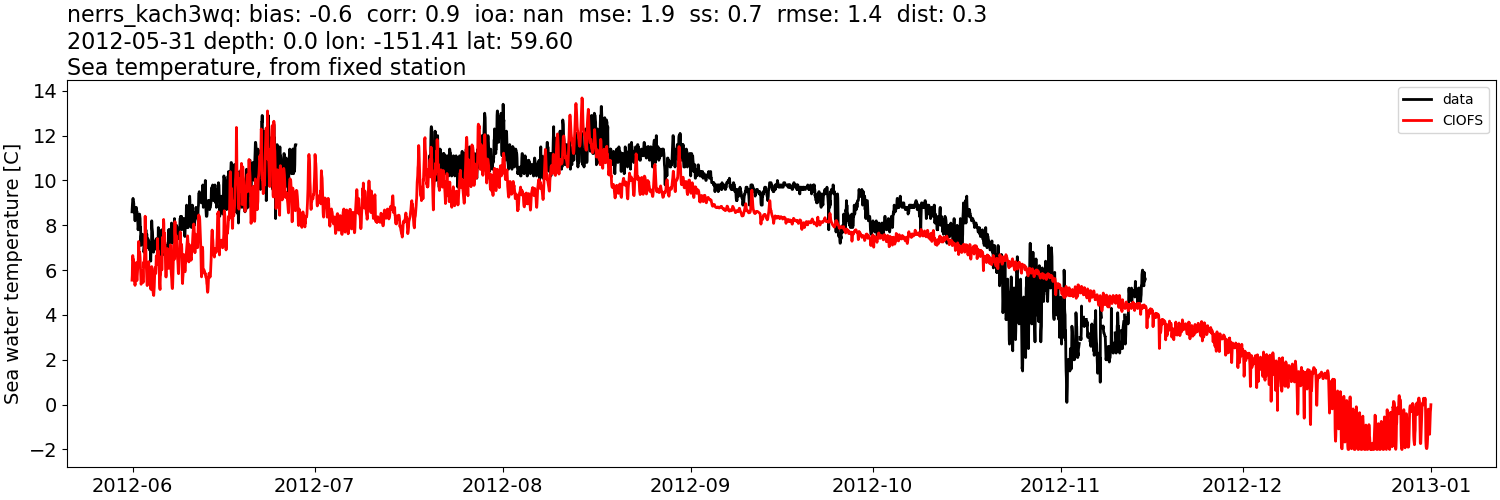
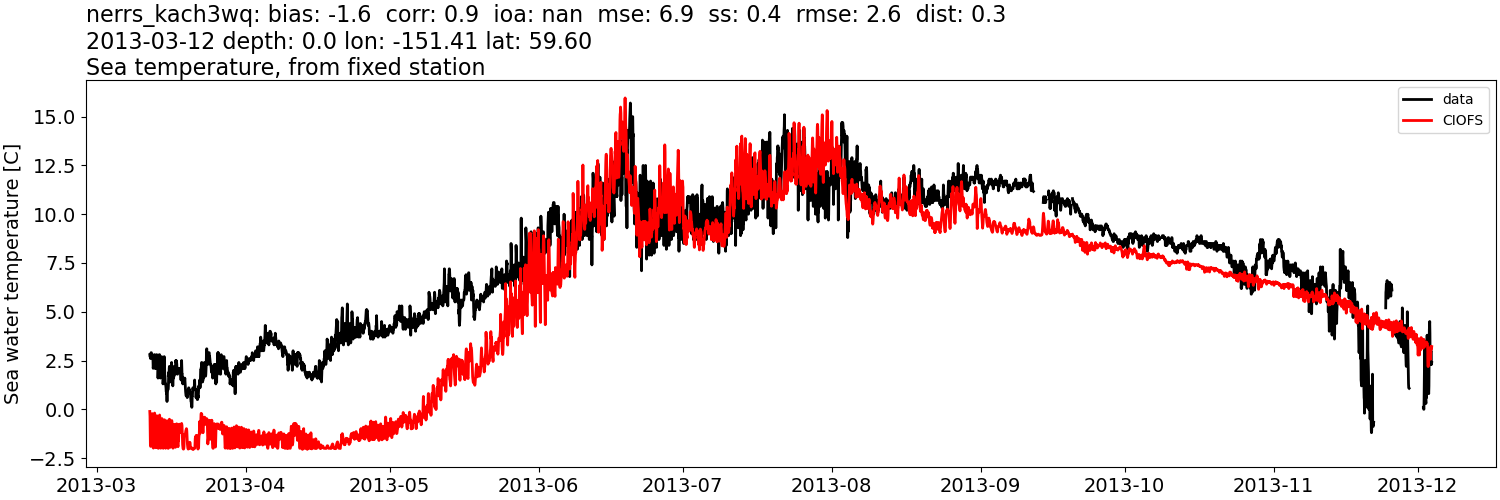
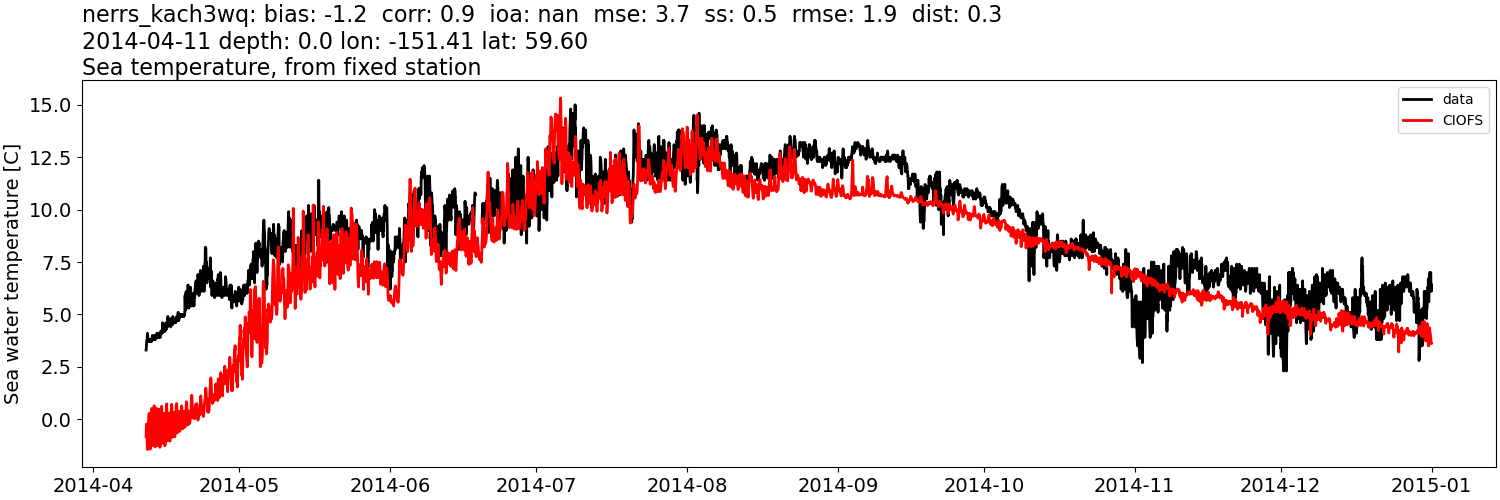
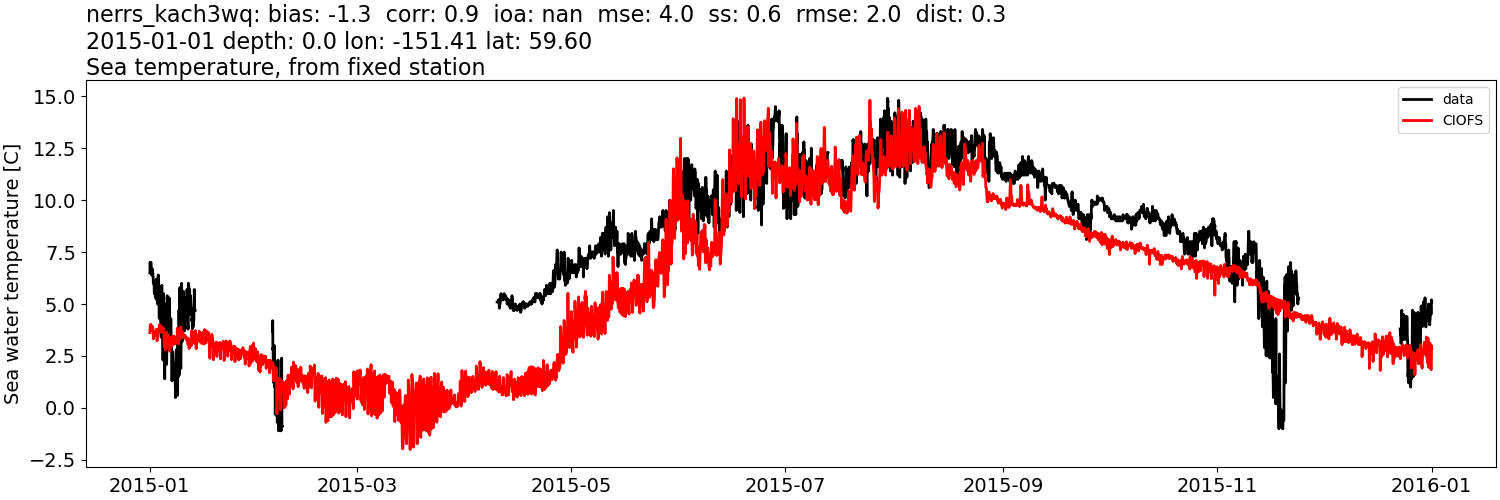
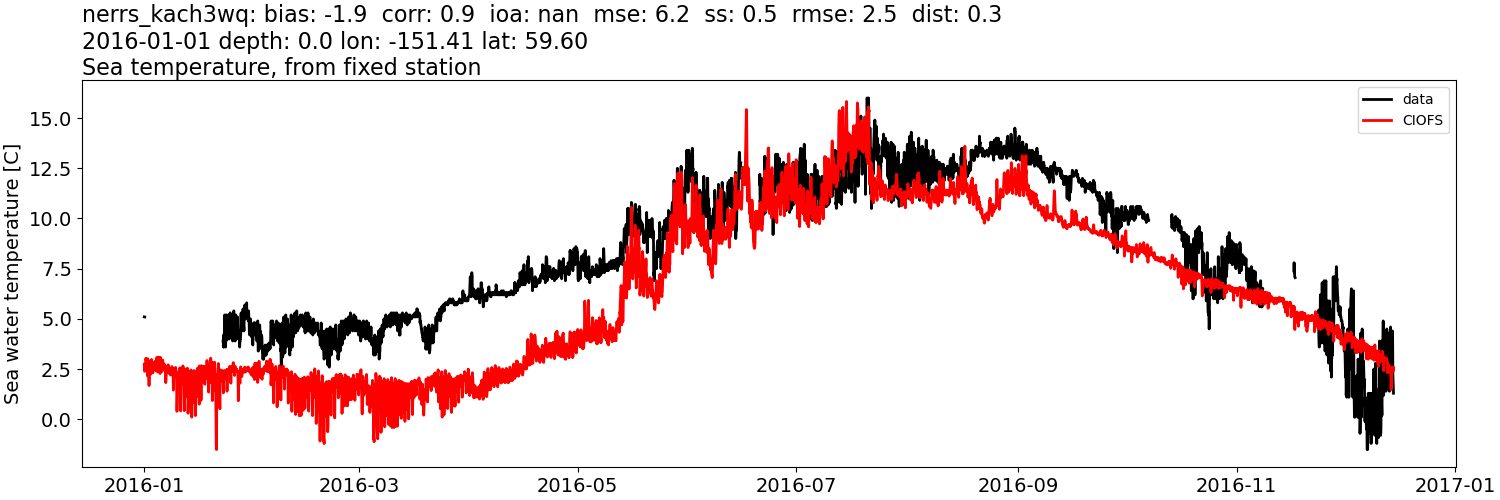
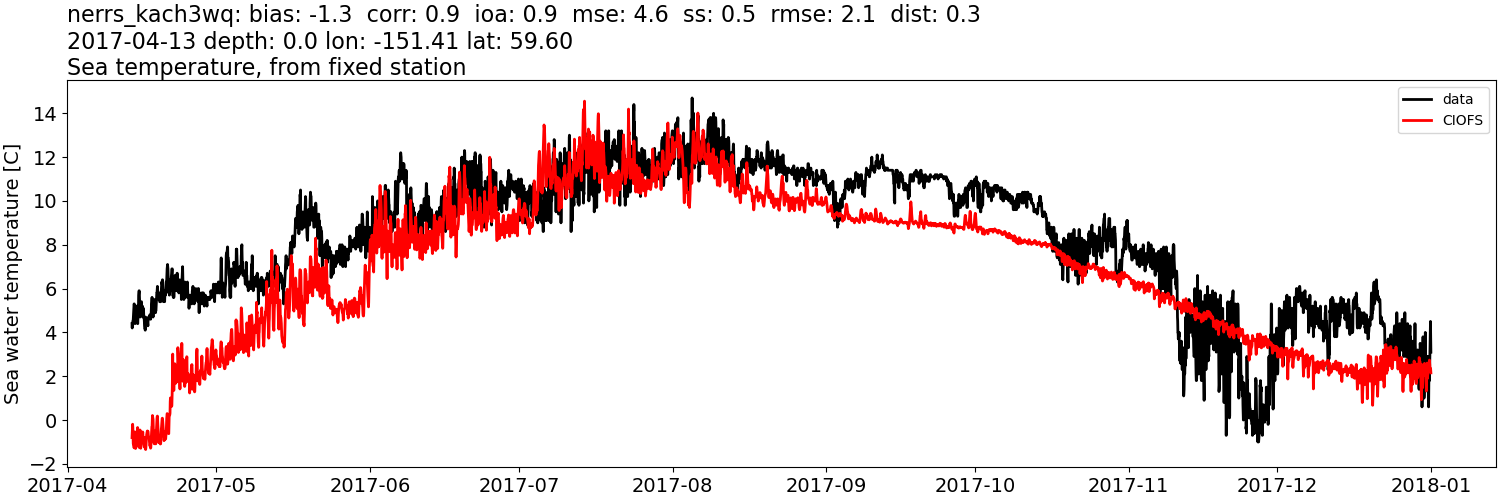
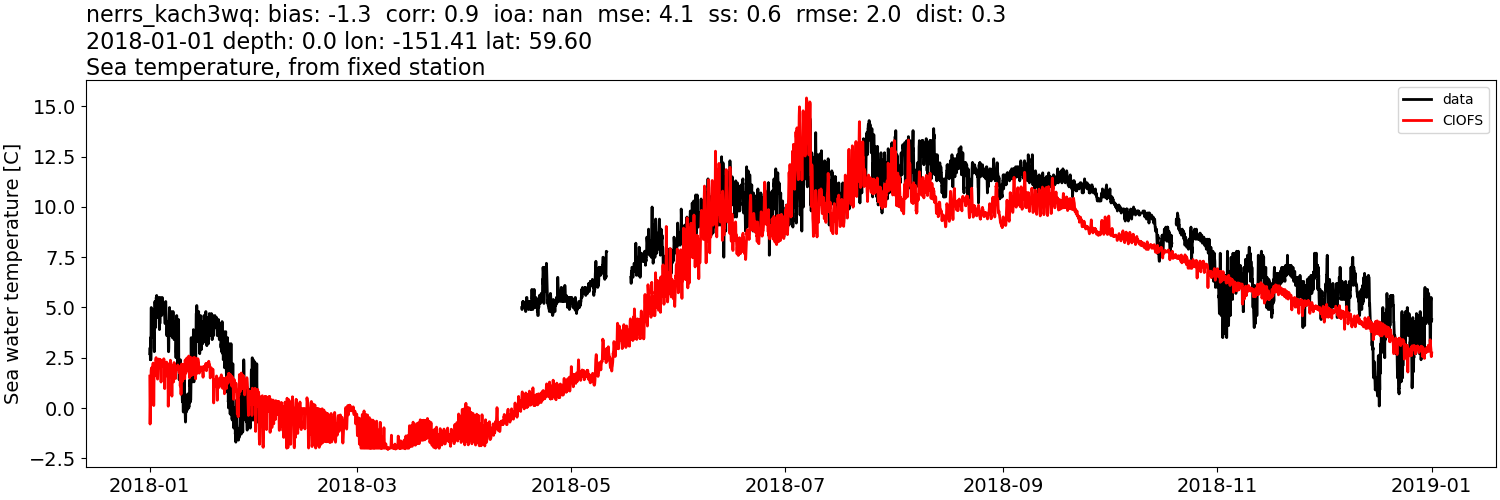
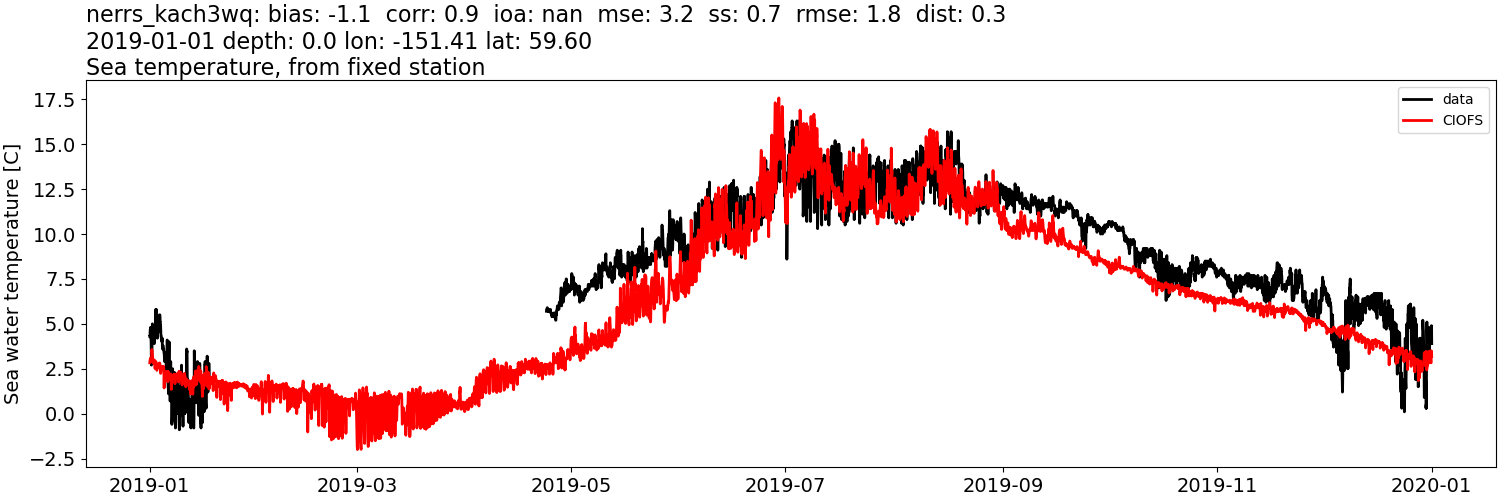
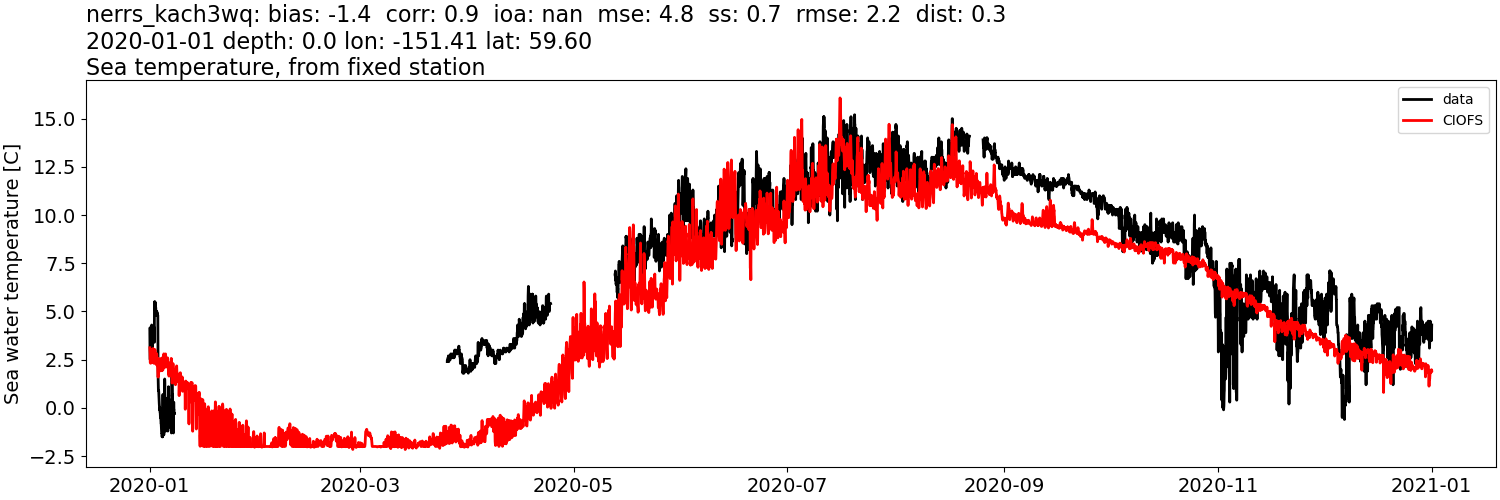
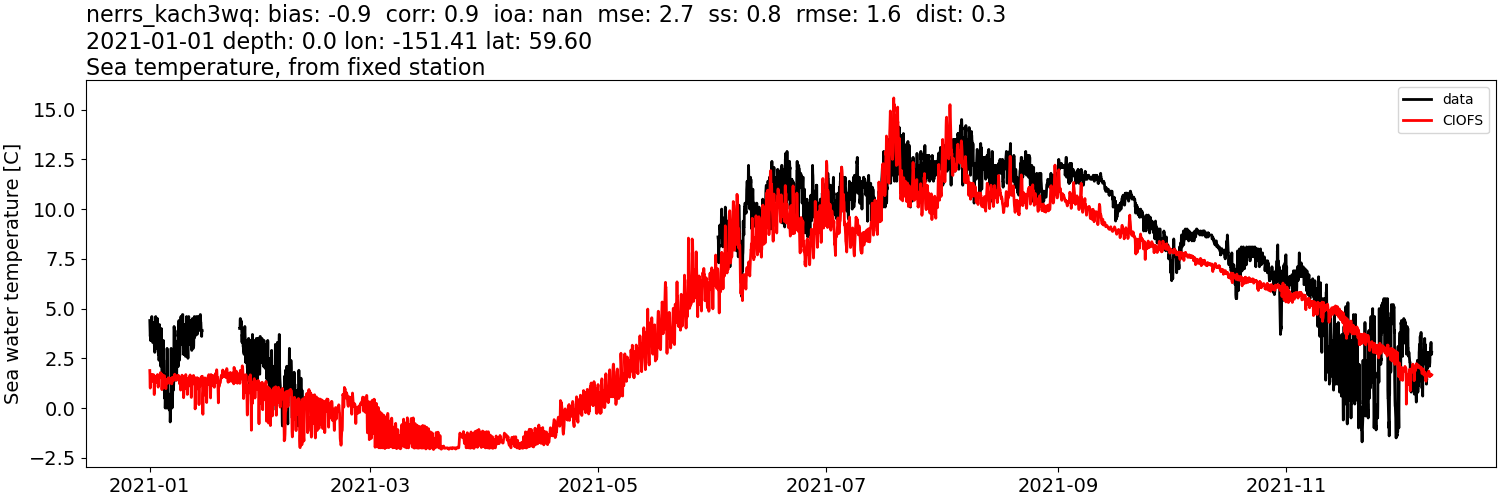
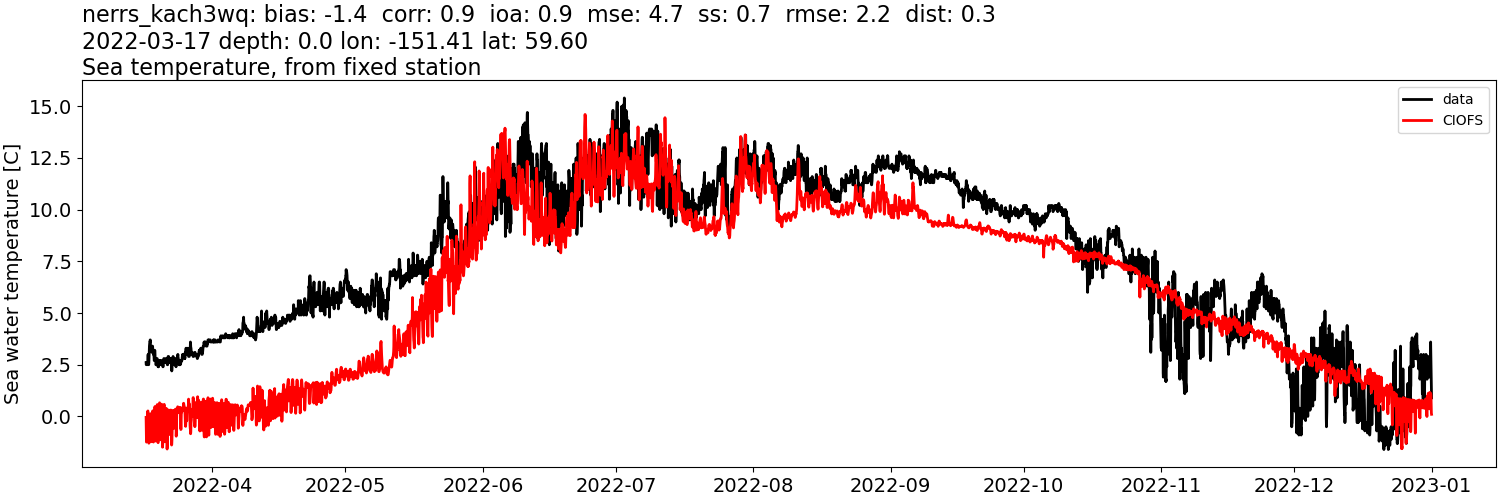
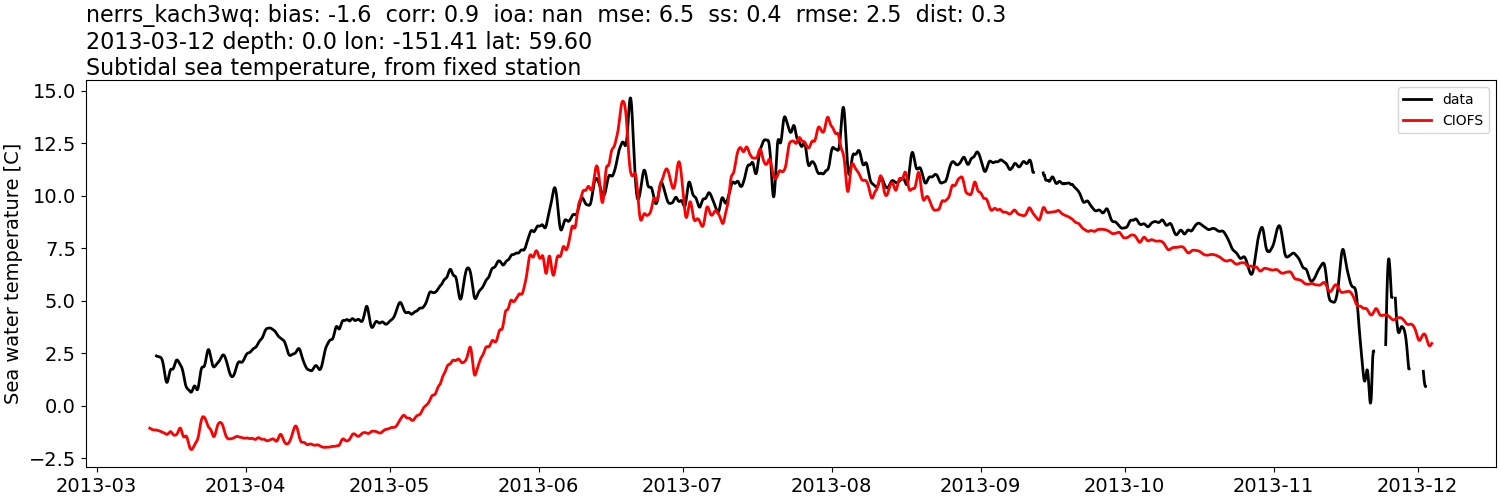
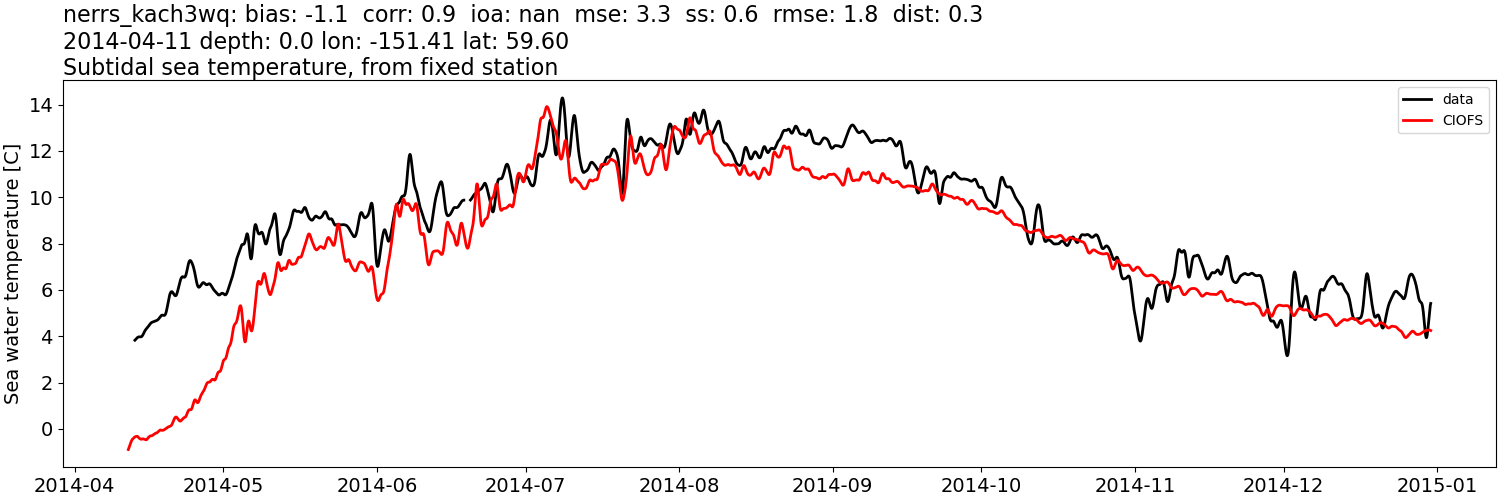
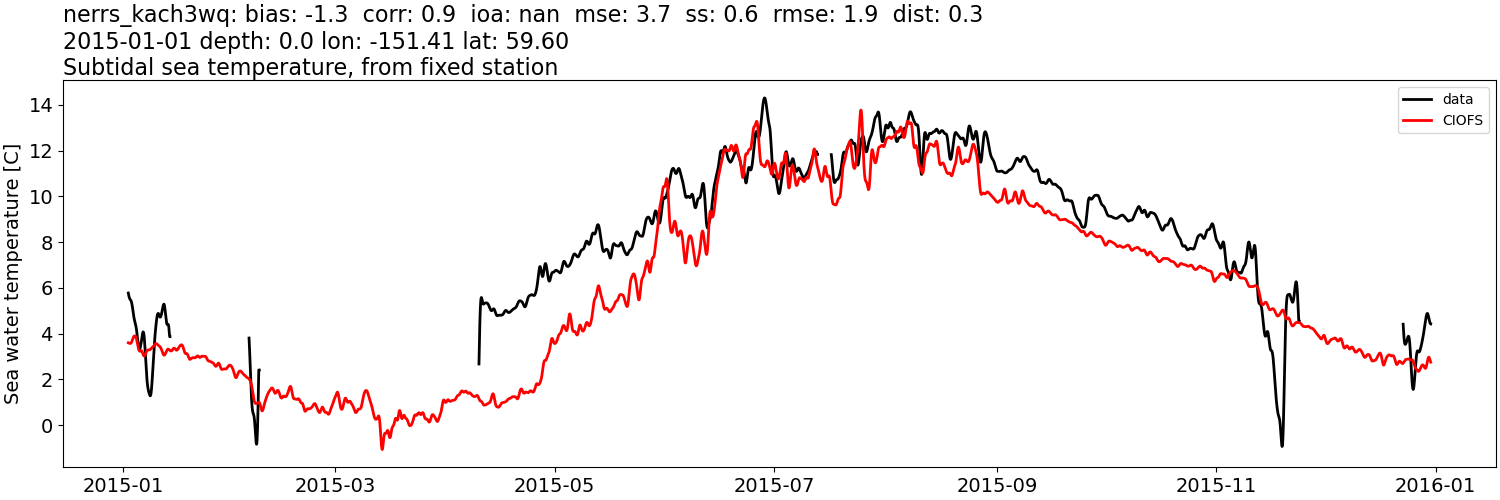
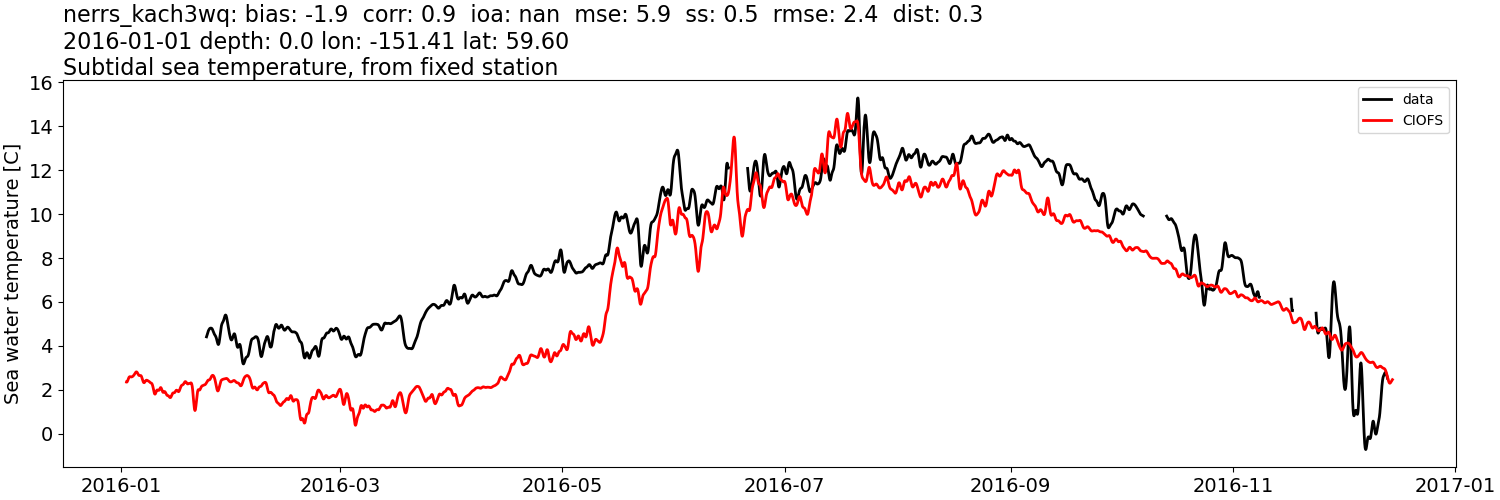
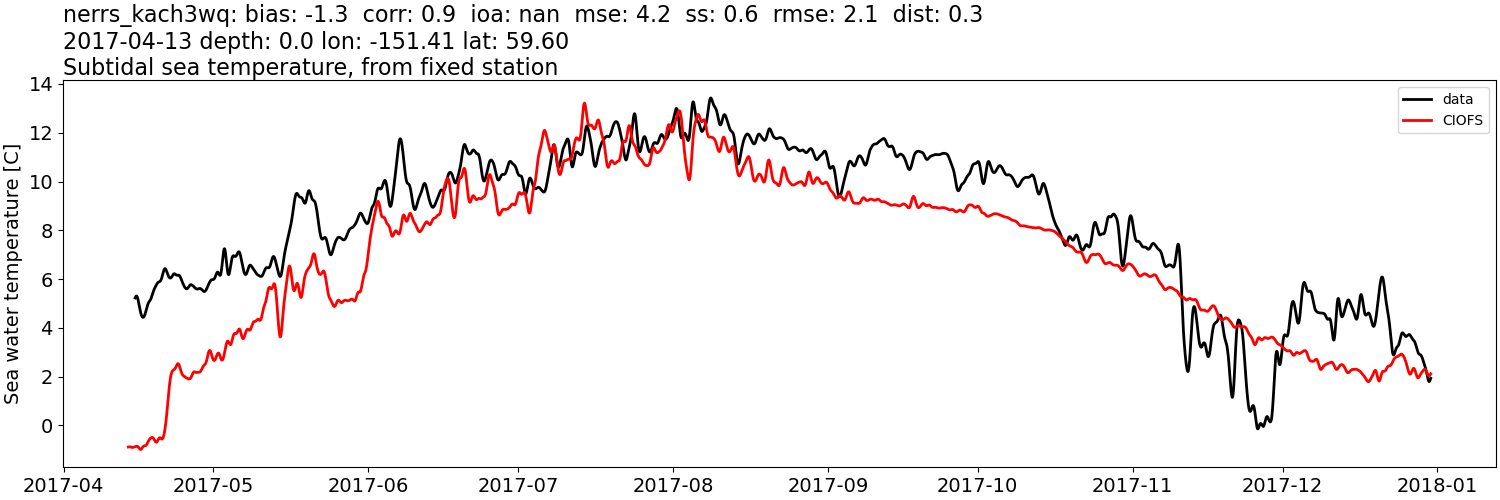
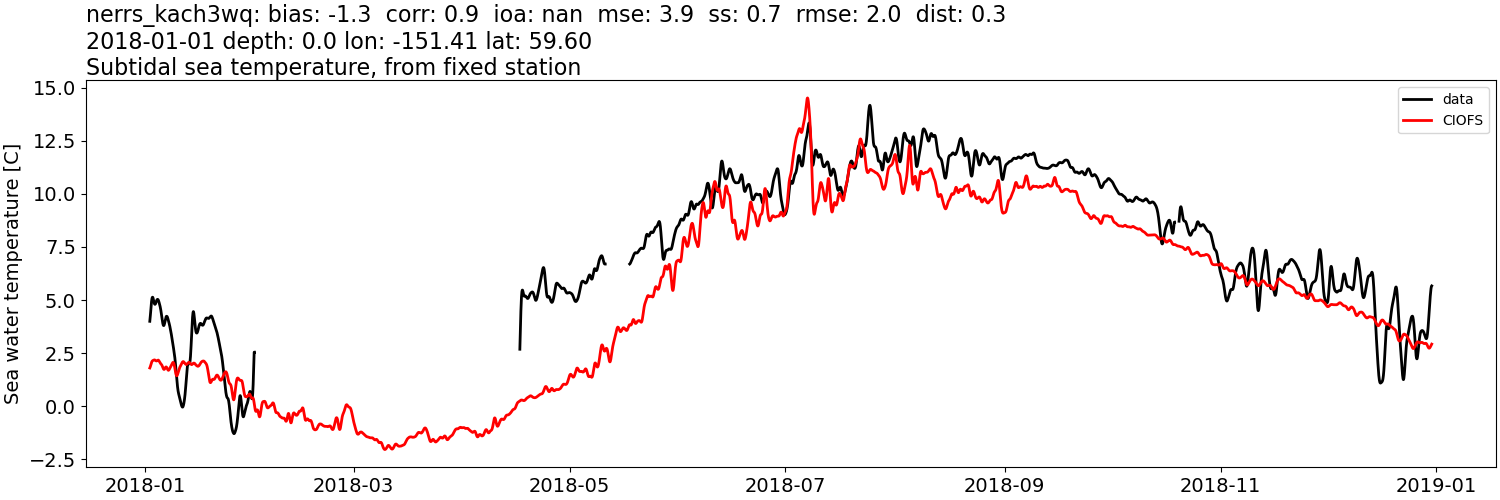
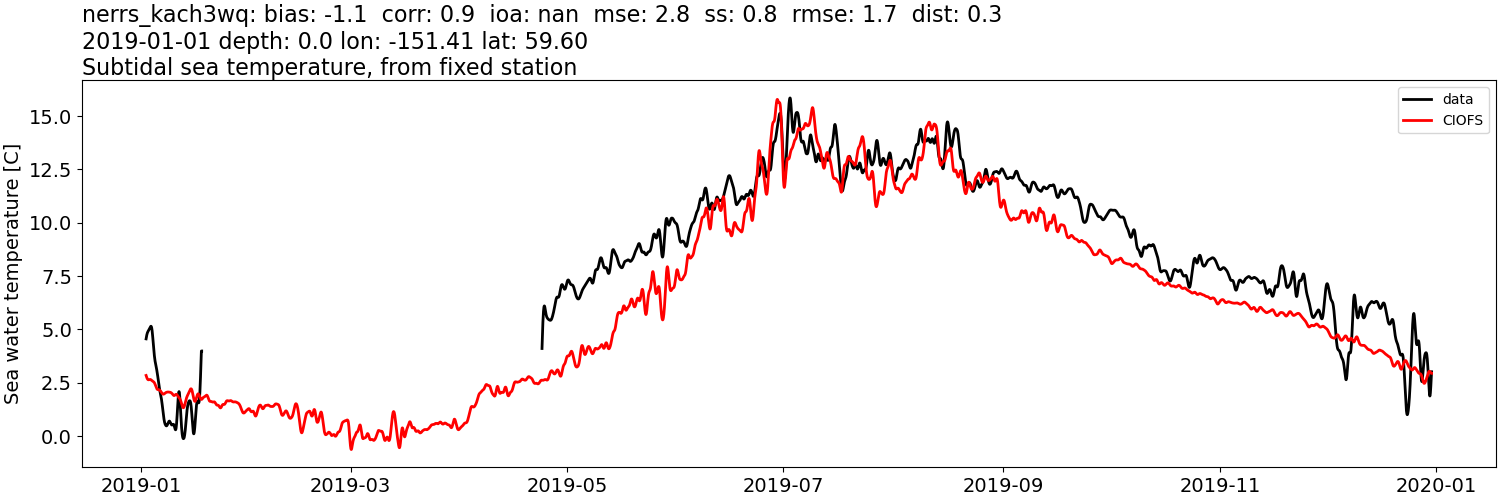
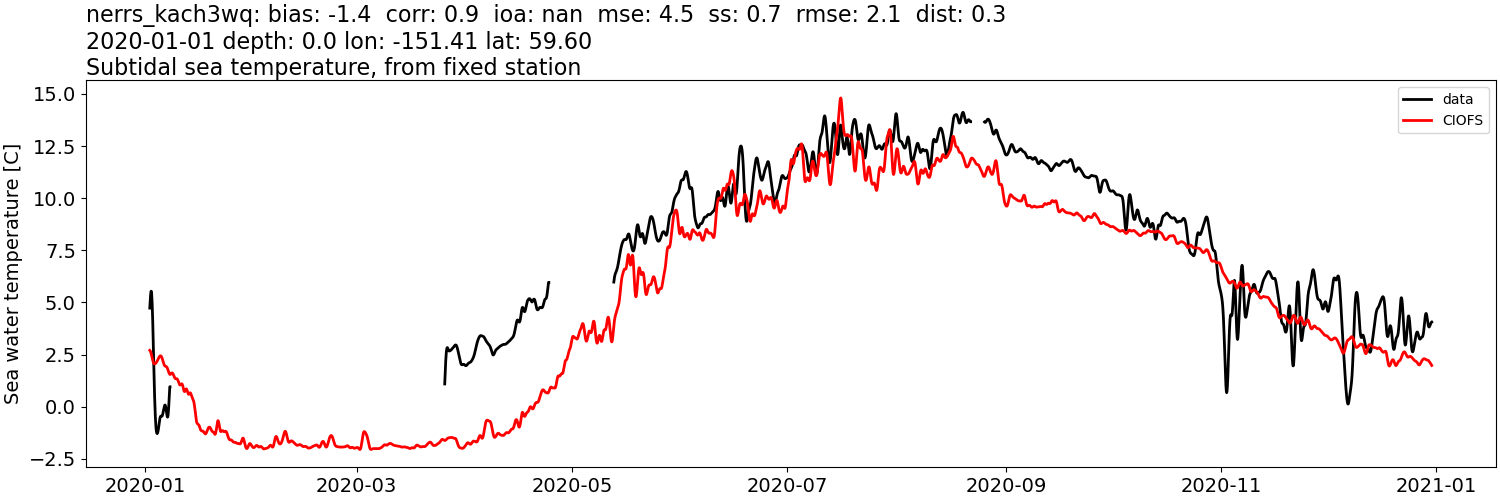
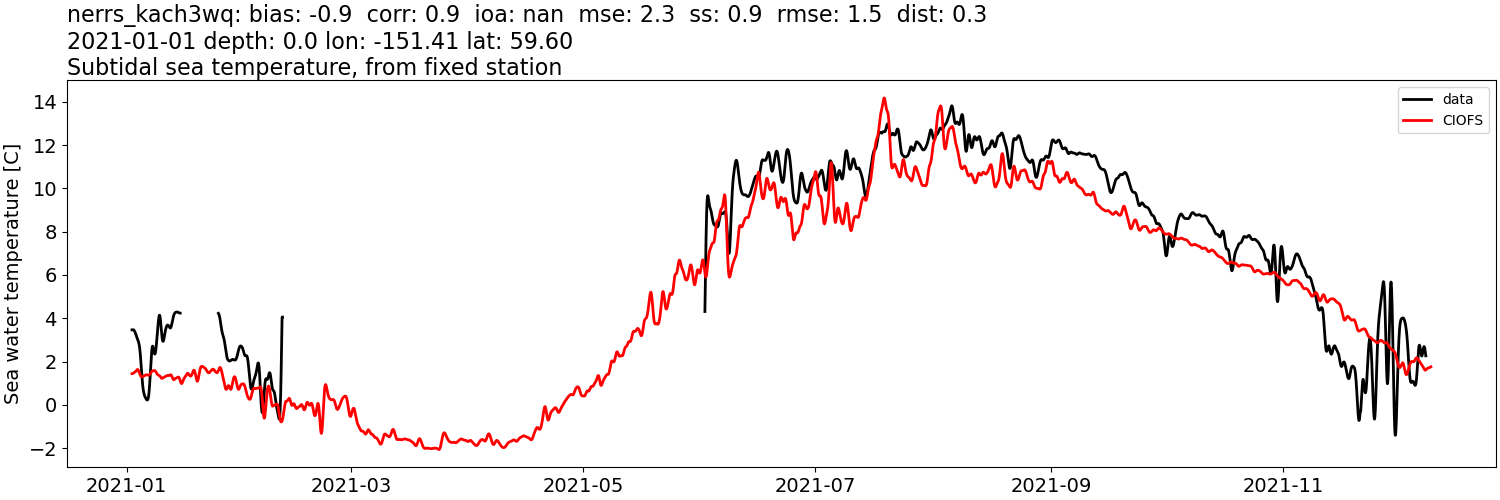
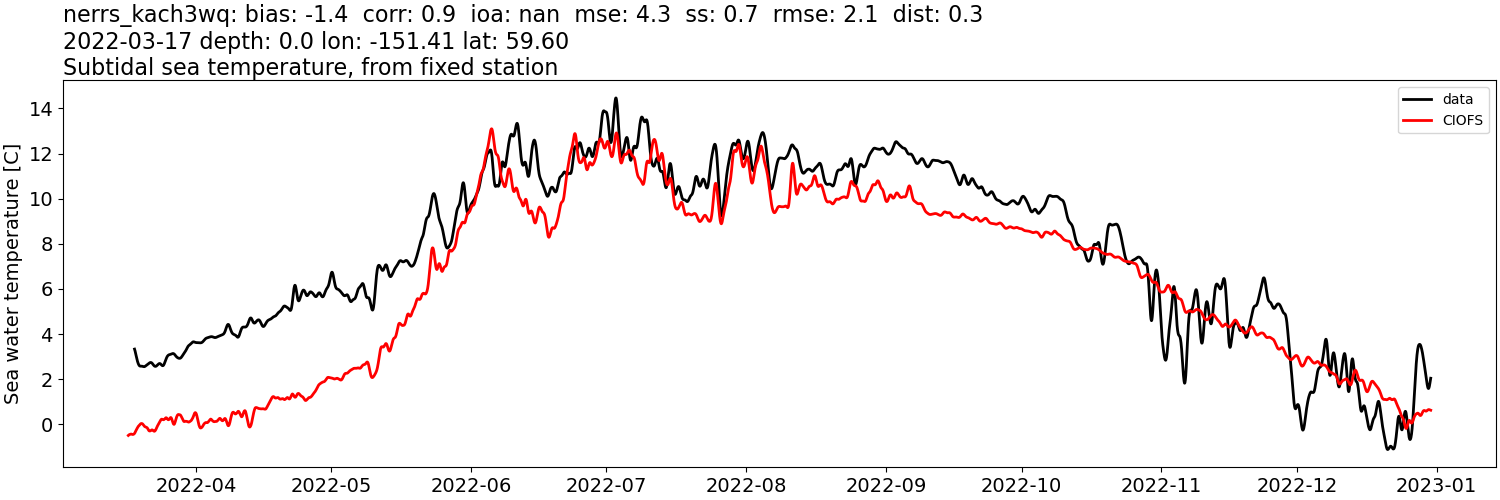
Sea water temperature:#
CIOFS#
Comparison plots by year
2012
2013
2014
2015
2016
2017
2018
2019
2020
2021
2022
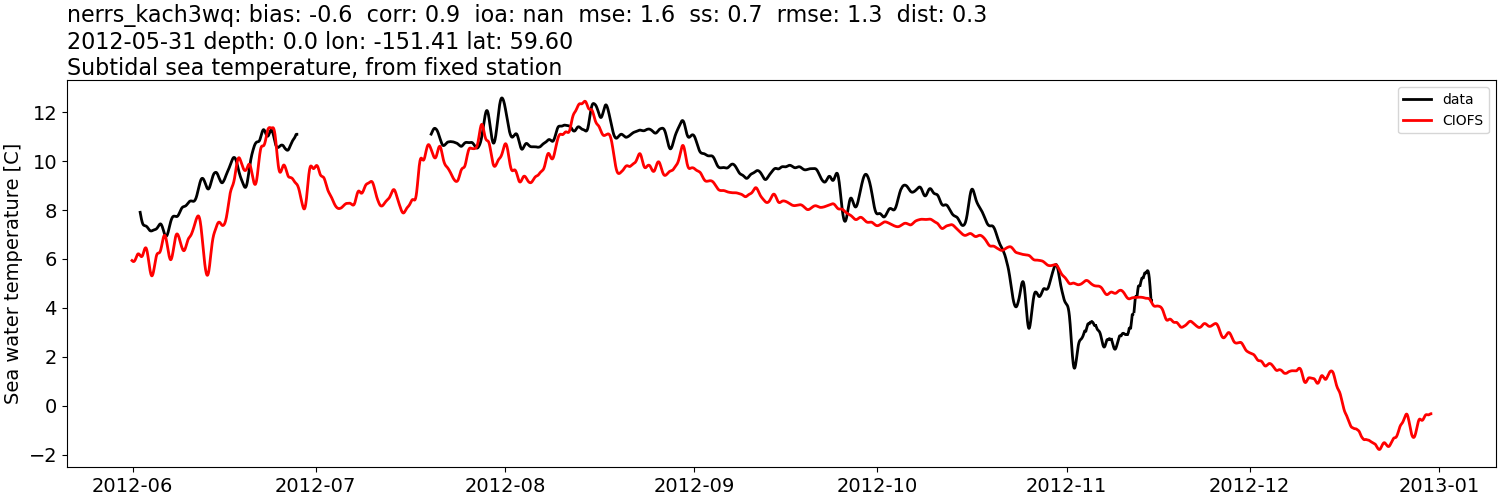
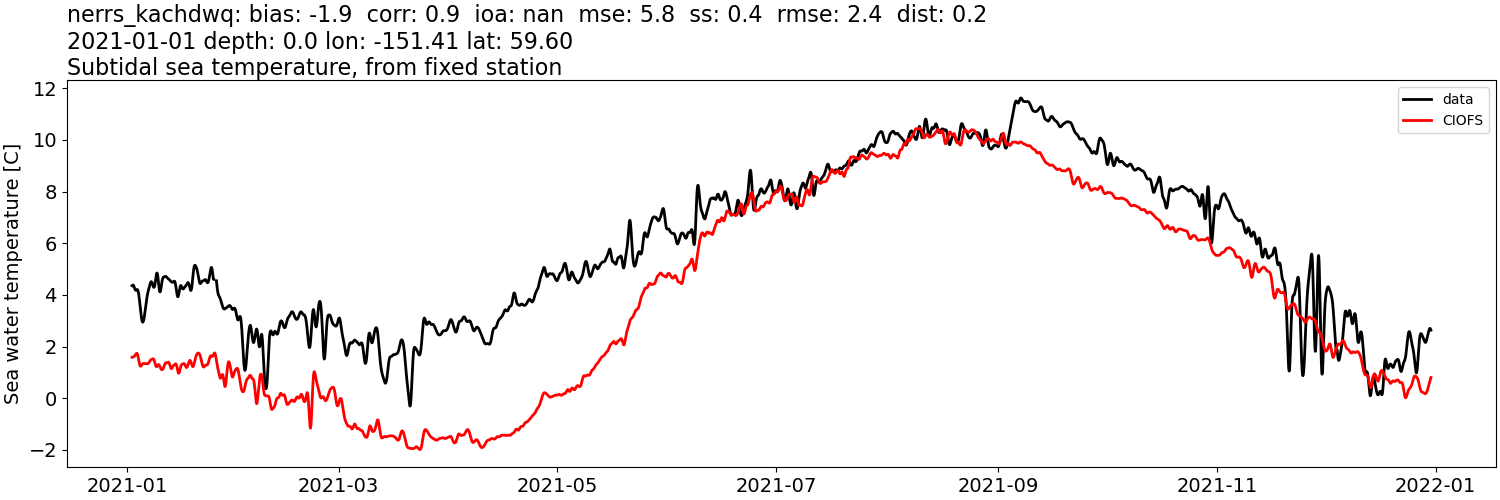
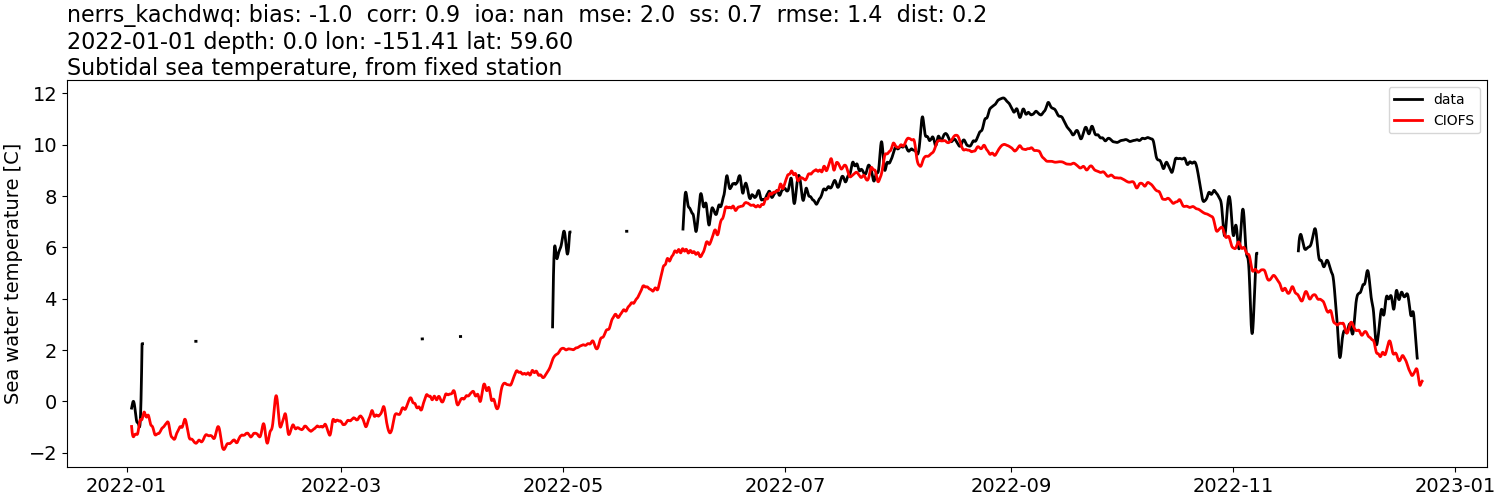
Sea water temperature: tidally-filtered#
CIOFS#
Comparison plots by year
2012
2013
2014
2015
2016
2017
2018
2019
2020
2021
2022
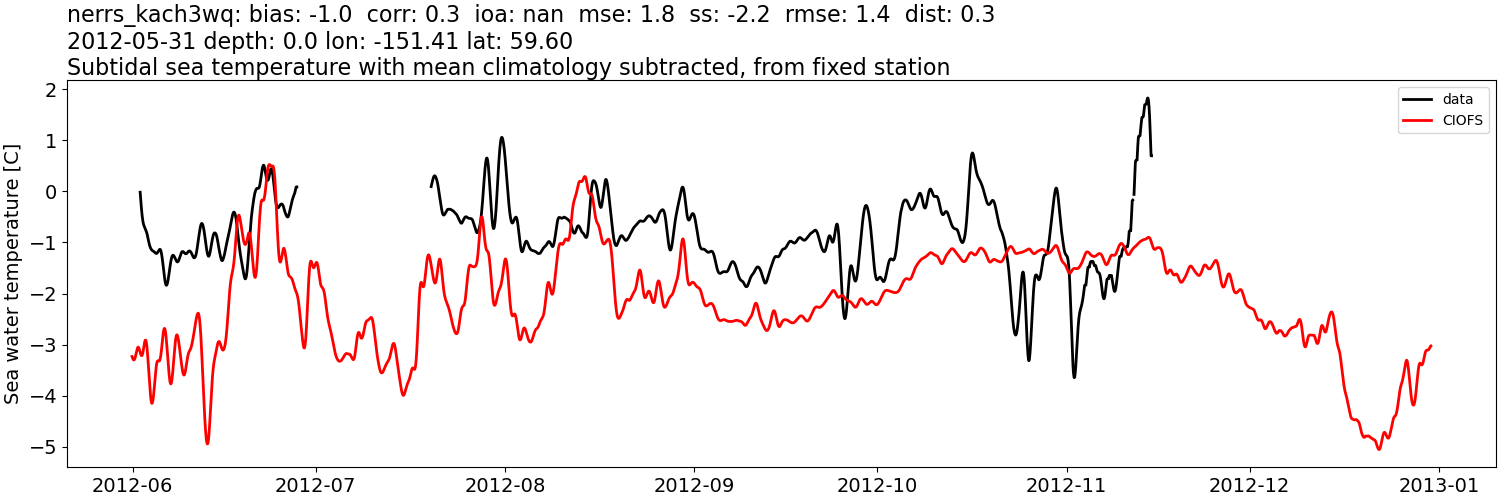
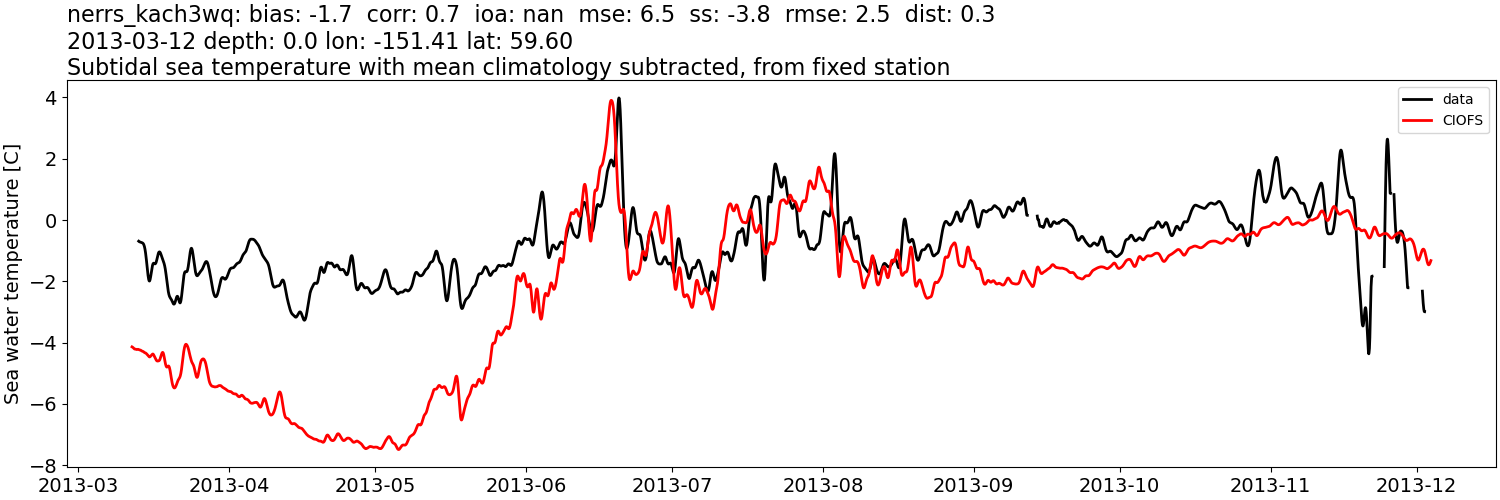
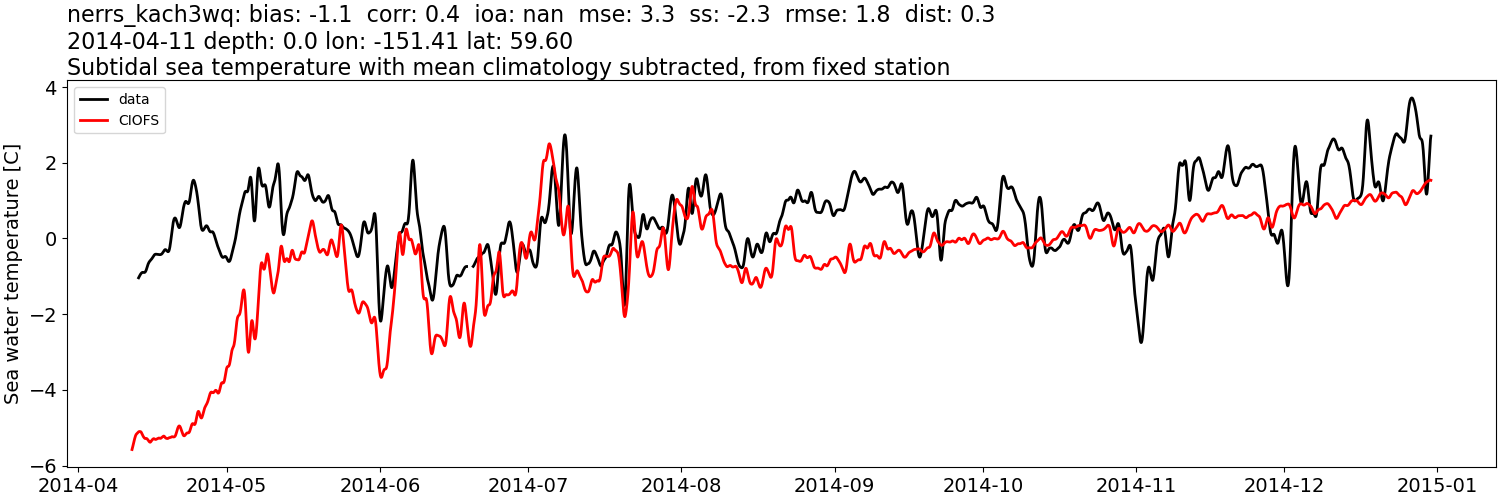
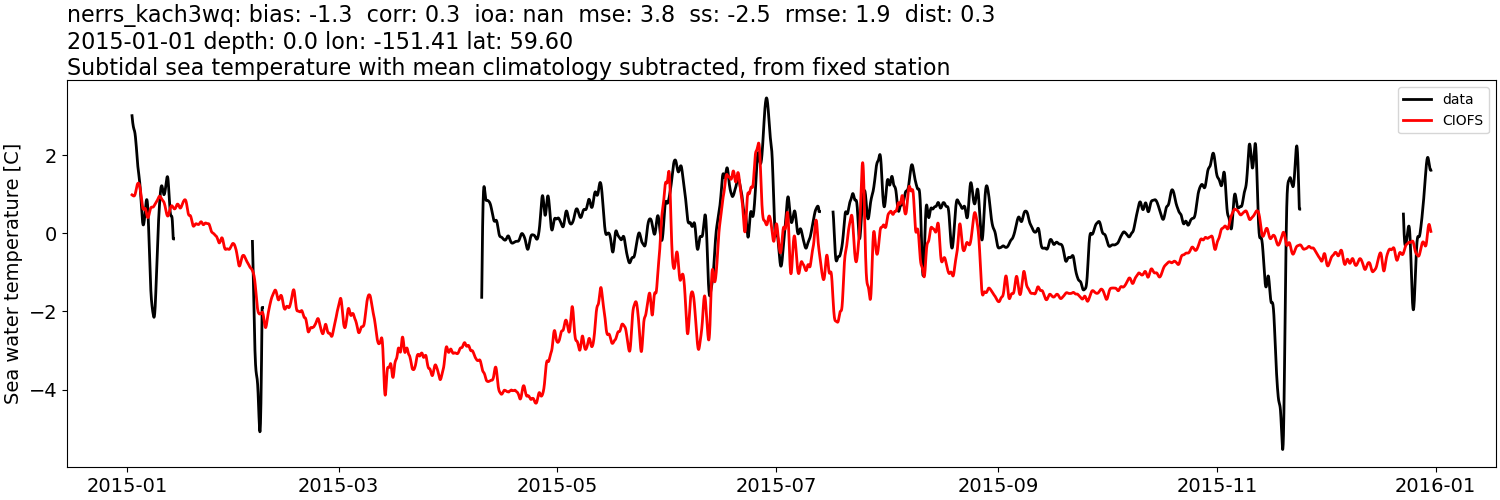
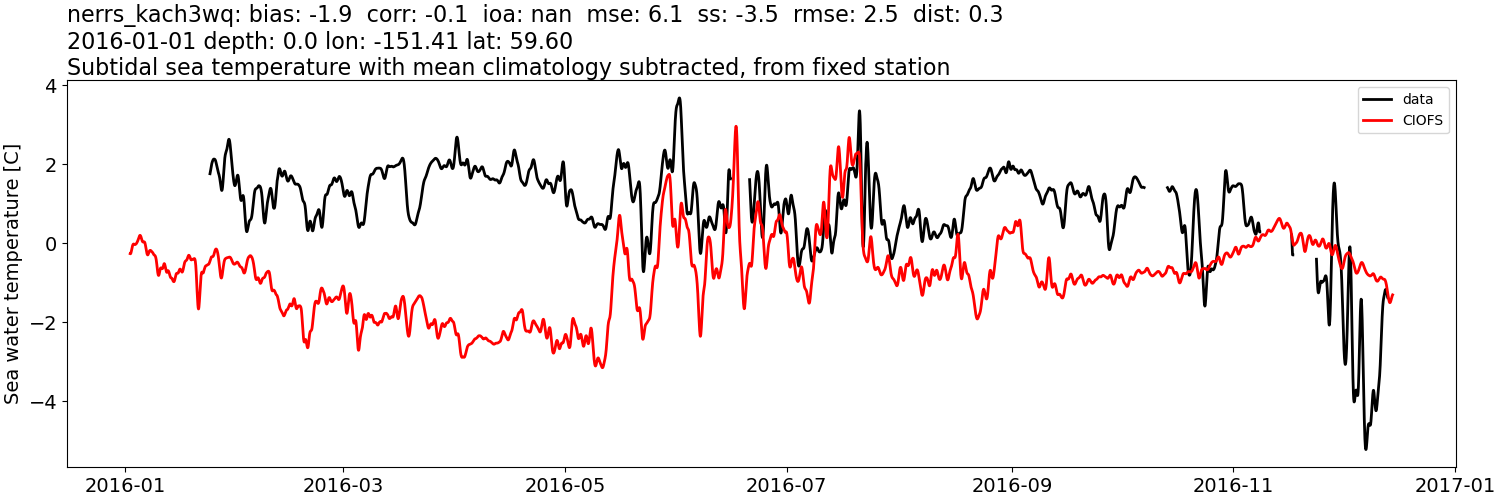
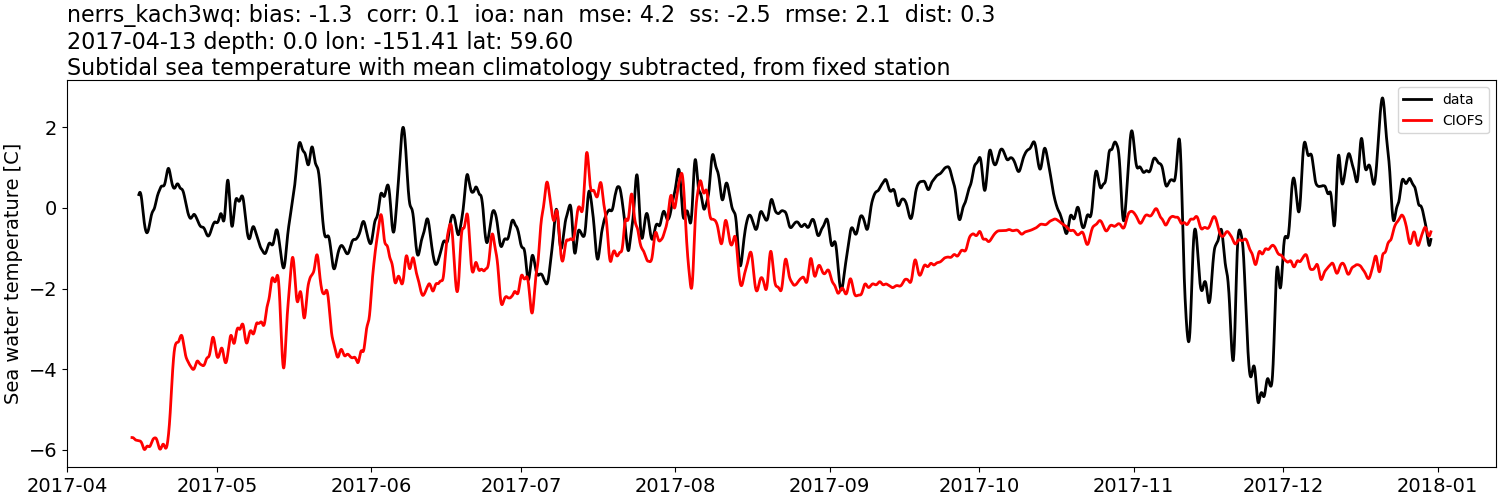
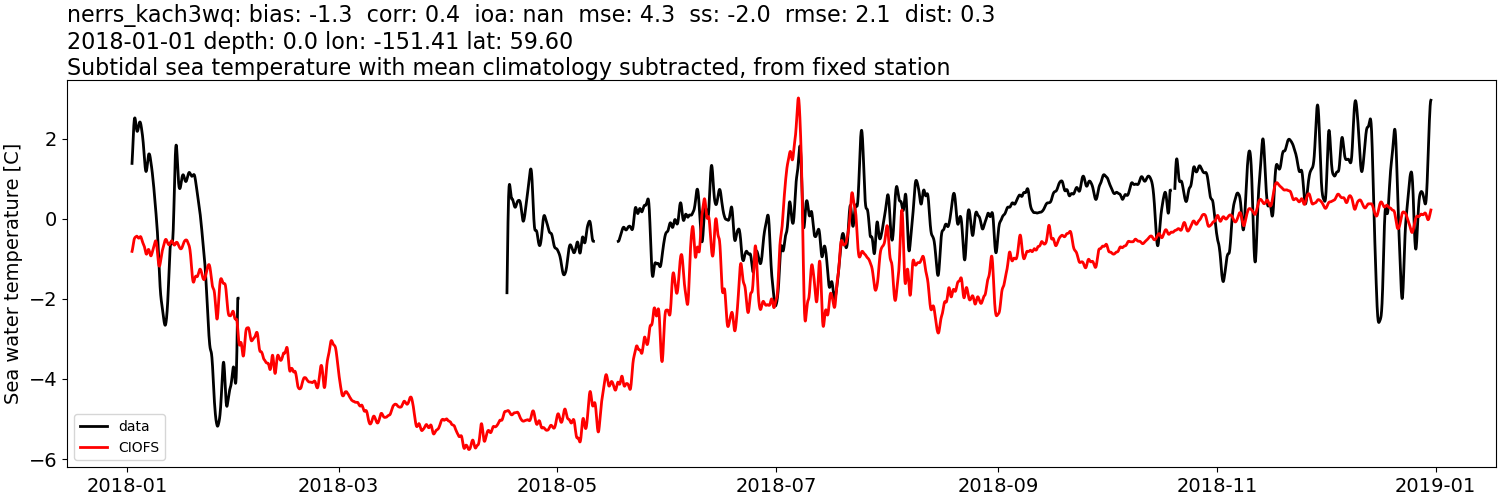
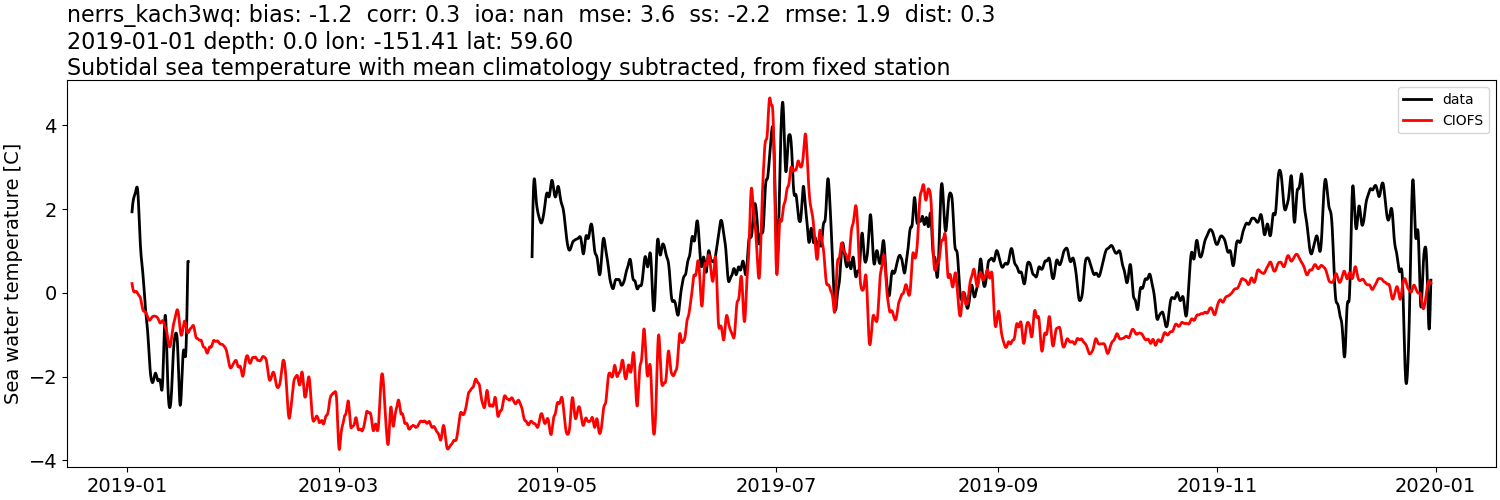
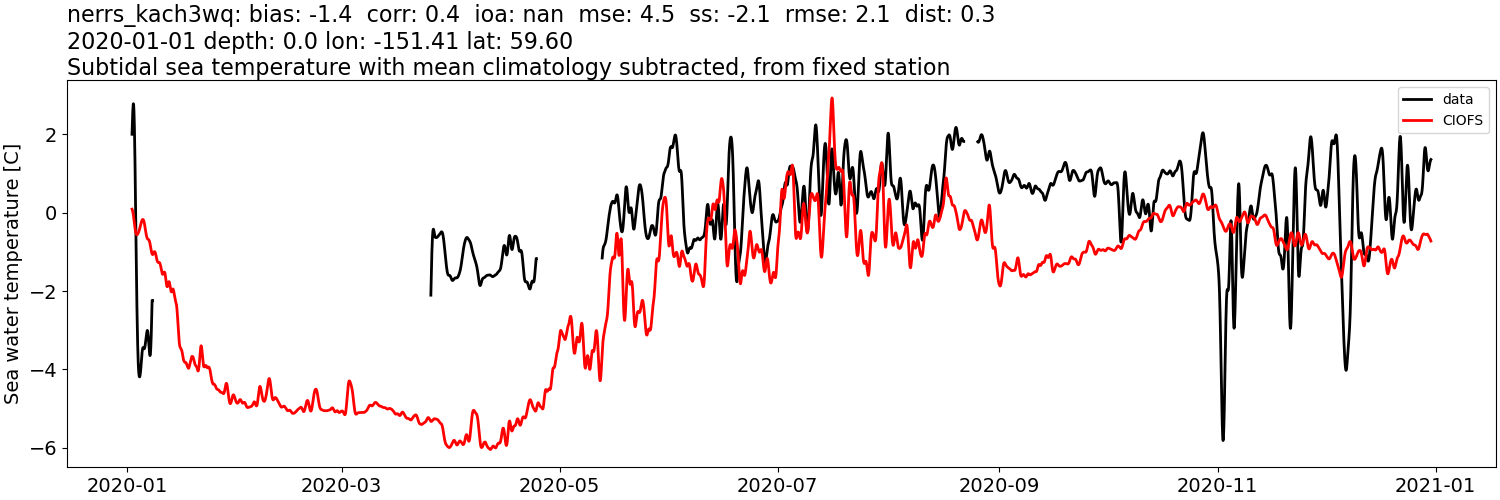
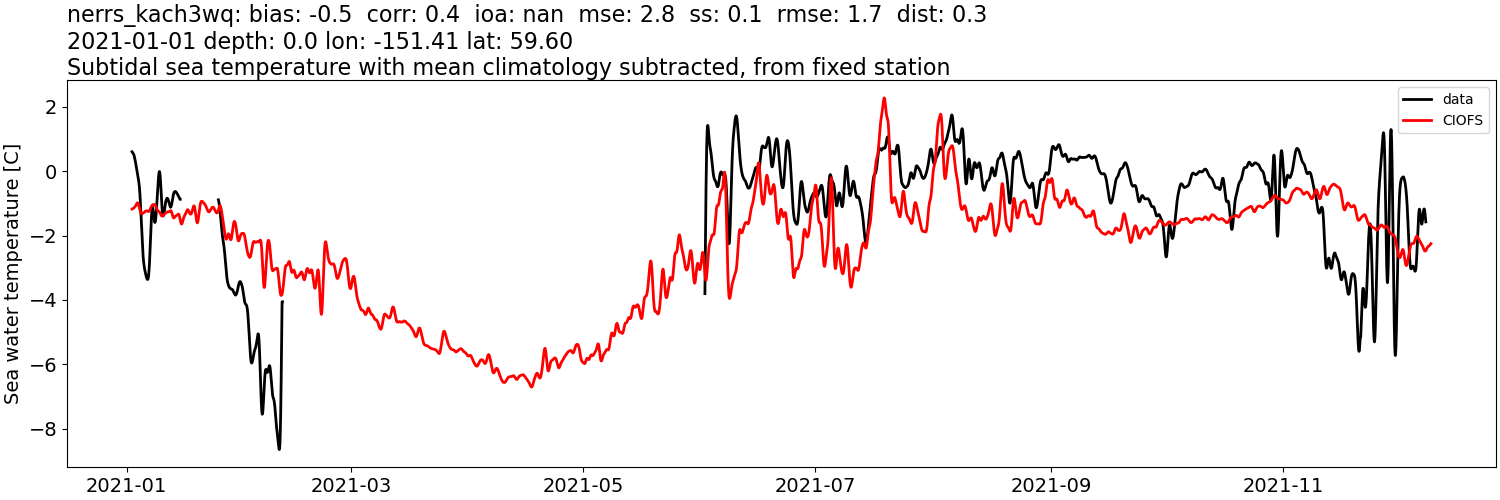
Sea water temperature: tidally-filtered, then monthly mean from data subtracted#

CIOFS#
Comparison plots by year
2012
2013
2014
2015
2016
2017
2018
2019
2020
2021
2022
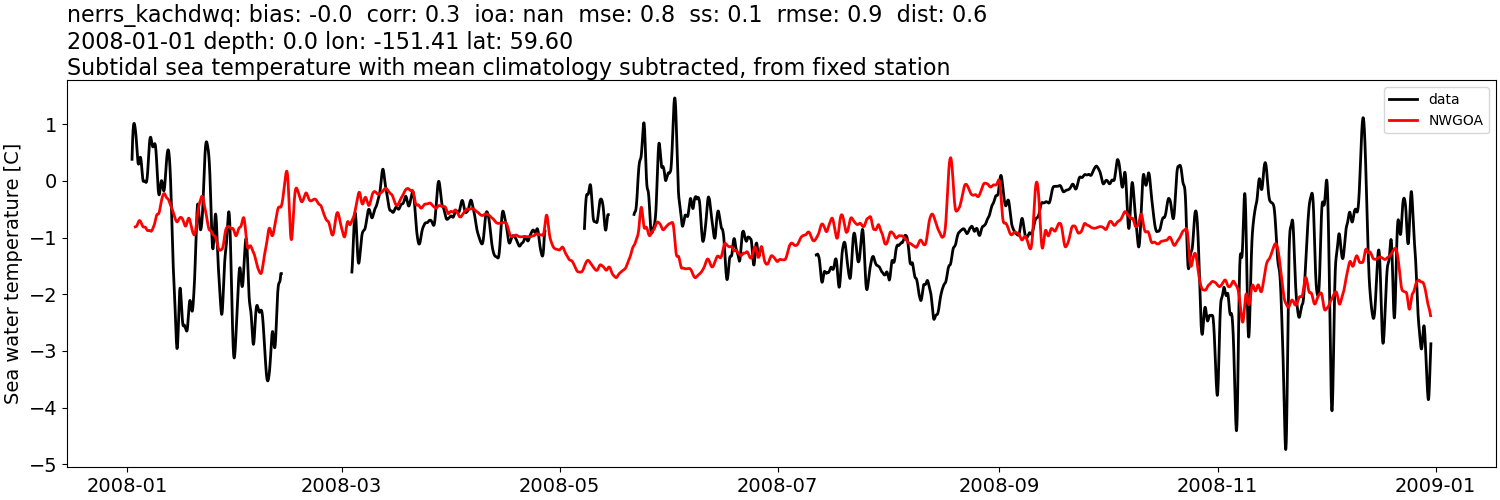
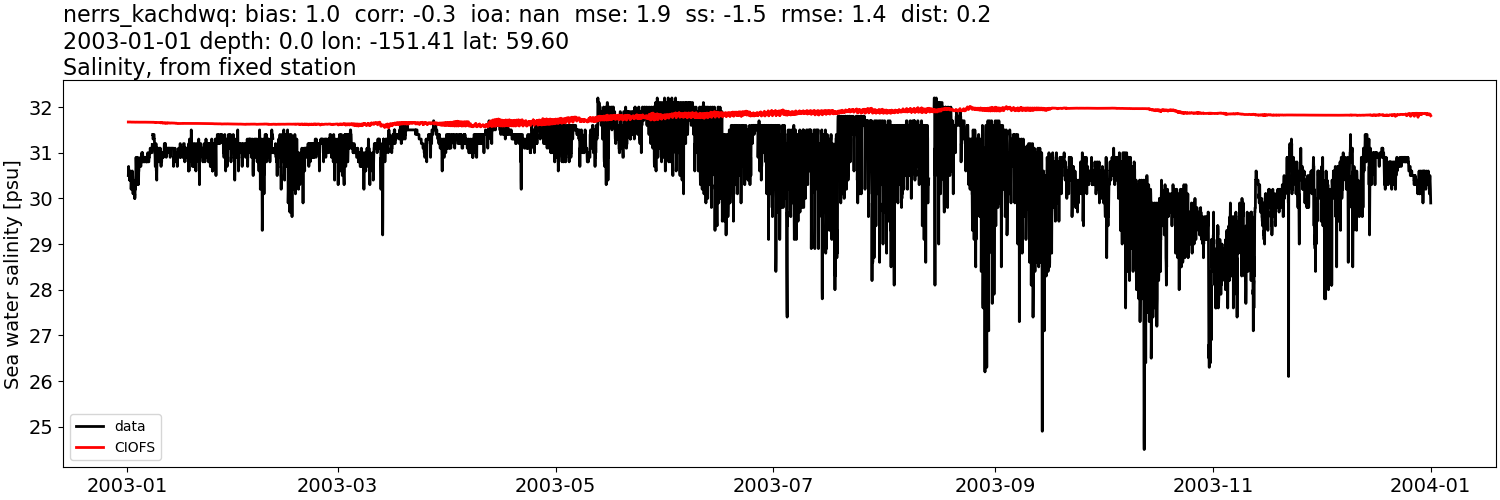
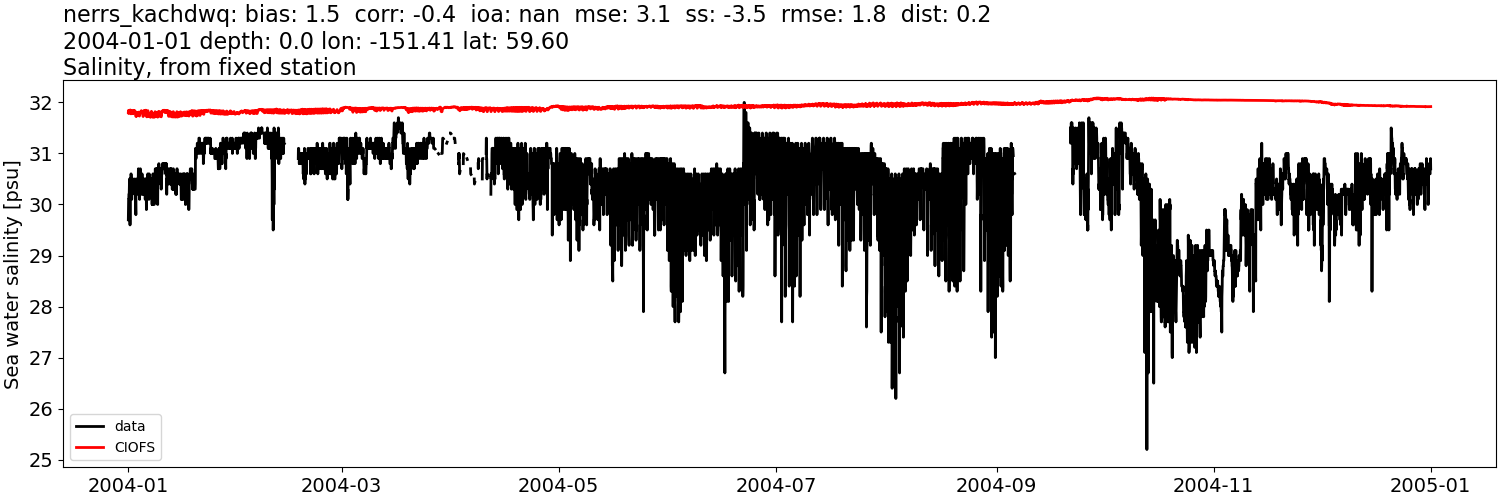
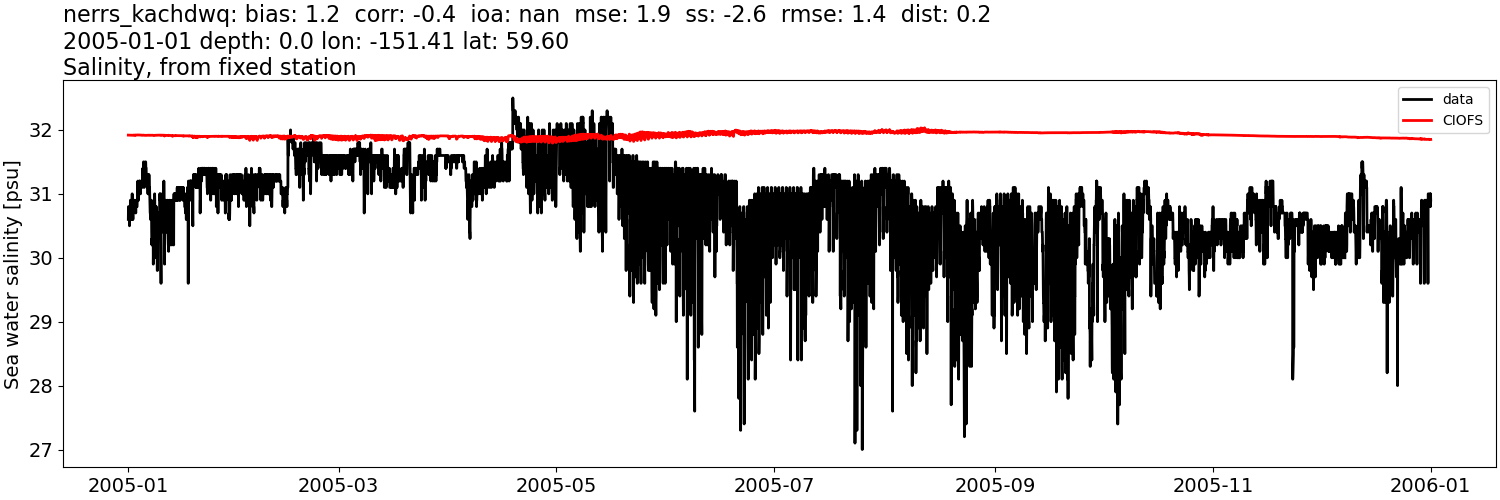
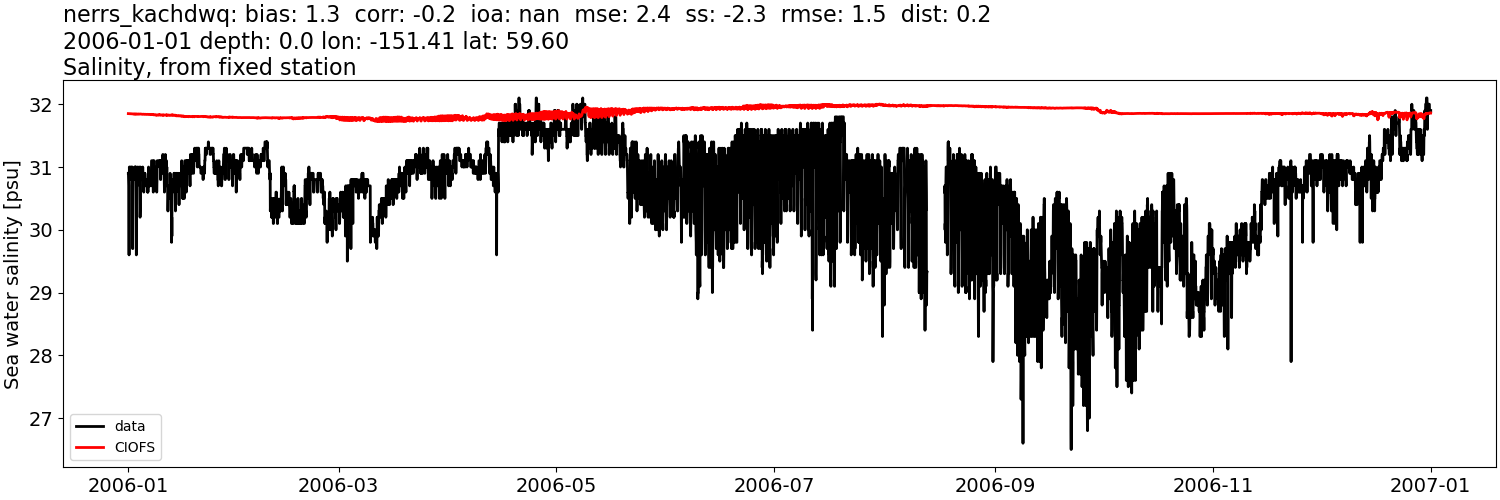
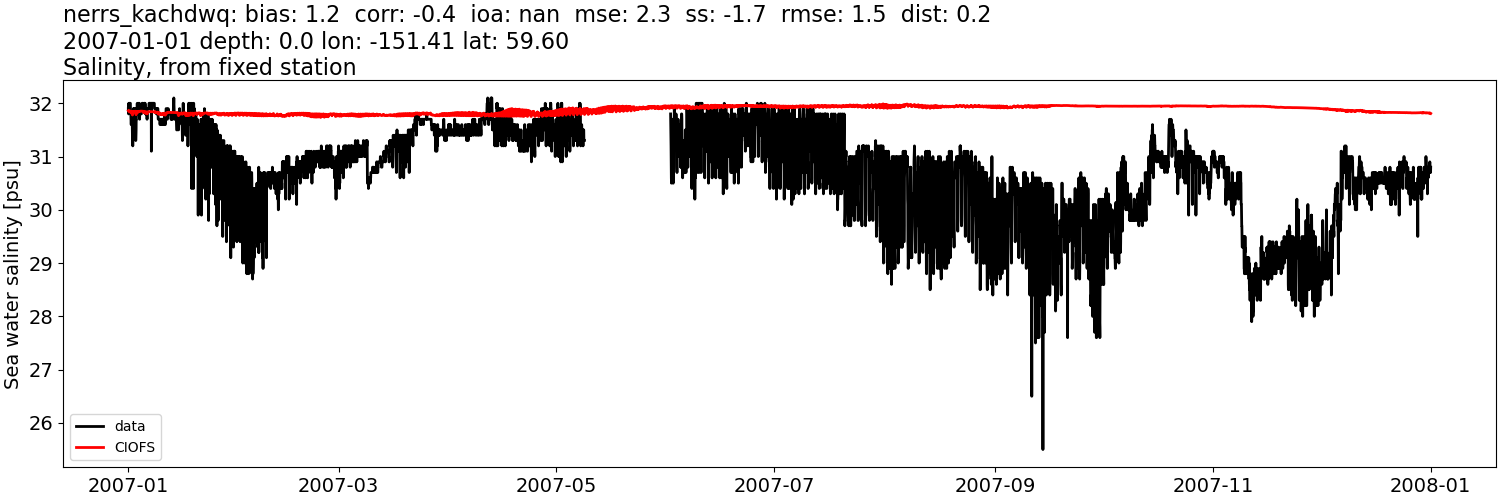
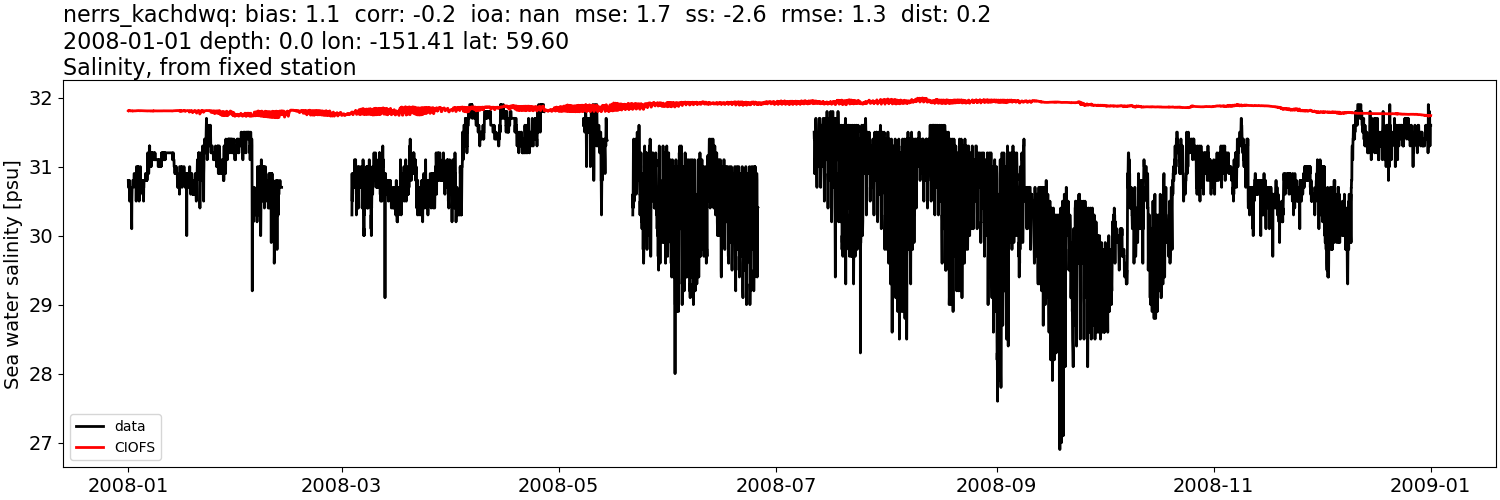
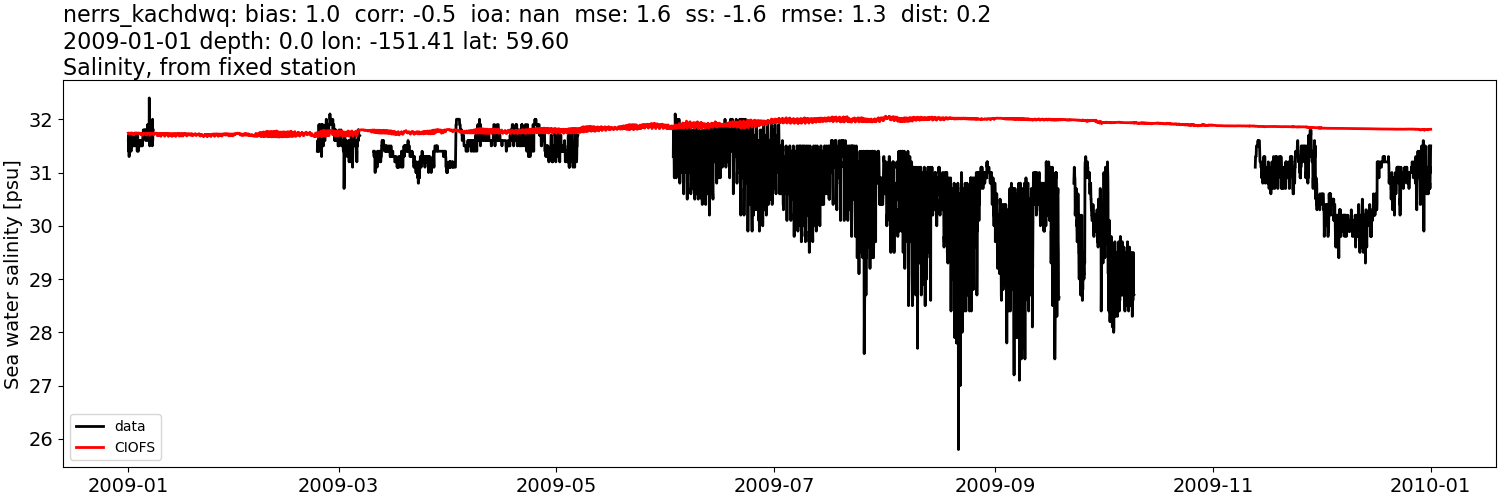
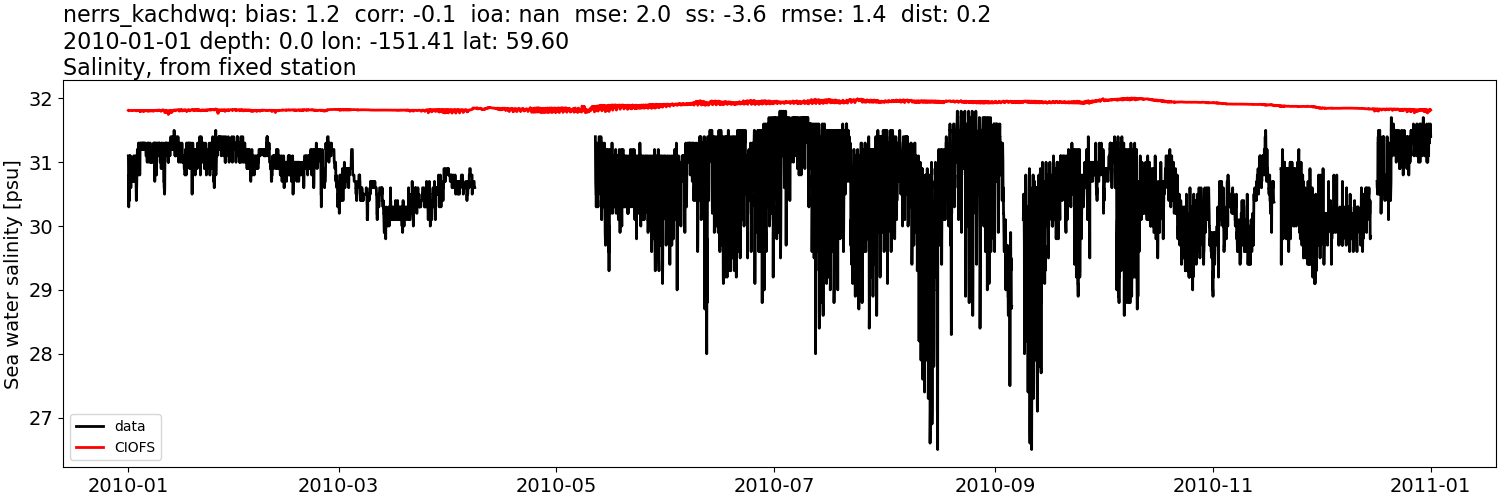
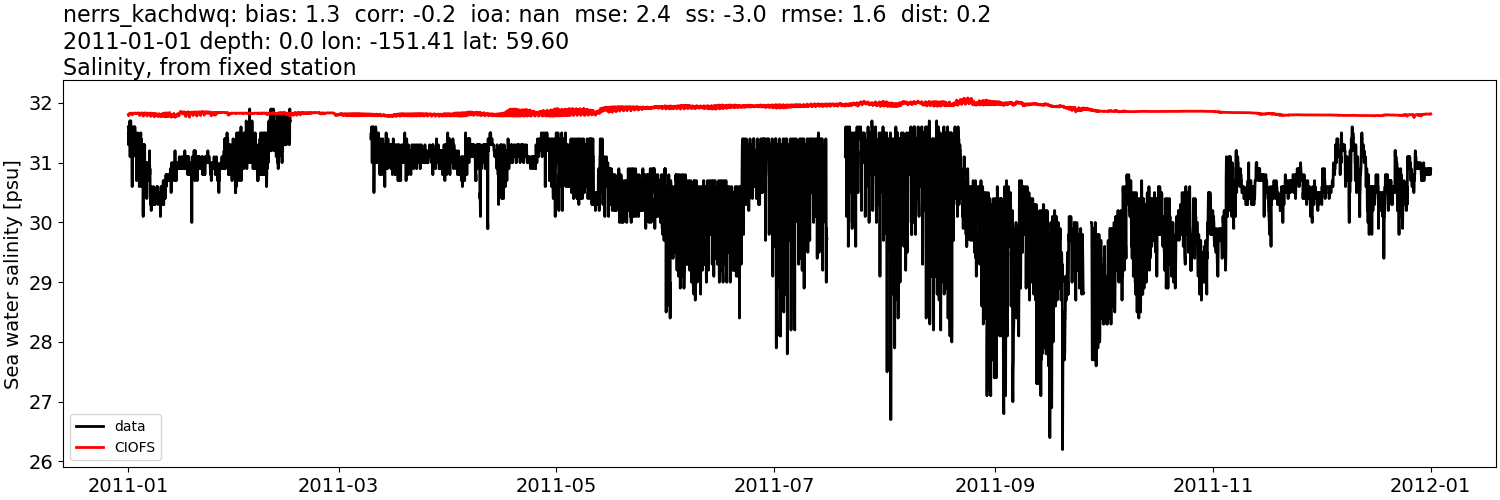
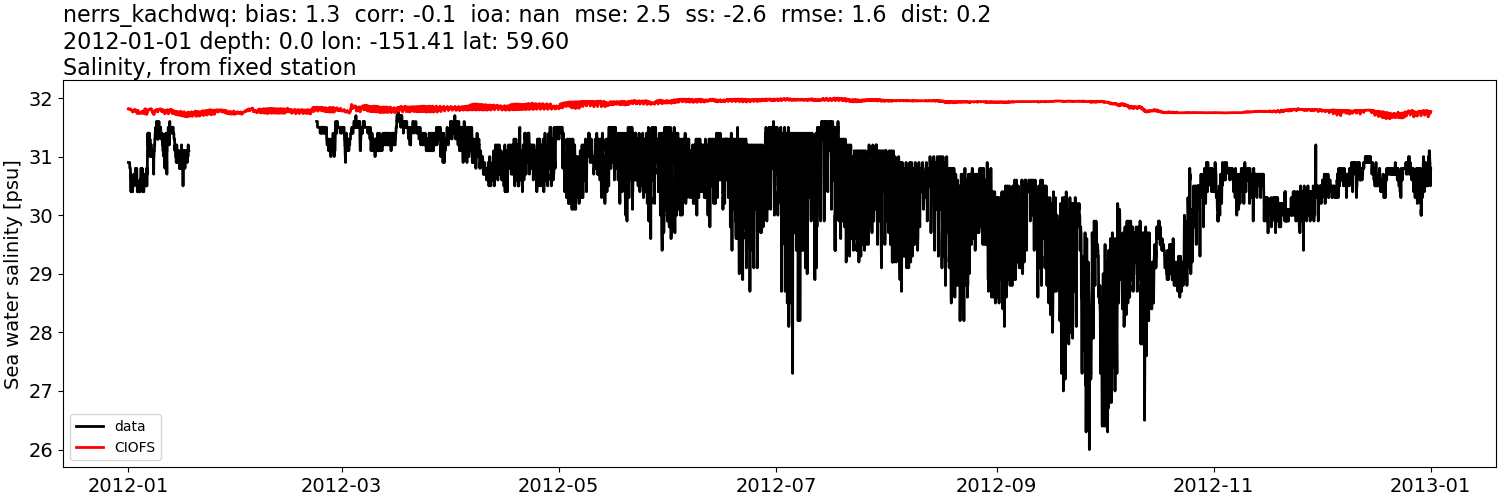
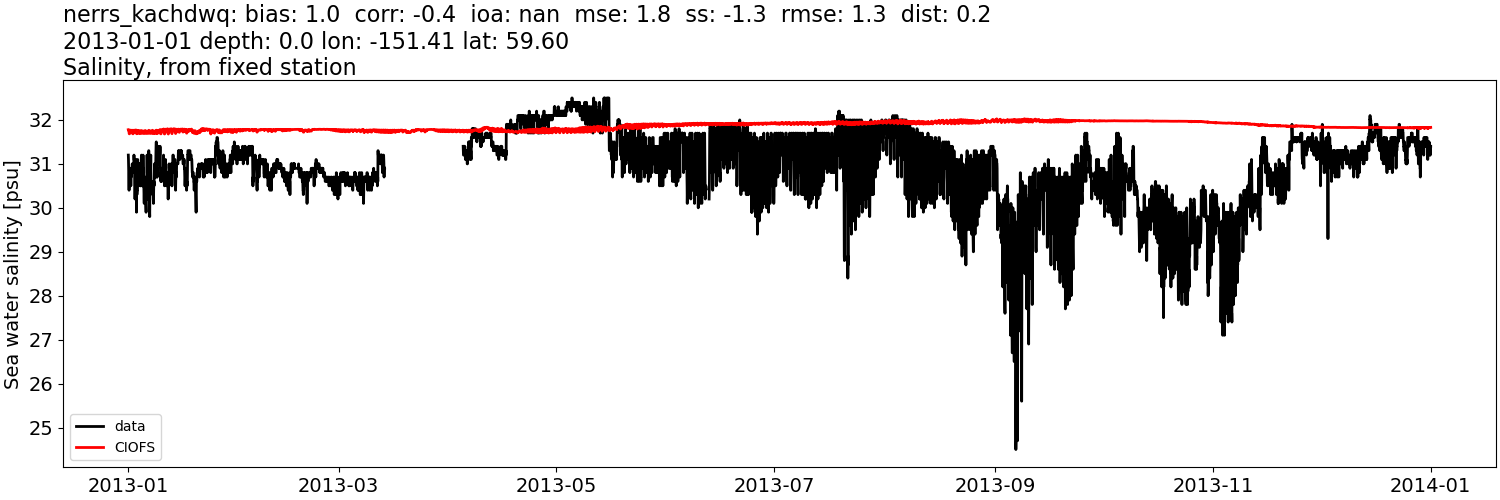
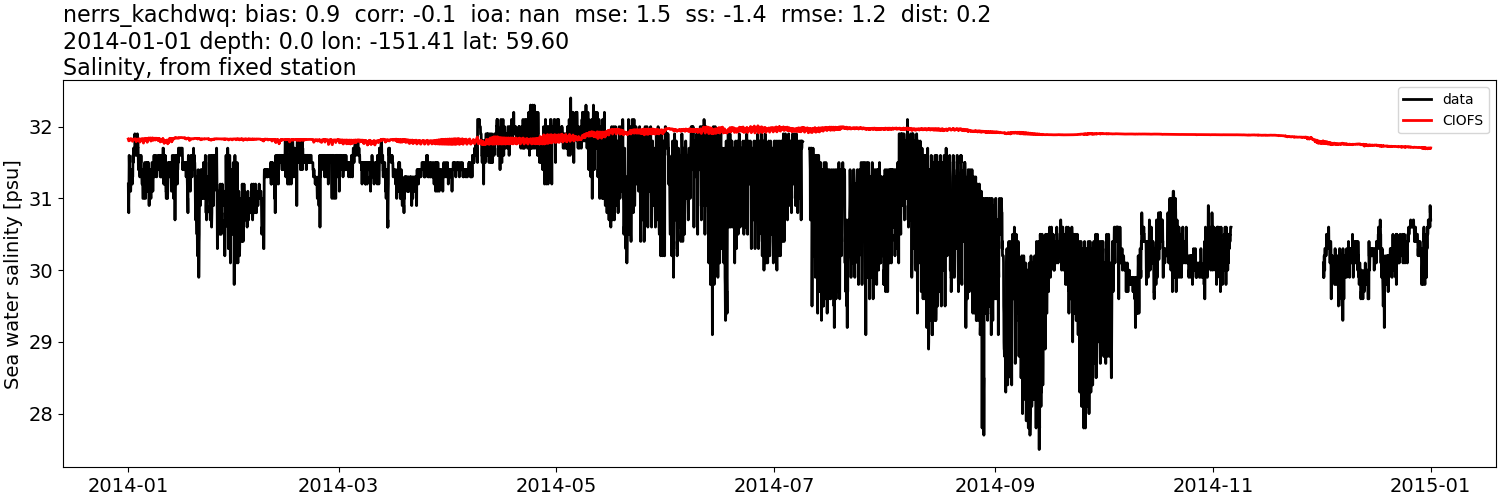
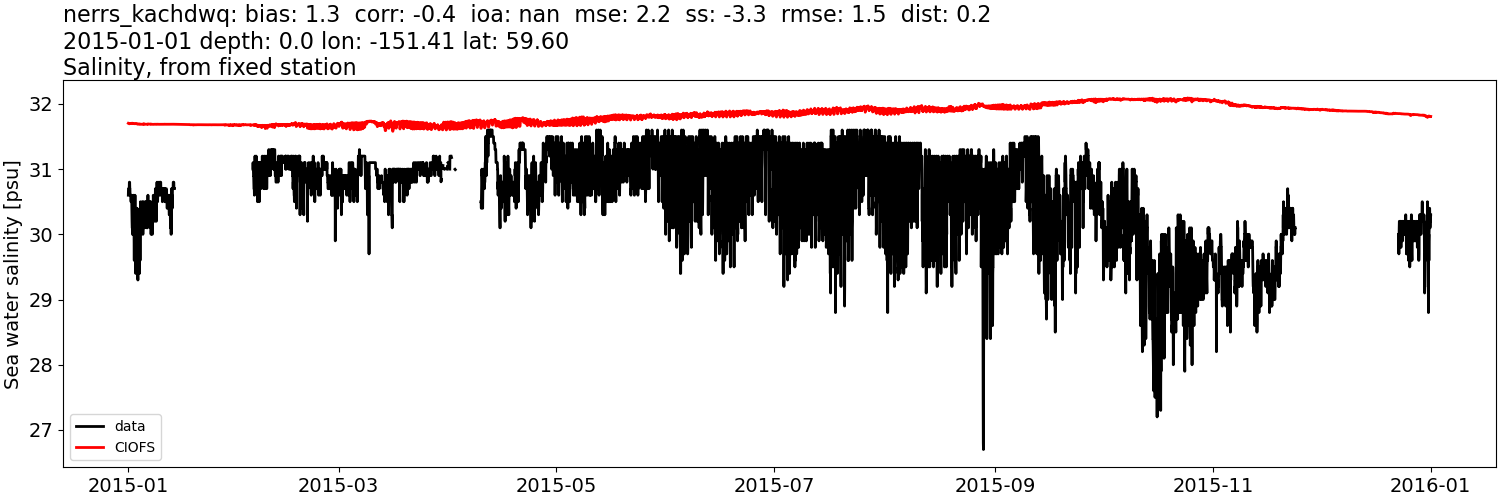
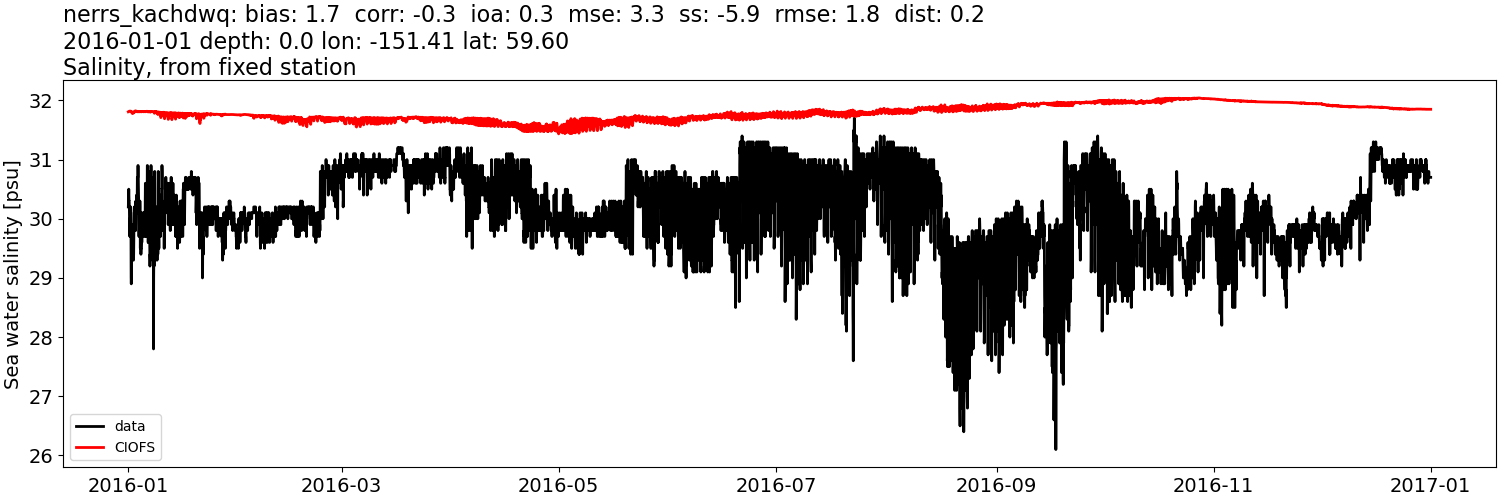
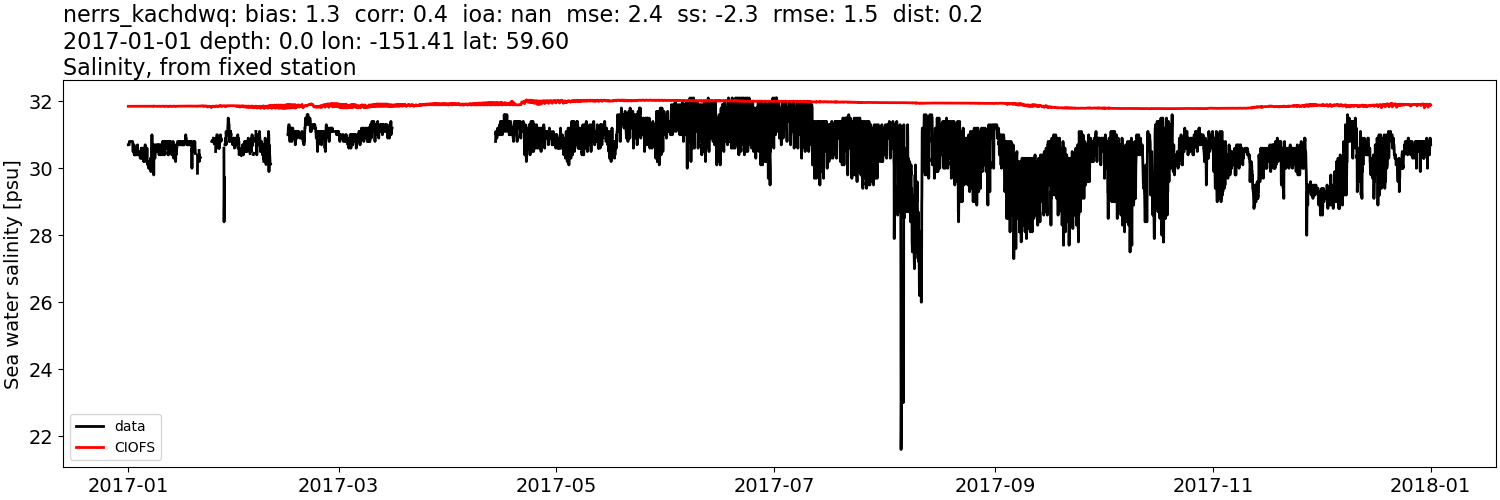
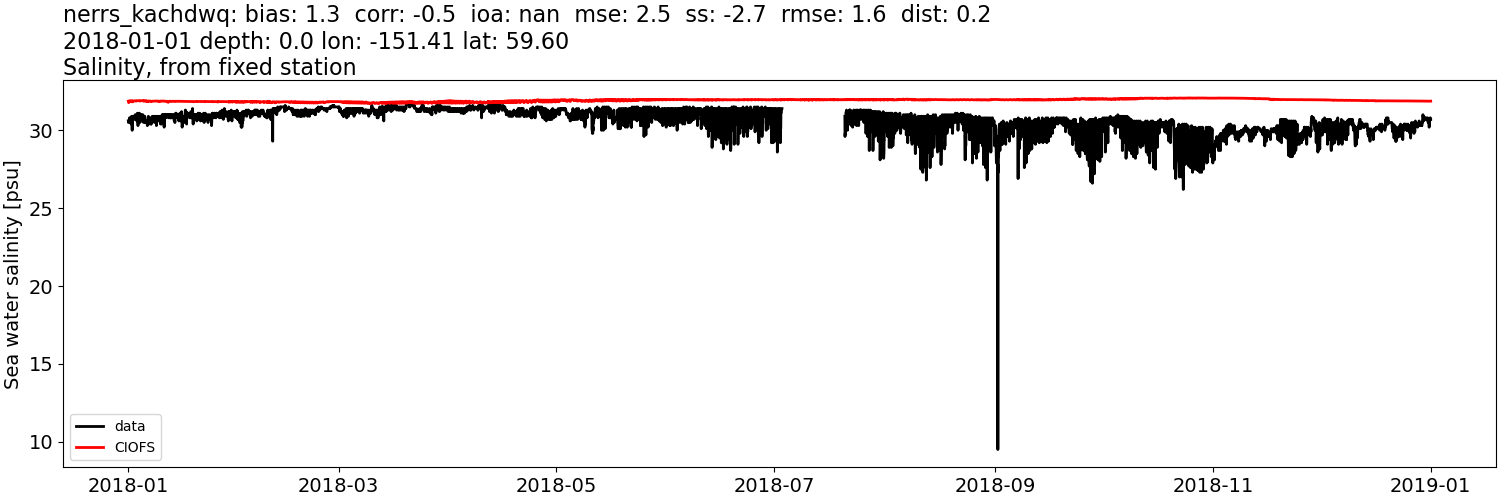
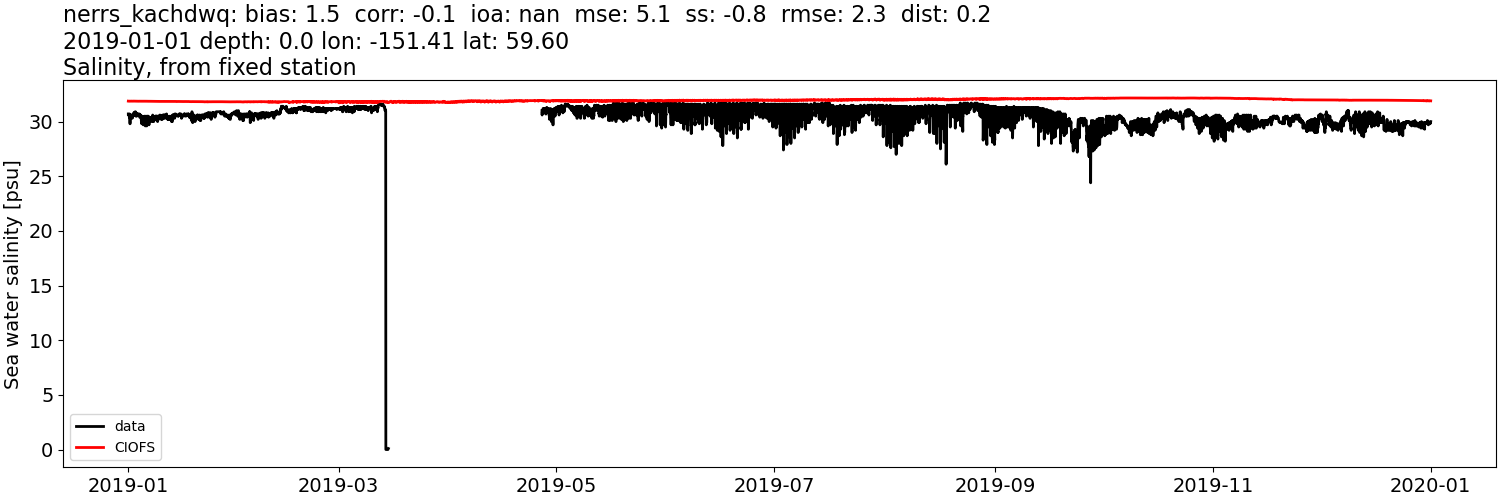
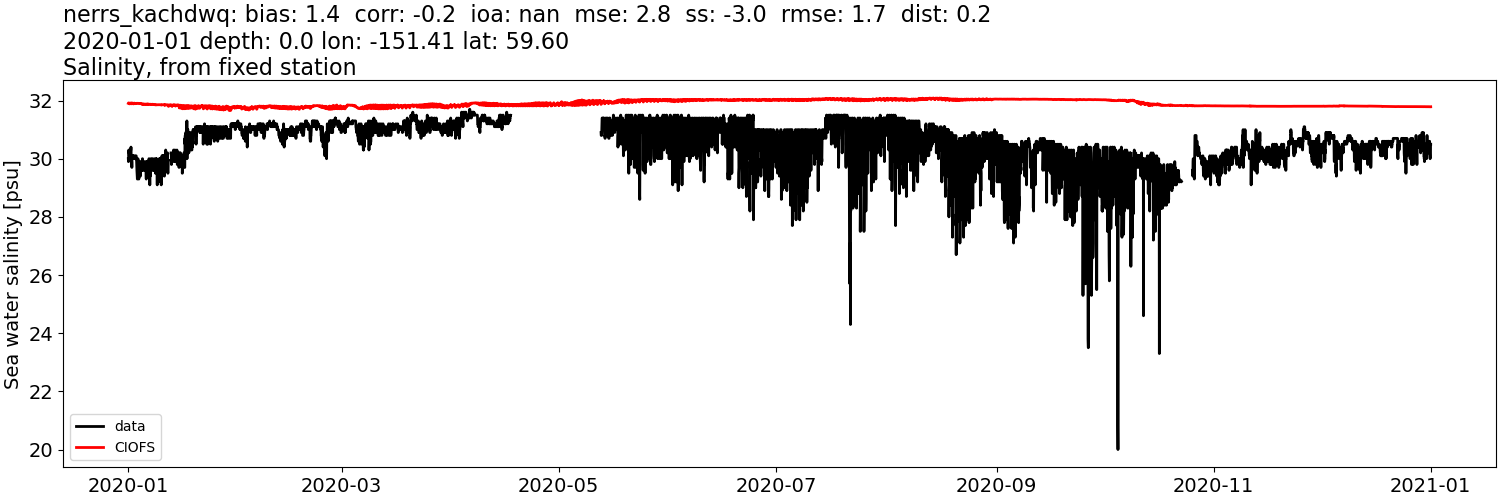
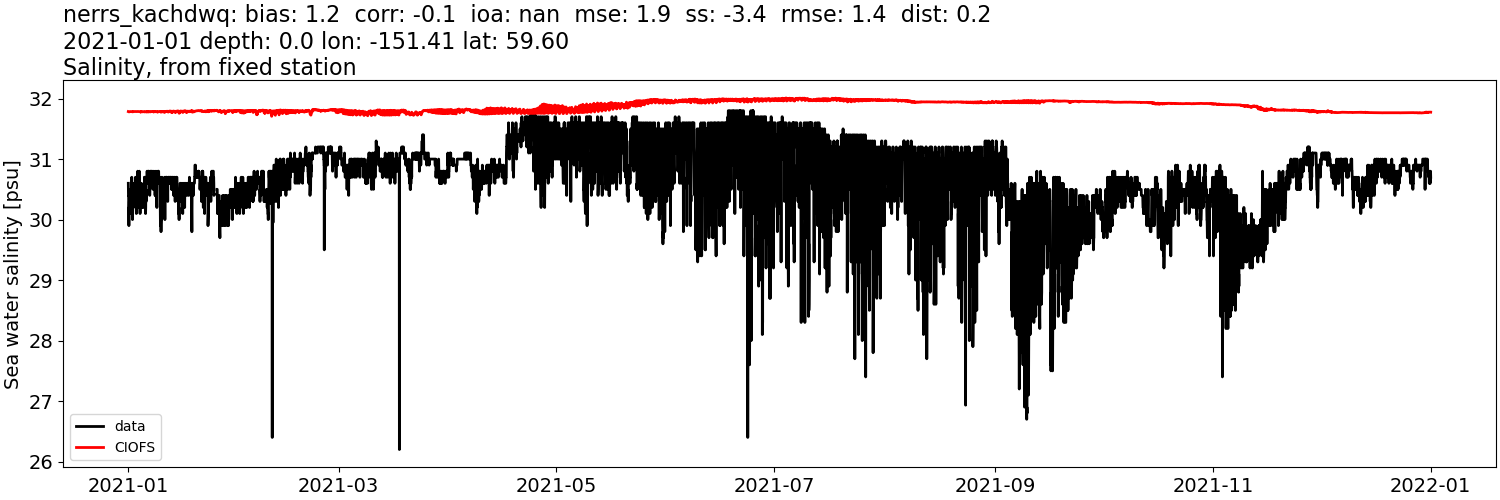
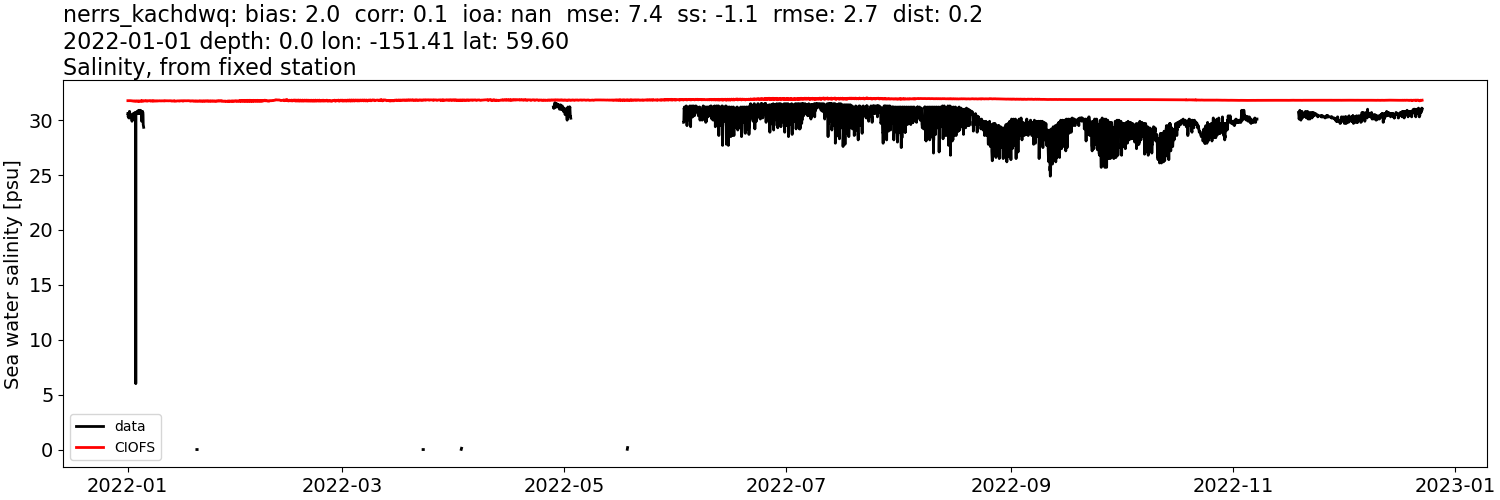
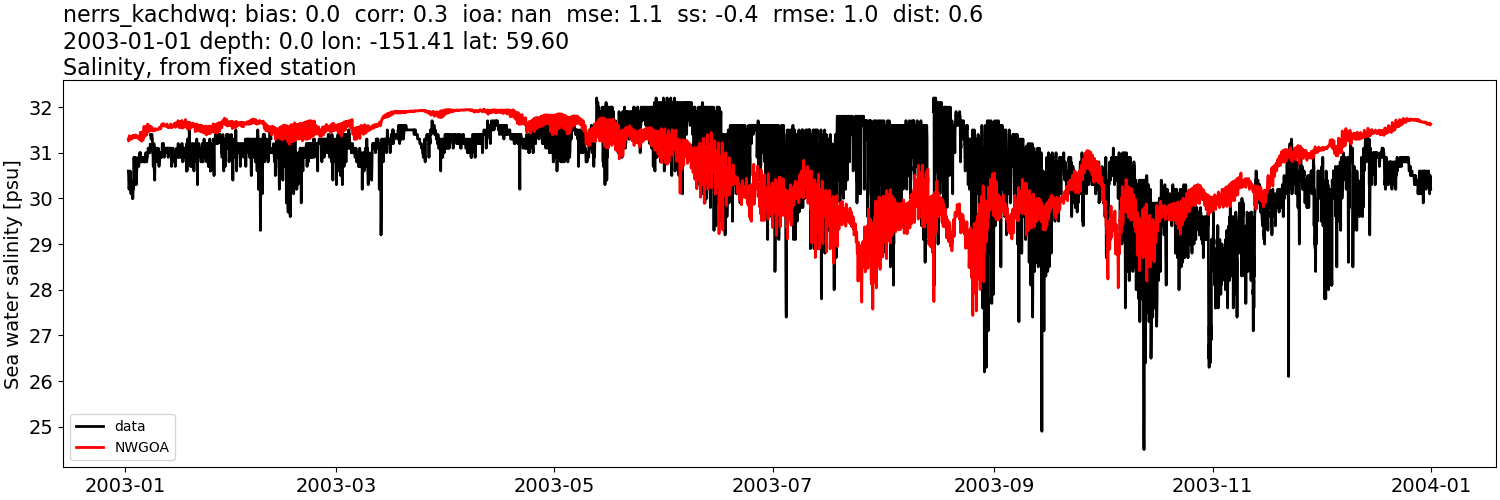
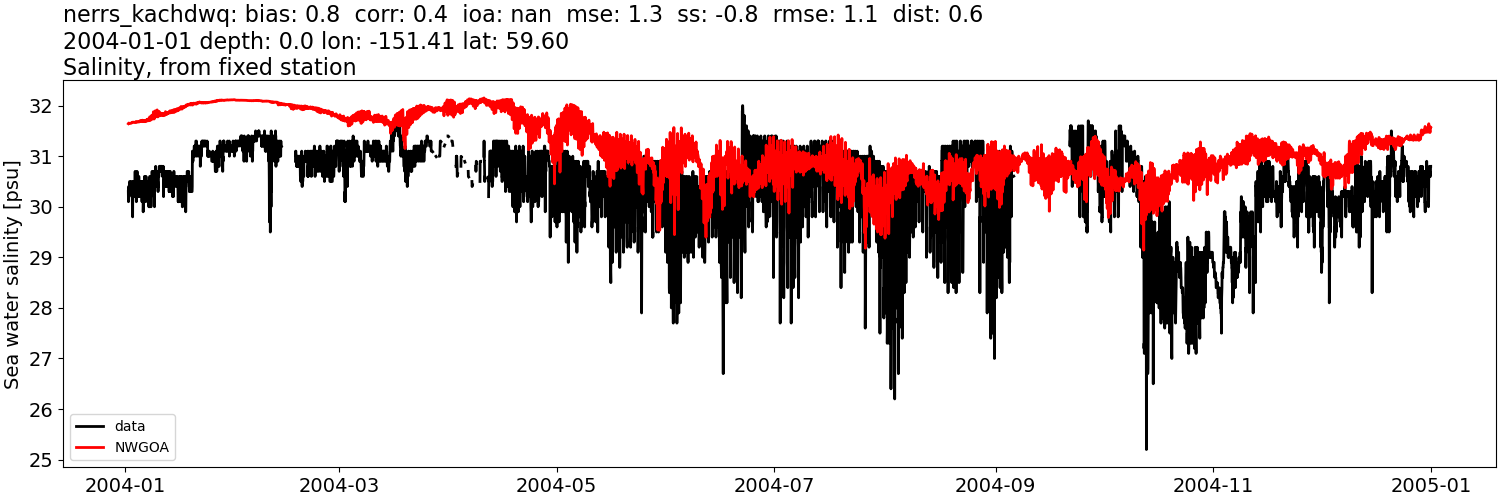
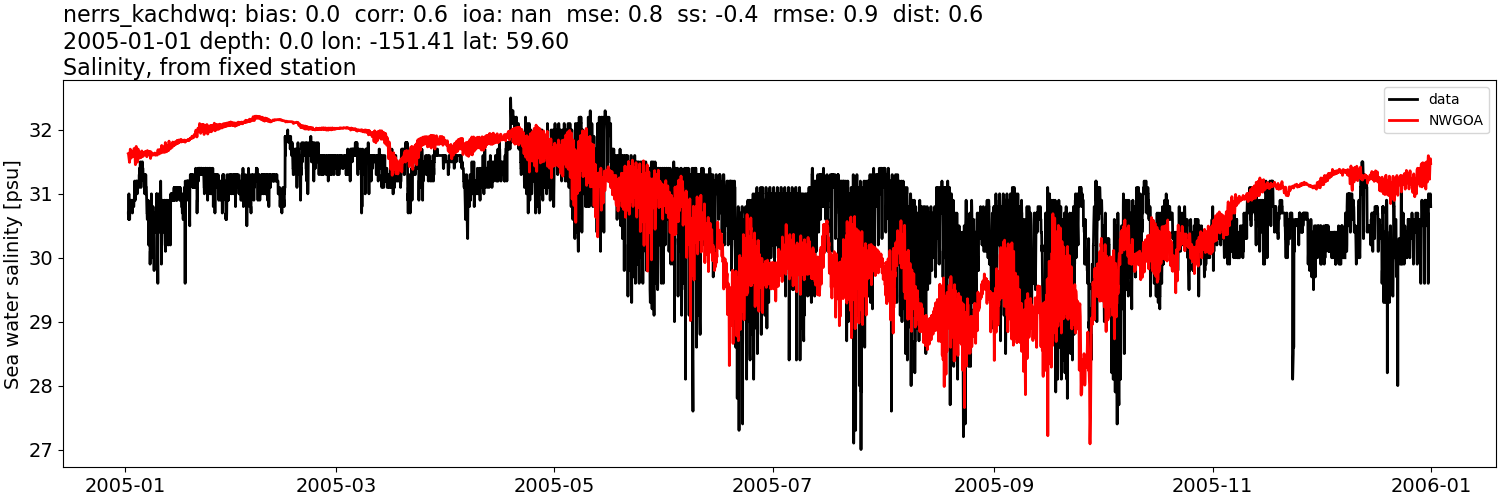
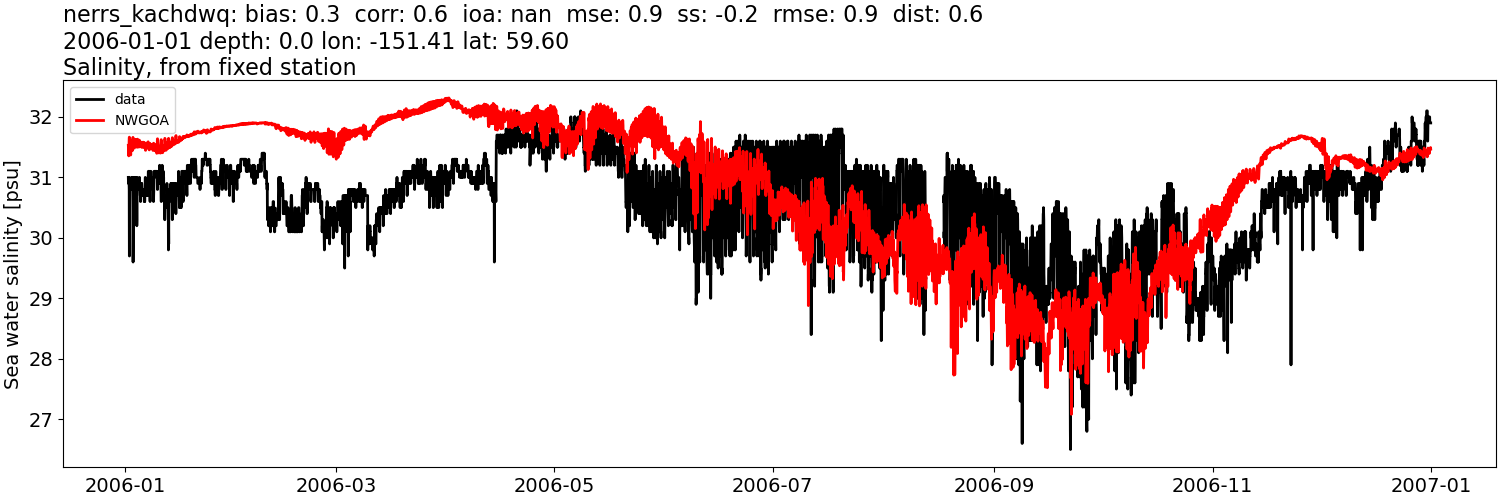
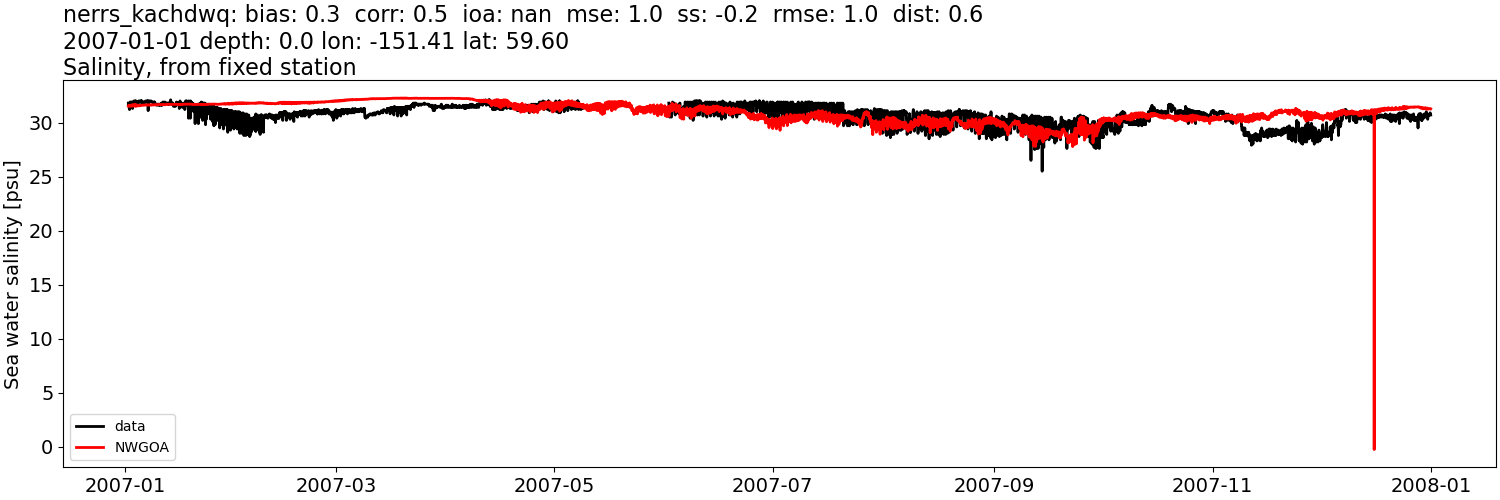
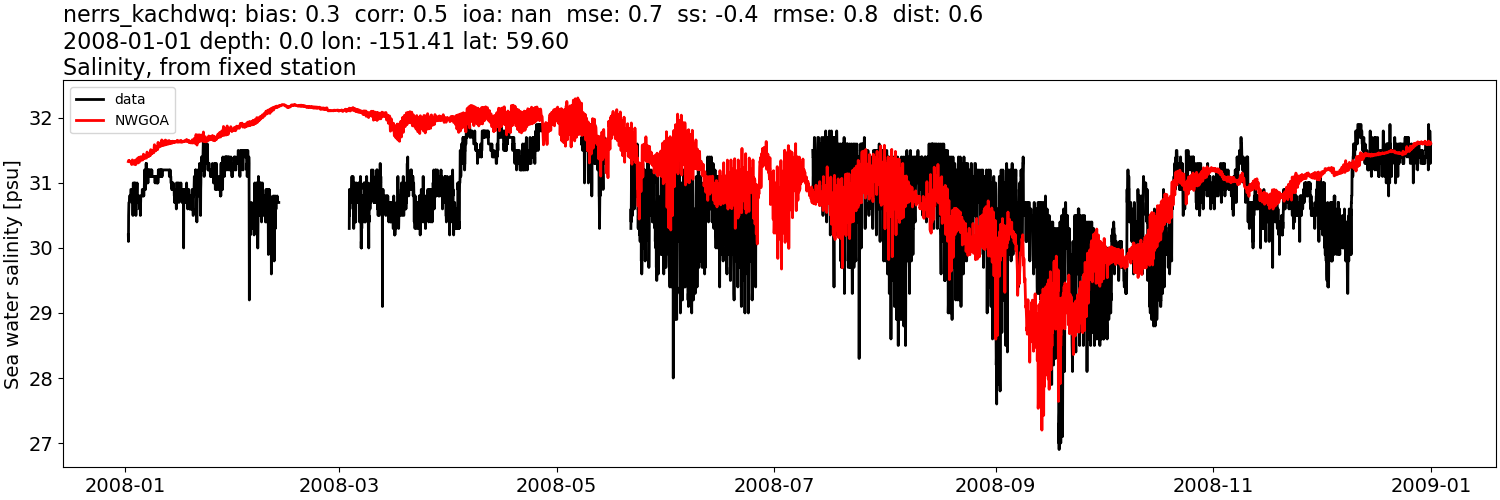
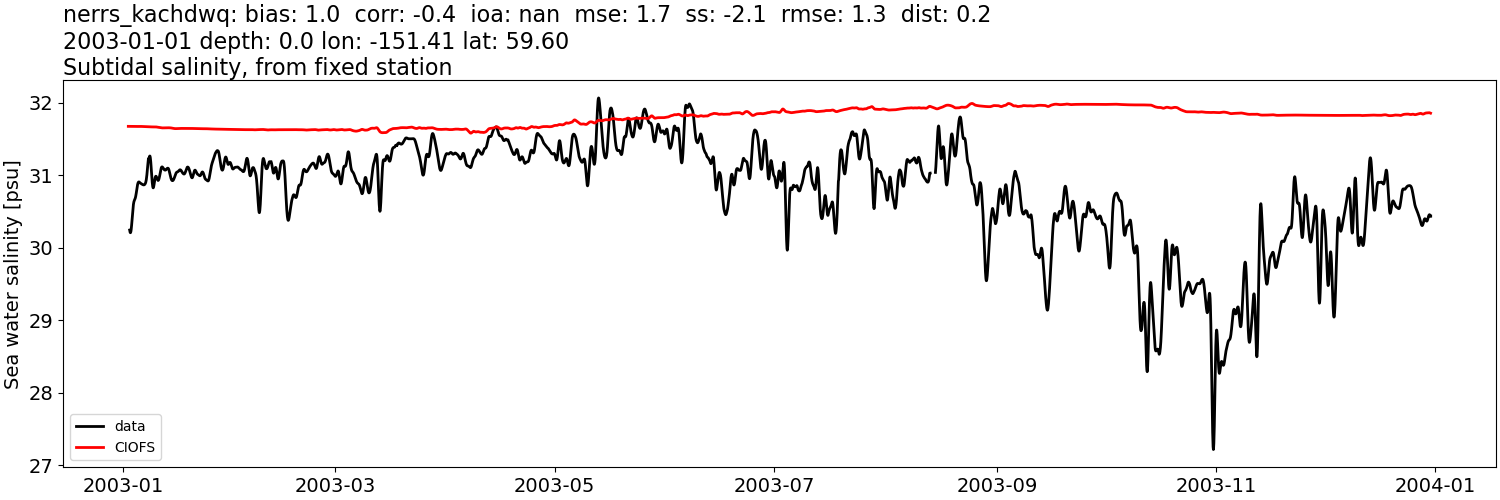
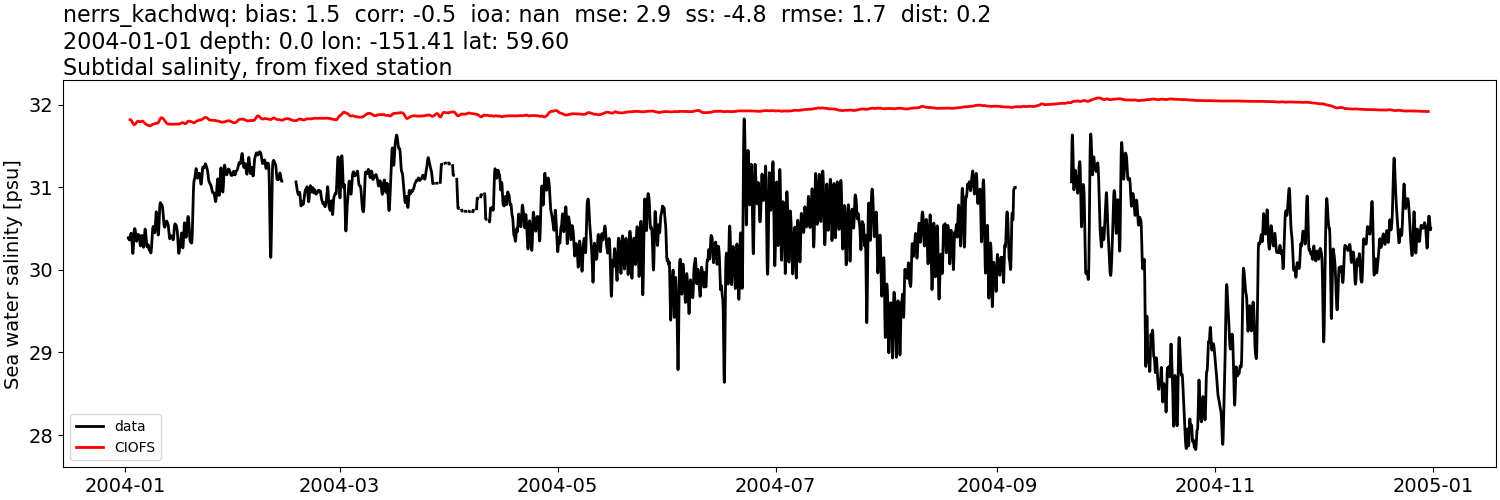
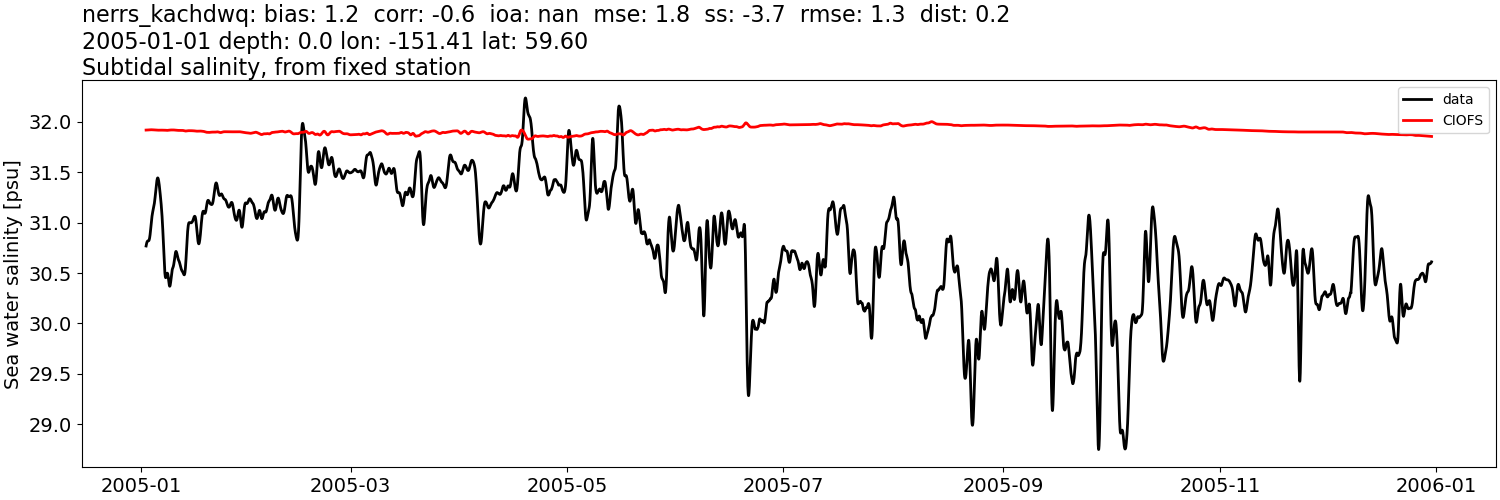
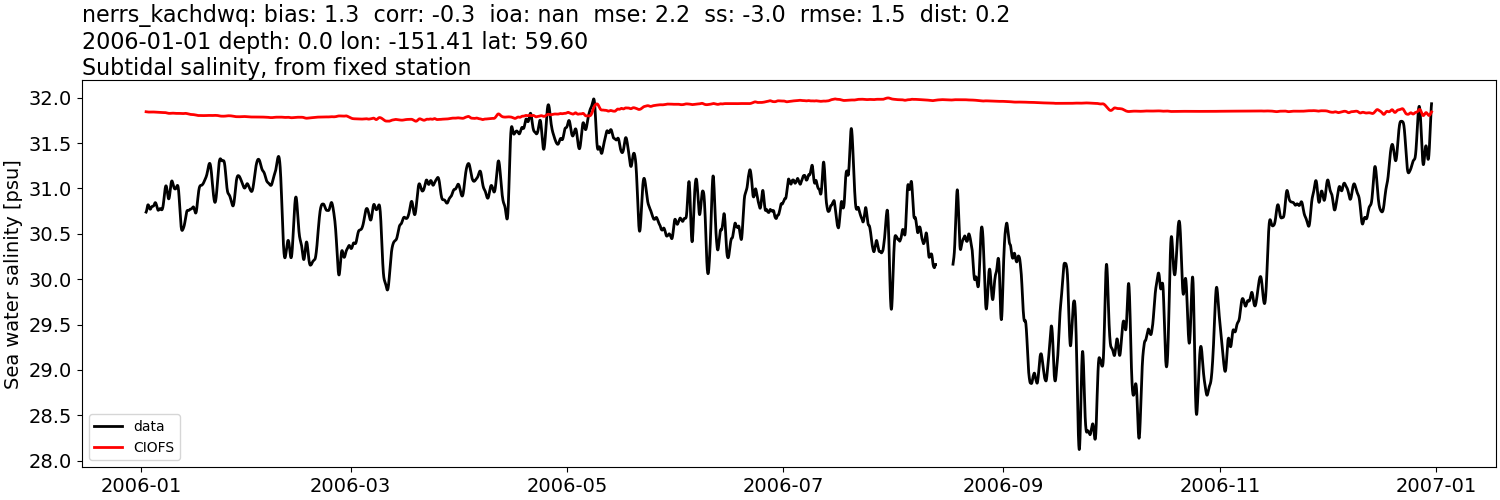
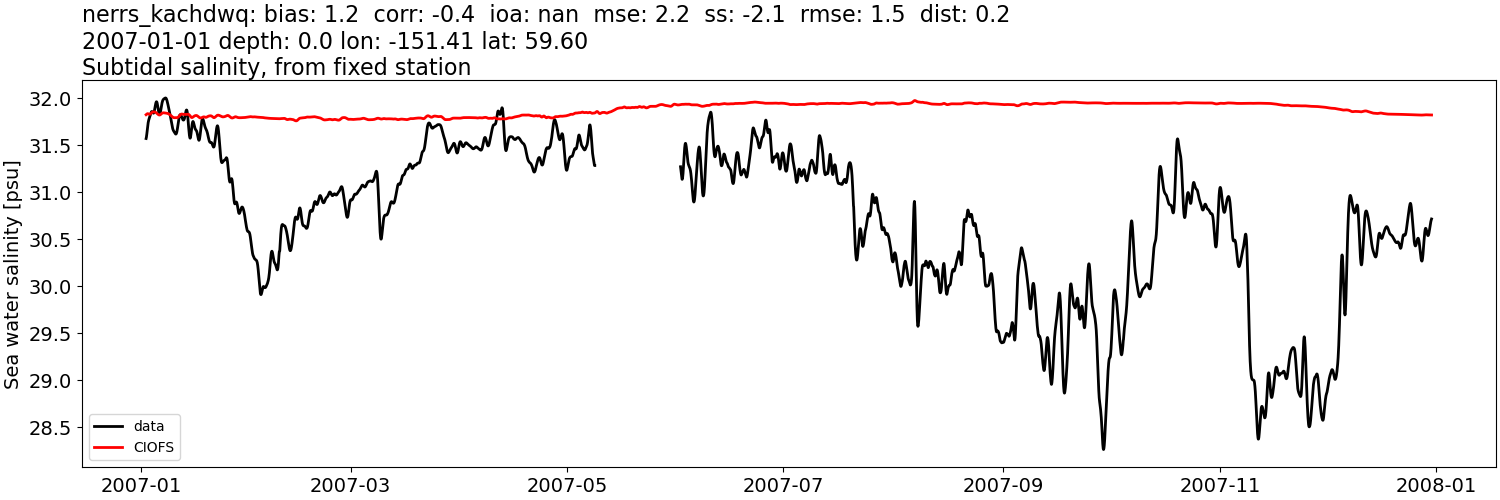
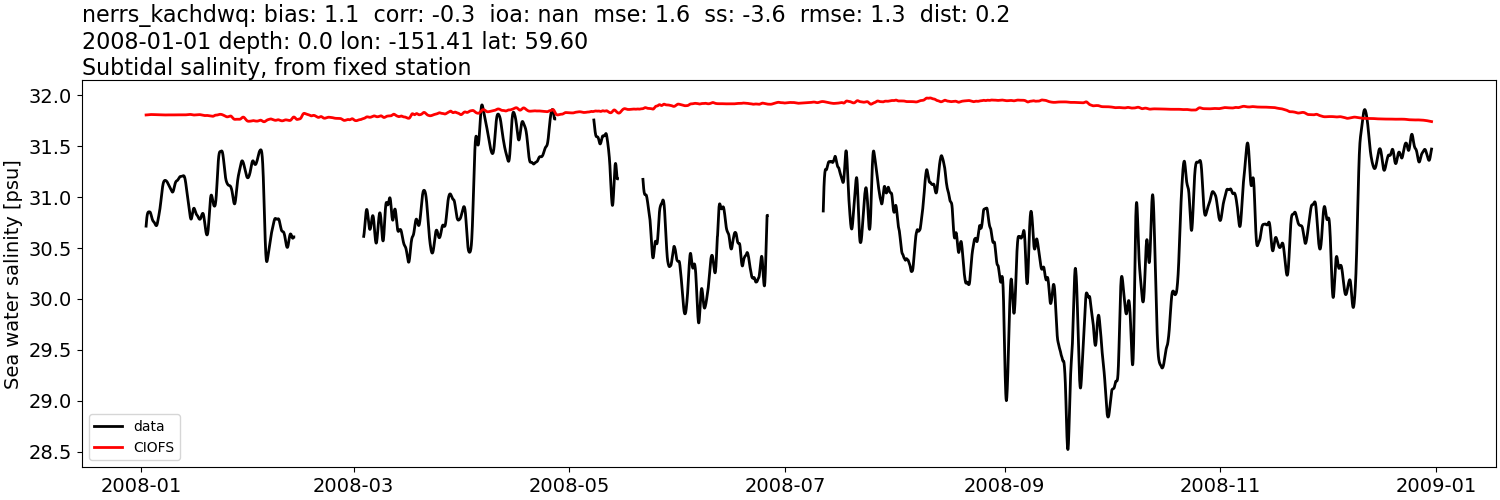
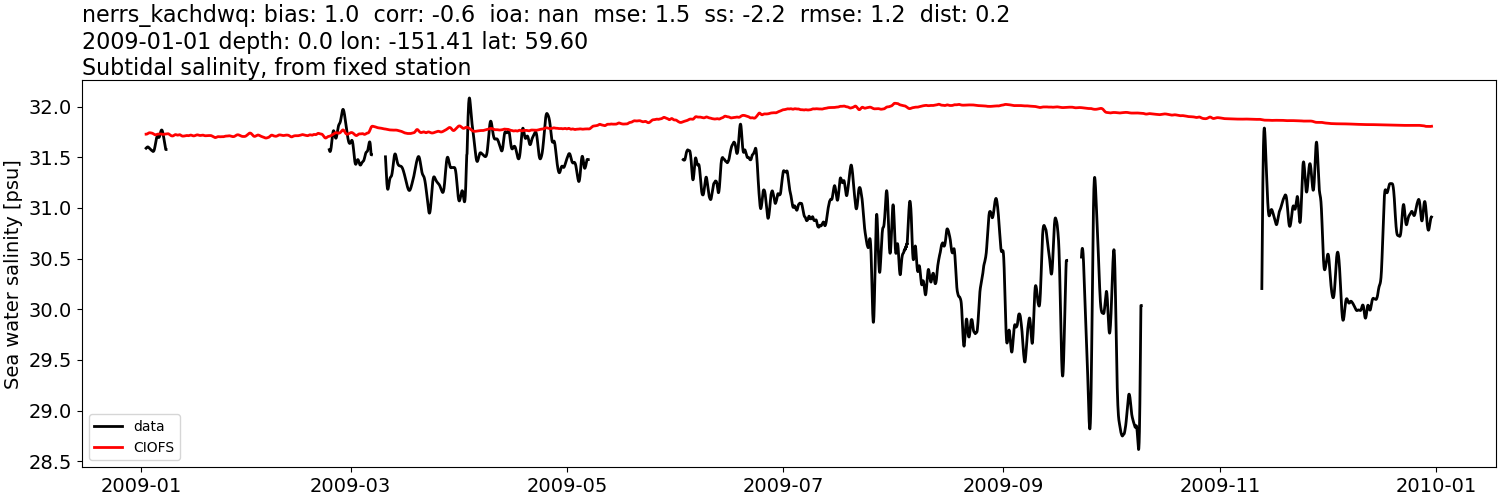
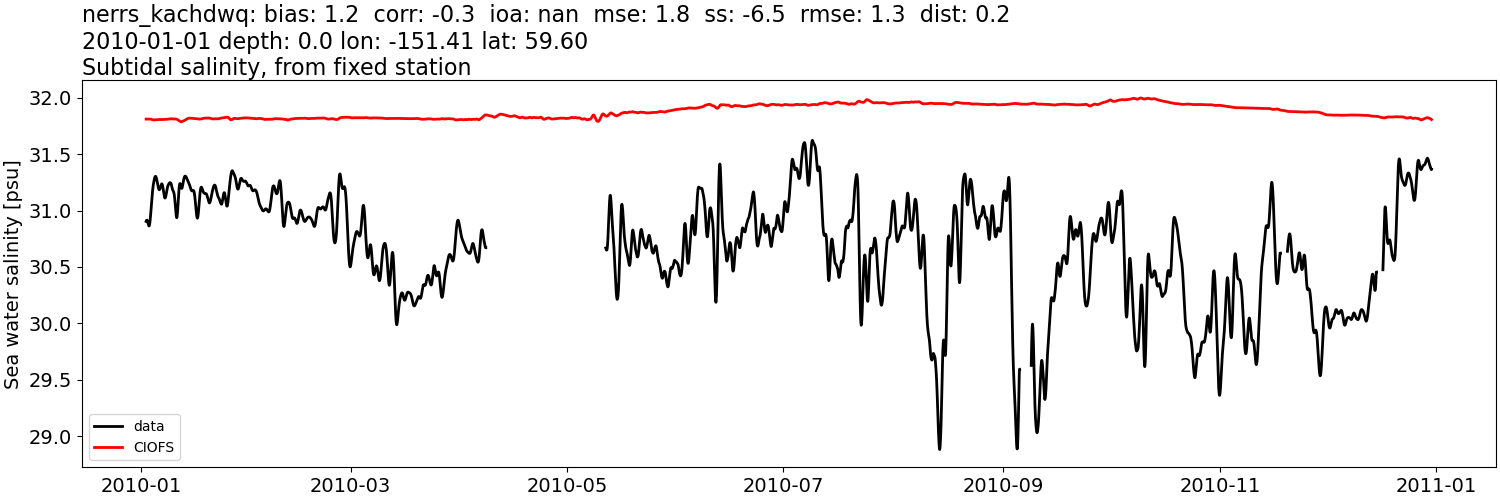
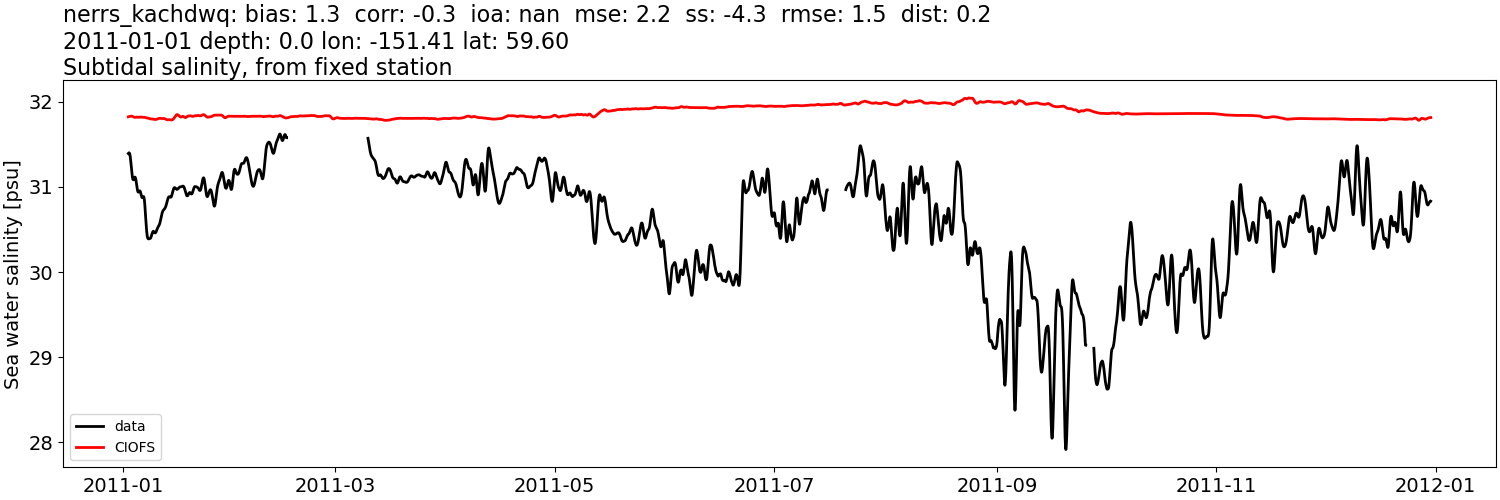
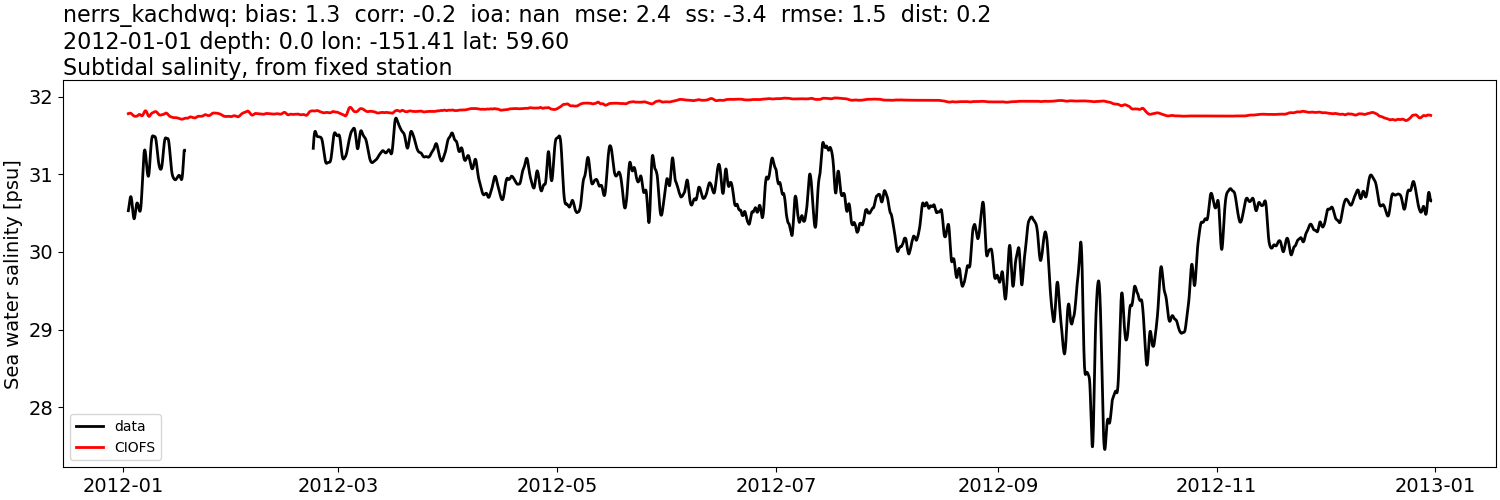
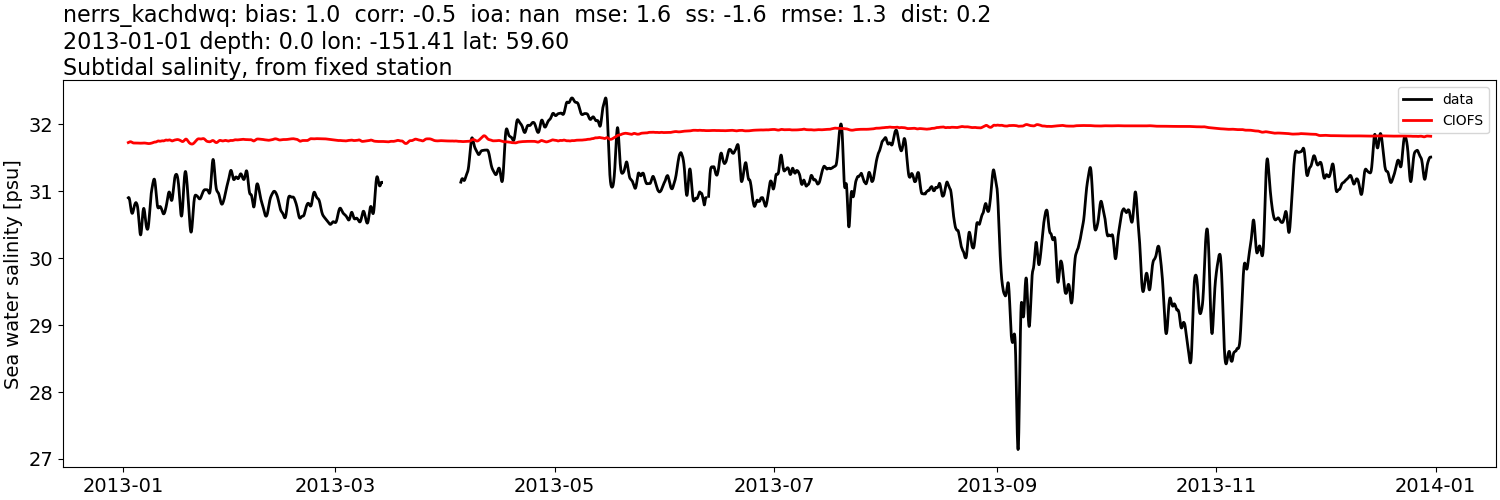
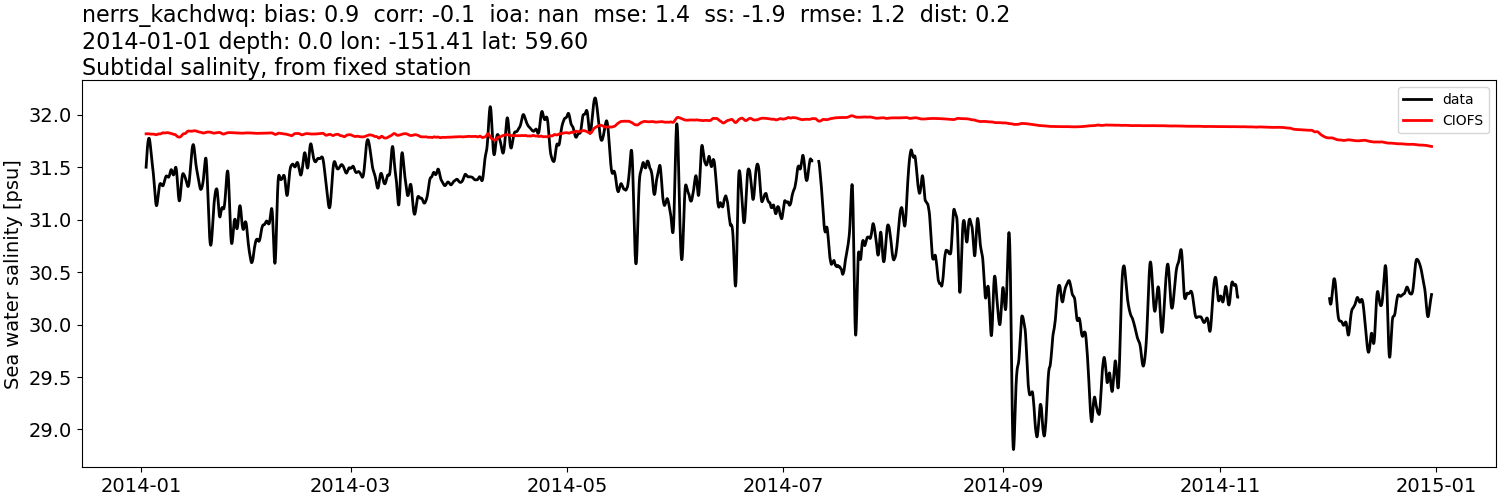
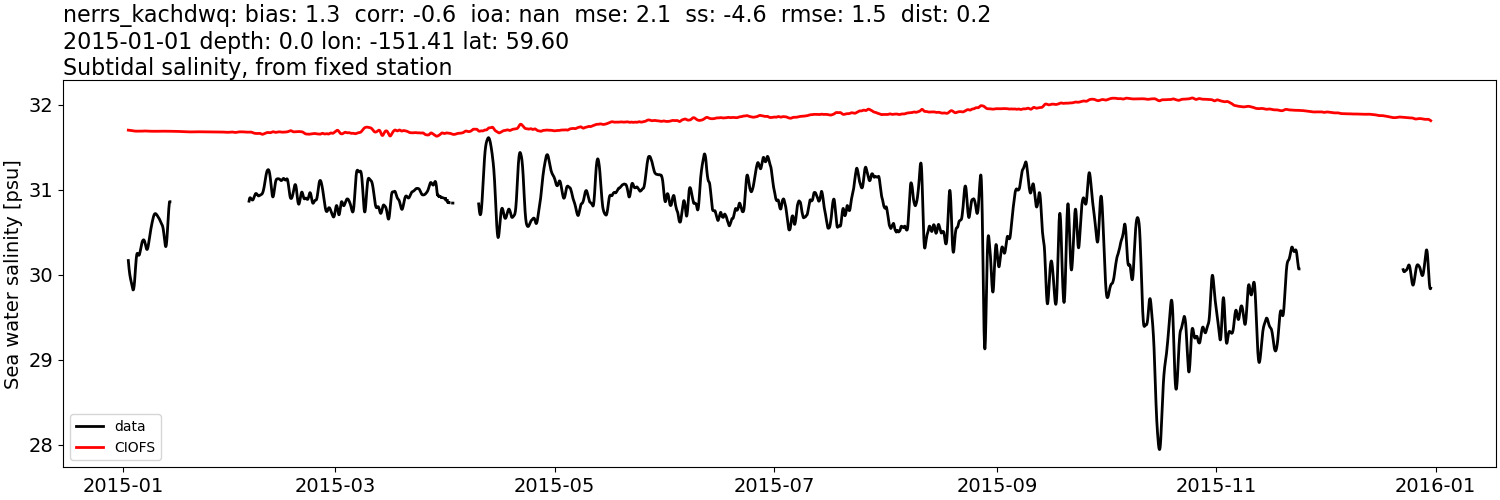
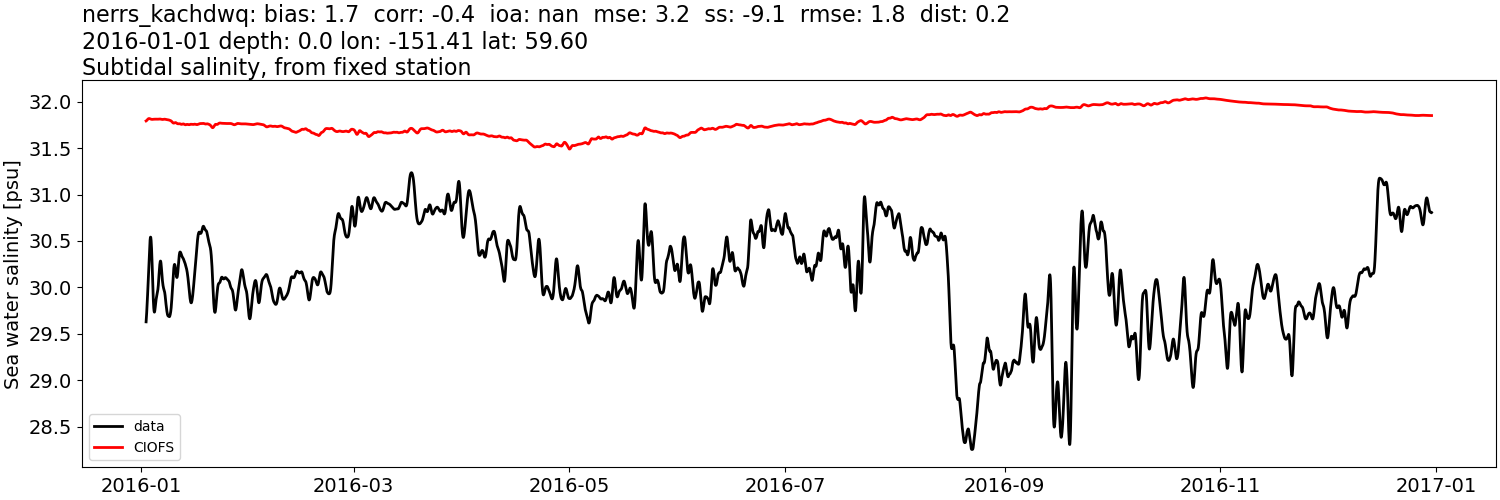
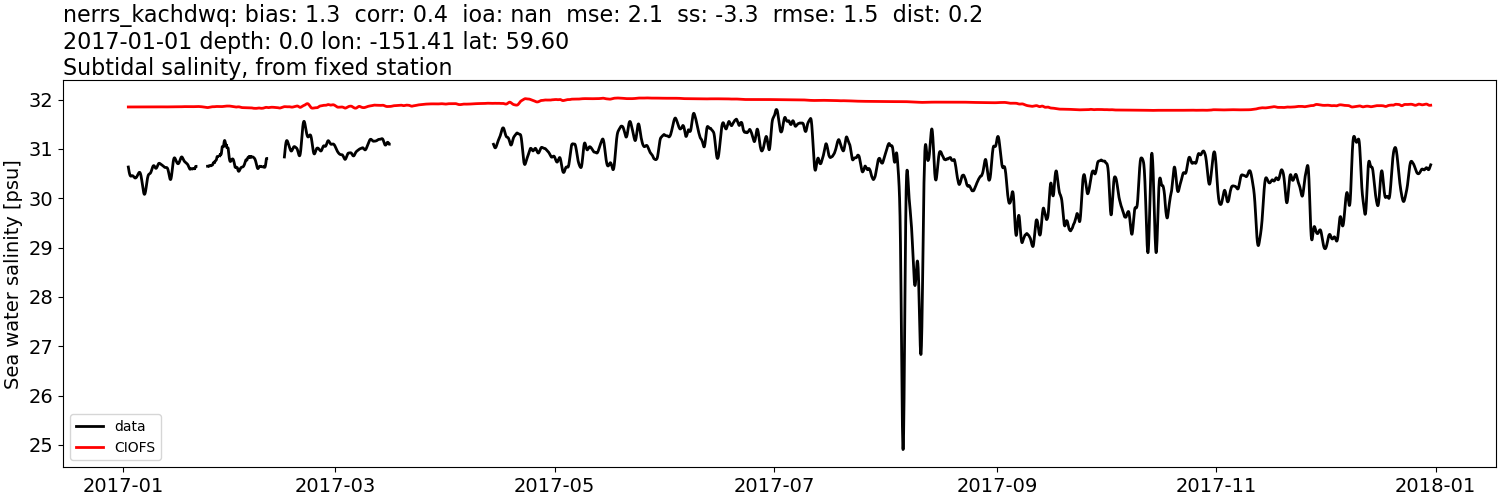
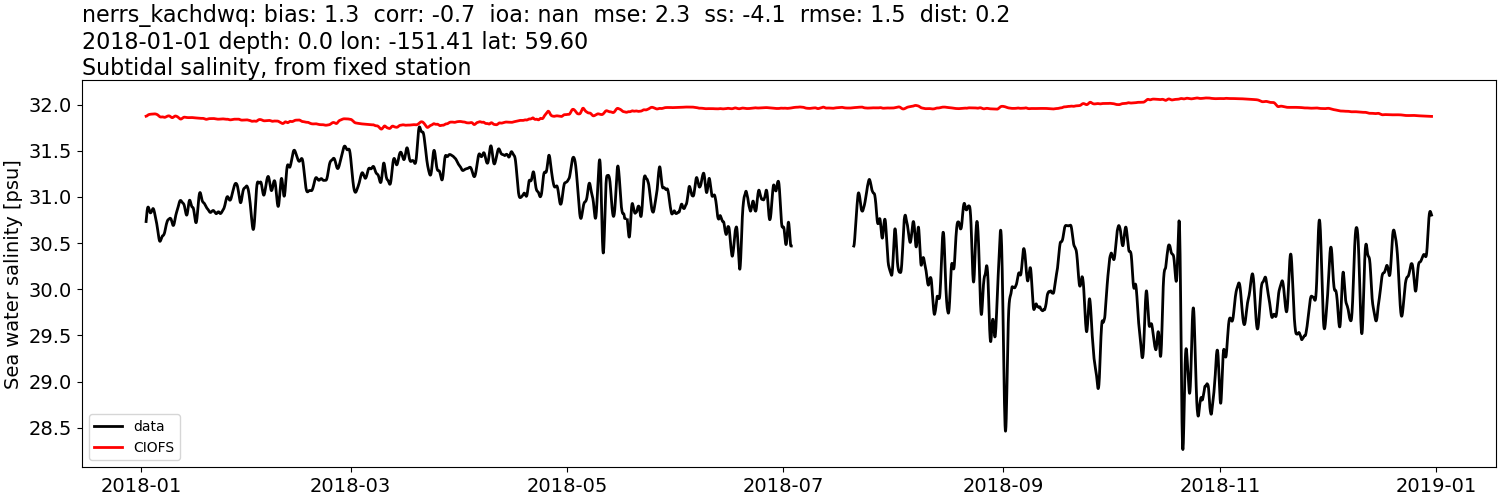
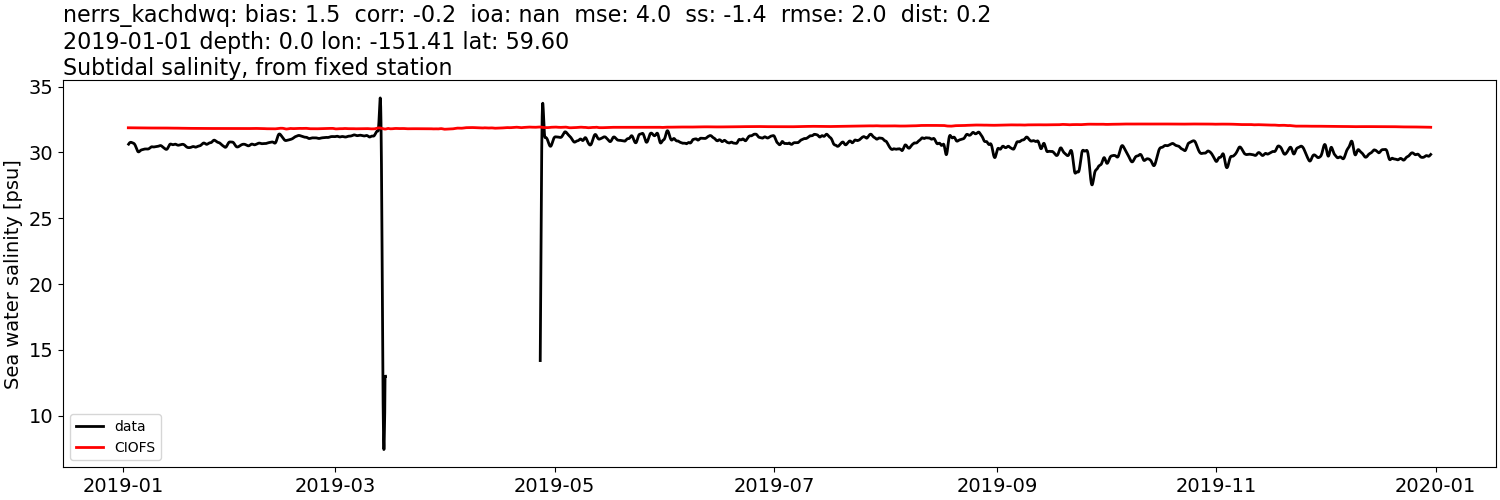
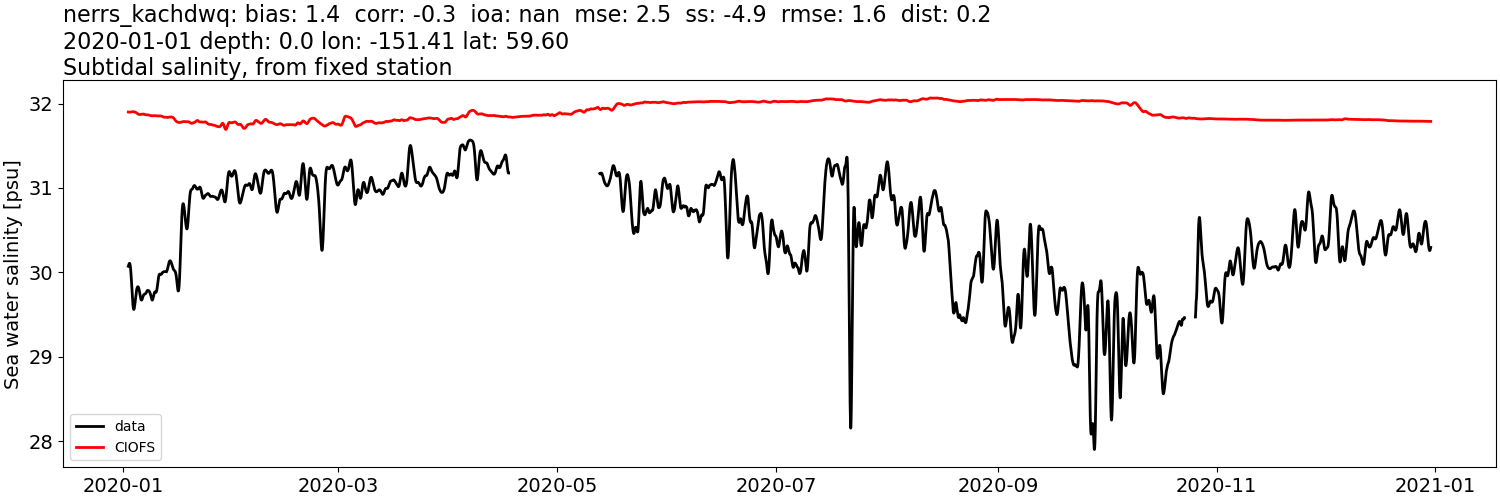
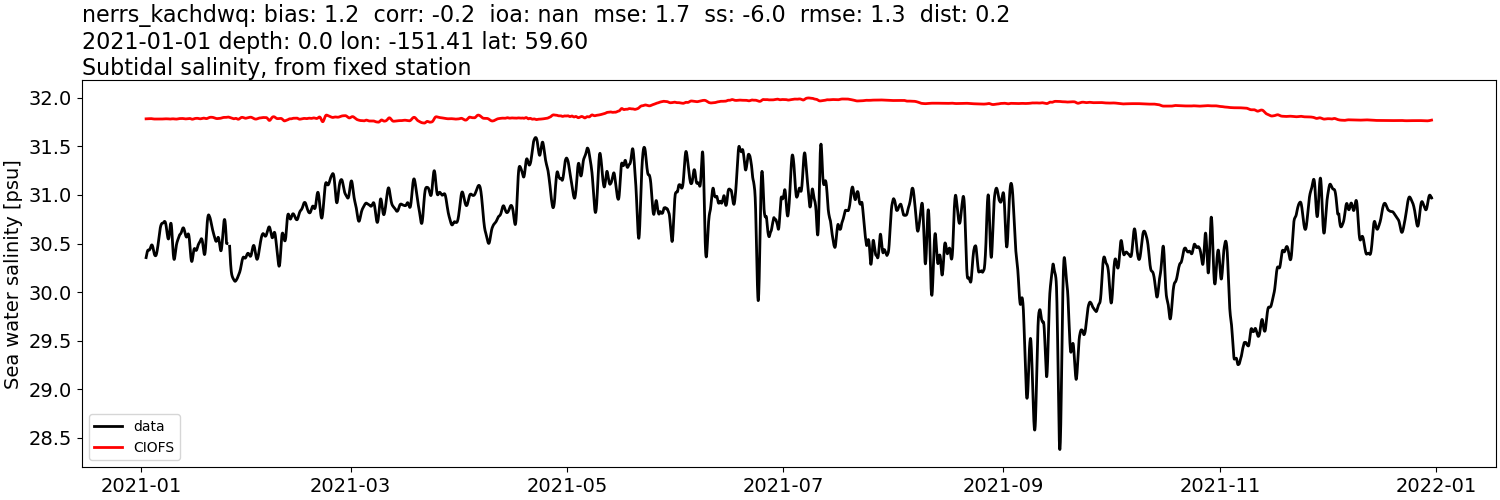
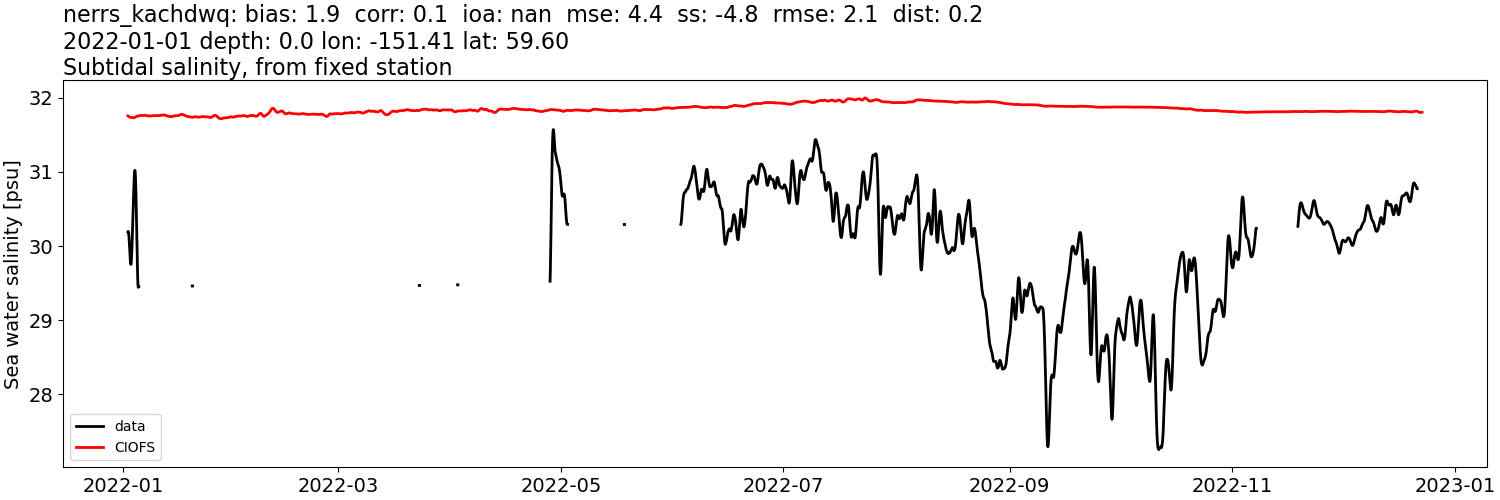
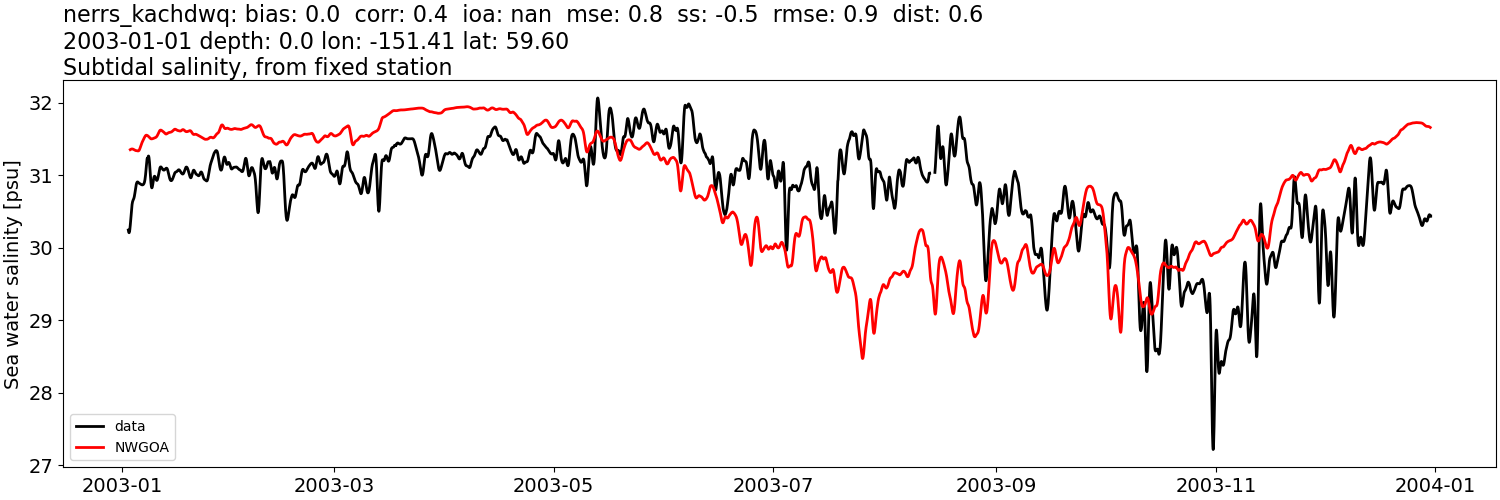
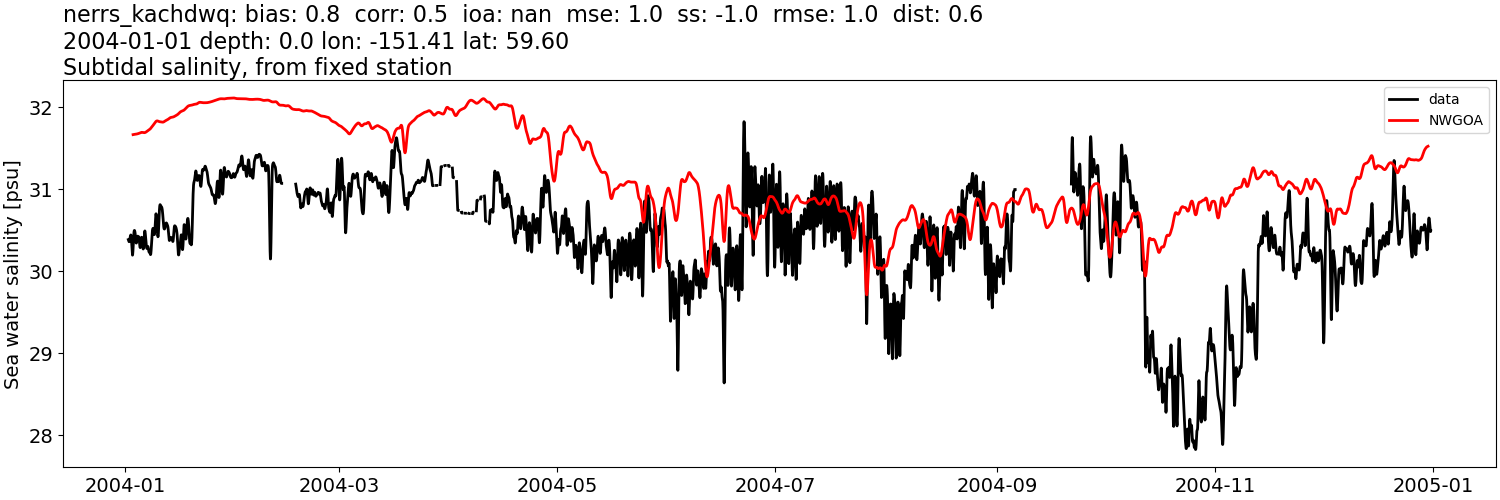
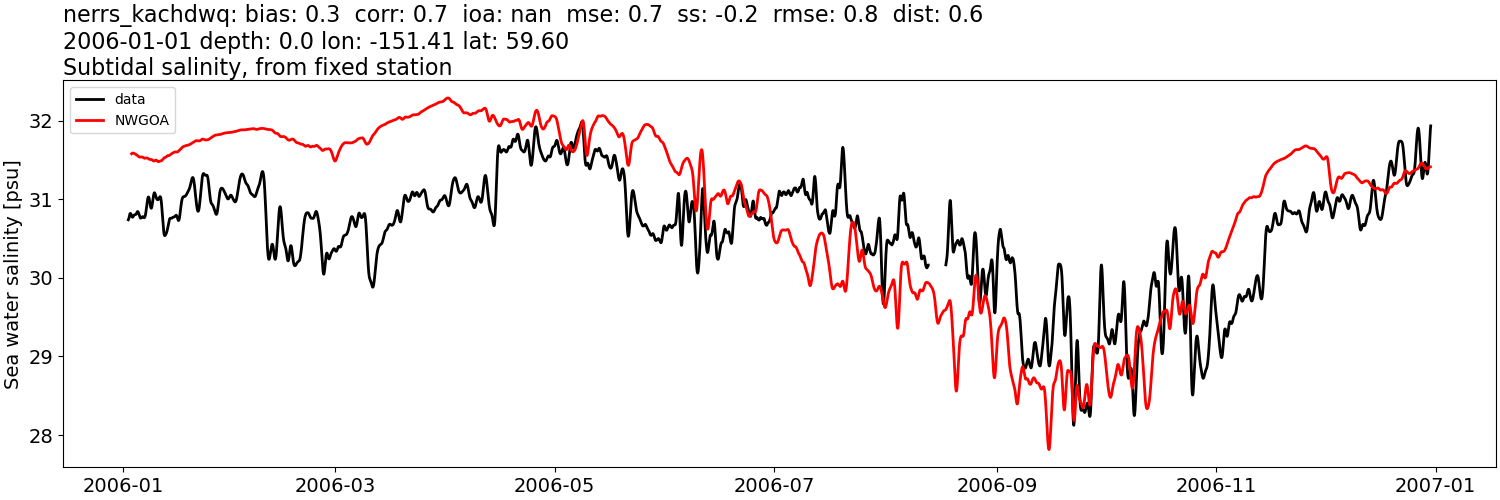
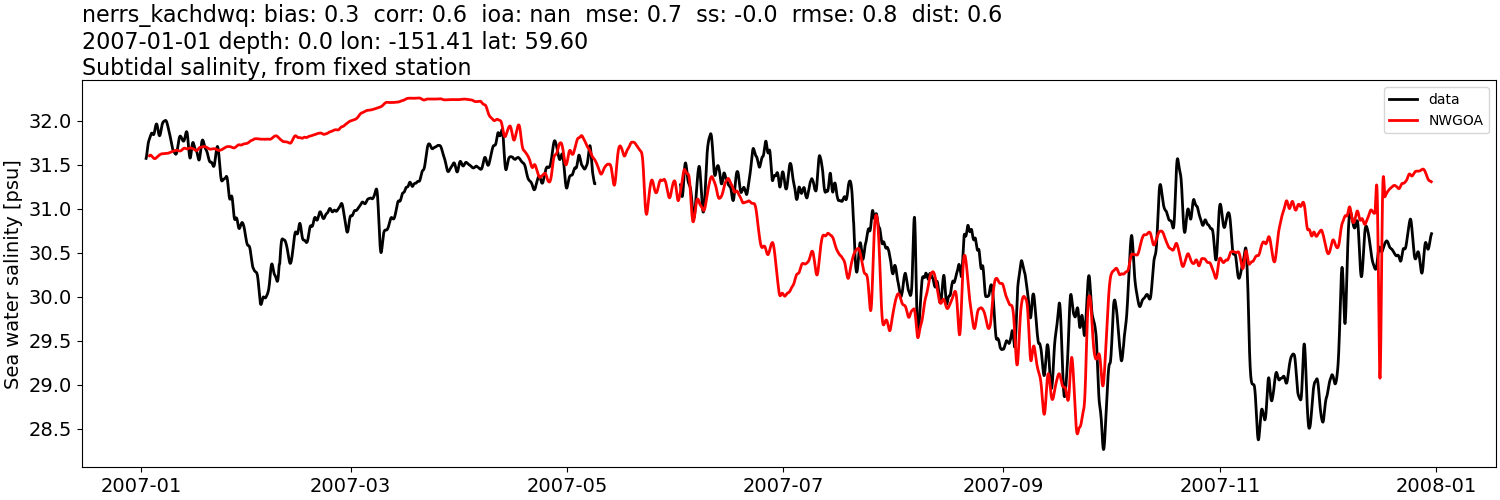
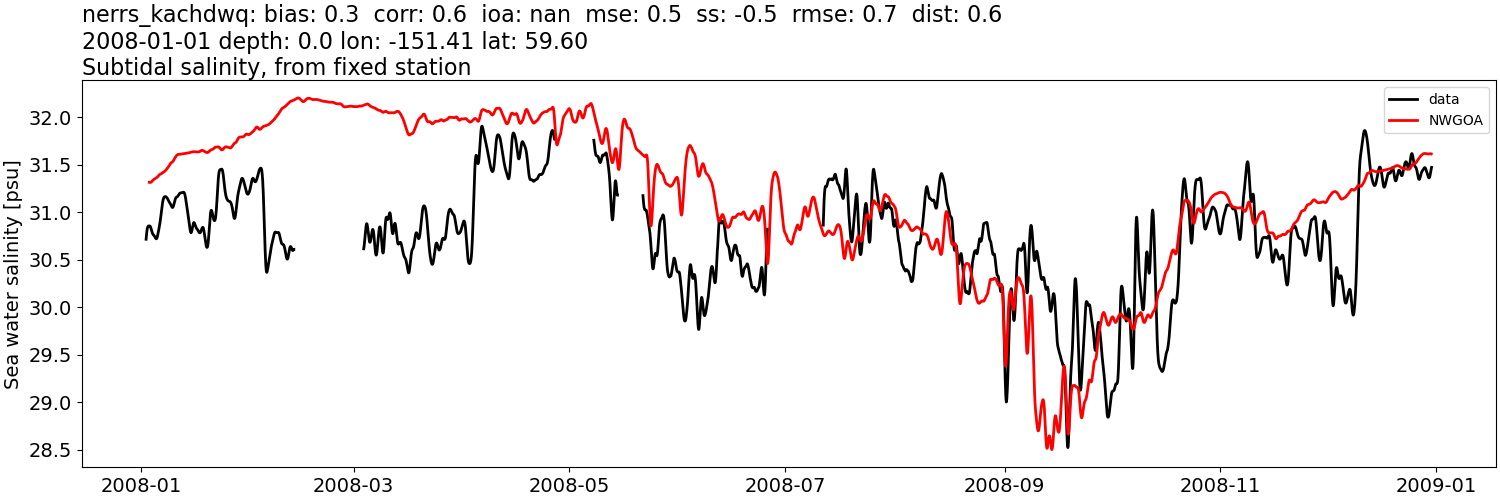
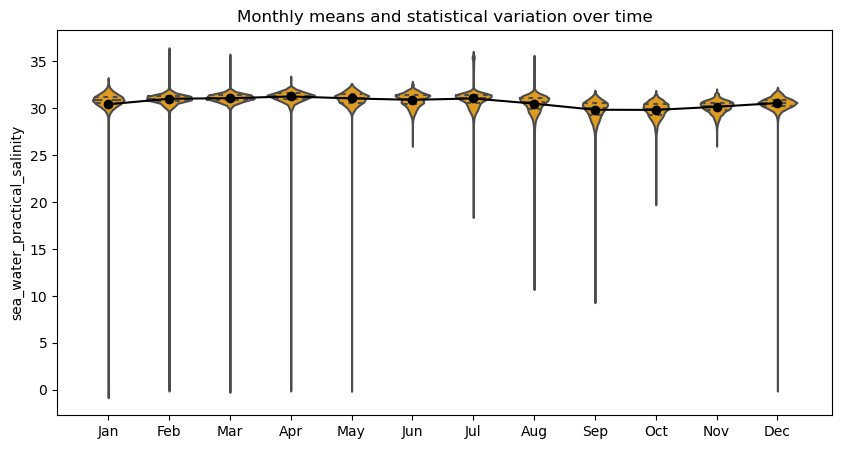
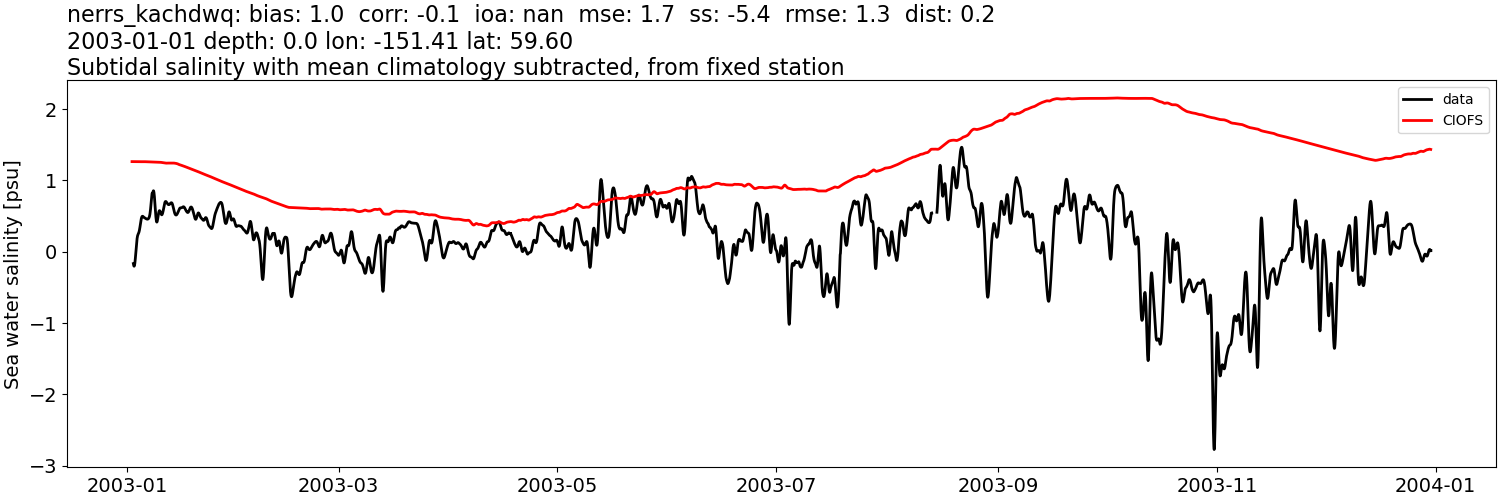
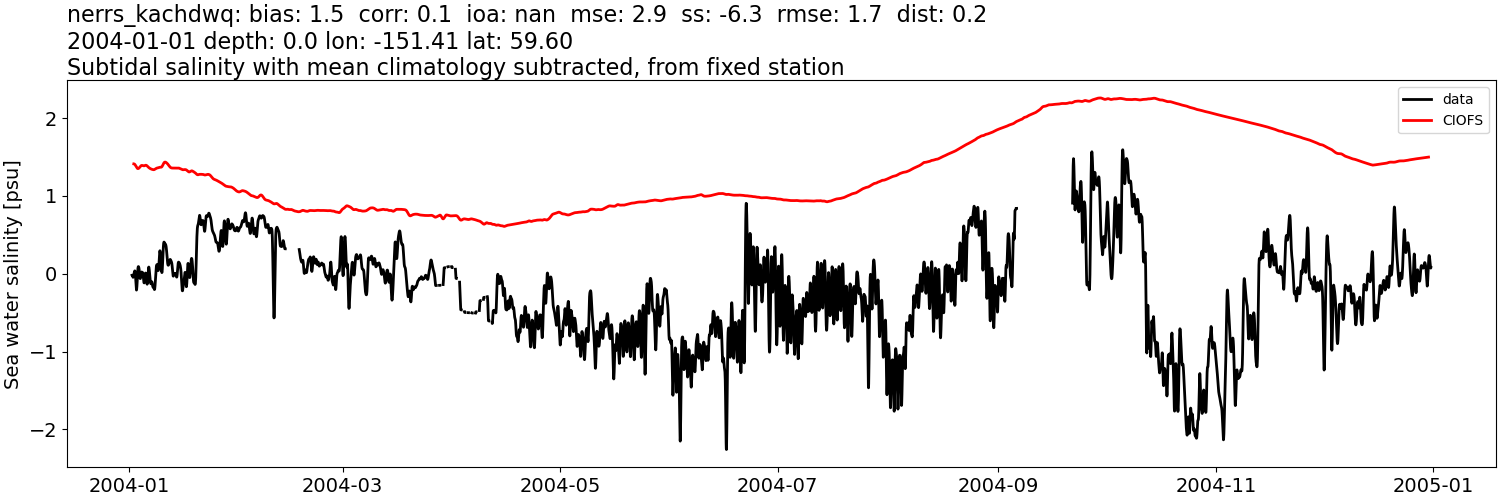
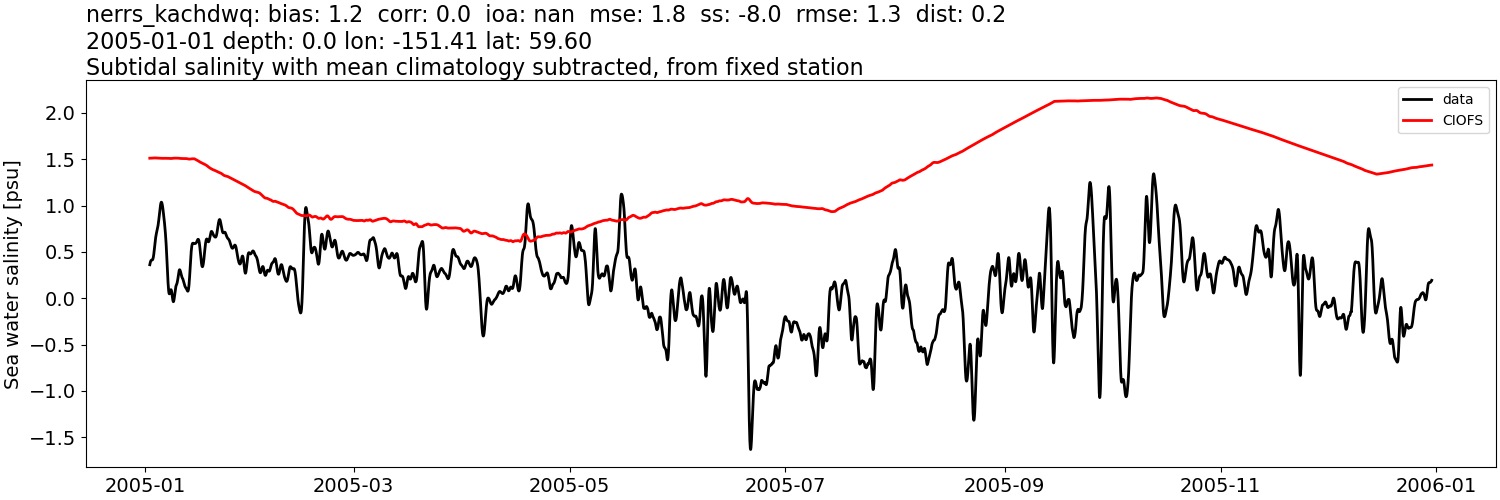
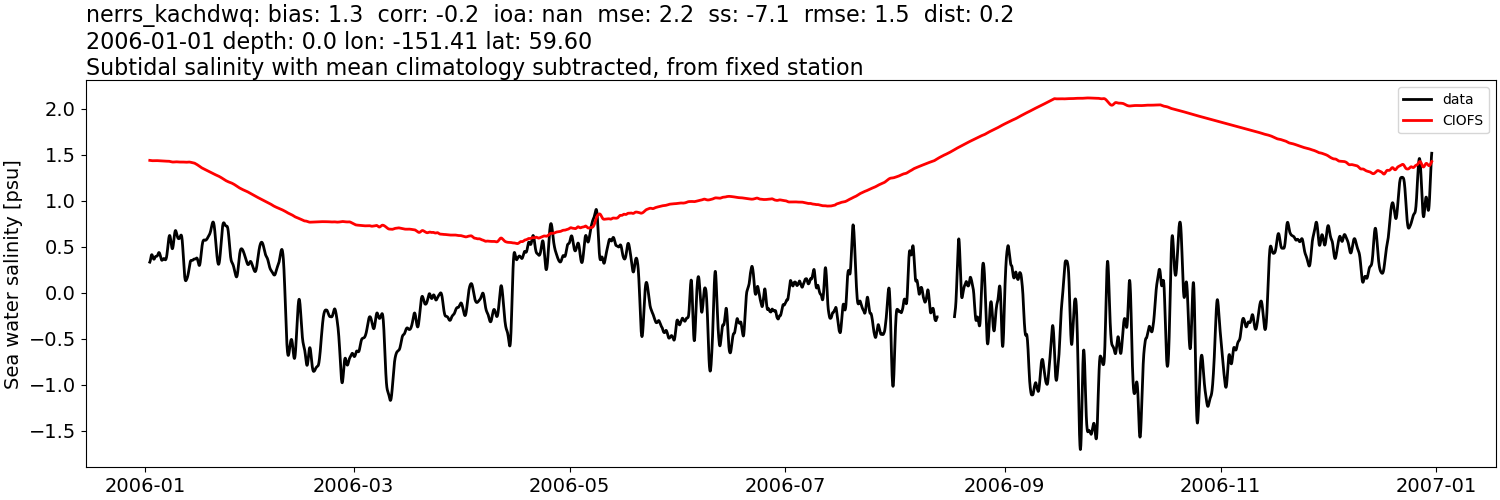
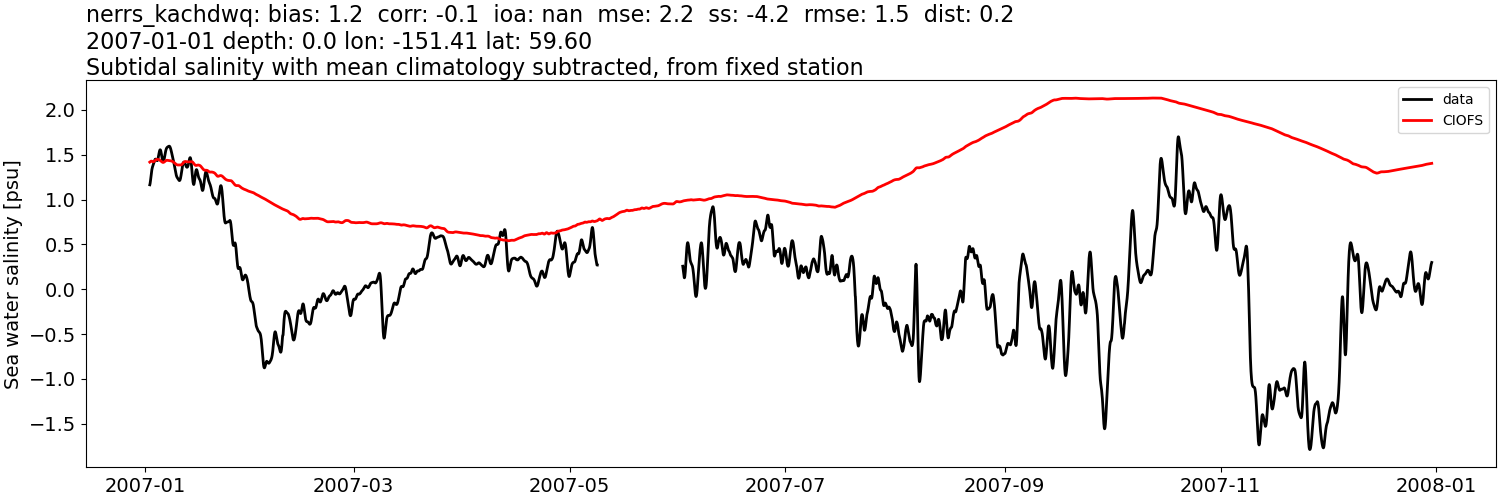
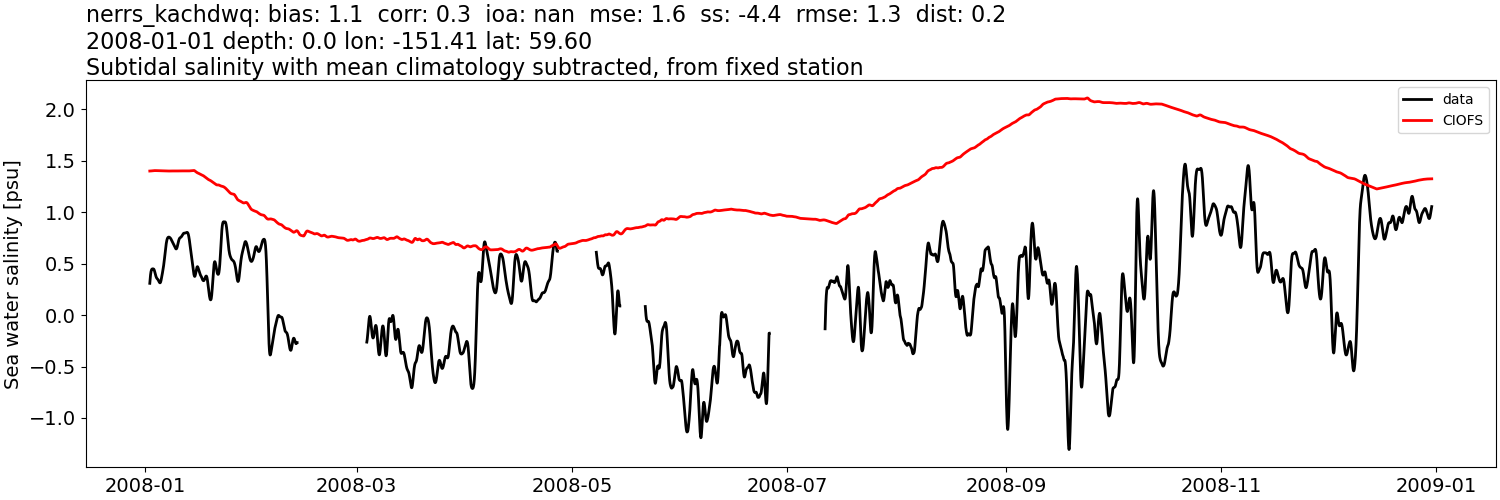
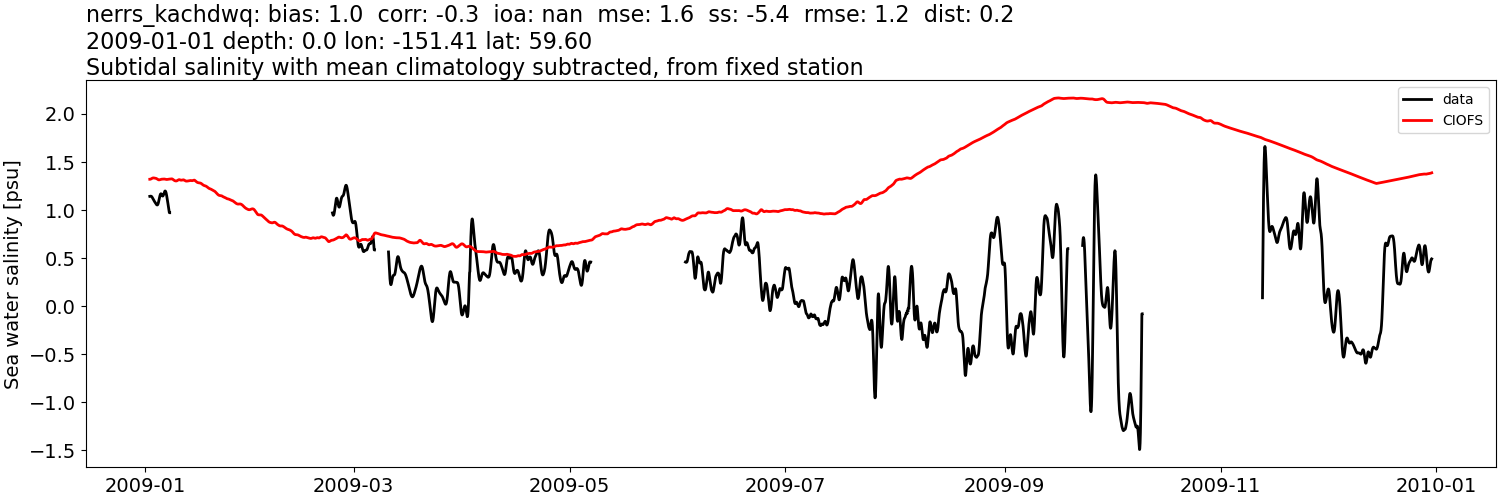
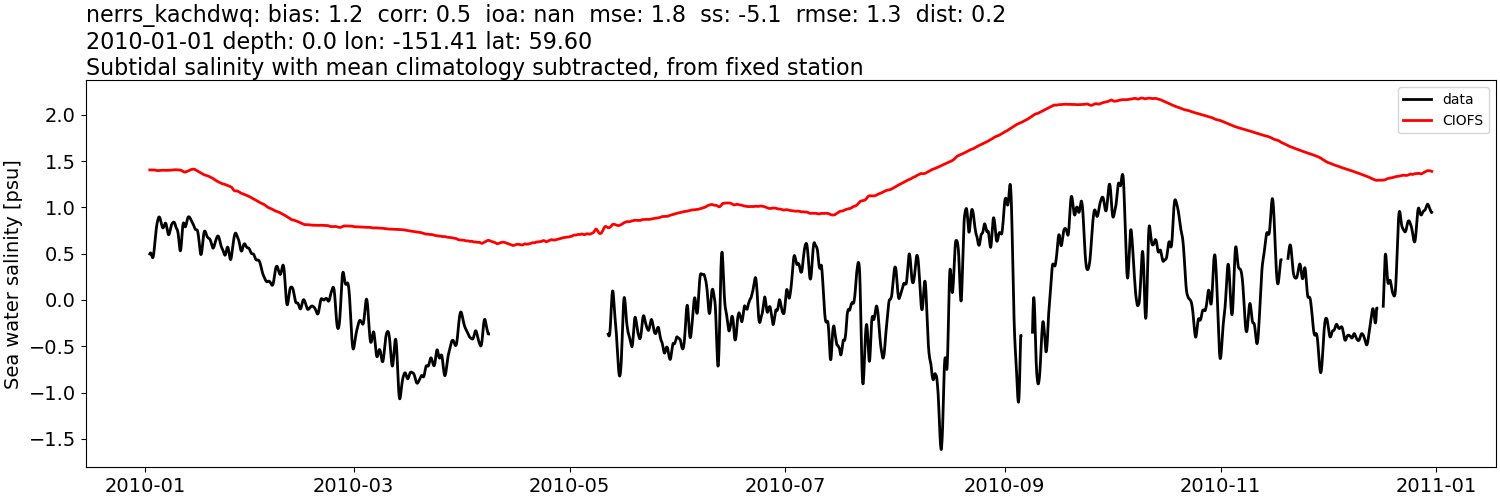
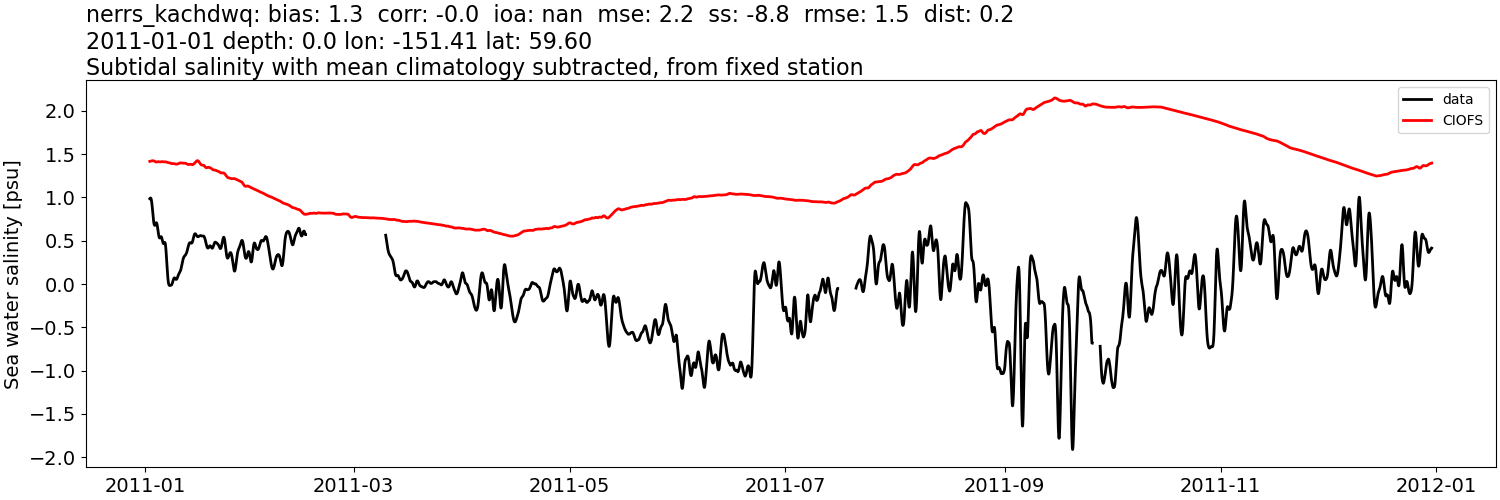
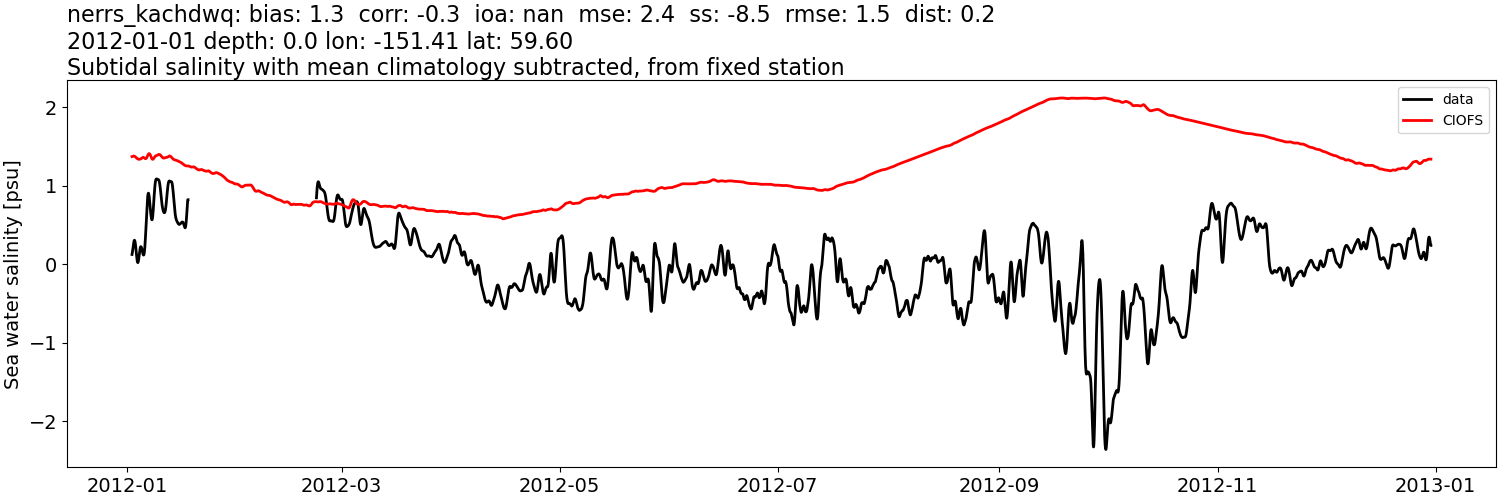
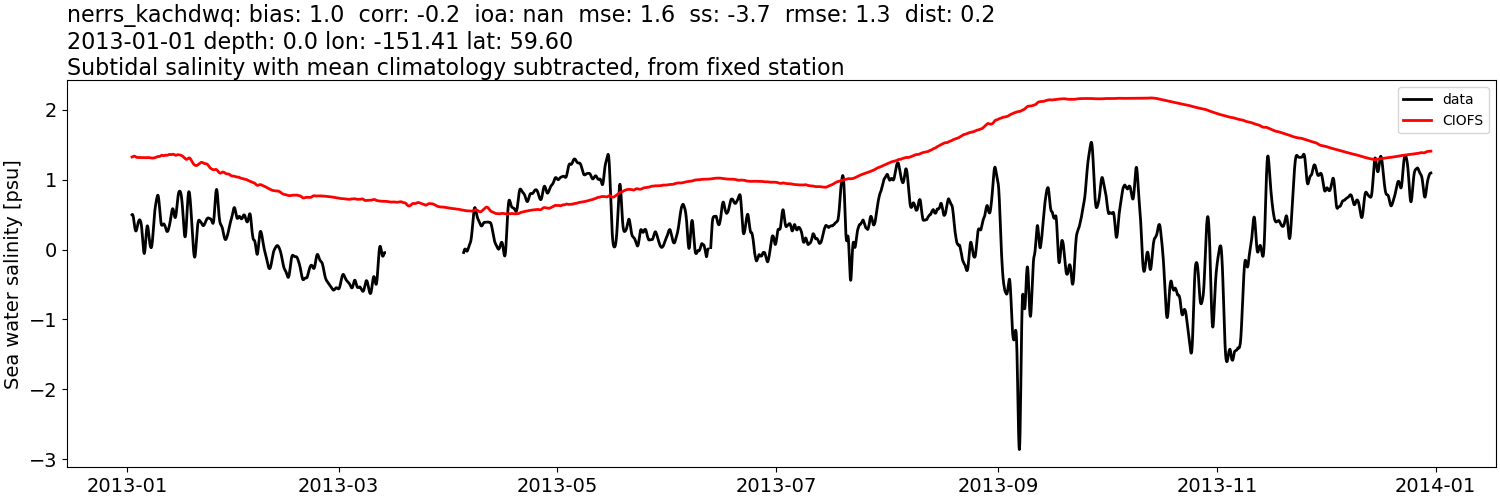
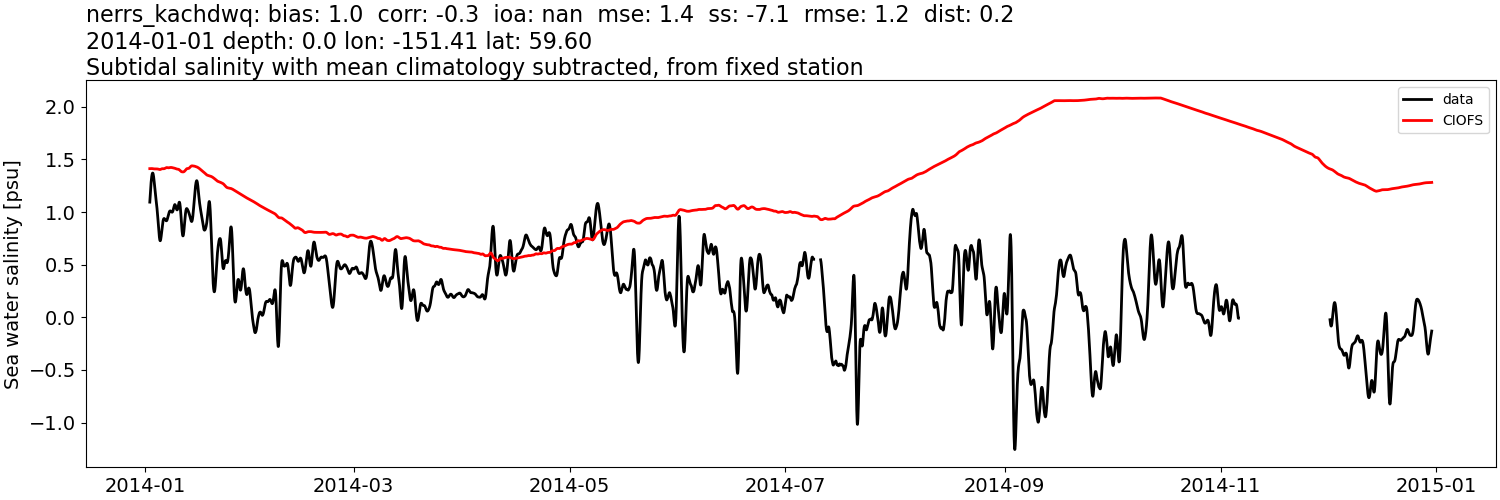
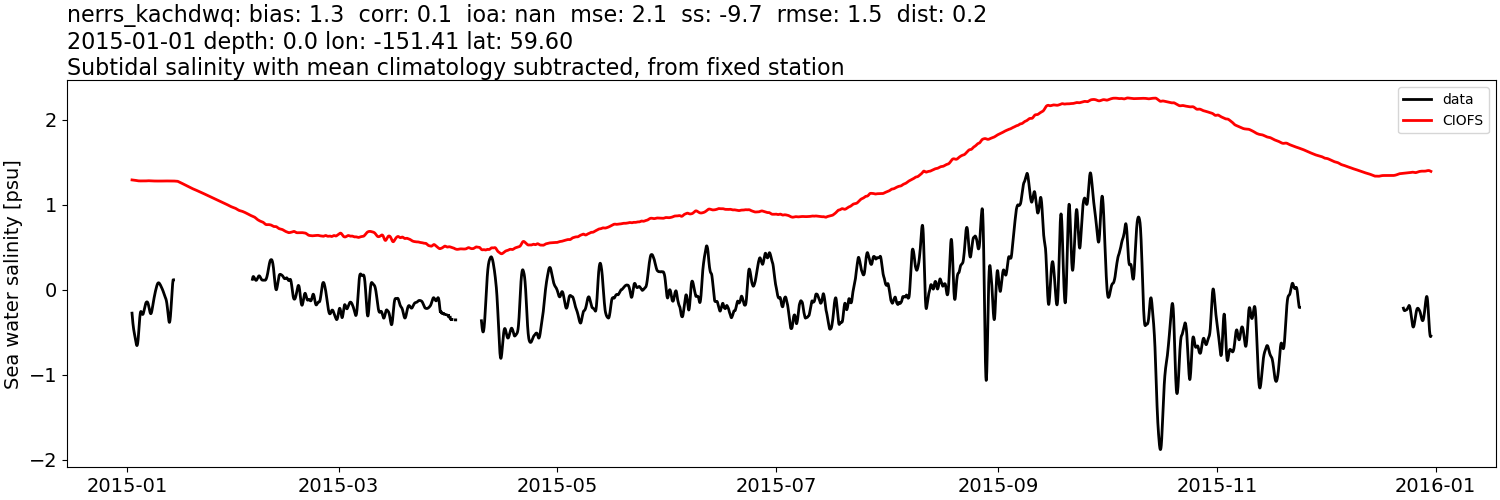
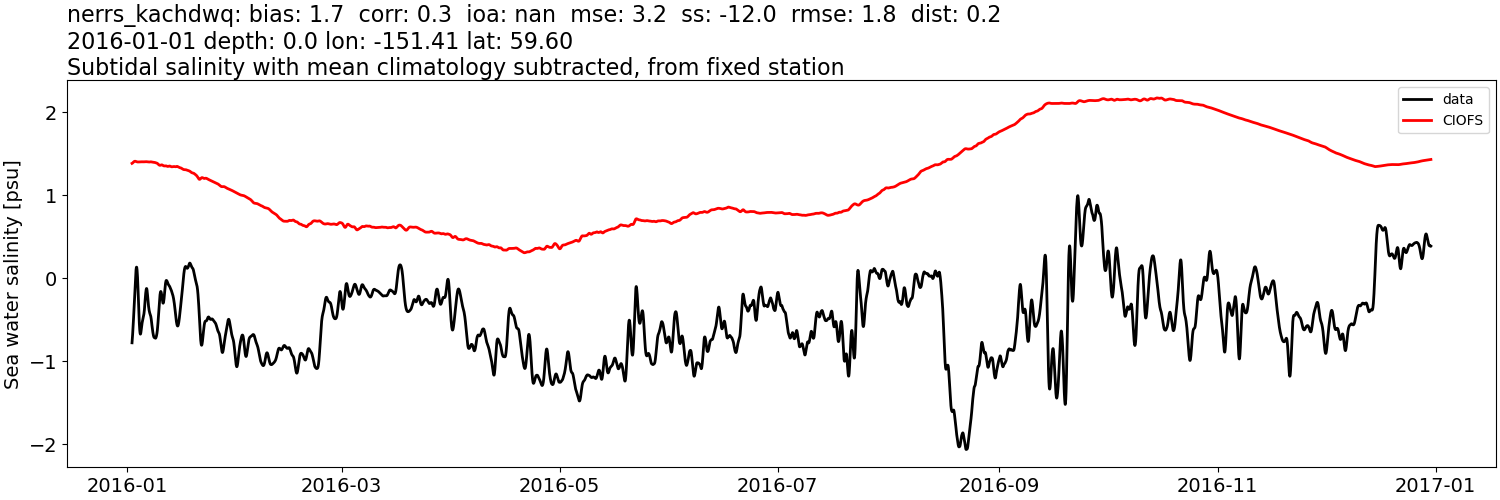
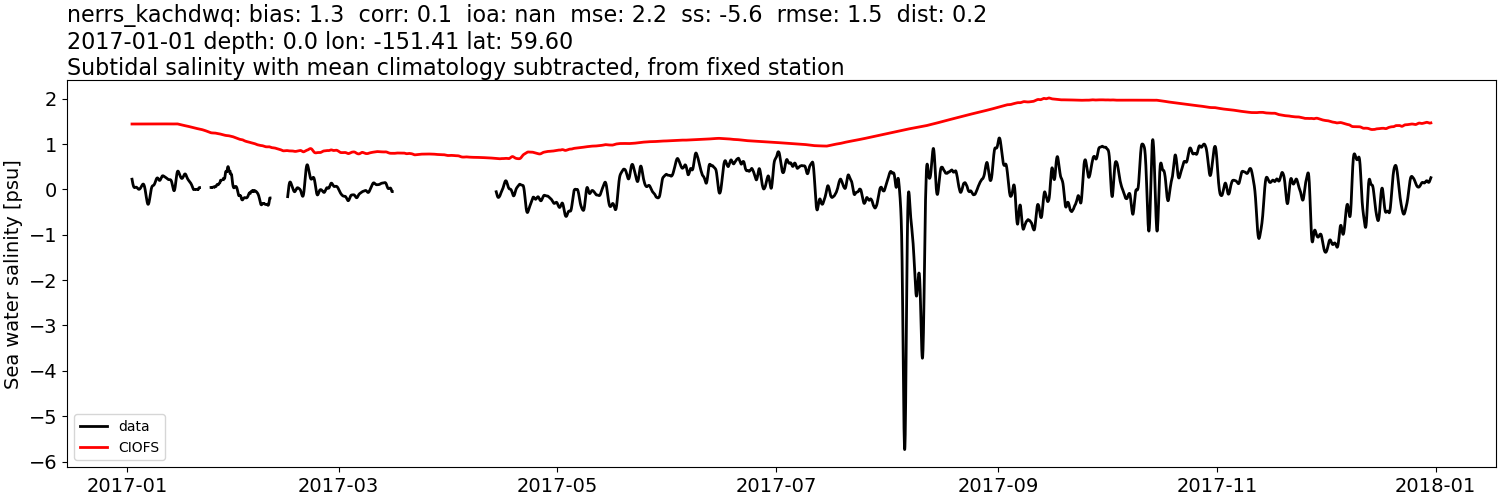
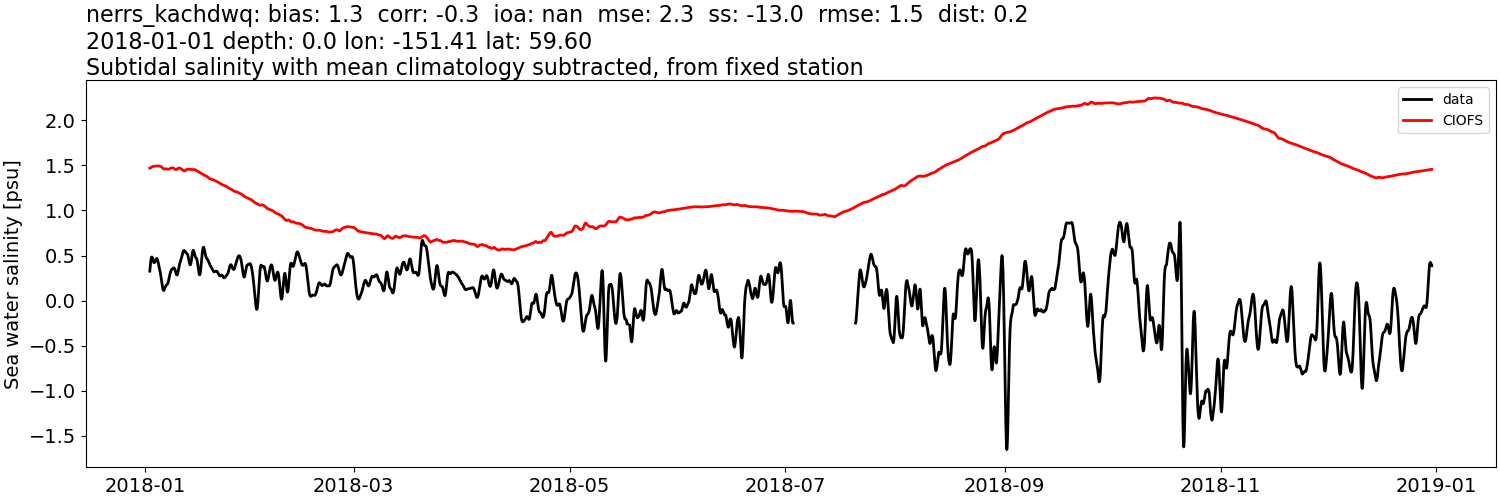
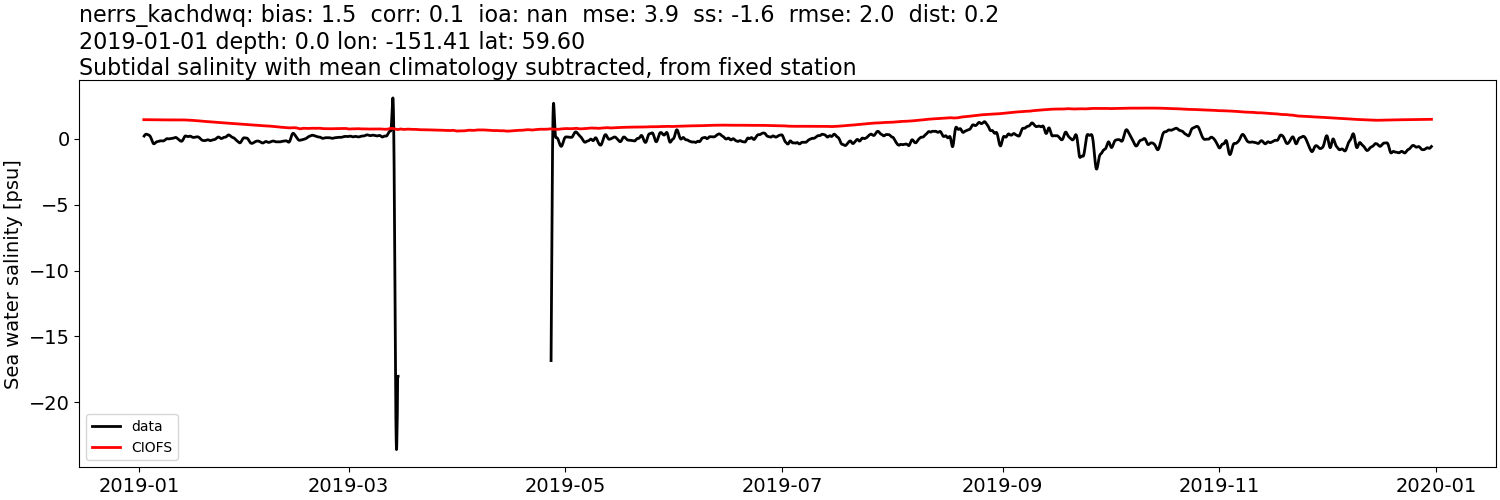
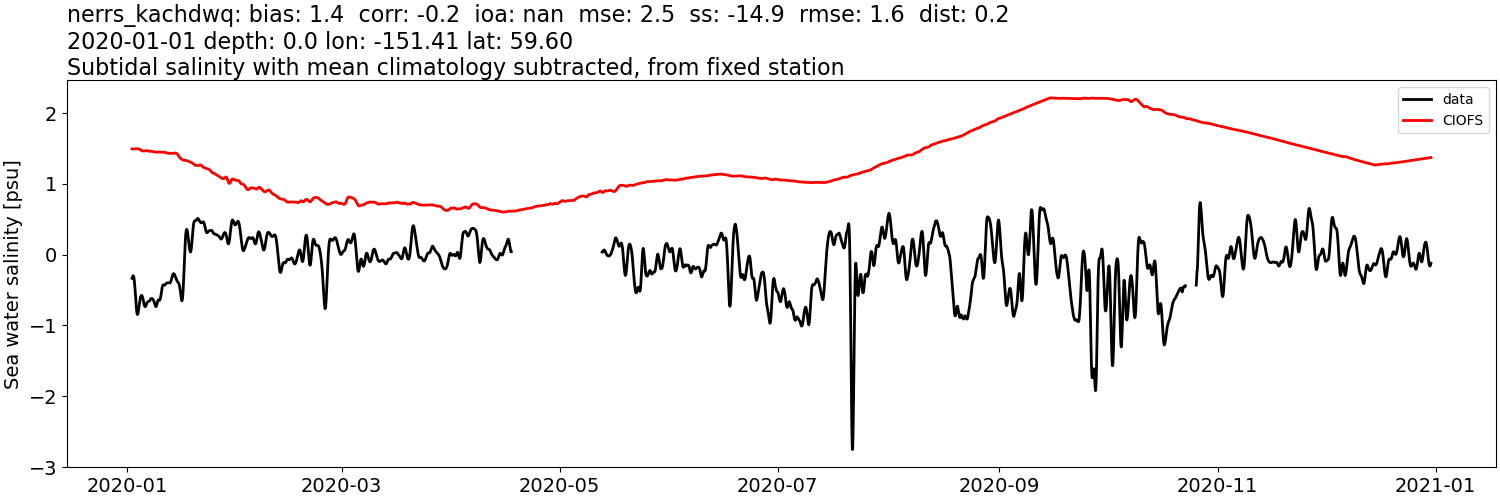
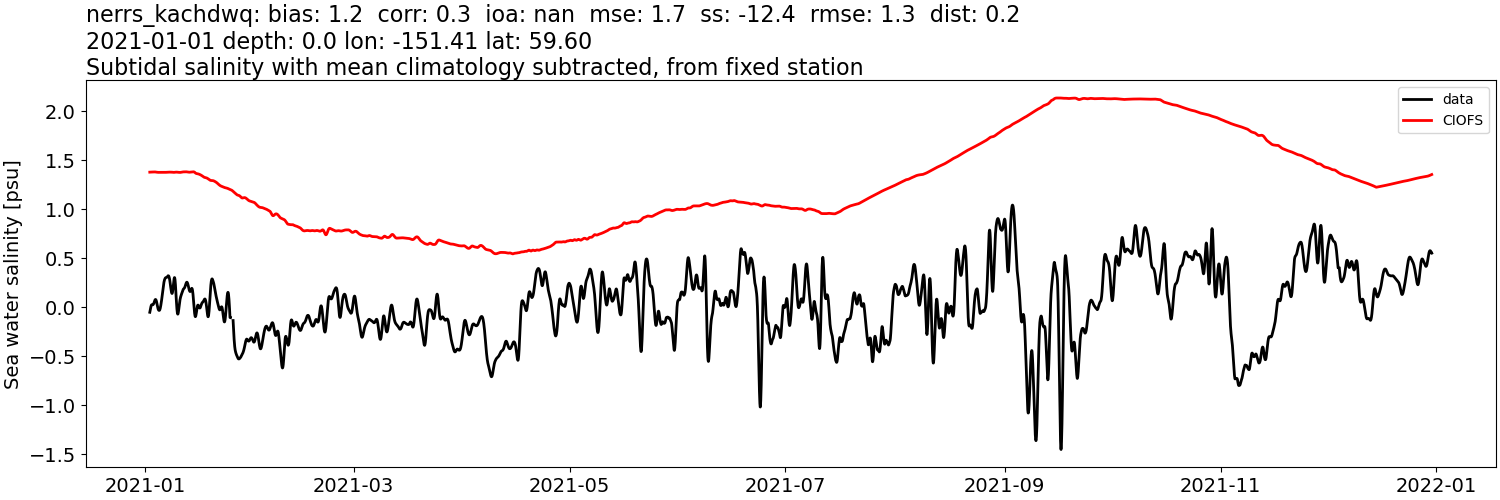
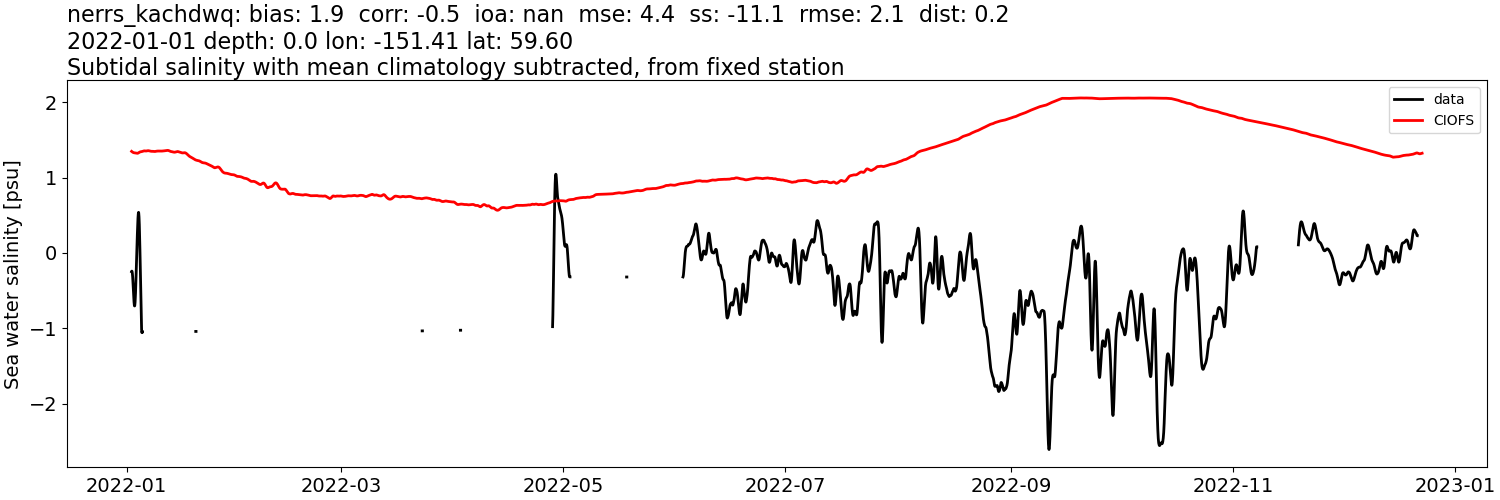
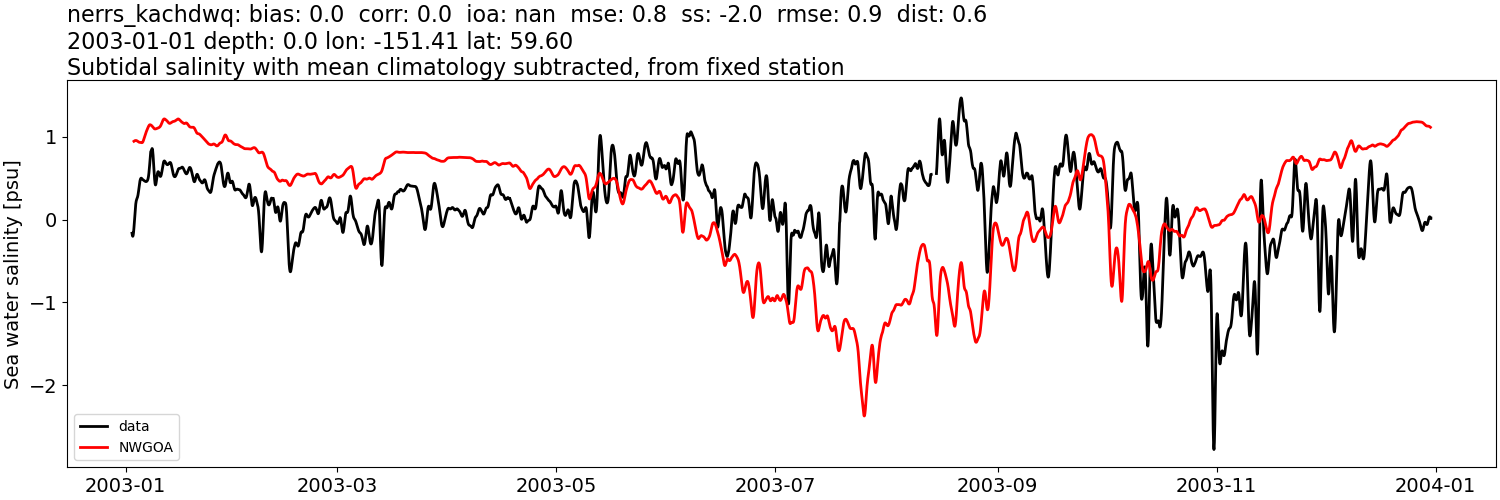
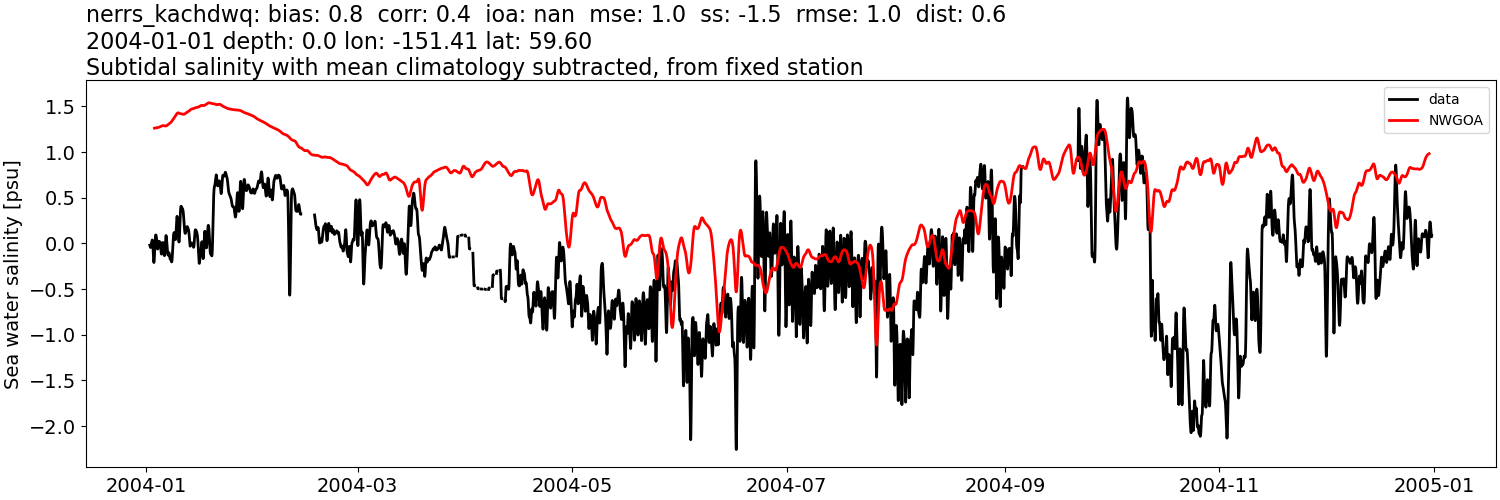
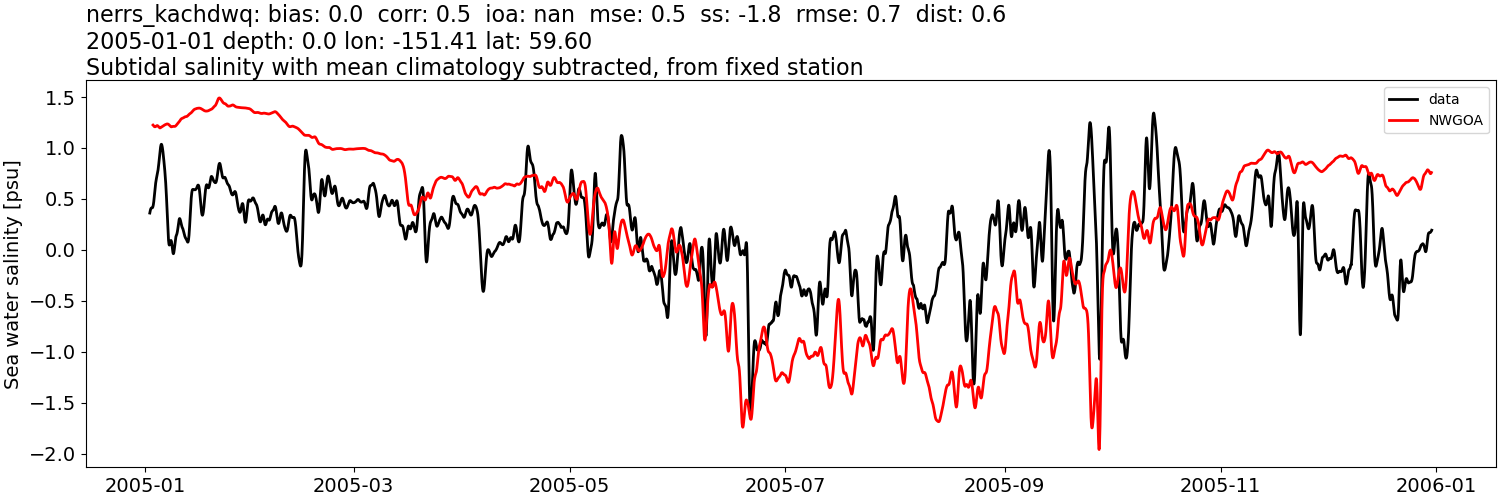
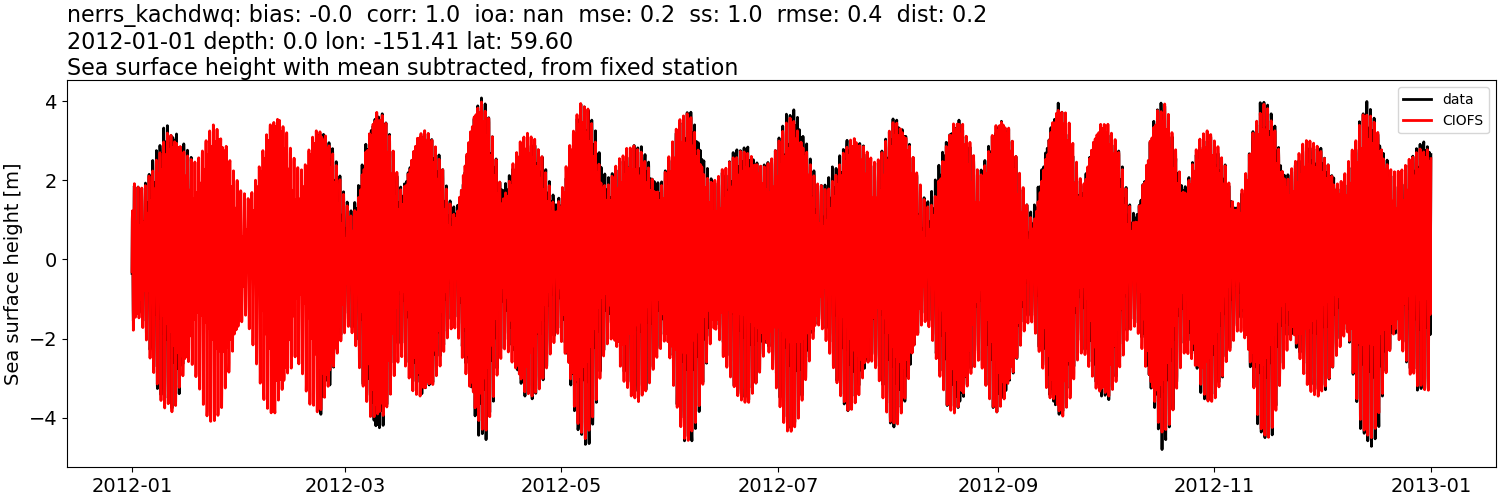
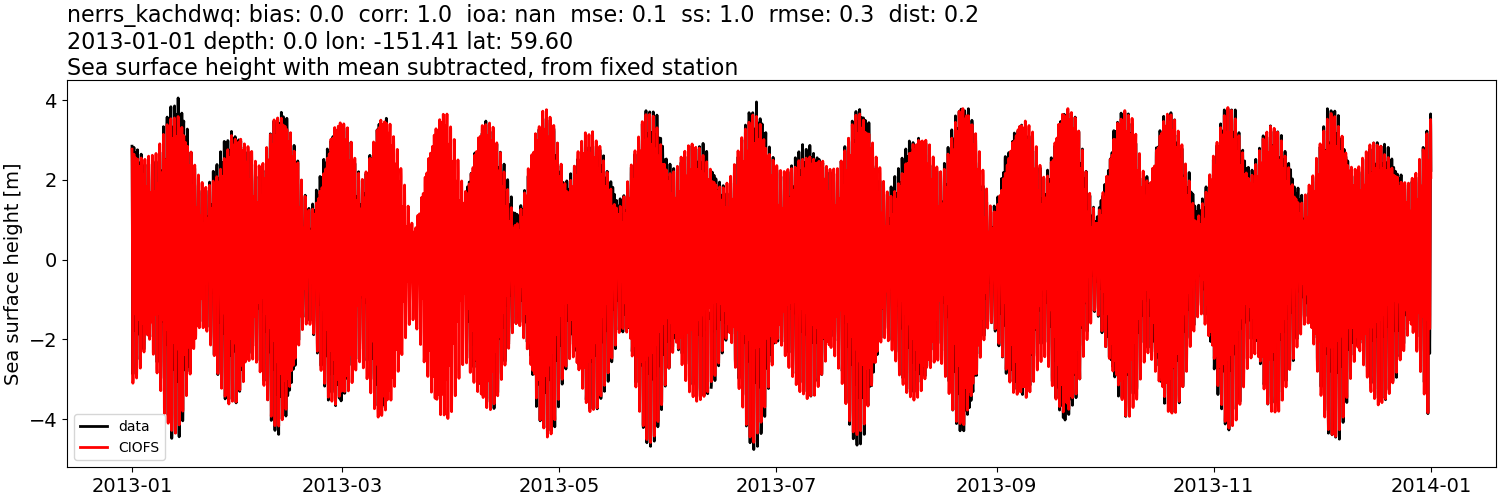
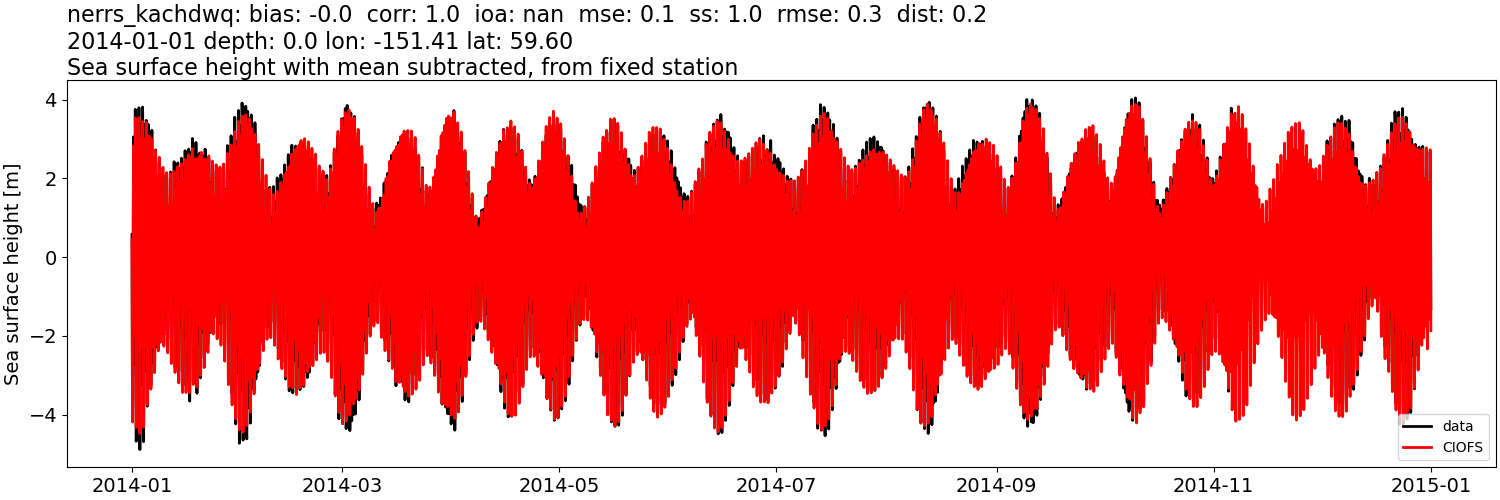
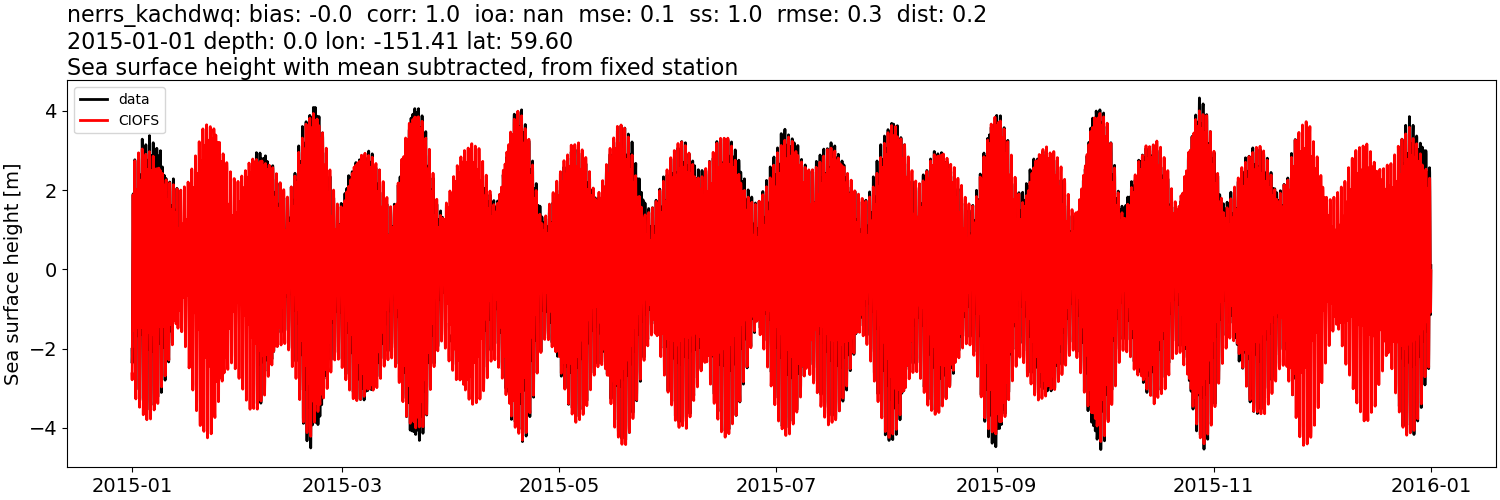
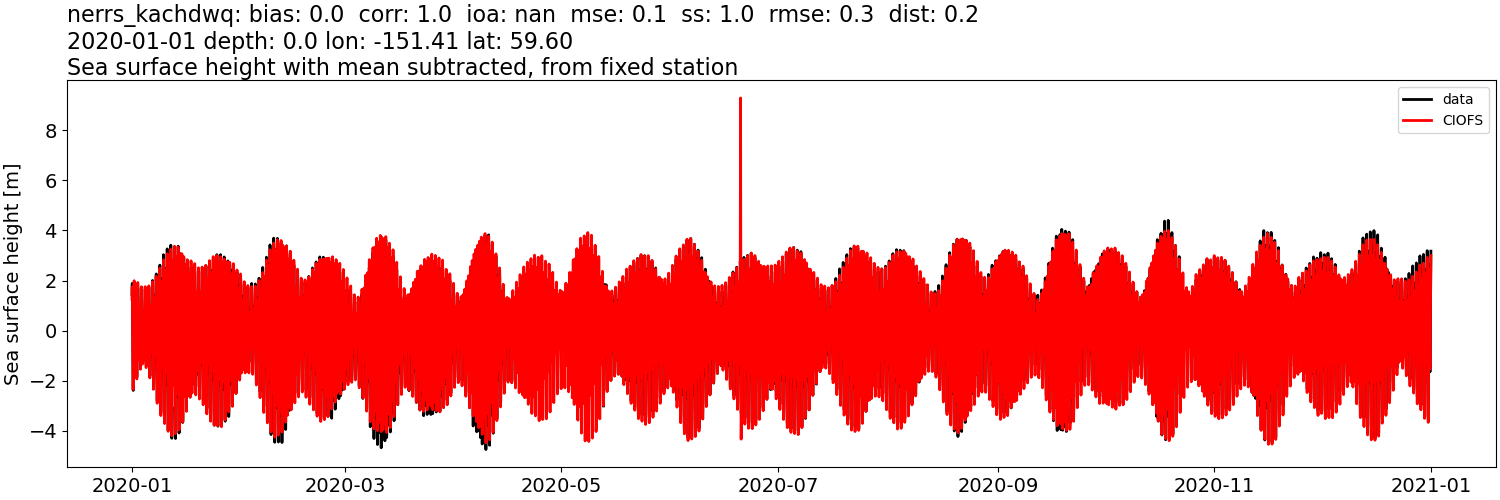
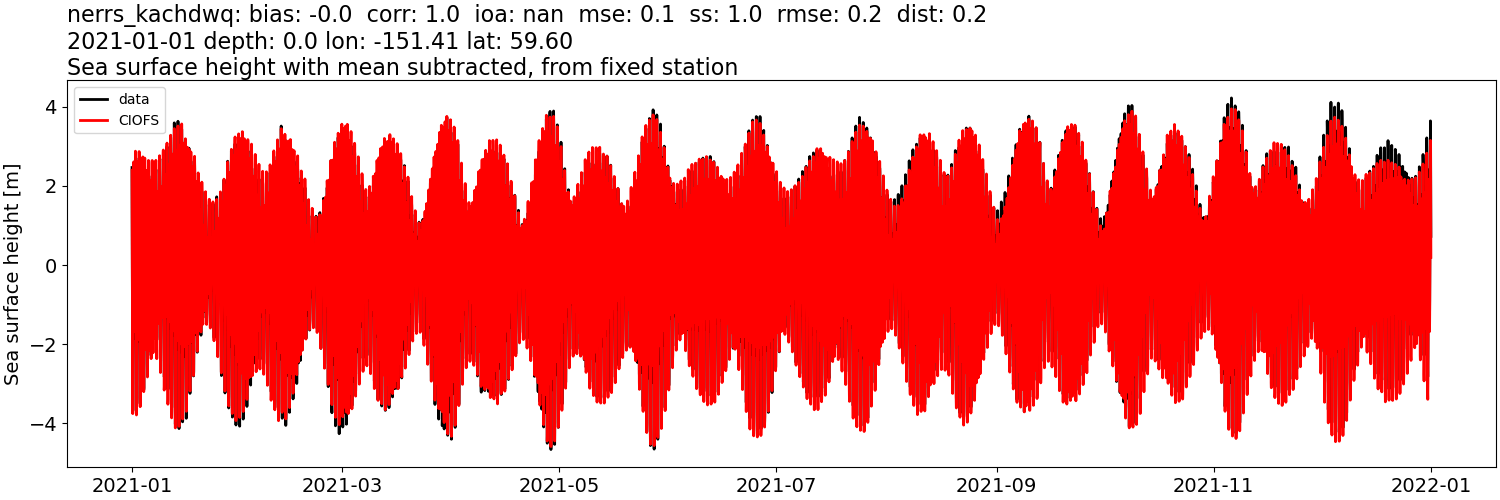
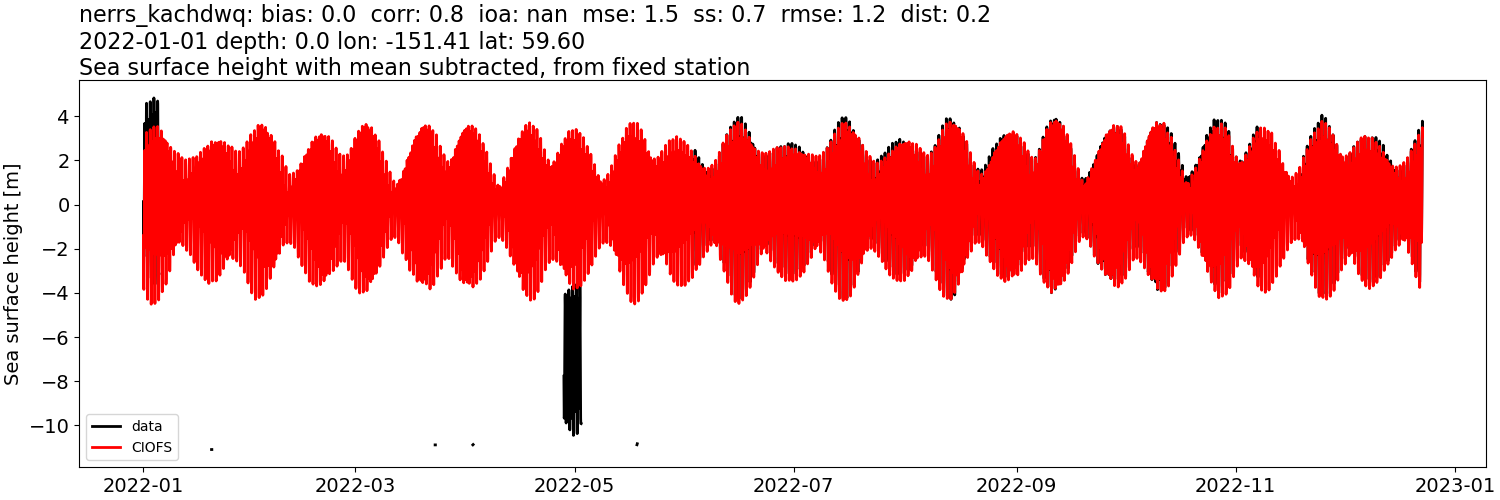
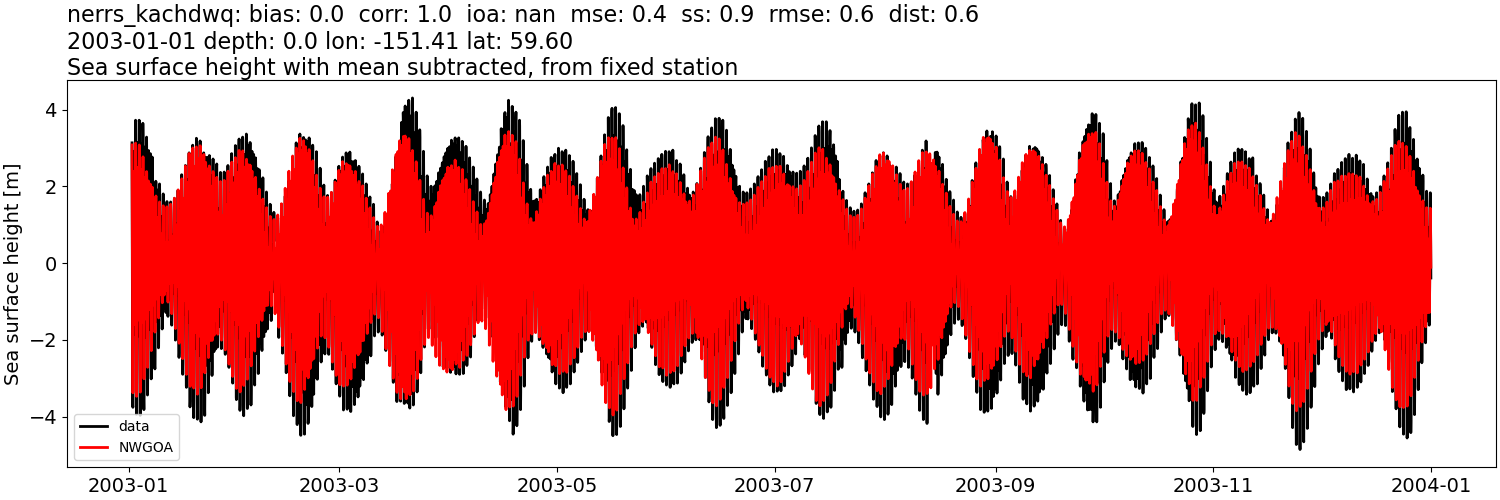
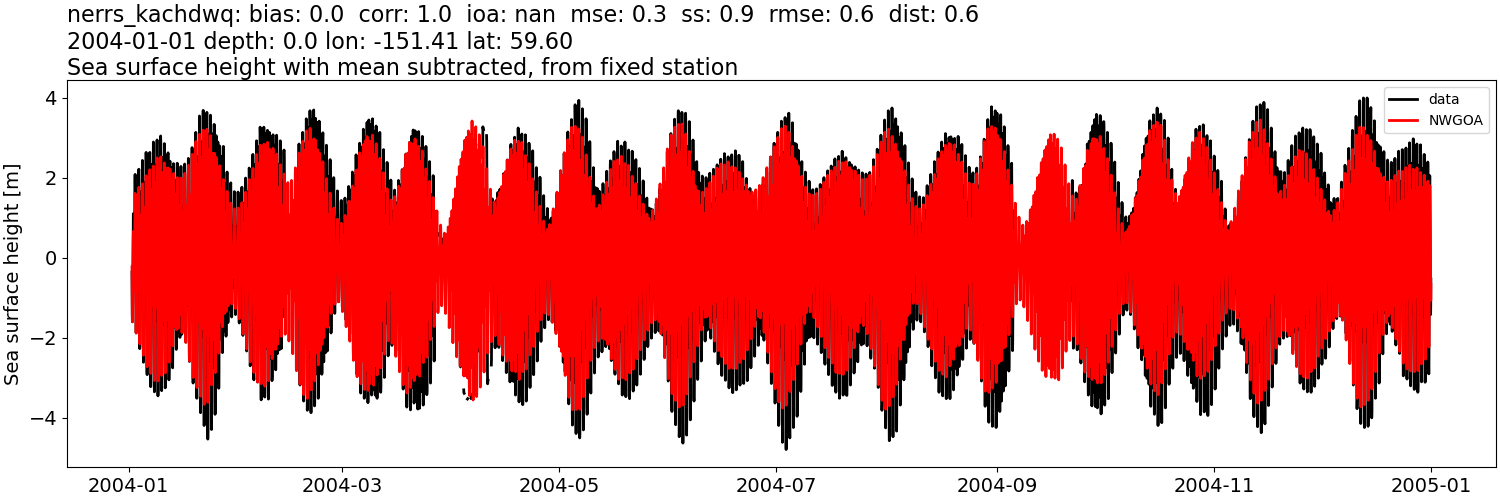
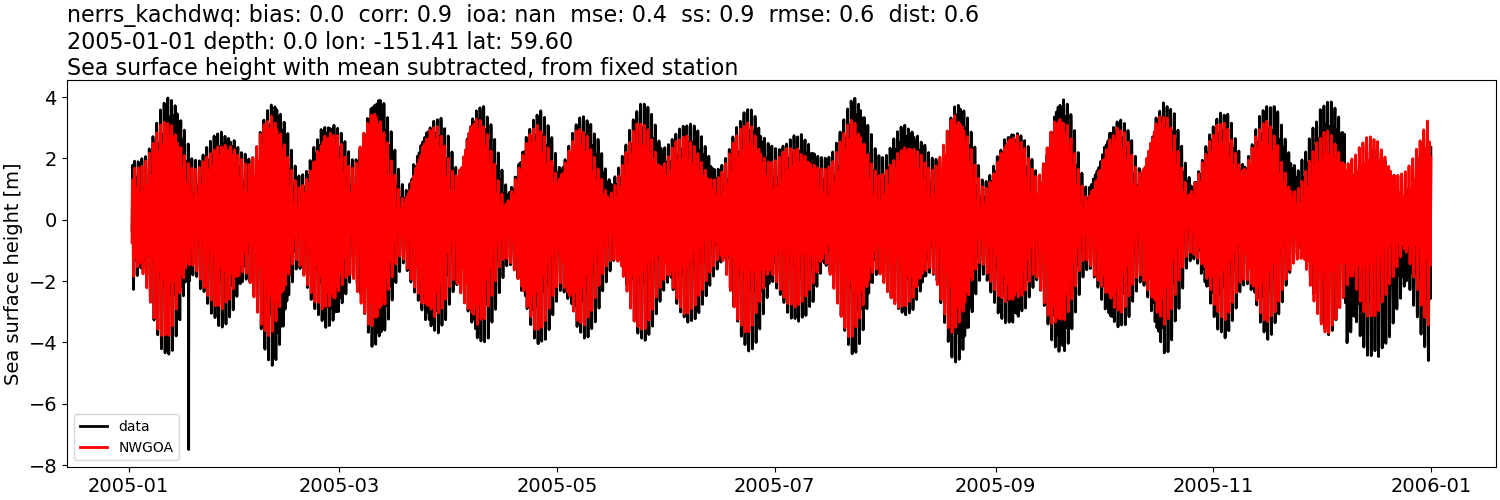
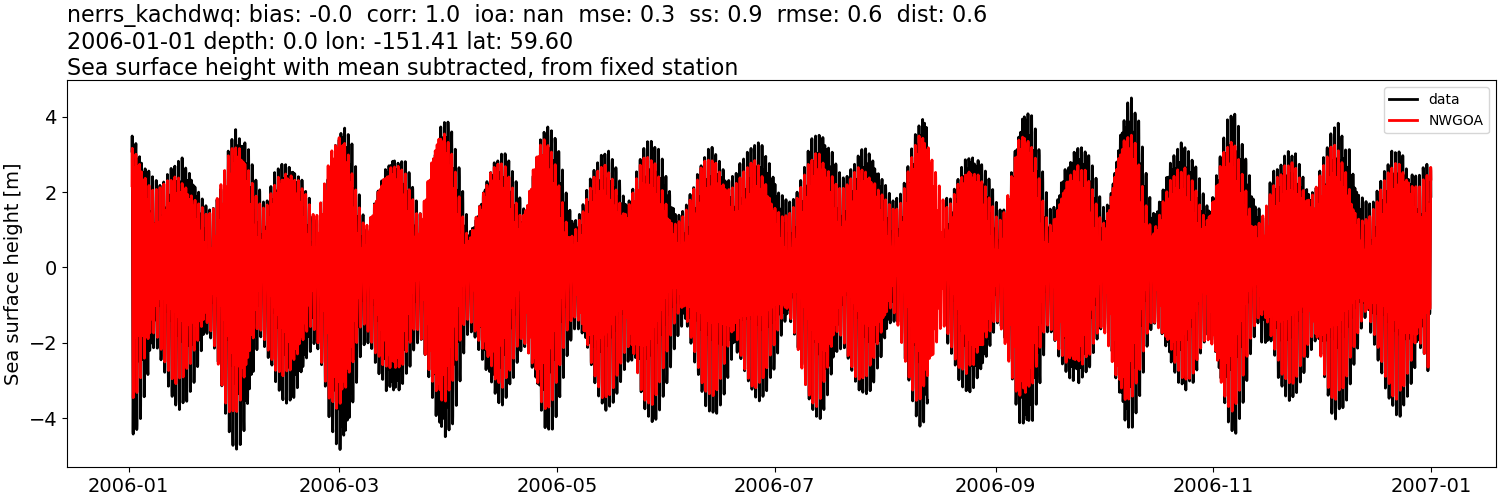
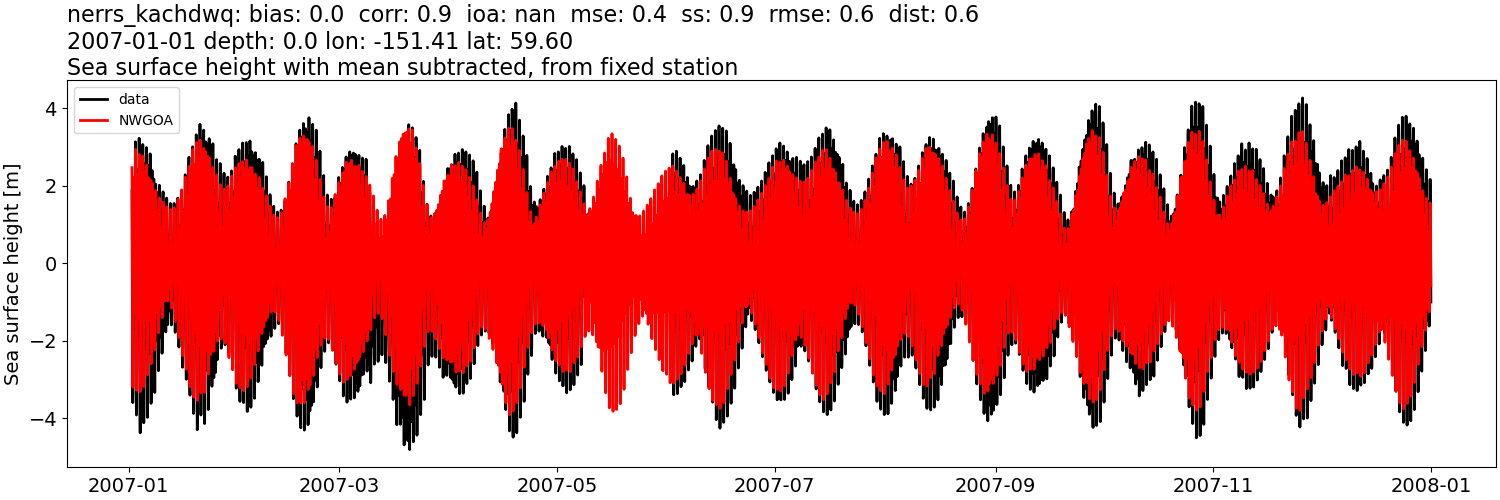
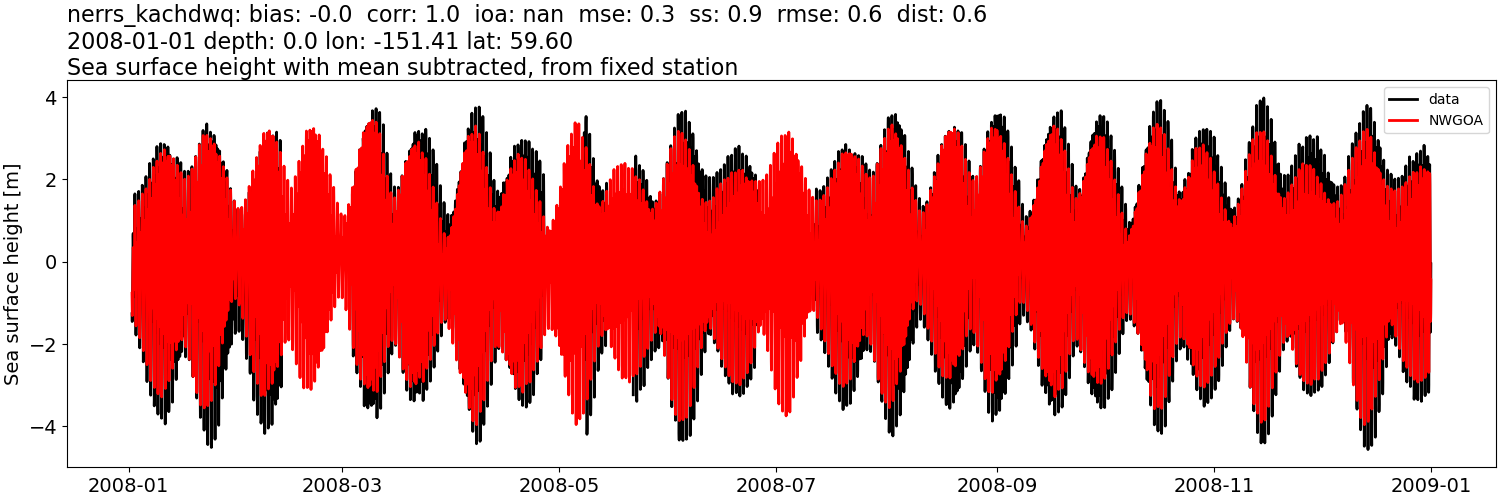
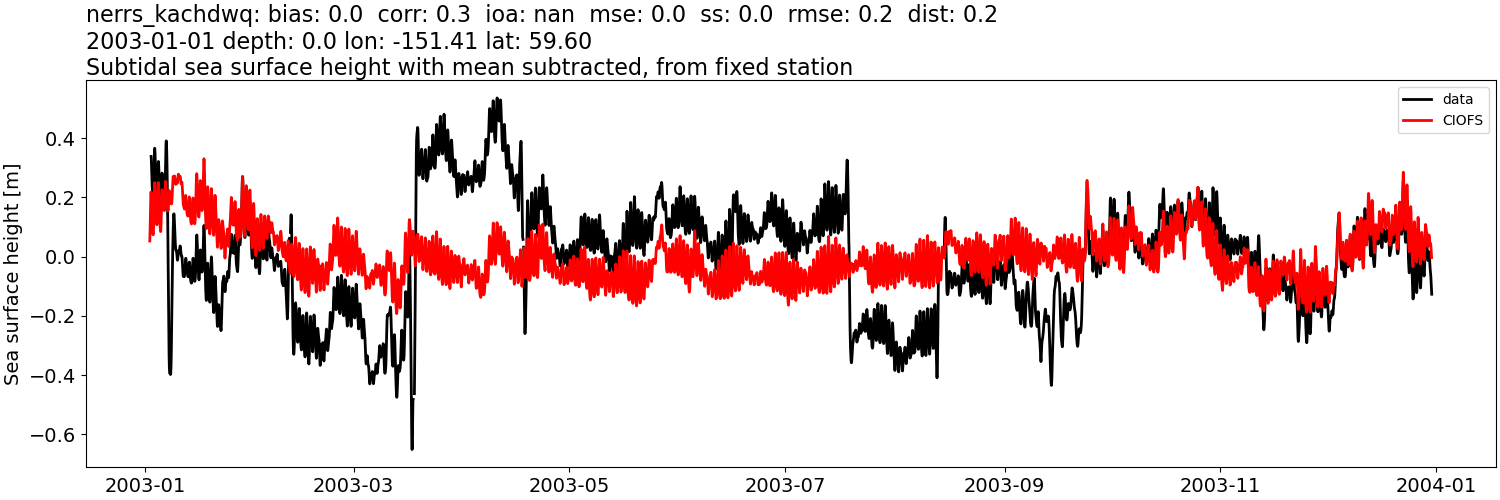
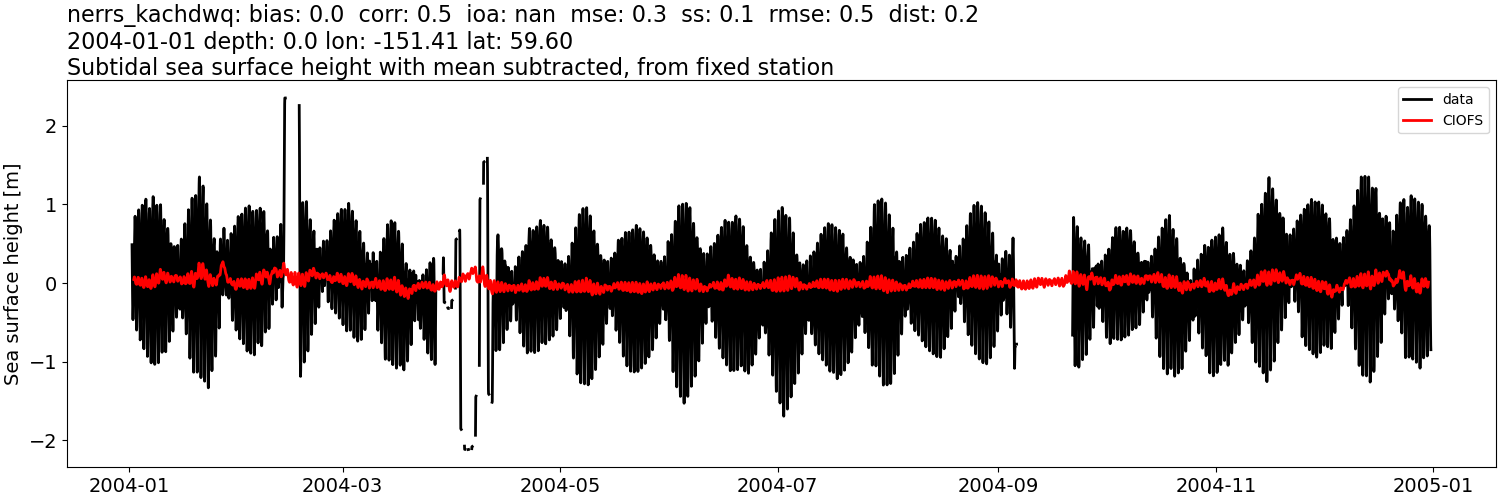
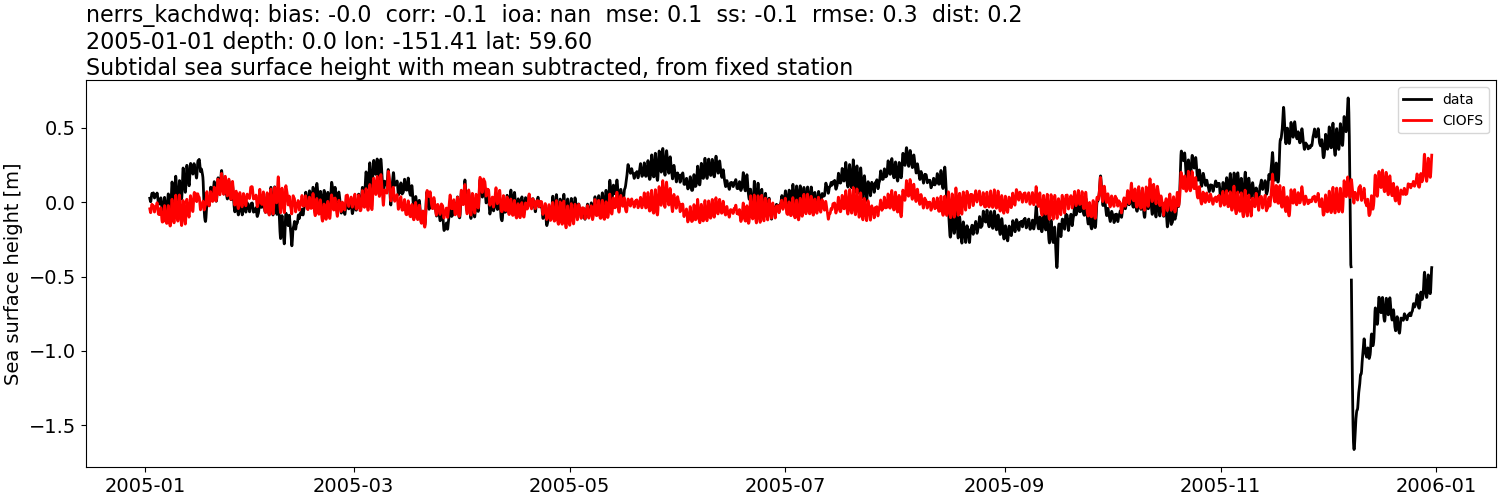
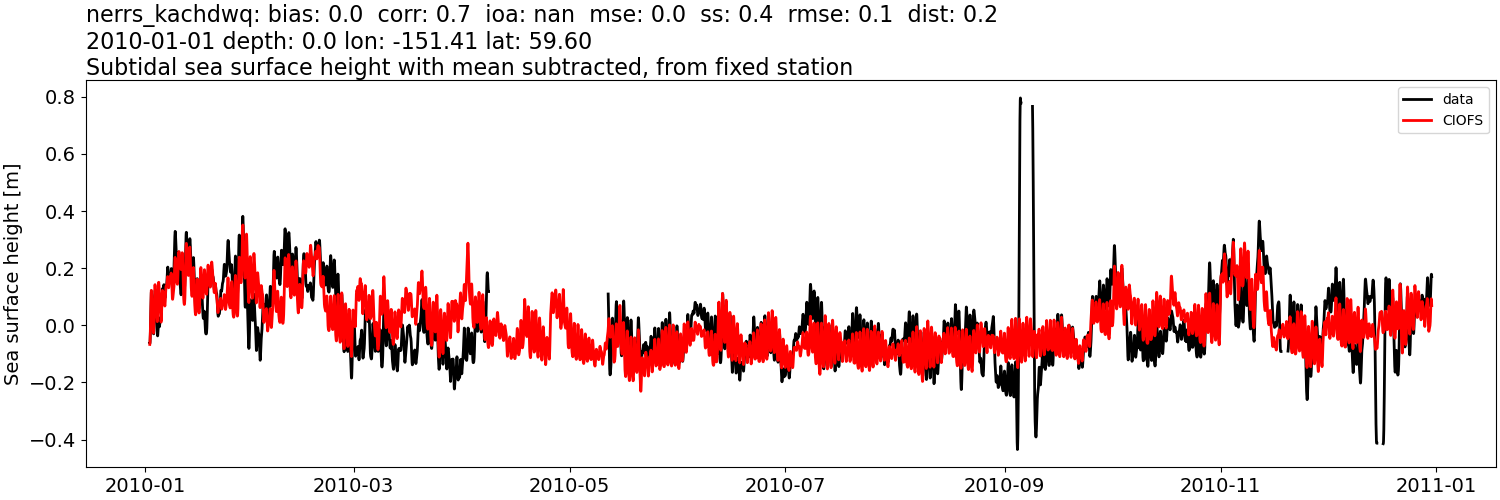
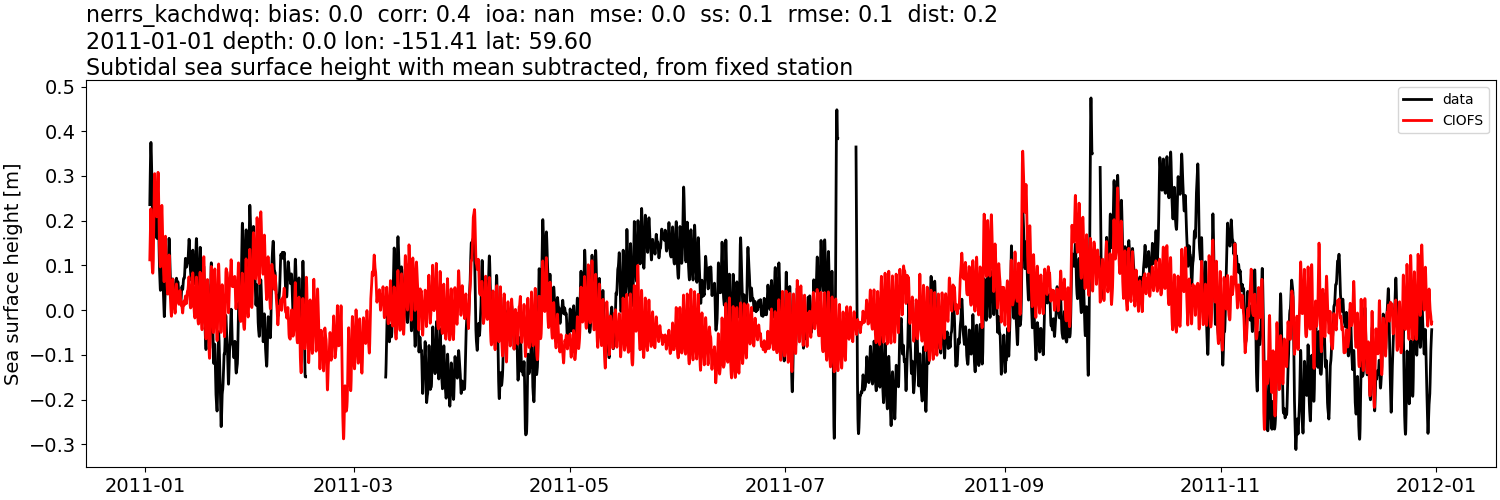
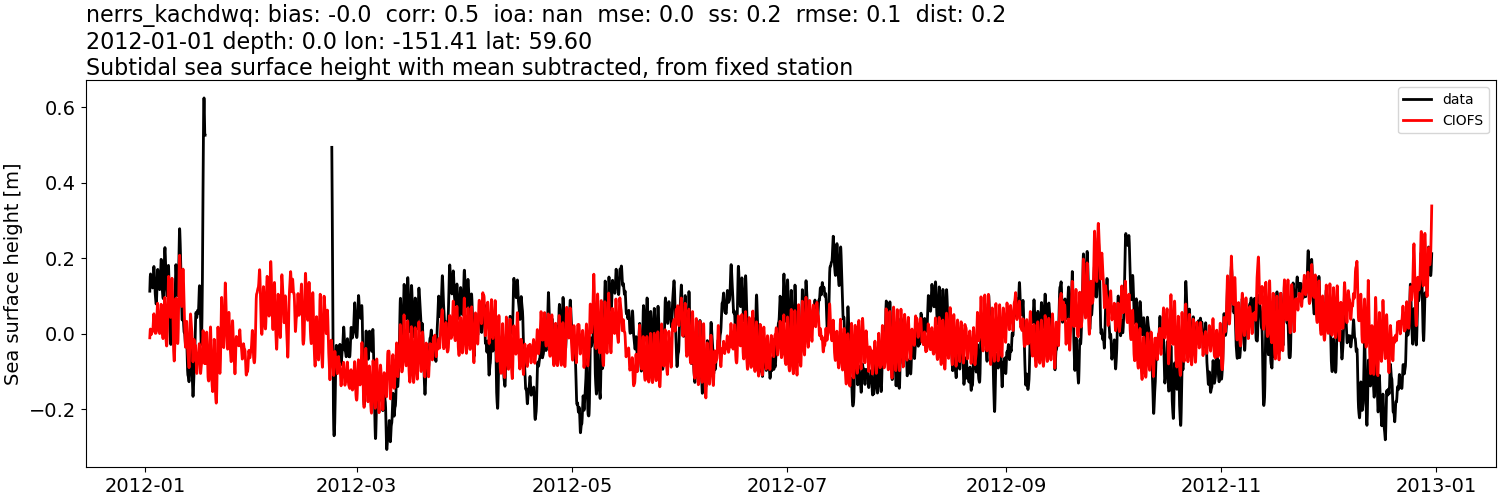
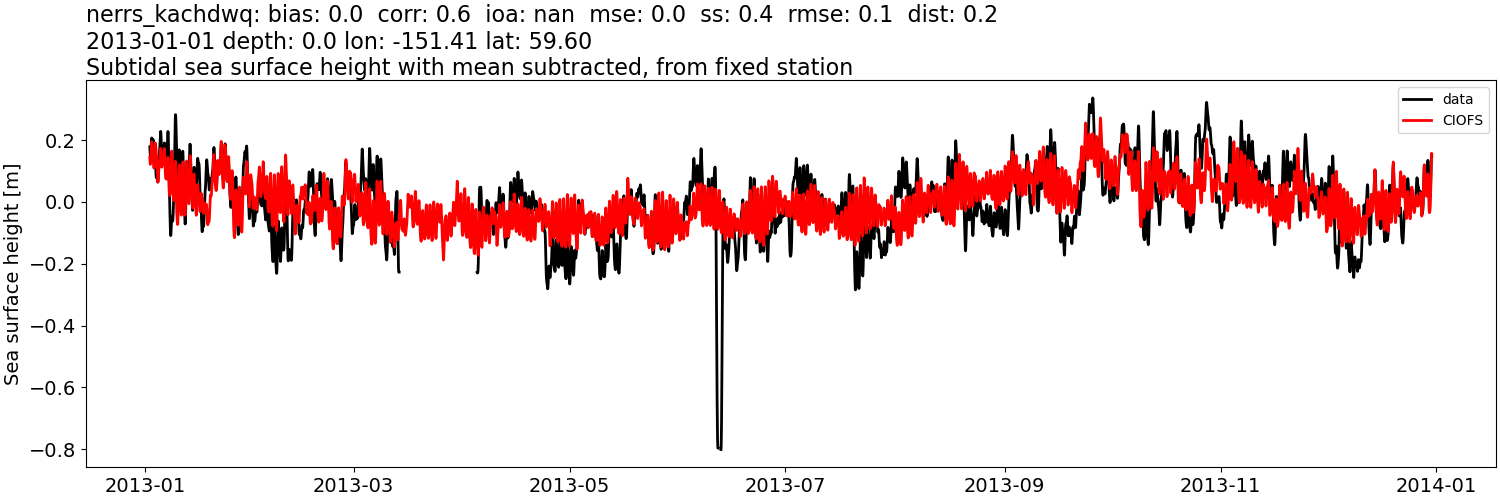
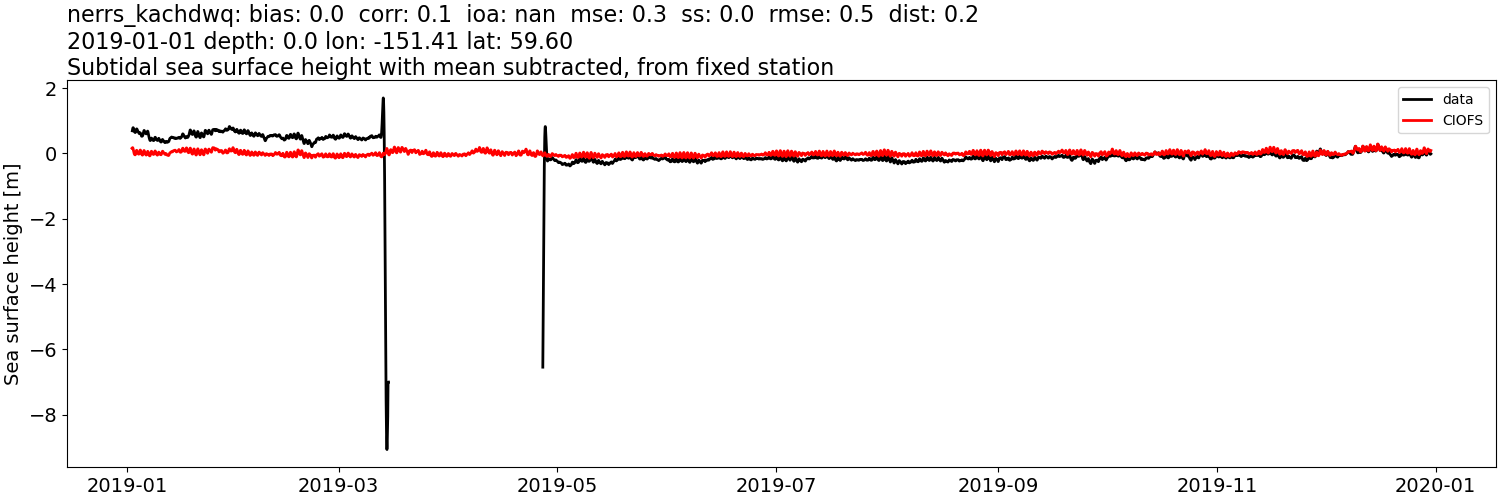
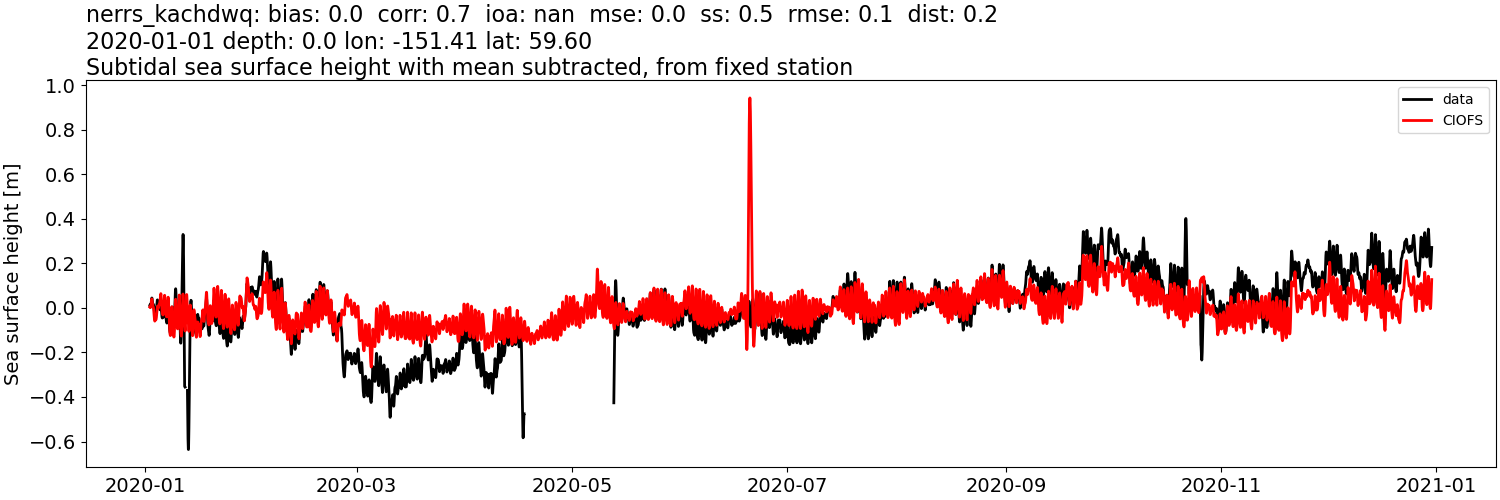
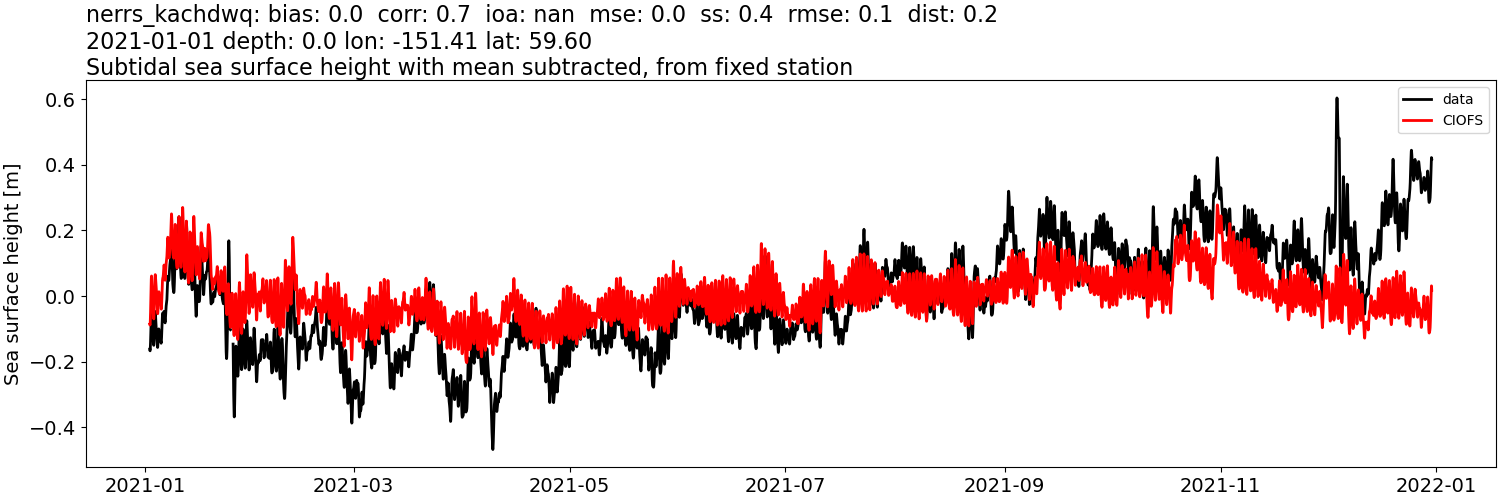
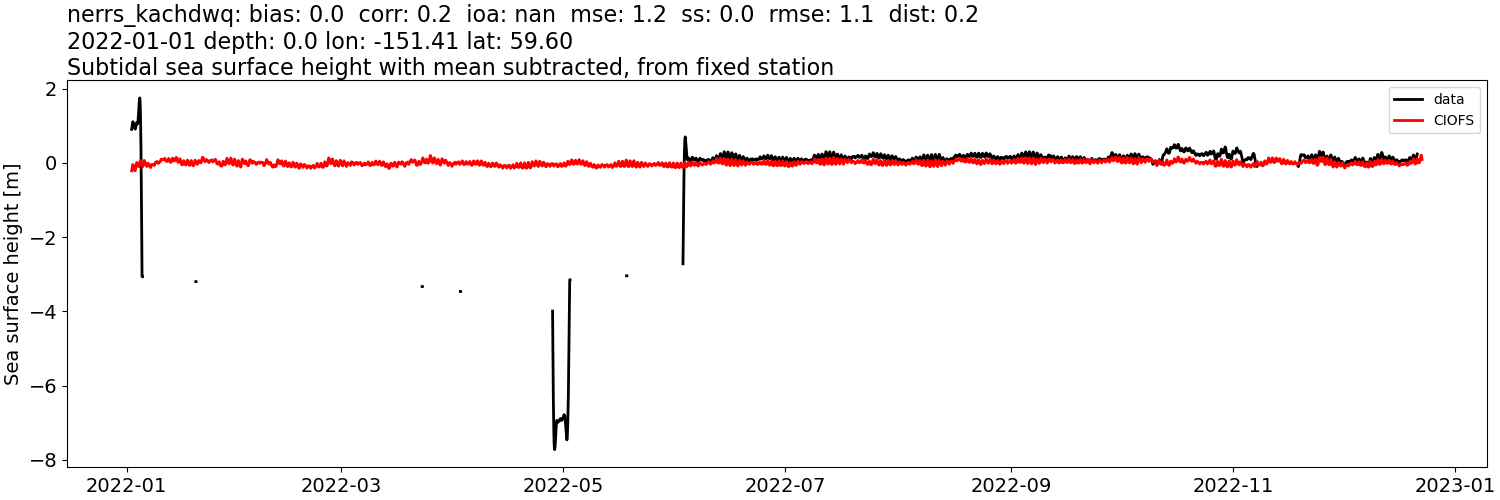
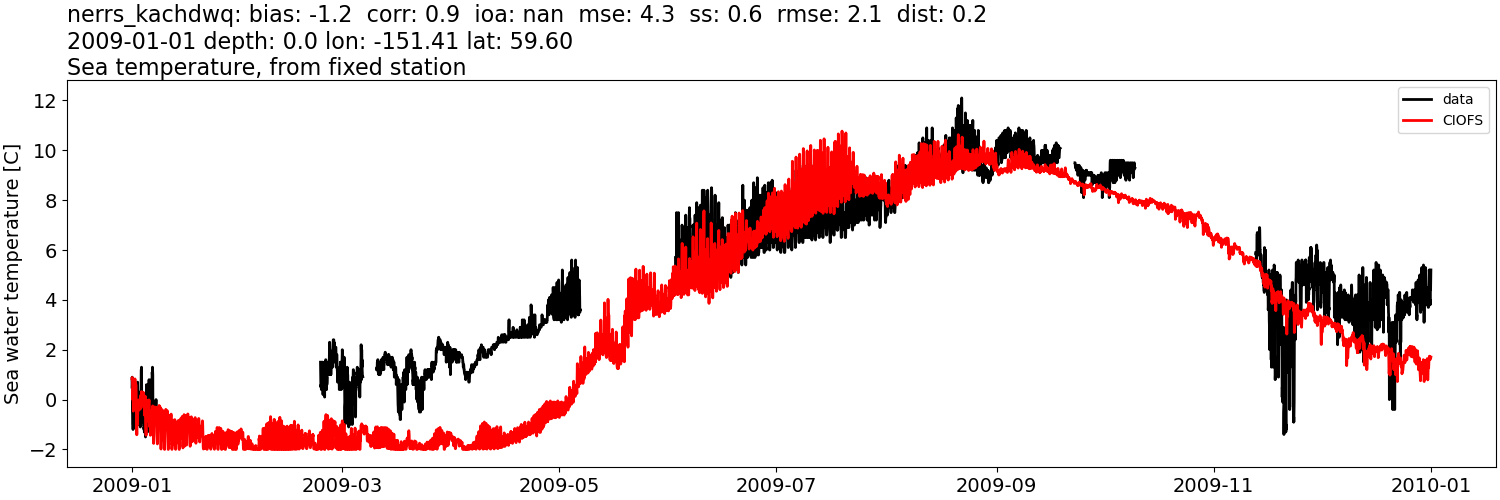
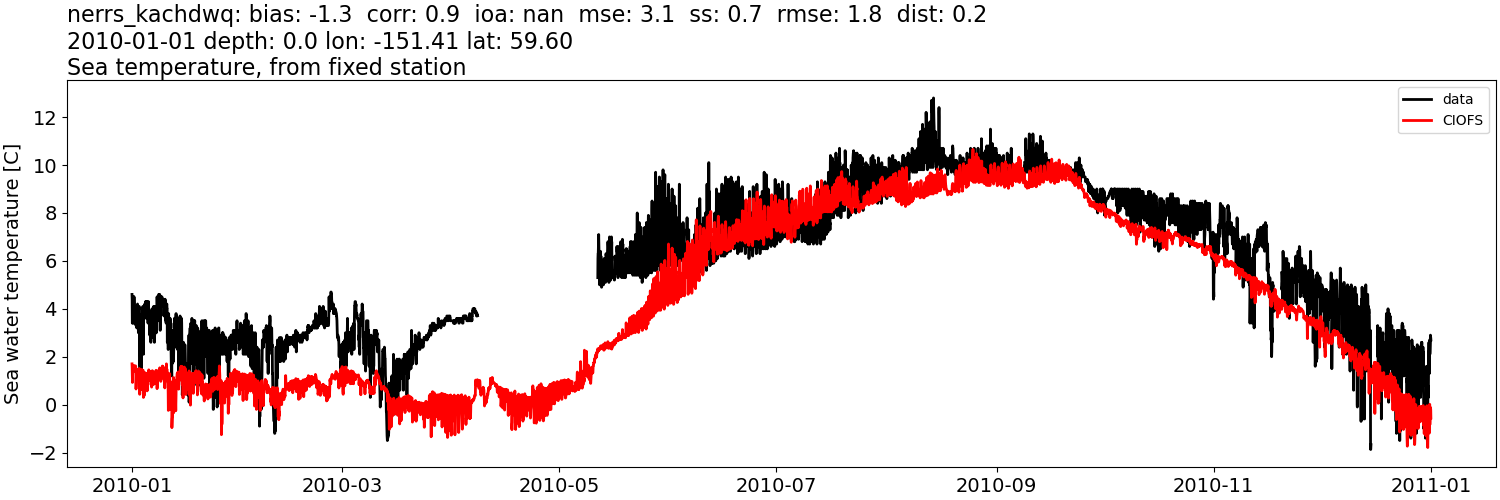
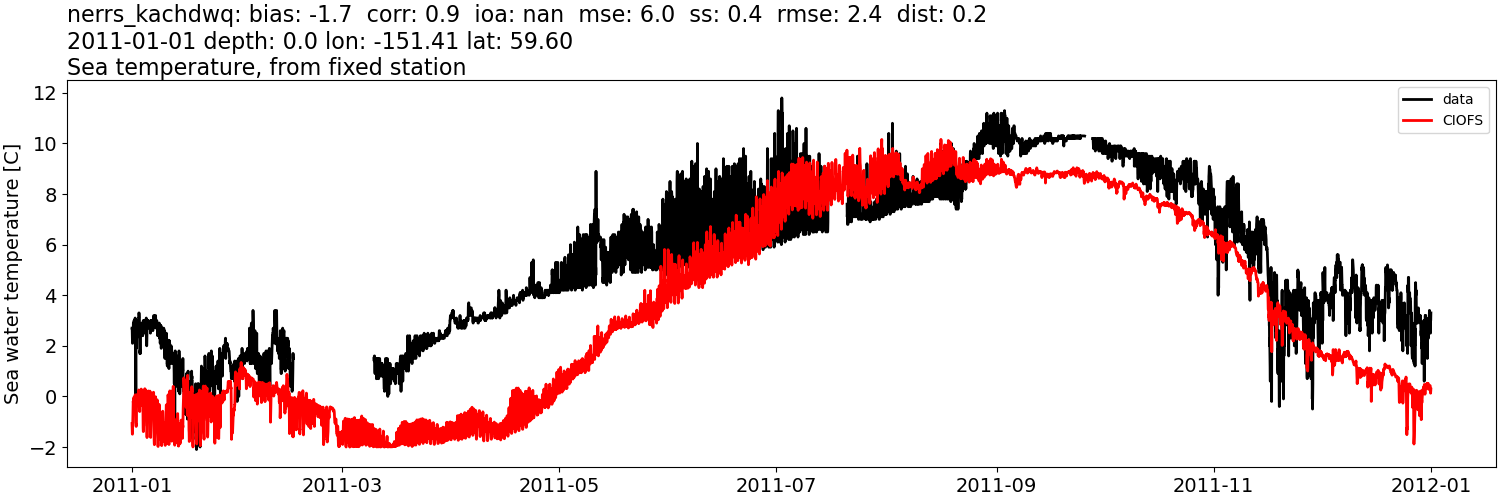
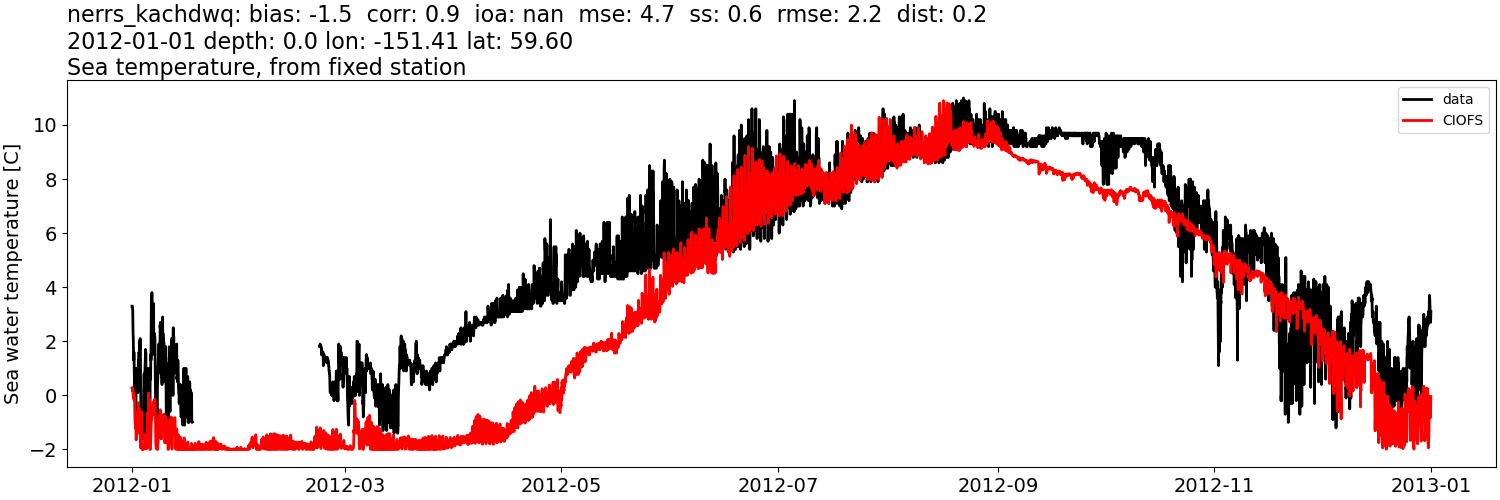
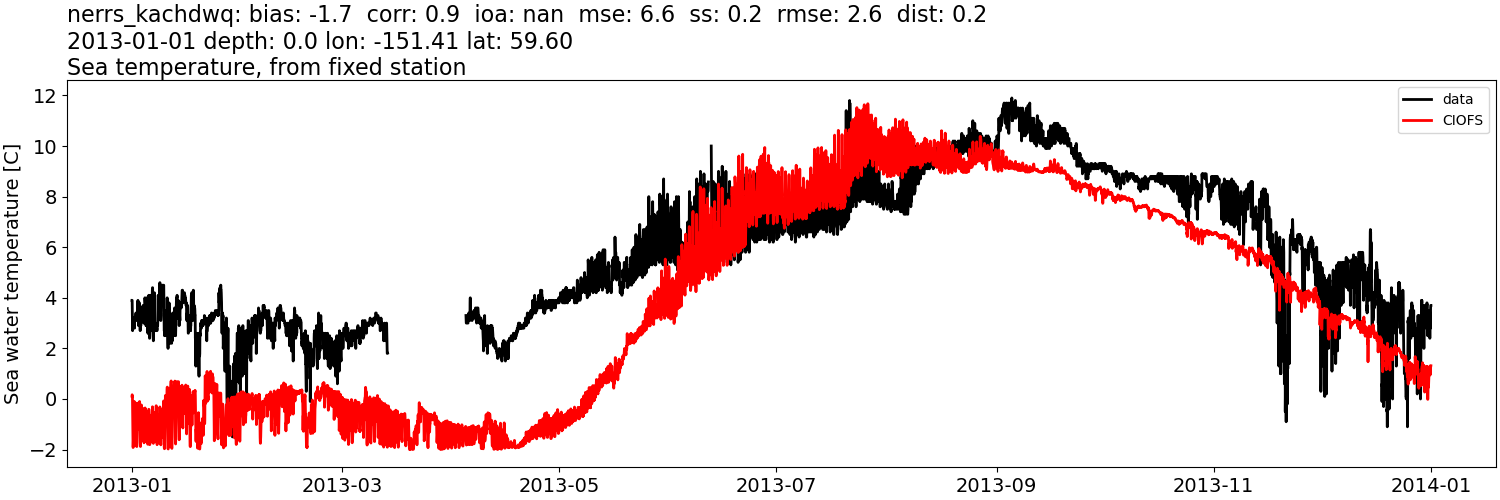
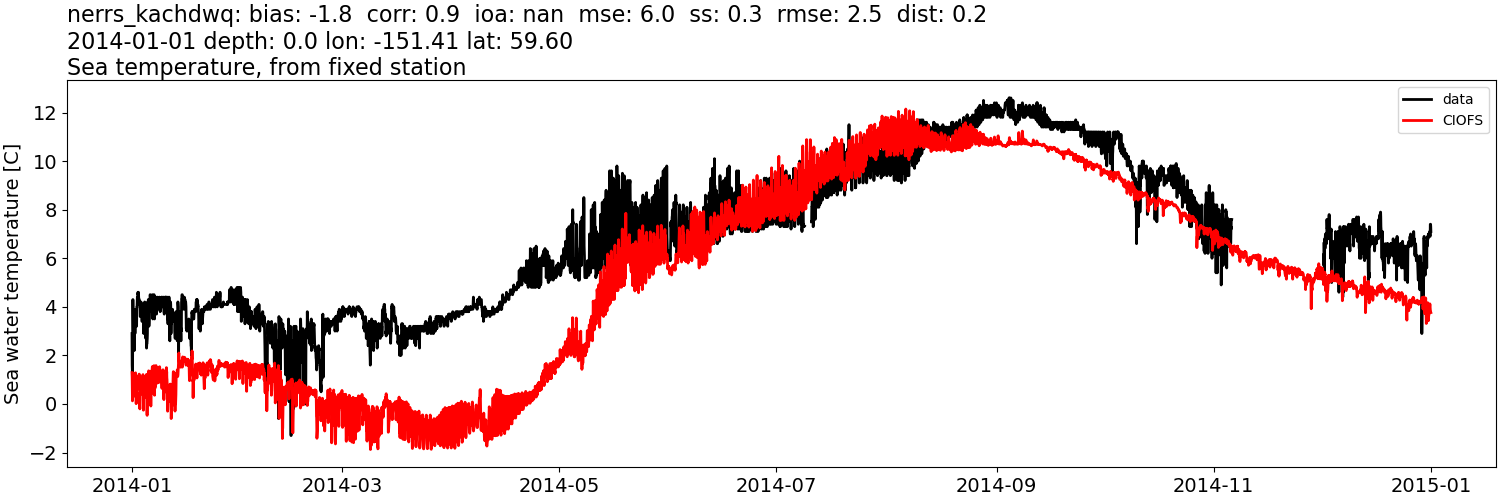
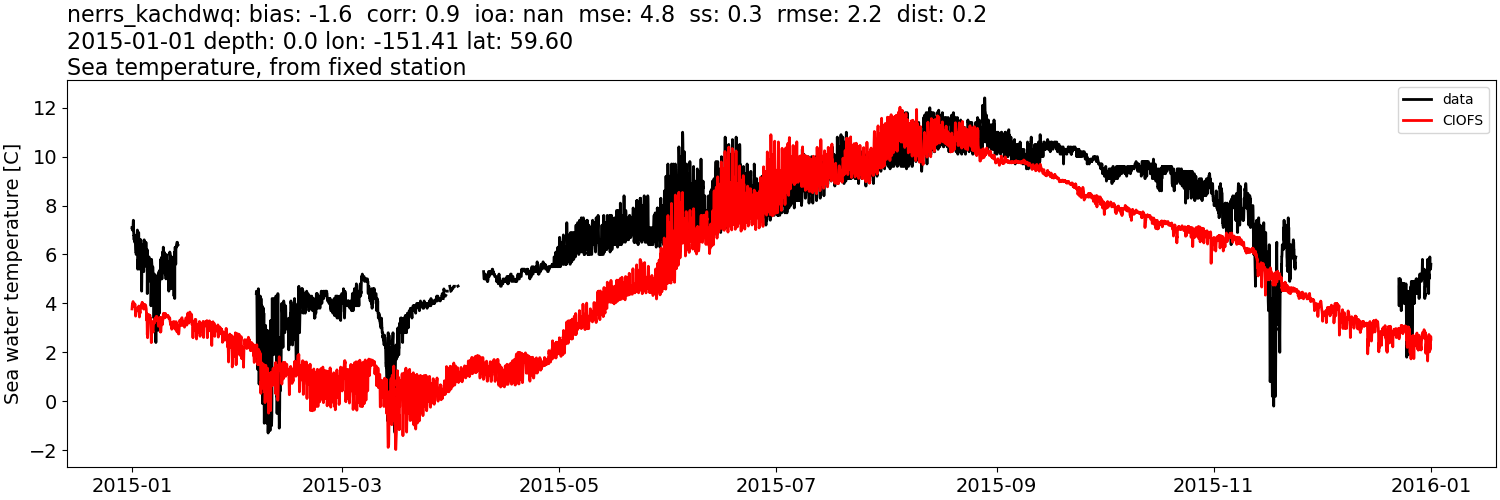
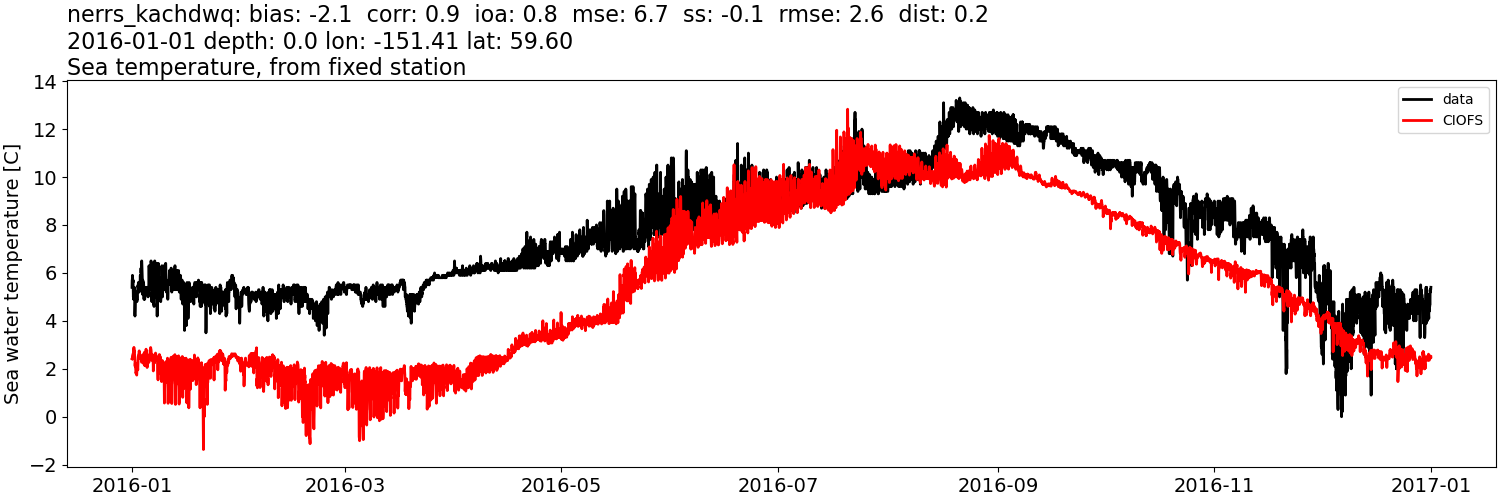
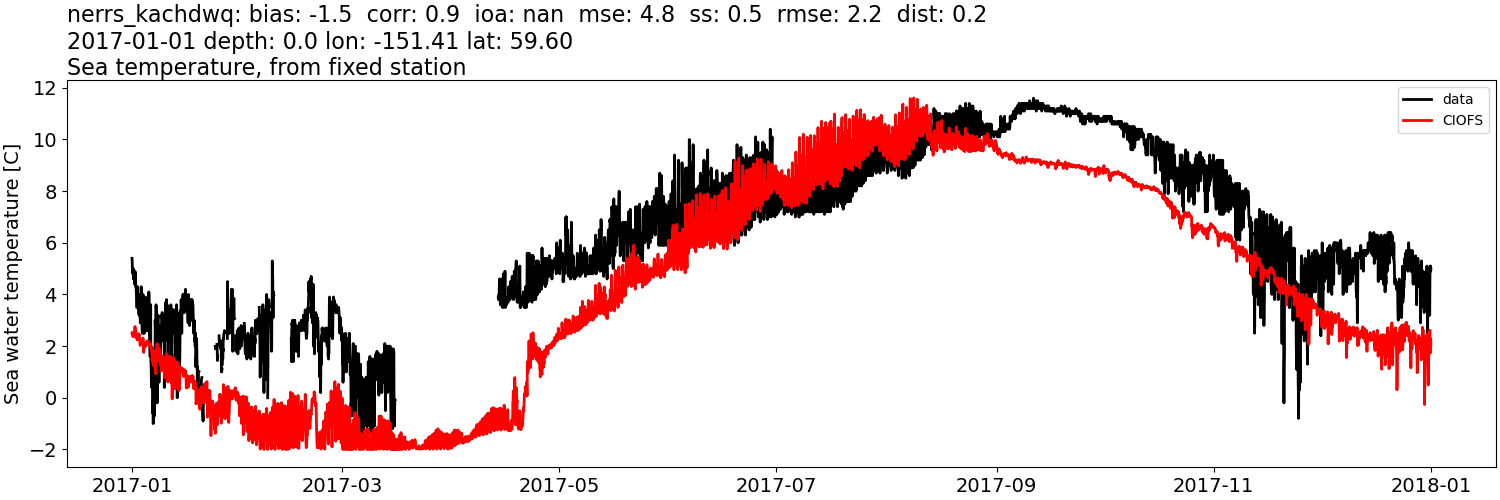
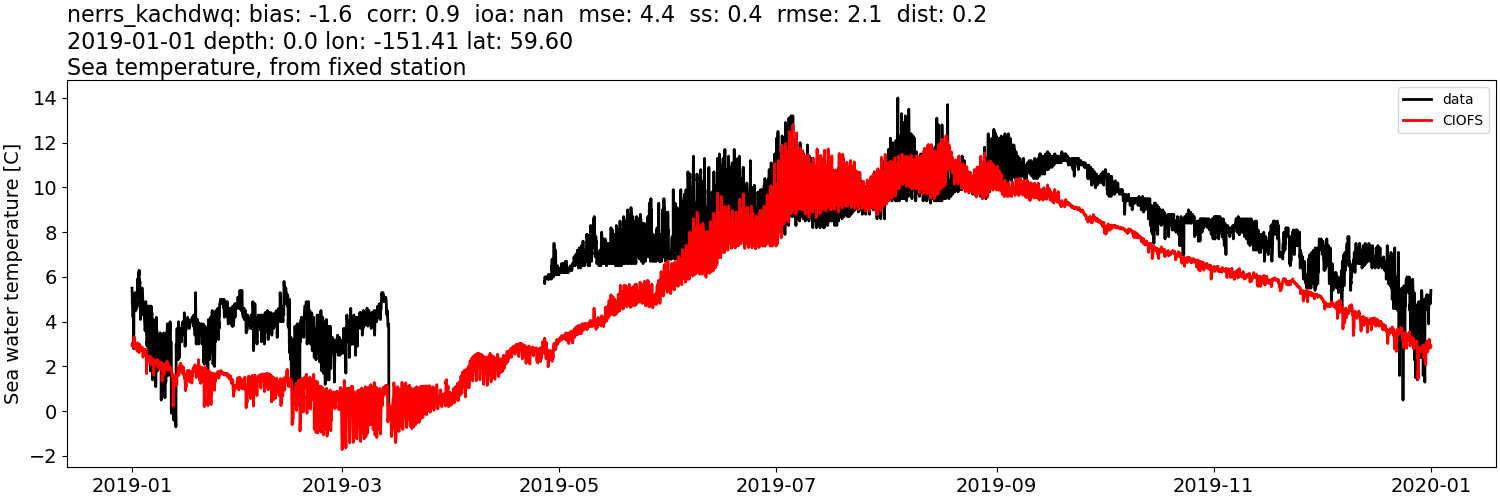
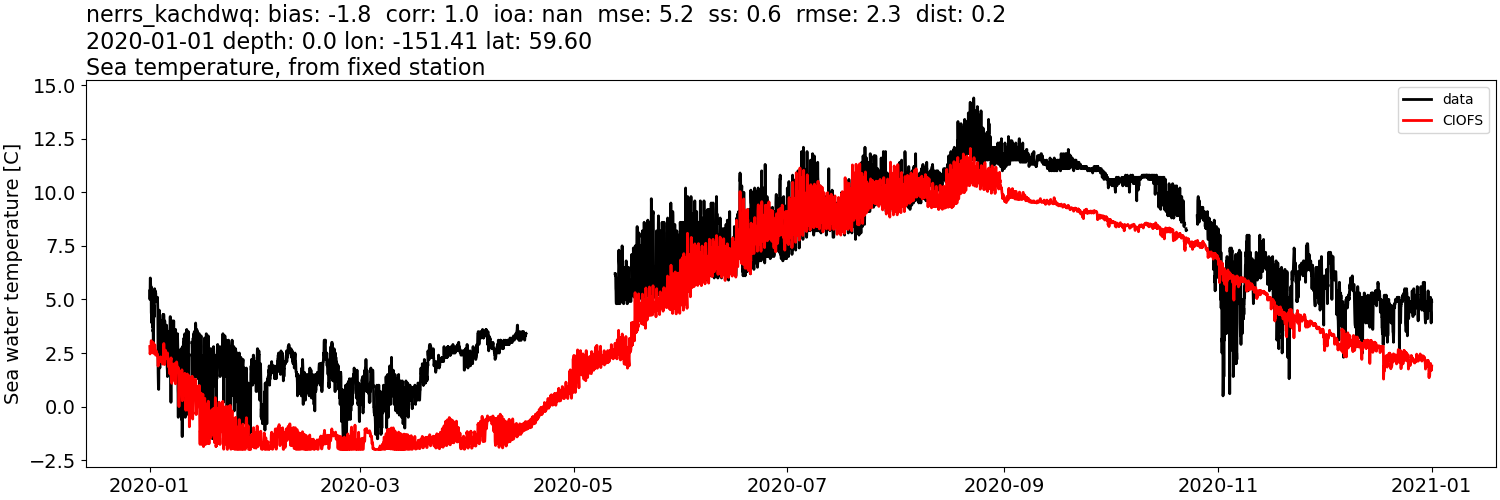
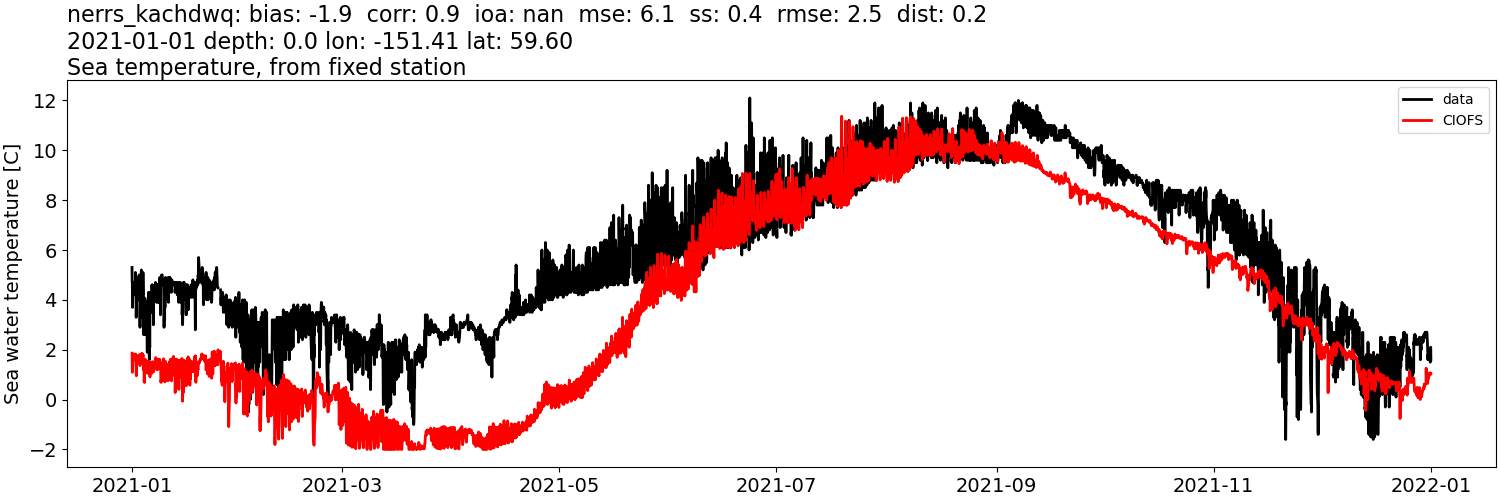
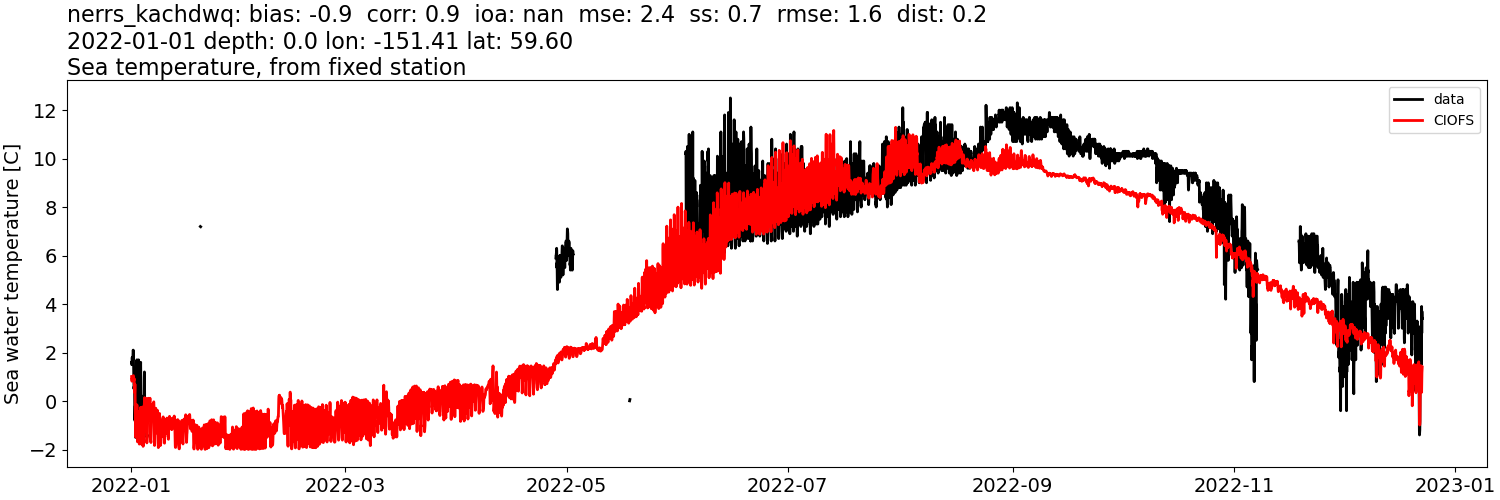
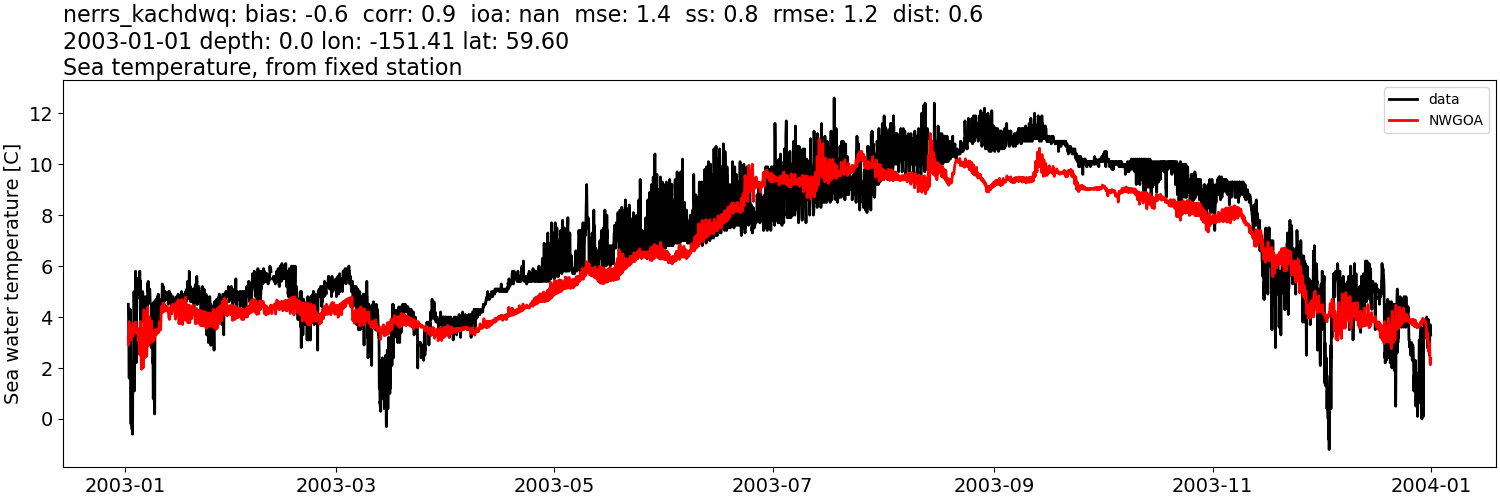
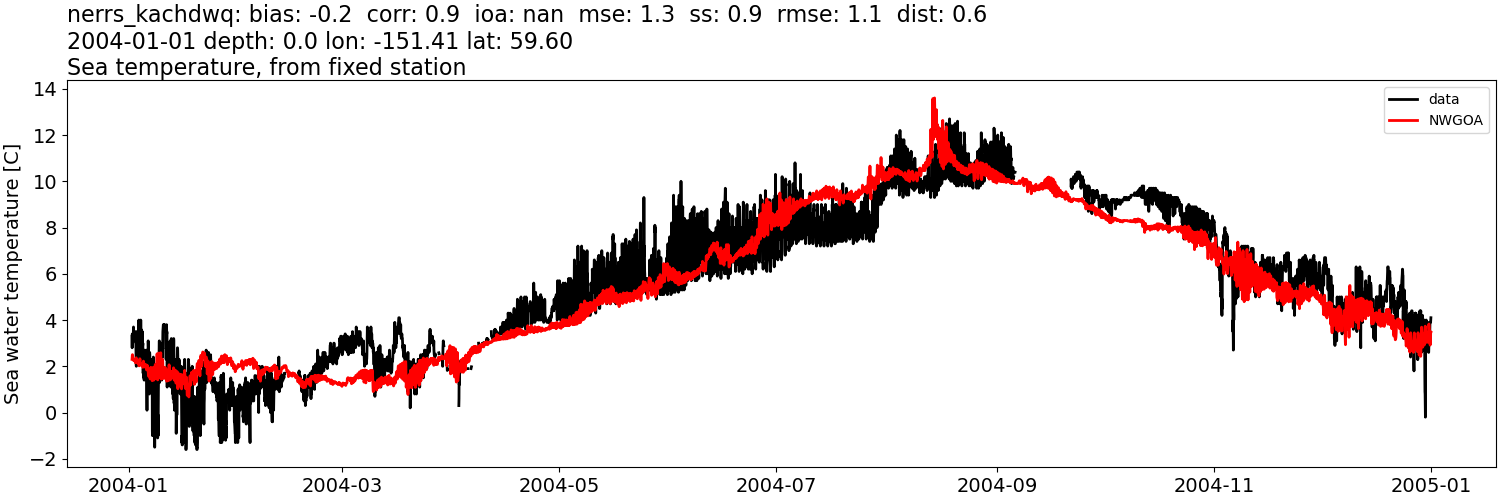
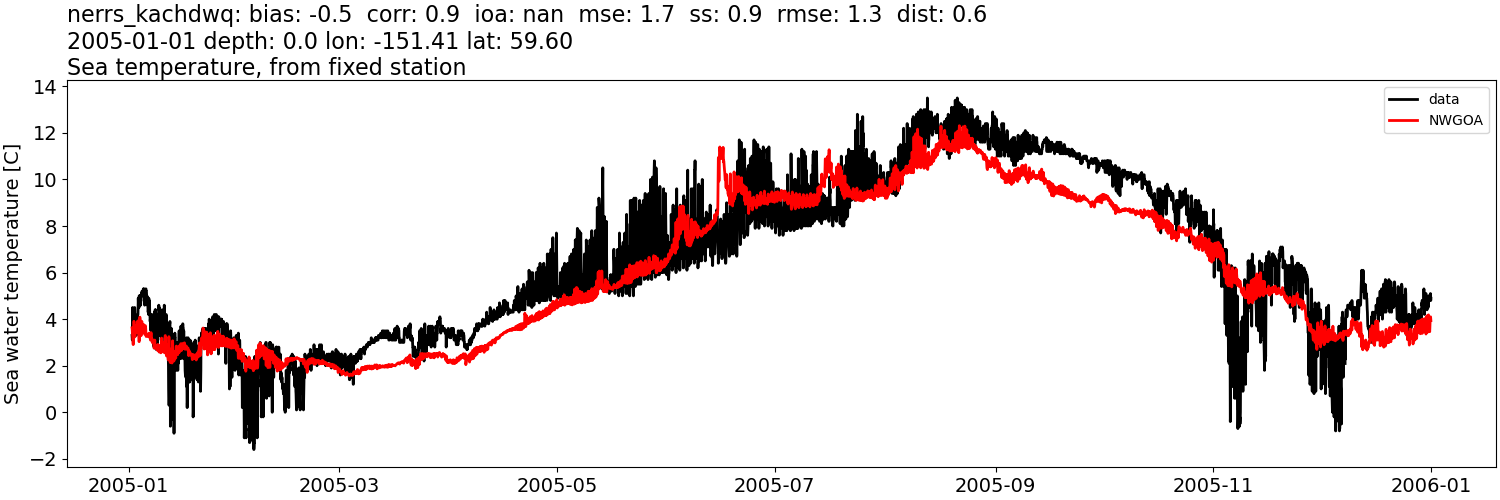
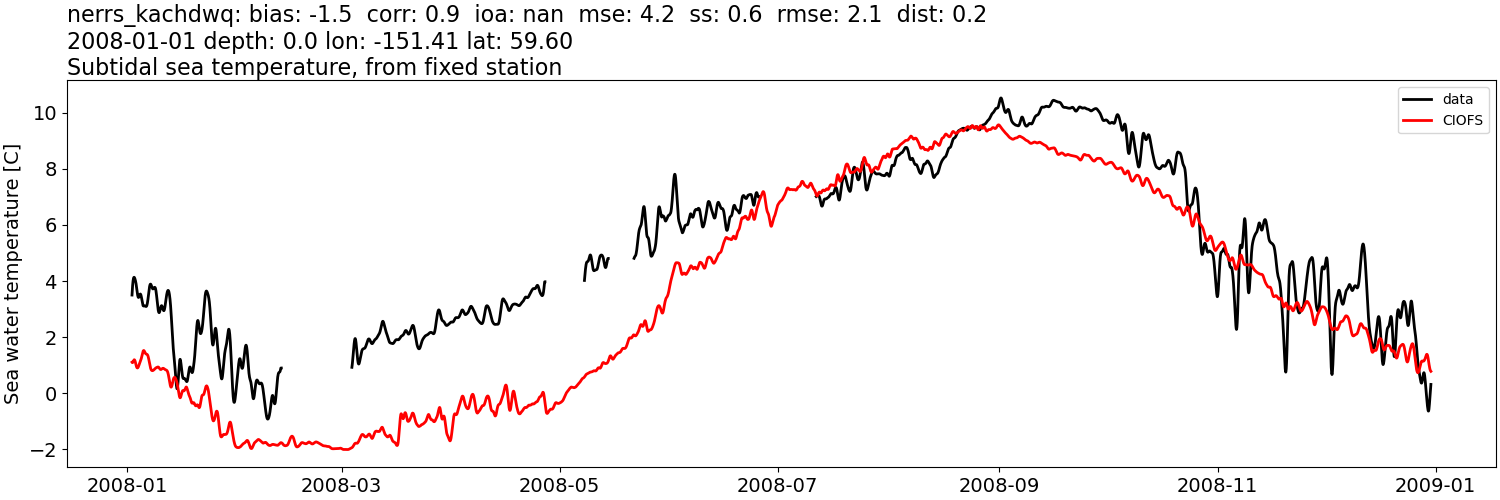
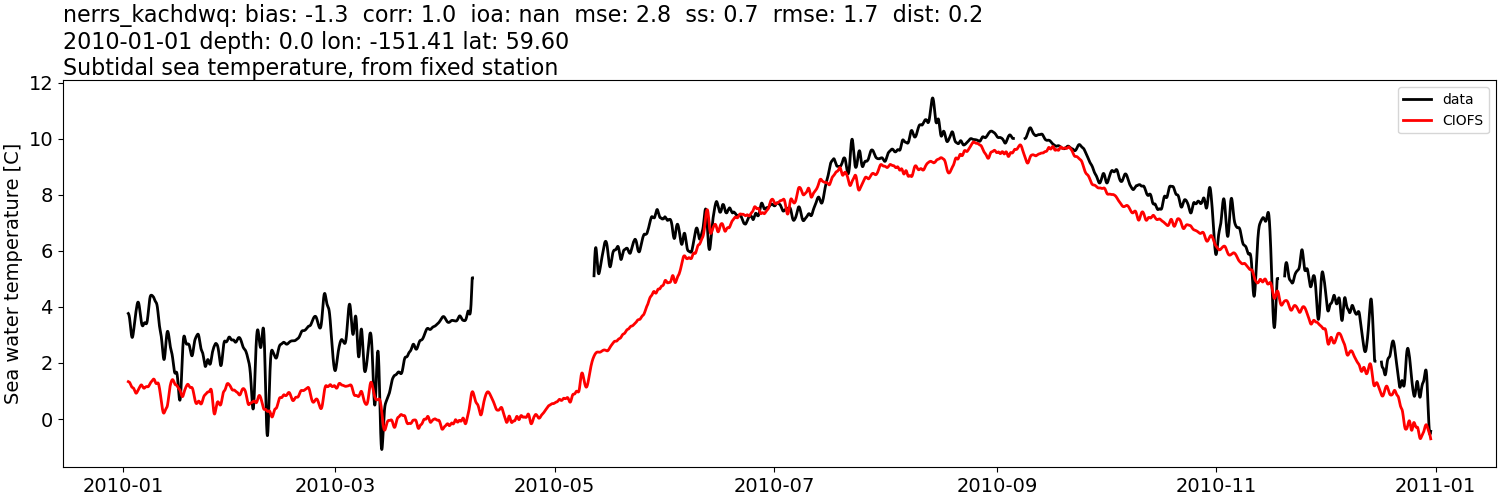
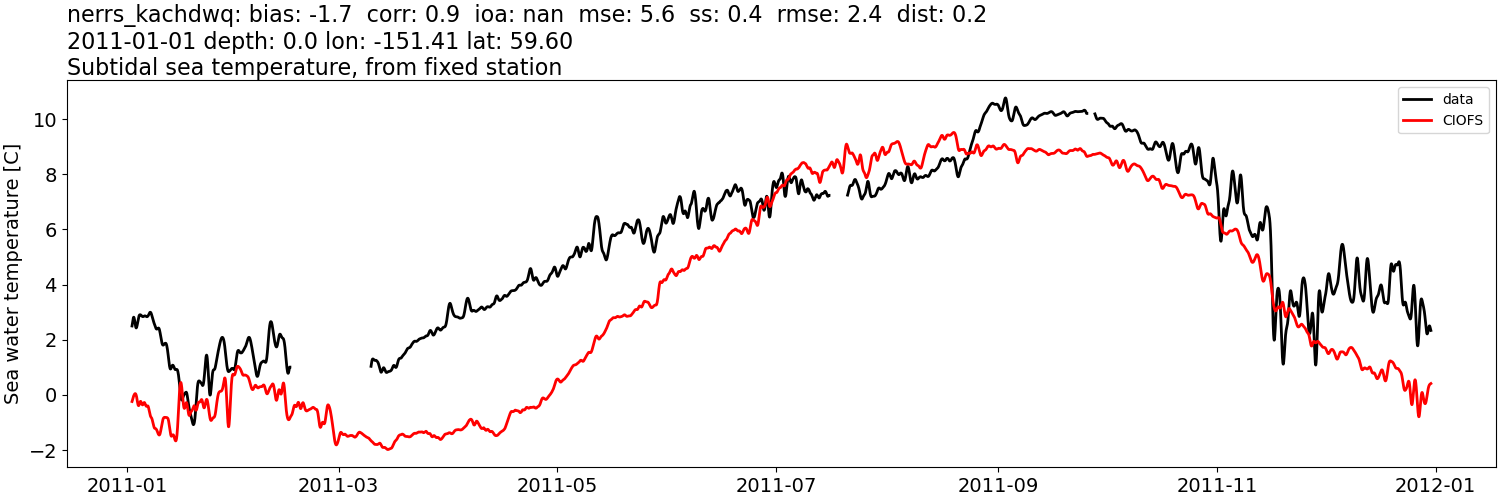
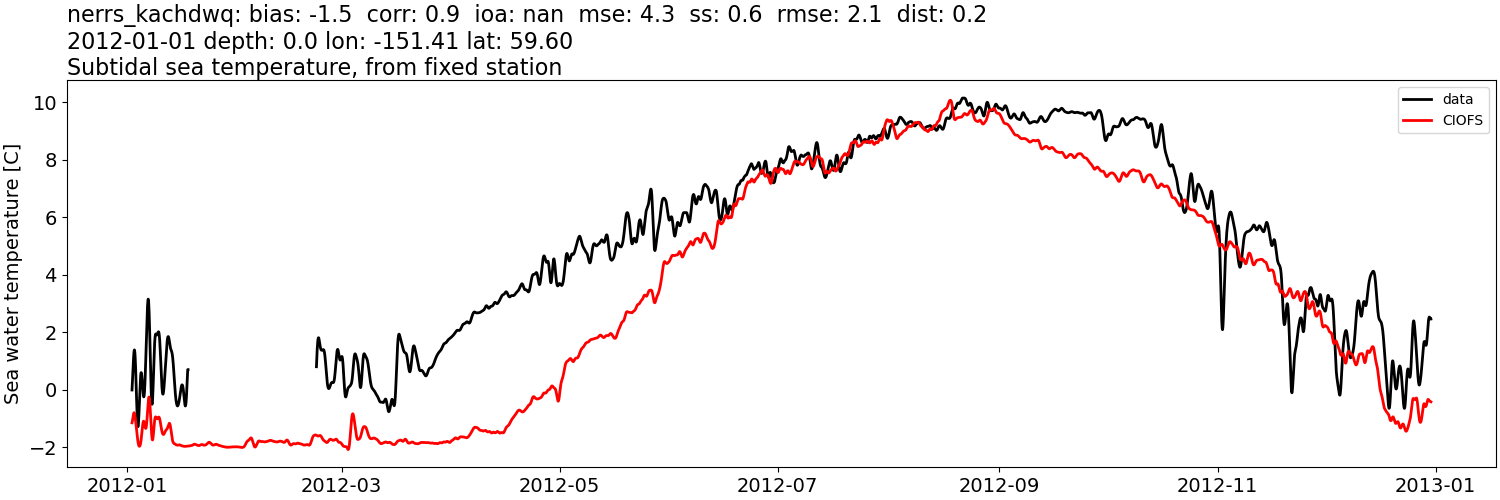
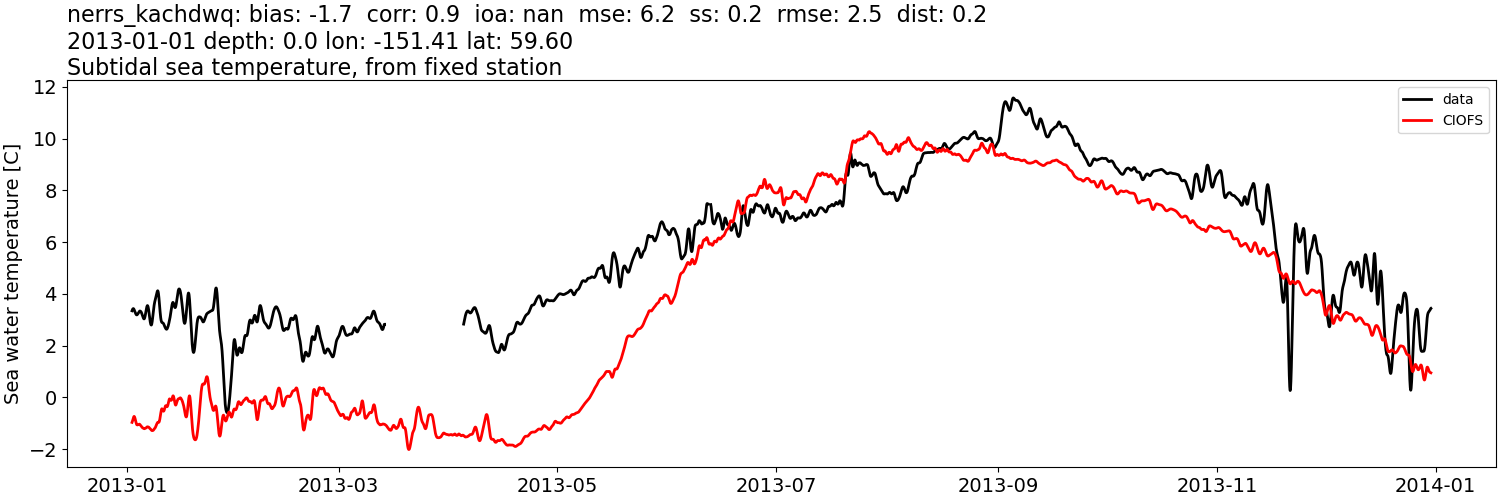
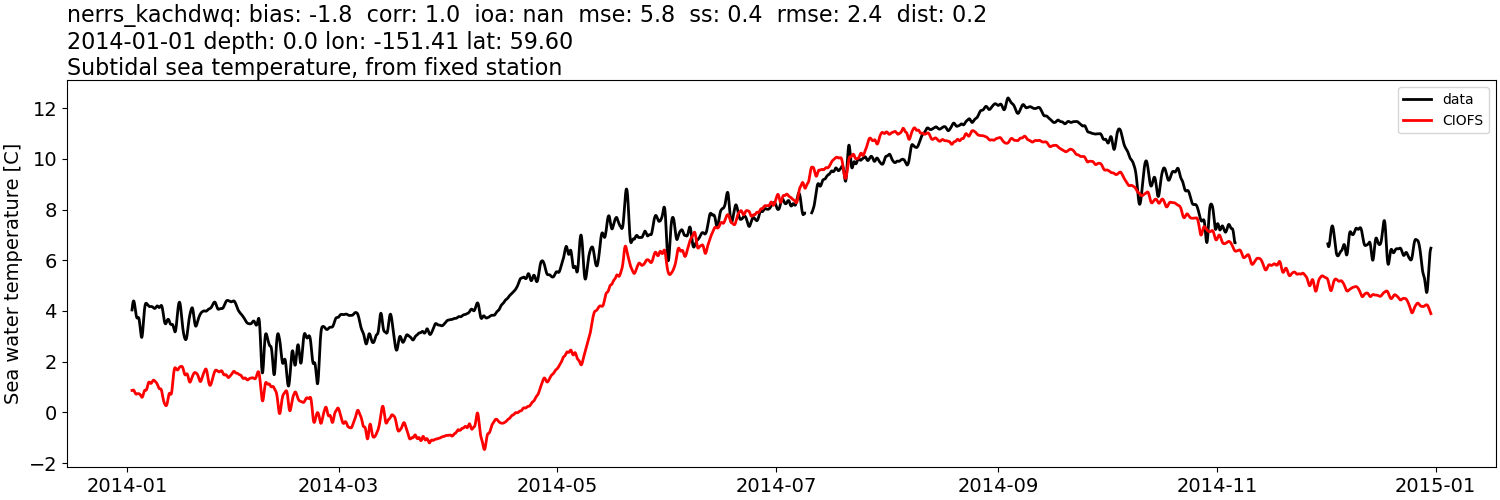
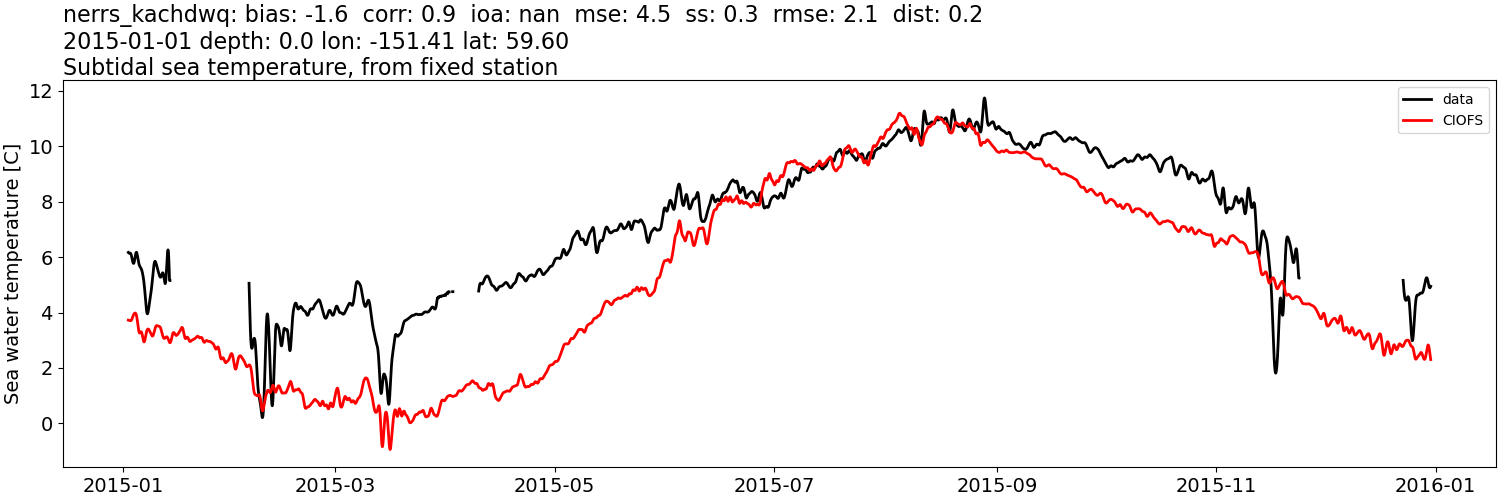
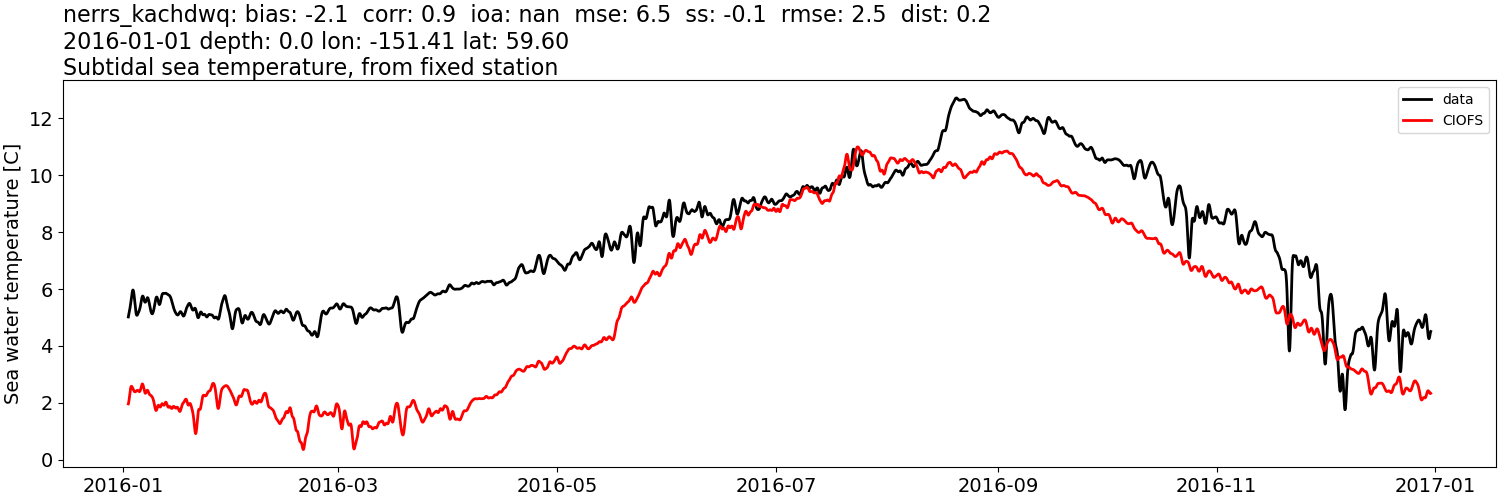
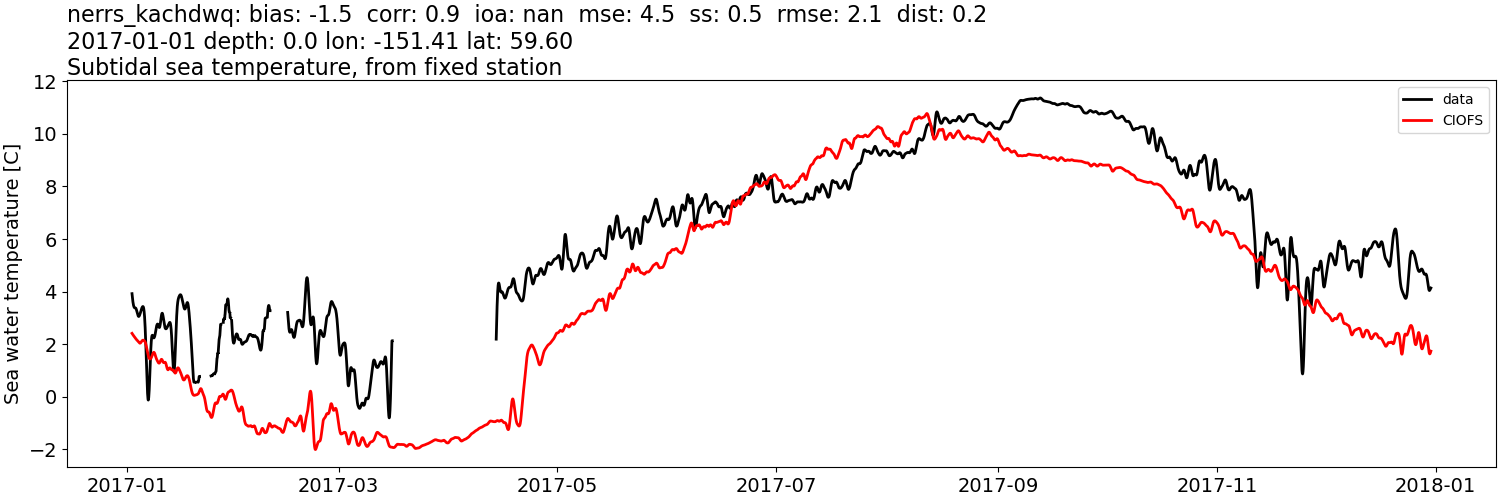
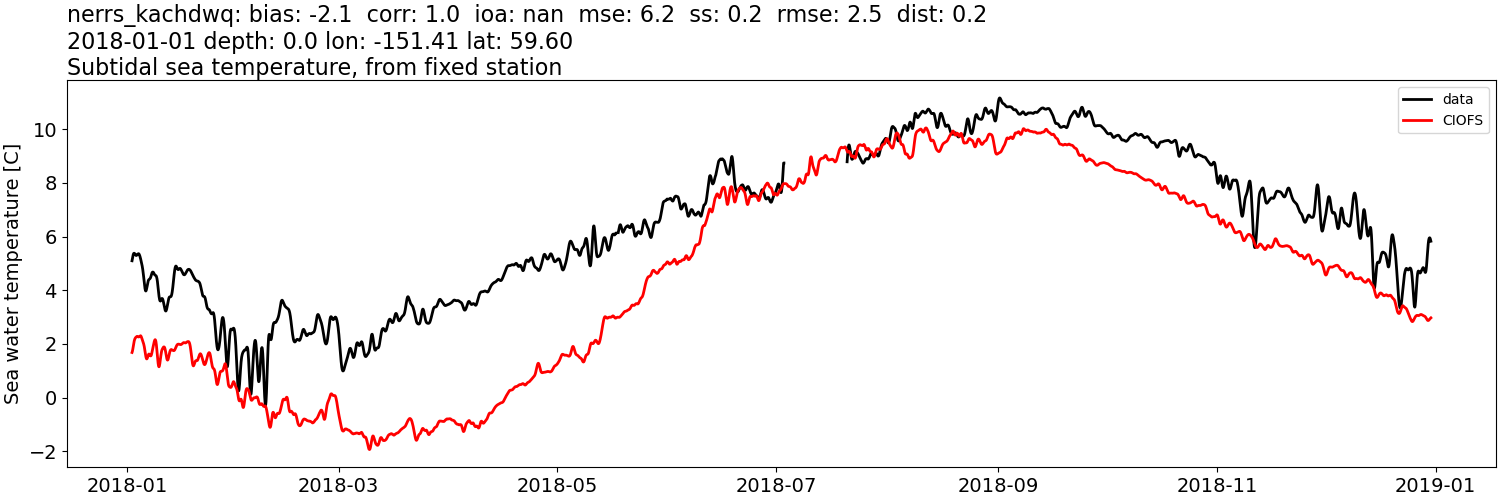
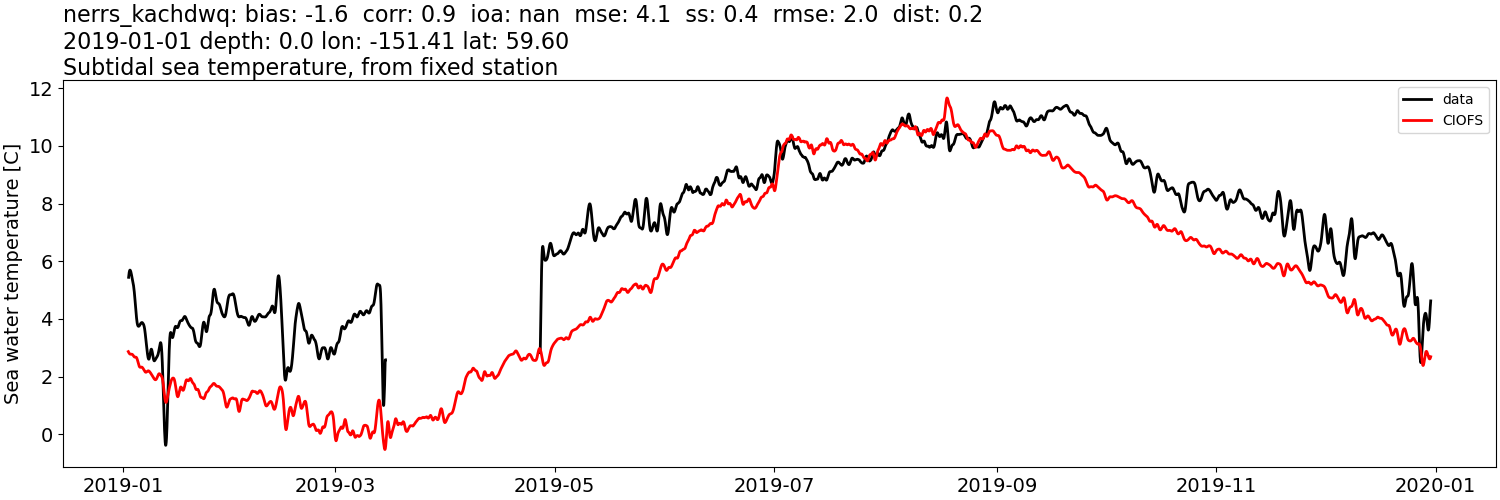
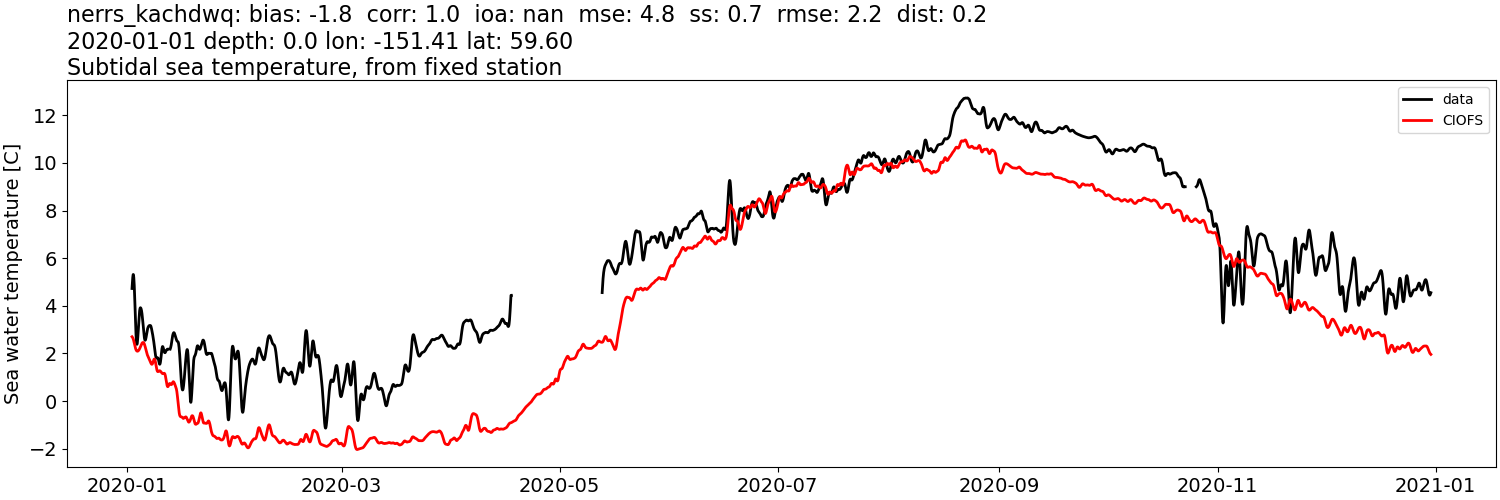
nerrs_kachdwq#
Sea water salinity:#
CIOFS#
Comparison plots by year
2003
2004
2005
2006
2007
2008
2009
2010
2011
2012
2013
2014
2015
2016
2017
2018
2019
2020
2021
2022
NWGOA#
Comparison plots by year
2003
2004
2005
2006
2007
2008
Sea water salinity: tidally-filtered#
CIOFS#
Comparison plots by year
2003
2004
2005
2006
2007
2008
2009
2010
2011
2012
2013
2014
2015
2016
2017
2018
2019
2020
2021
2022
NWGOA#
Comparison plots by year
2003
2004
2005

2006
2007
2008
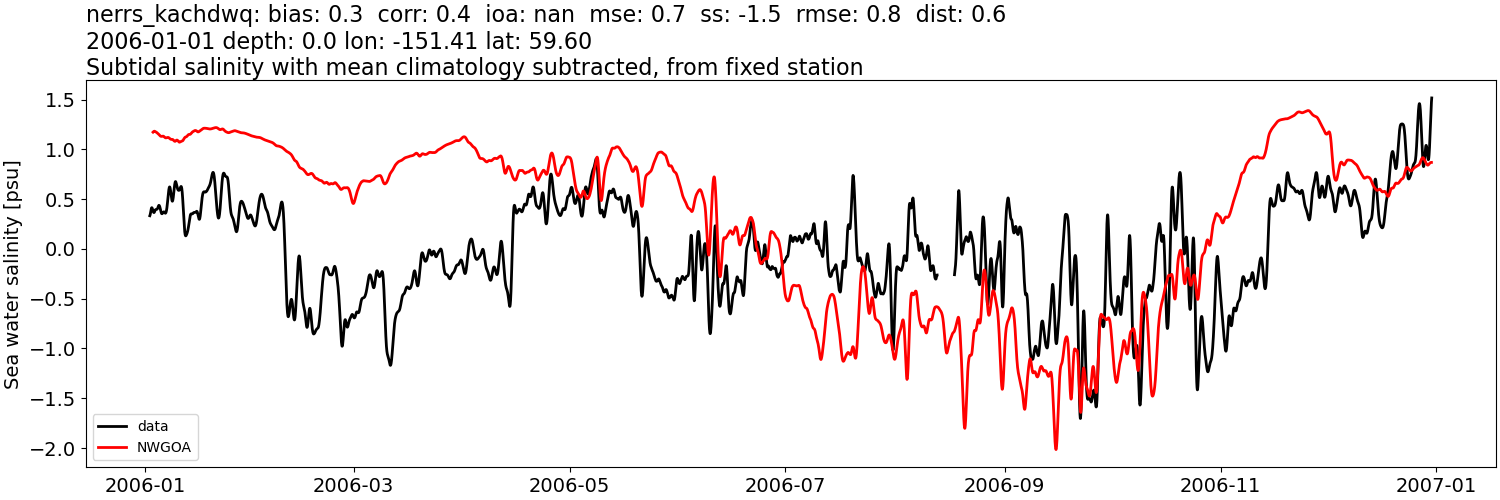
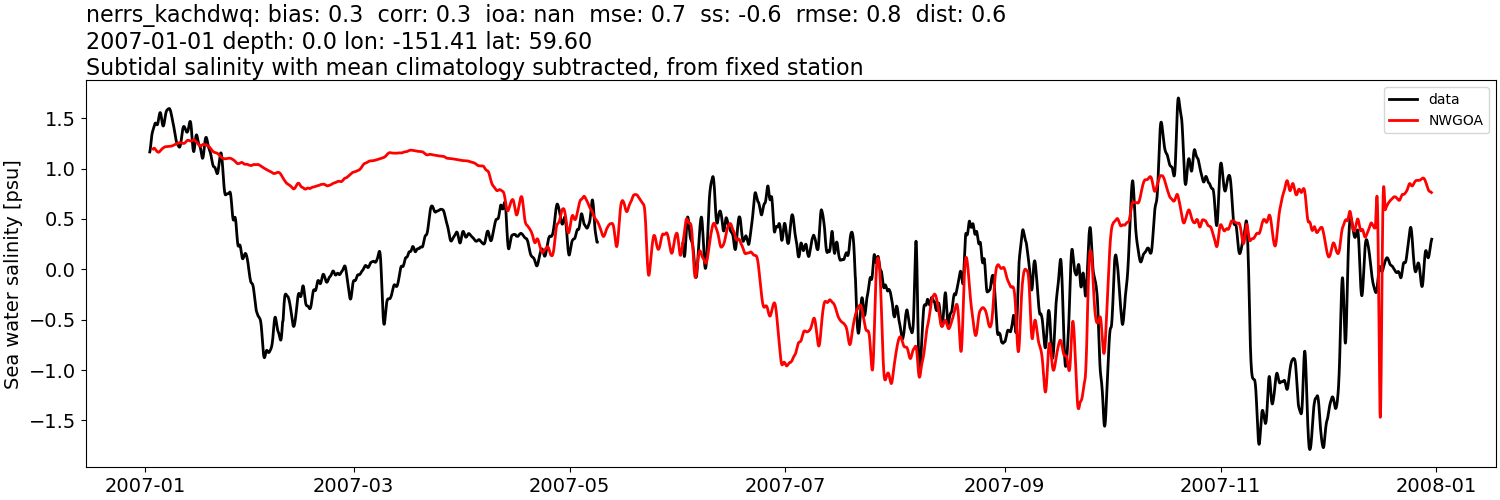
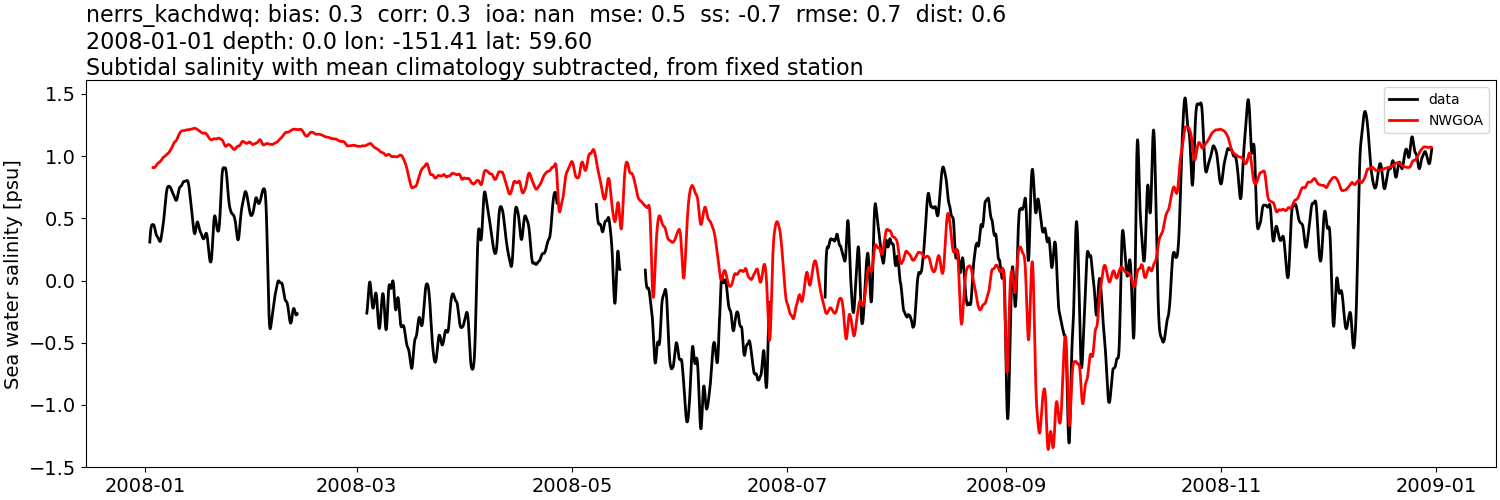
Sea water salinity: tidally-filtered, then monthly mean from data subtracted#
CIOFS#
Comparison plots by year
2003
2004
2005
2006
2007
2008
2009
2010
2011
2012
2013
2014
2015
2016
2017
2018
2019
2020
2021
2022
NWGOA#
Comparison plots by year
2003
2004
2005
2006
2007
2008
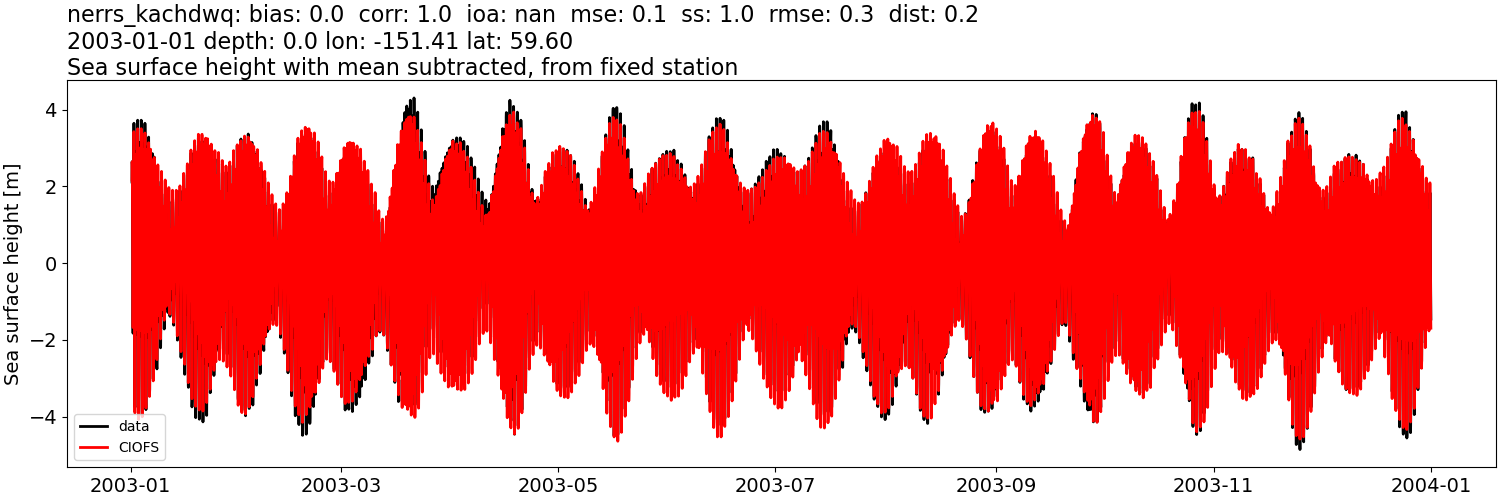
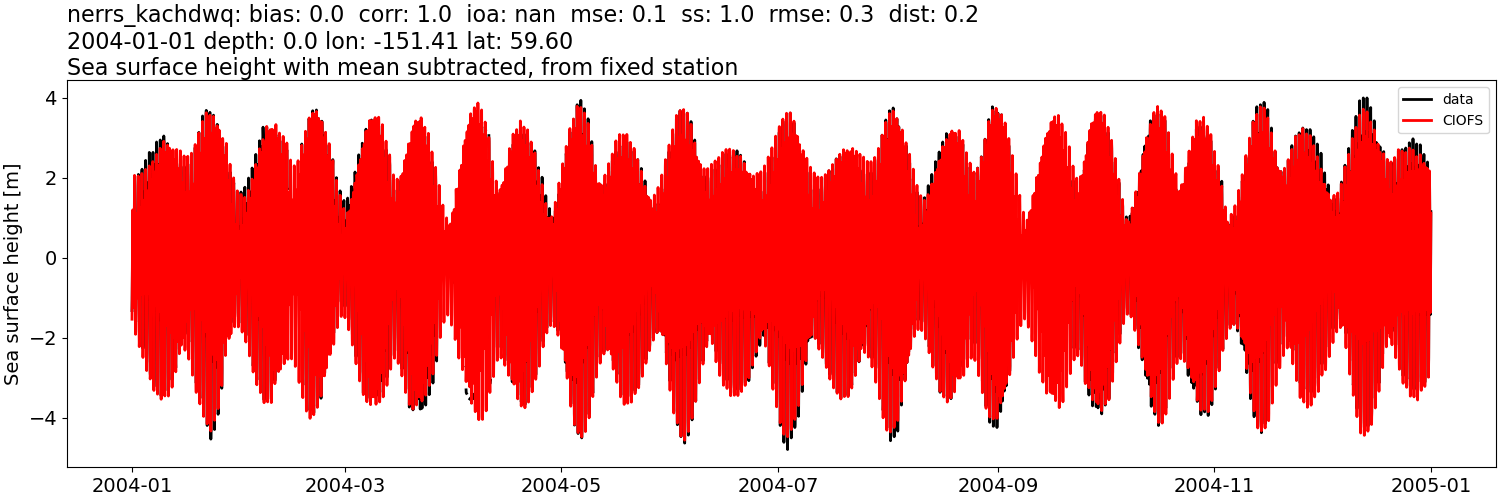
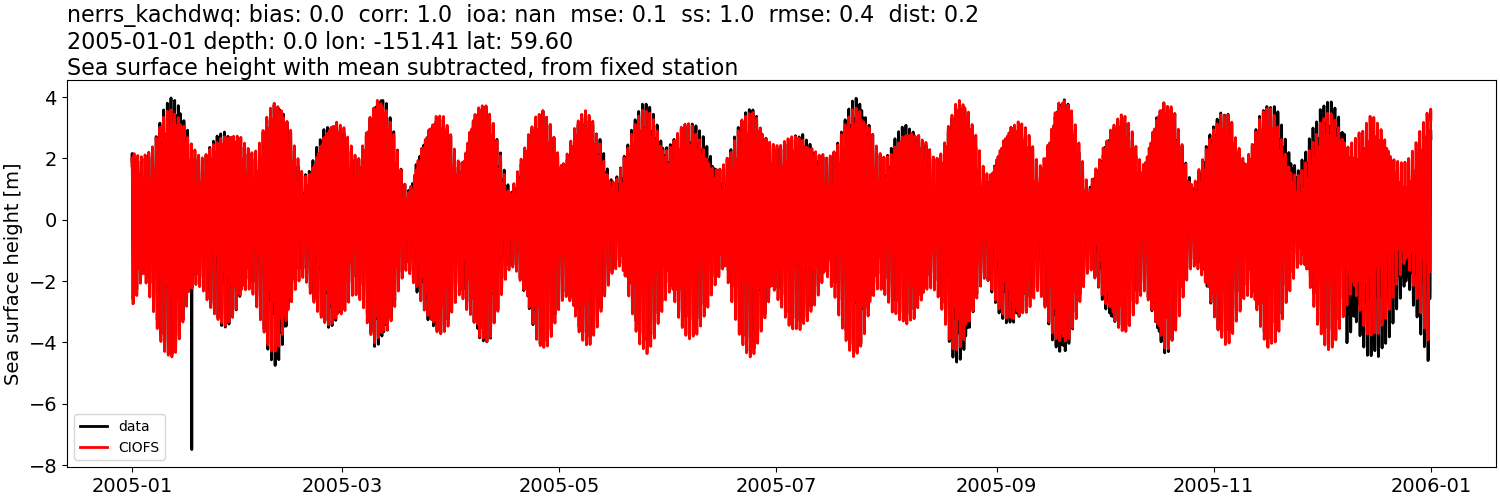
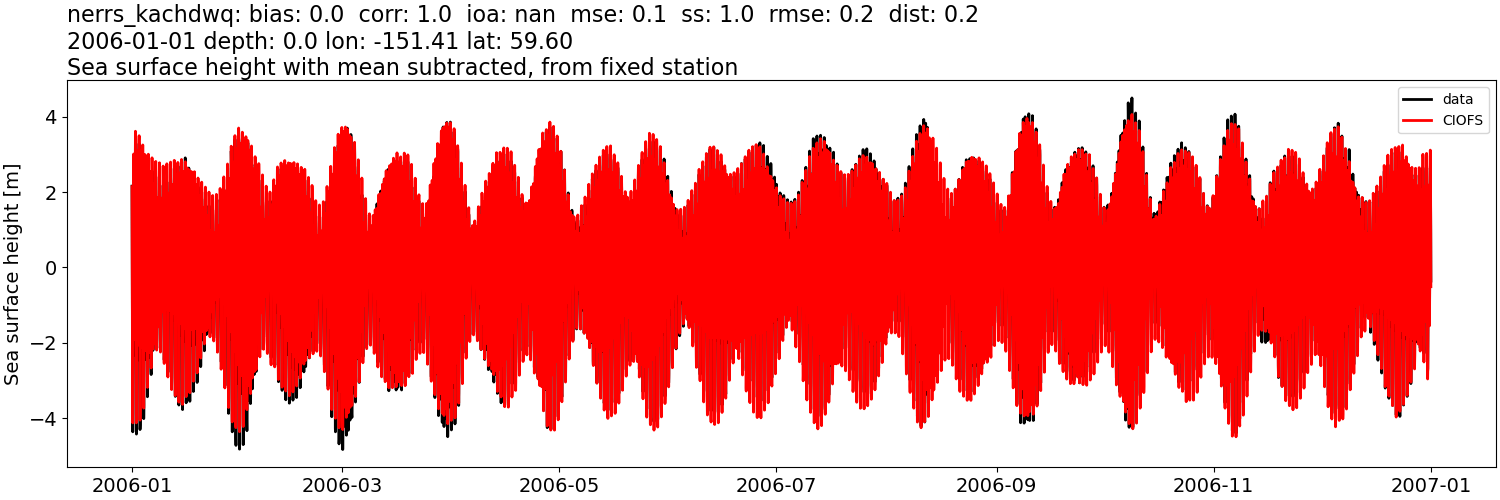
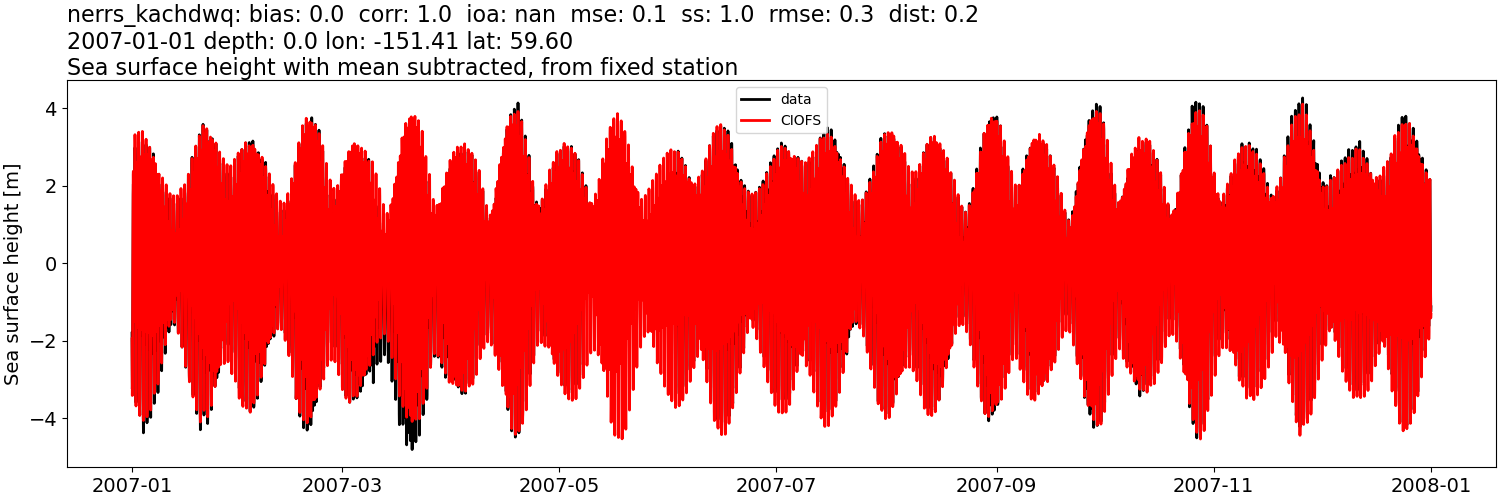
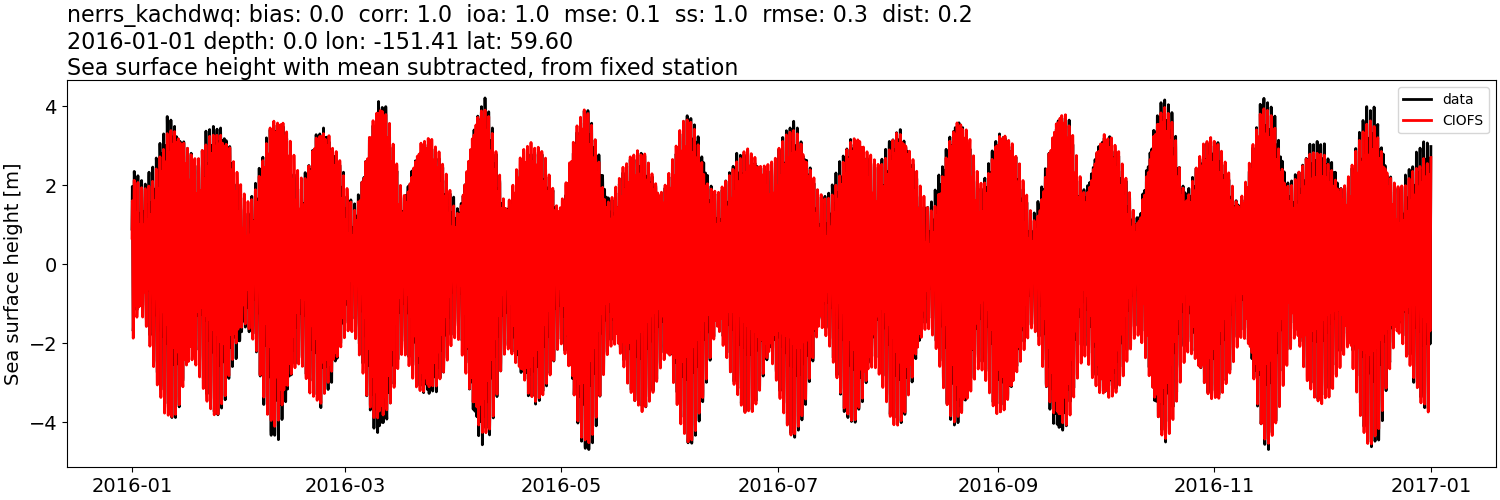
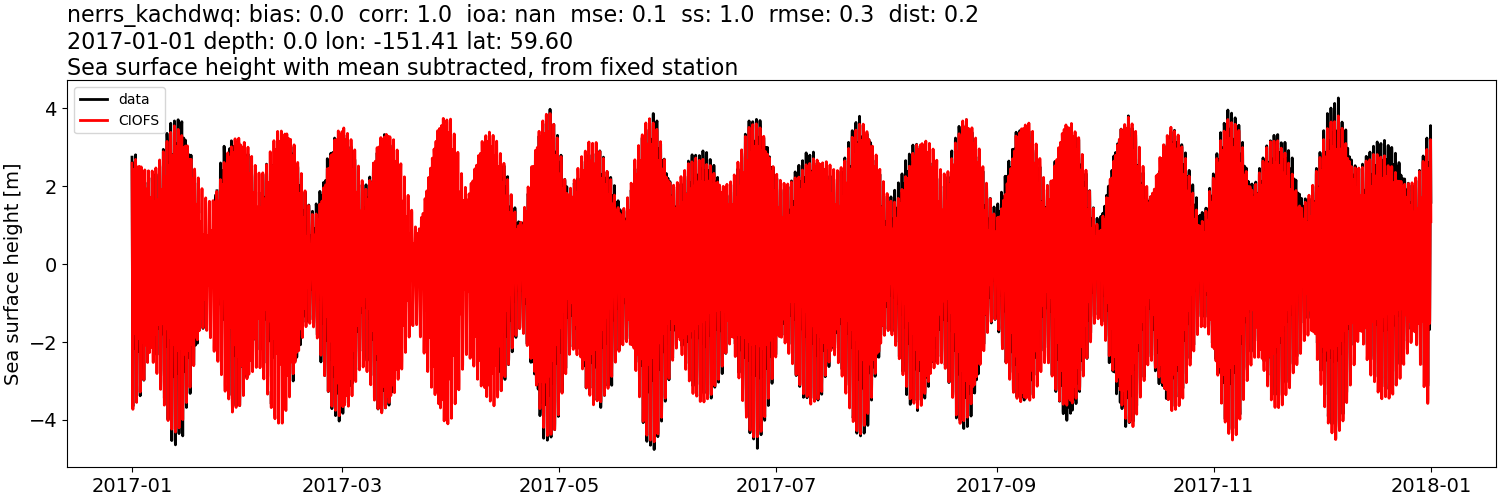
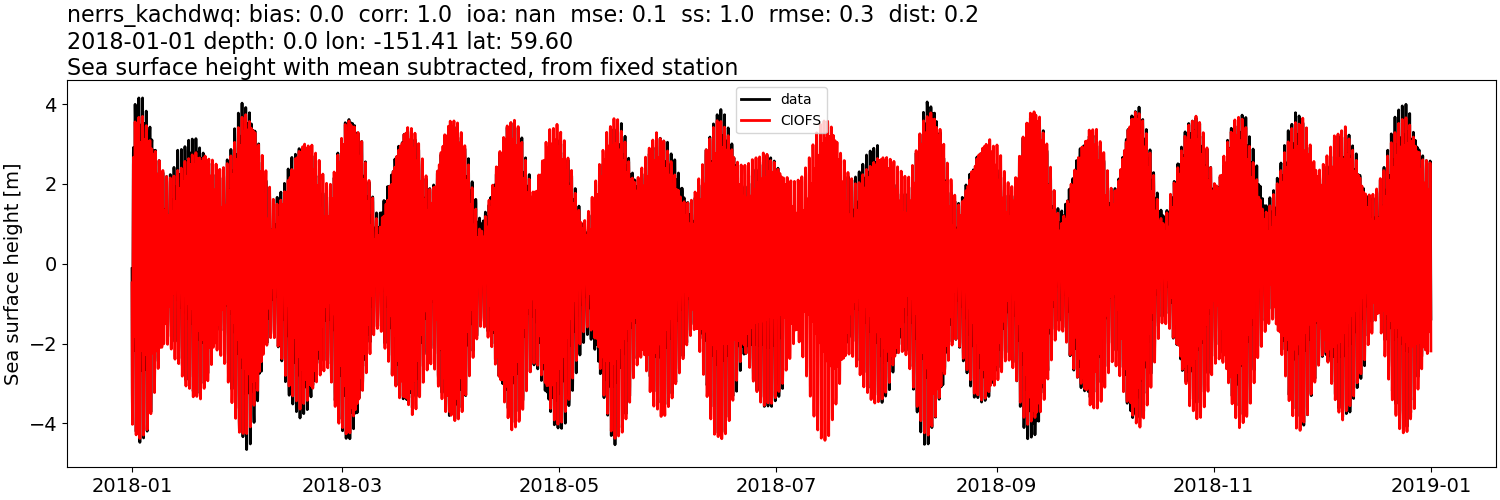
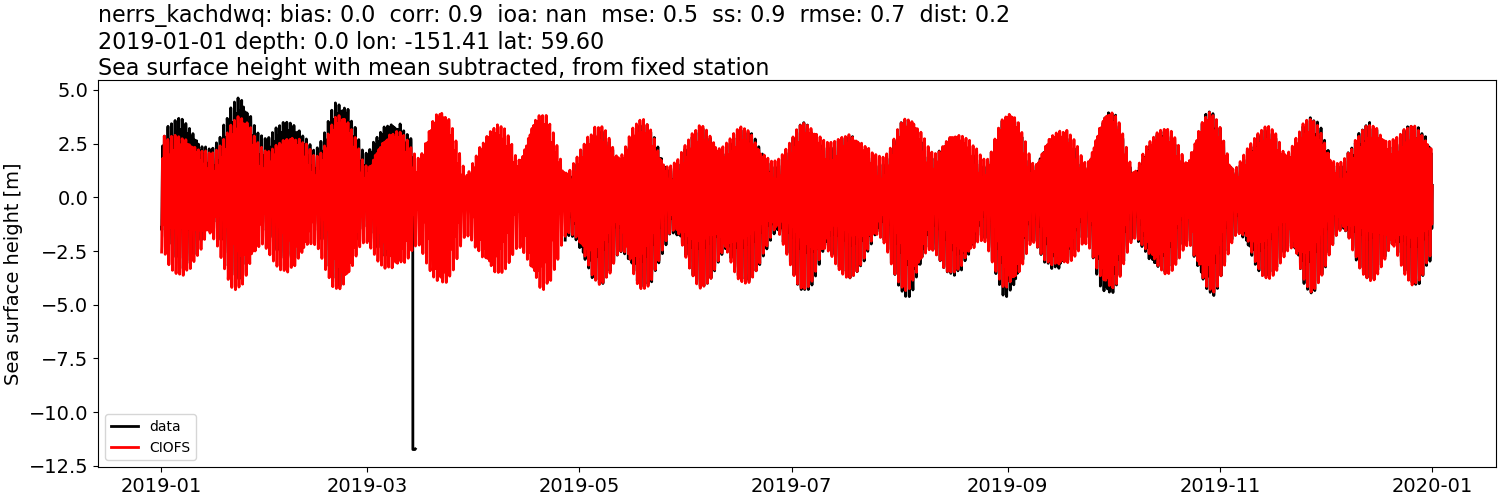
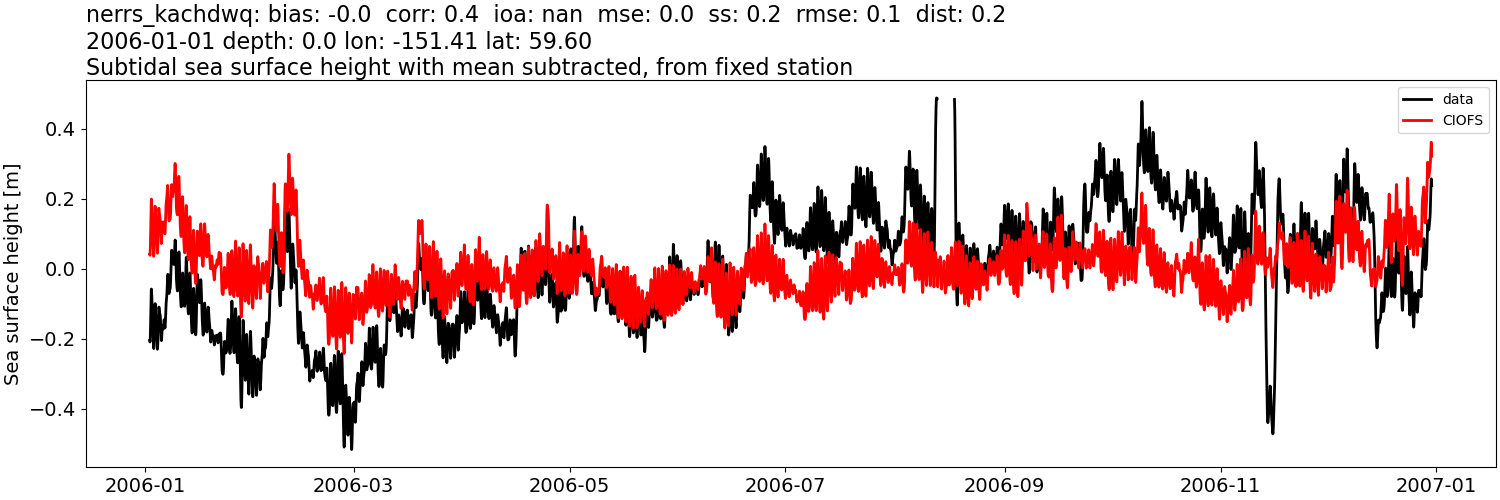
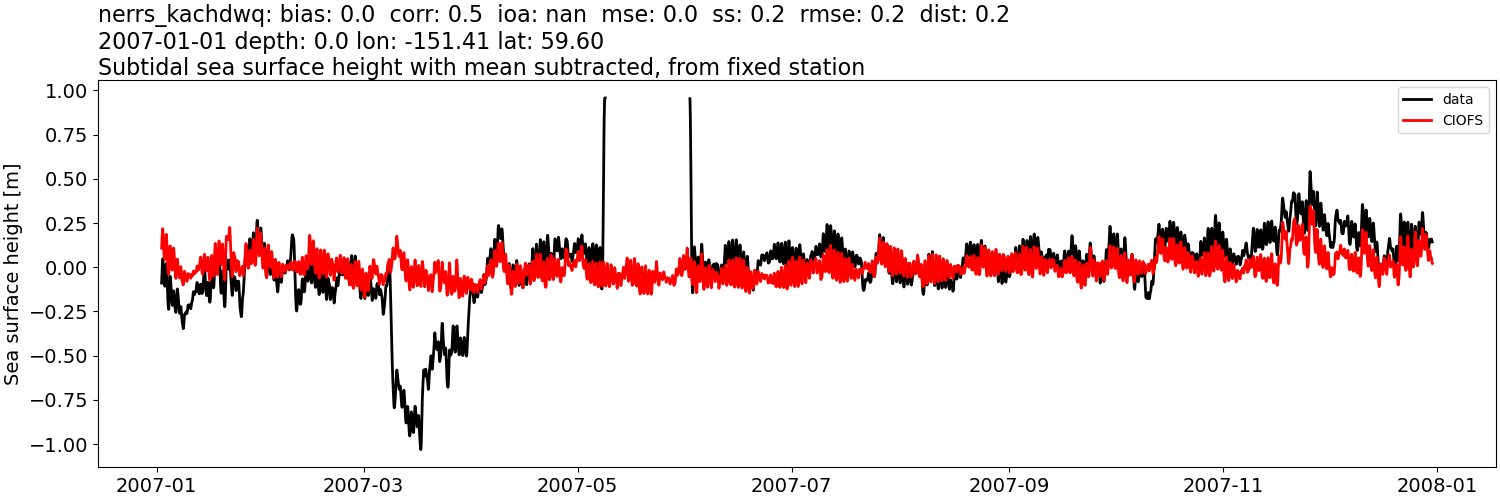
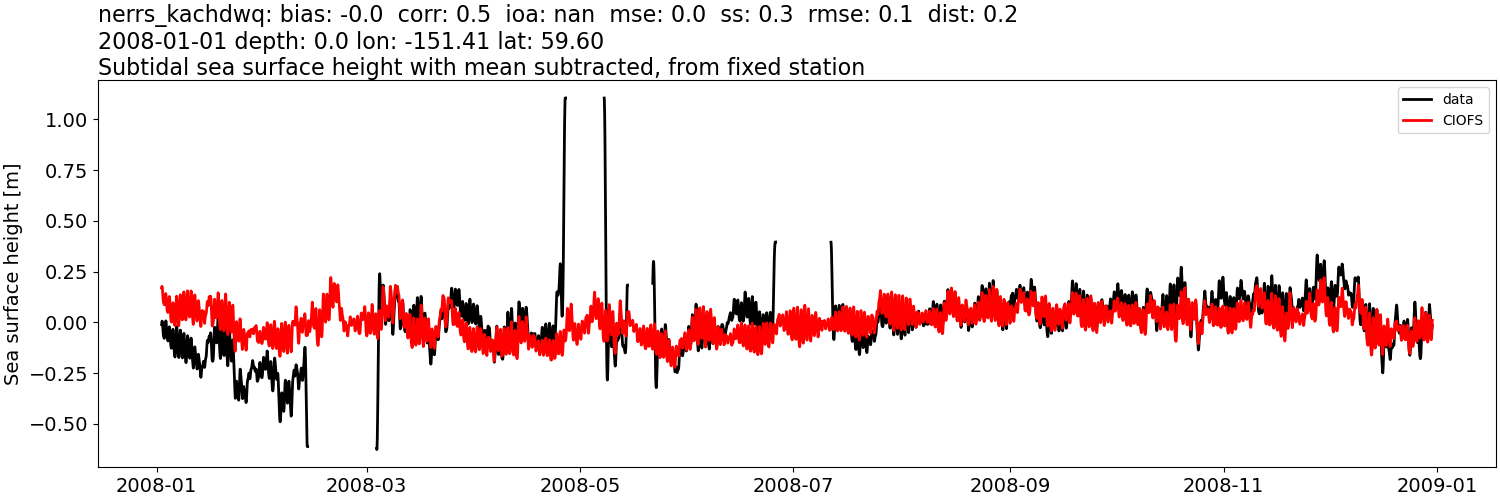
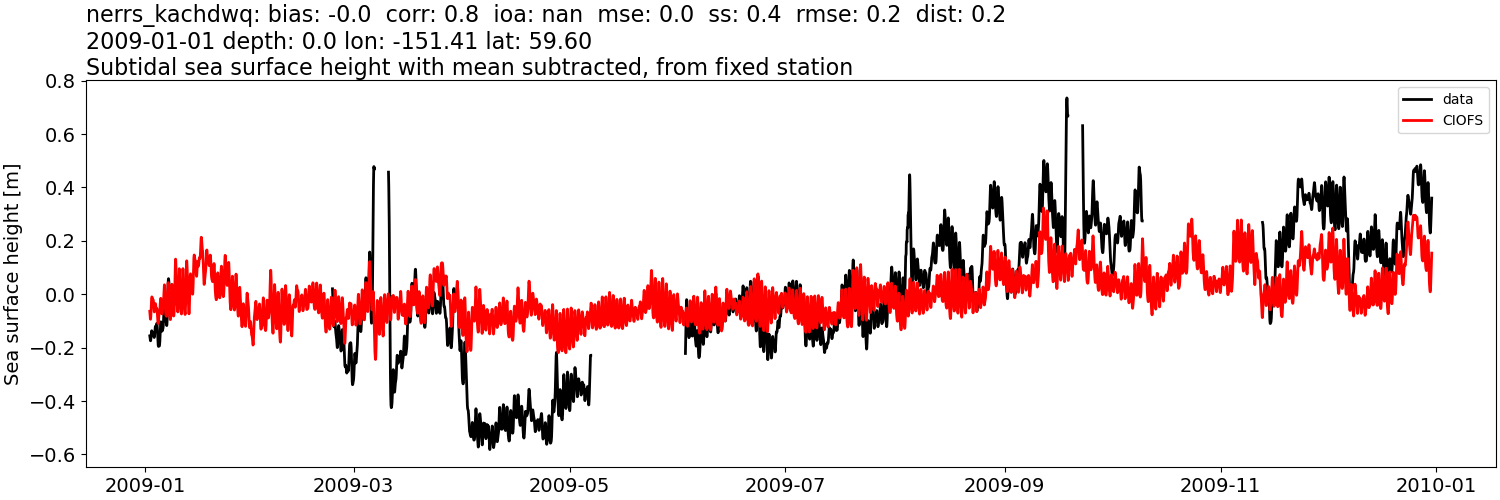
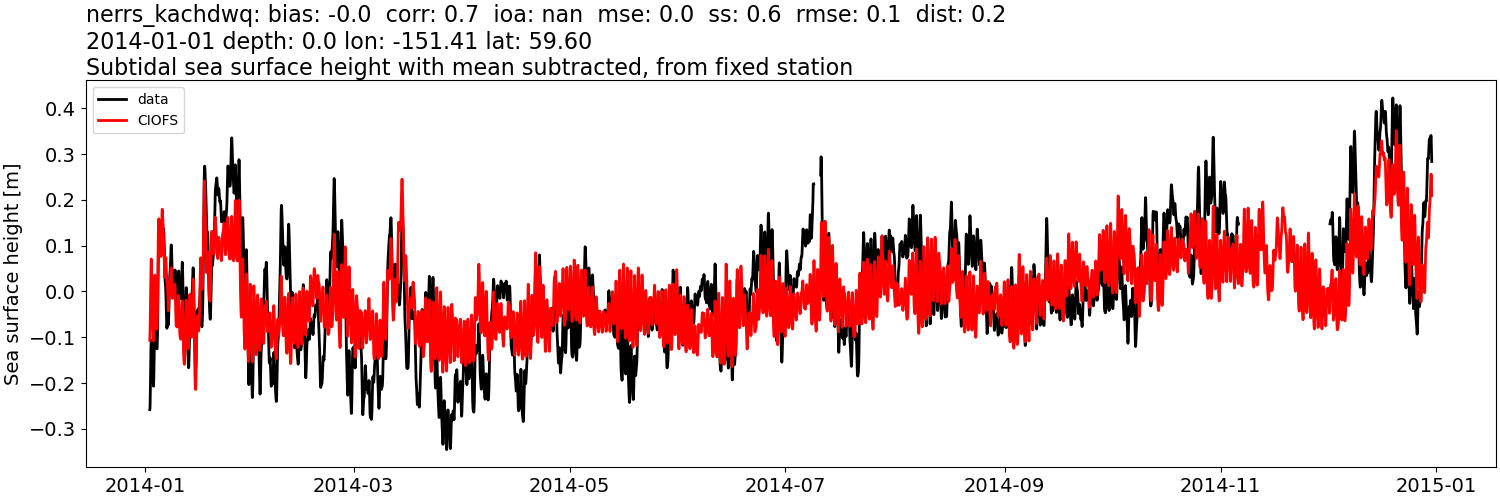
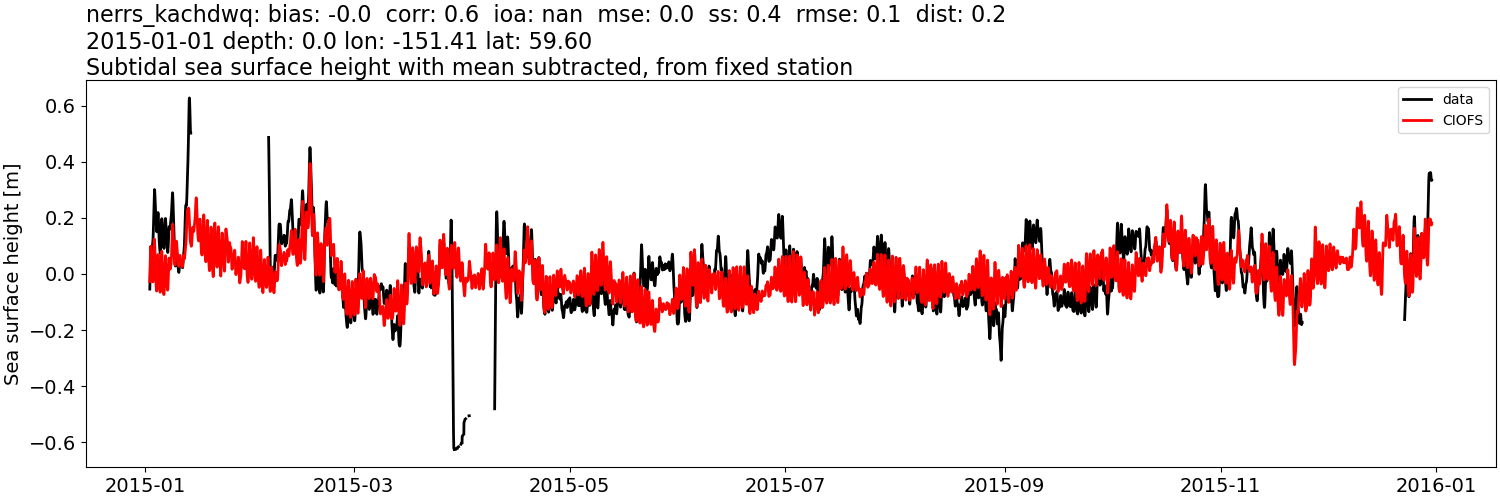
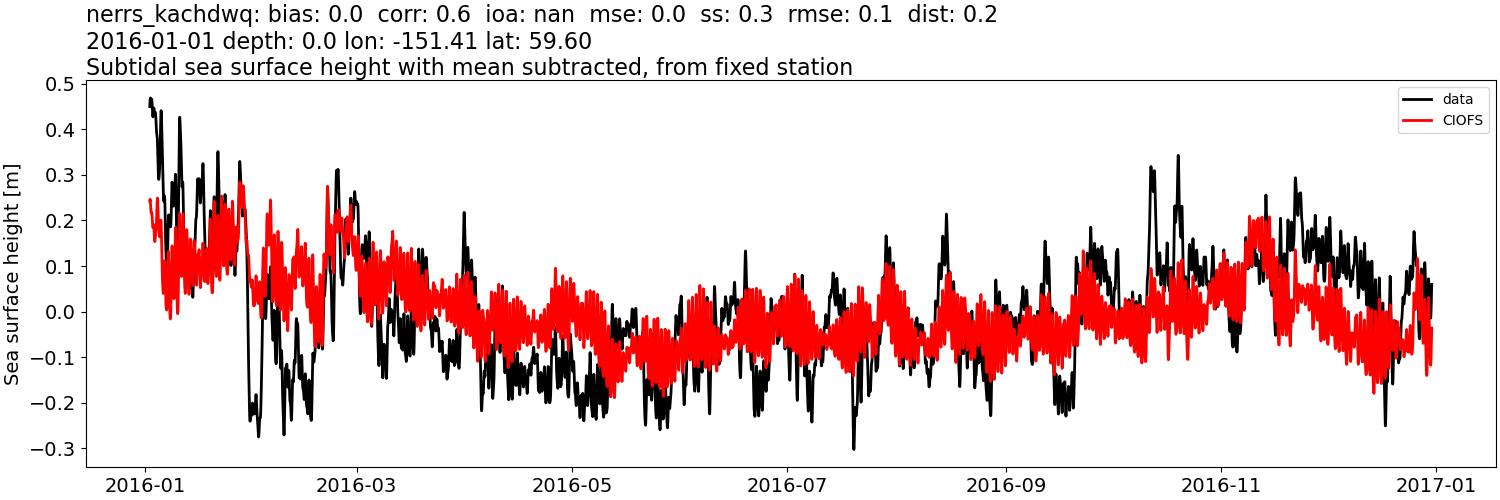
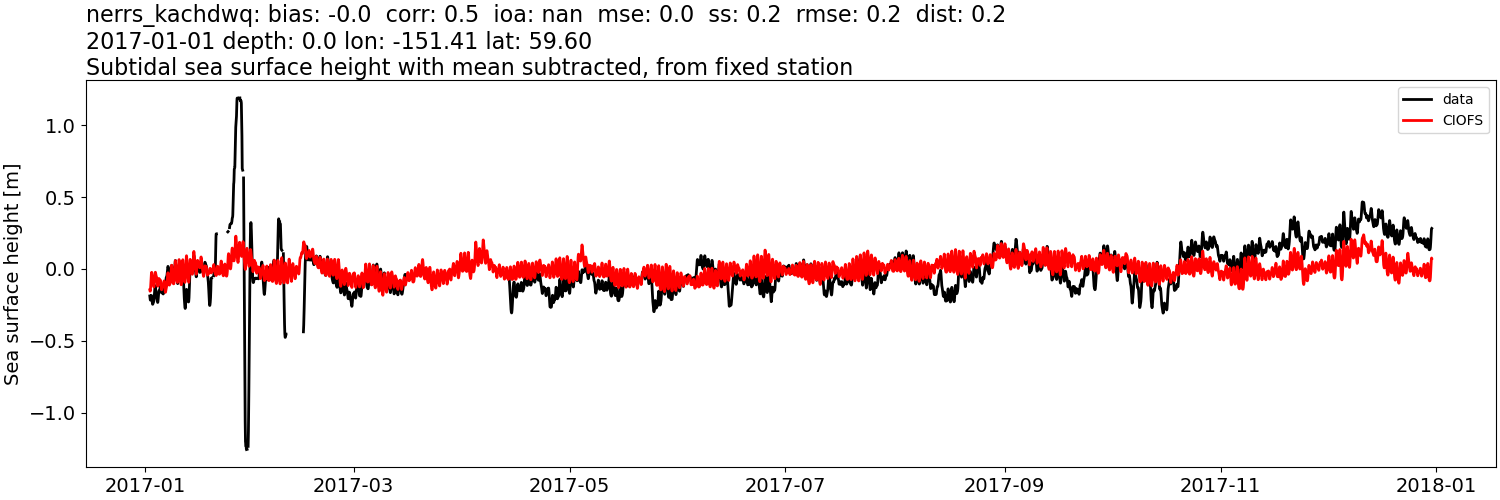
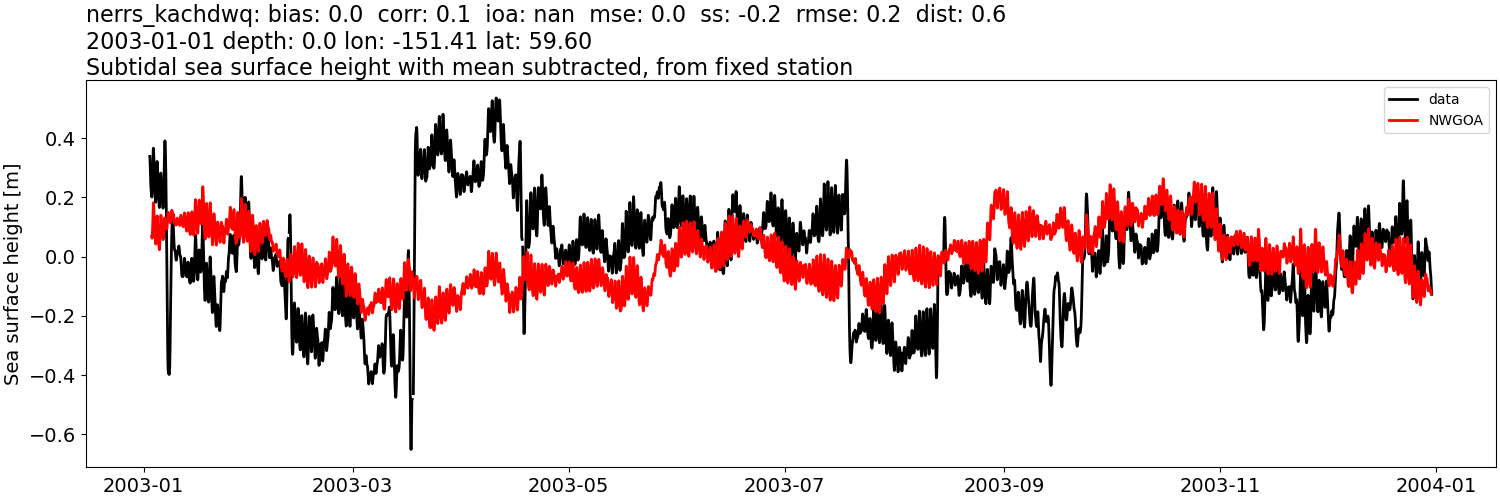
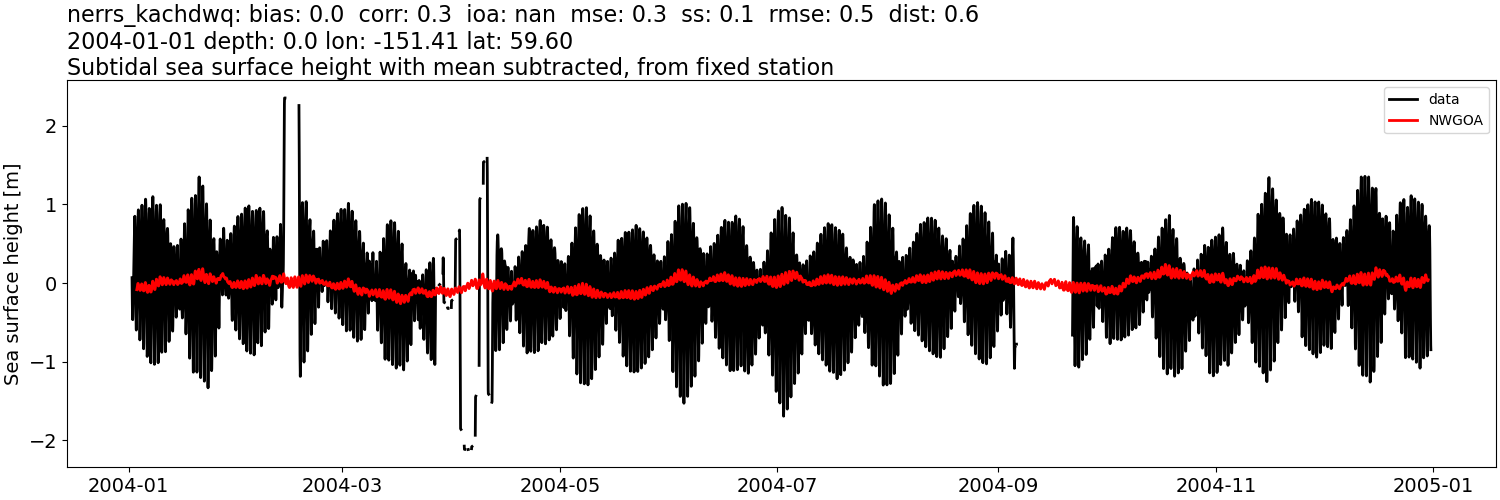
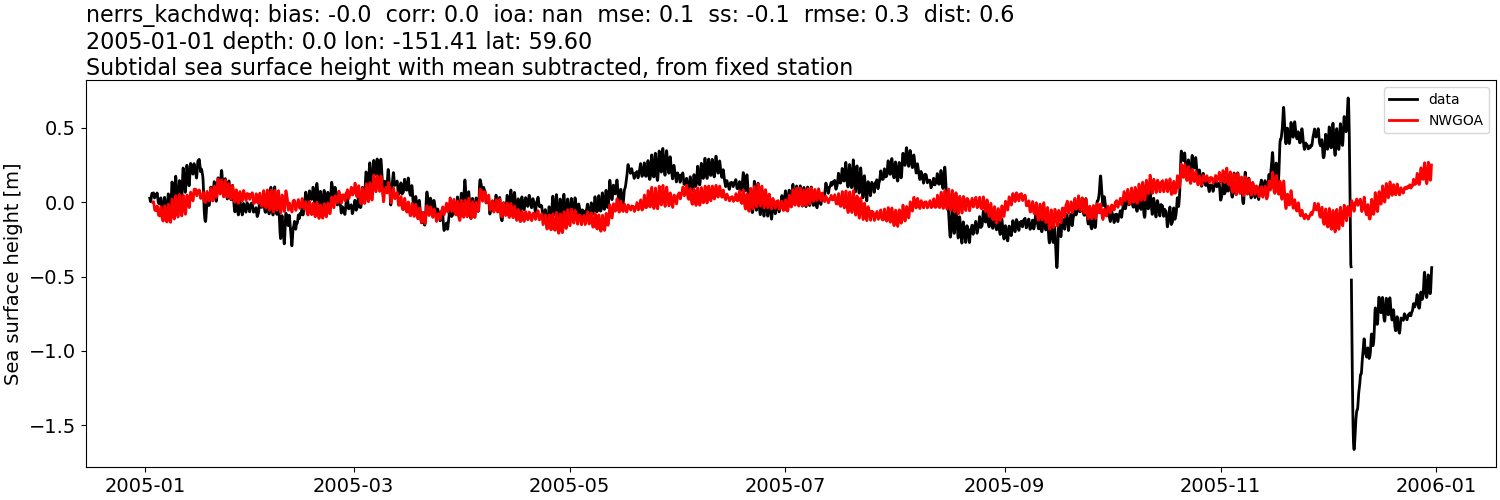
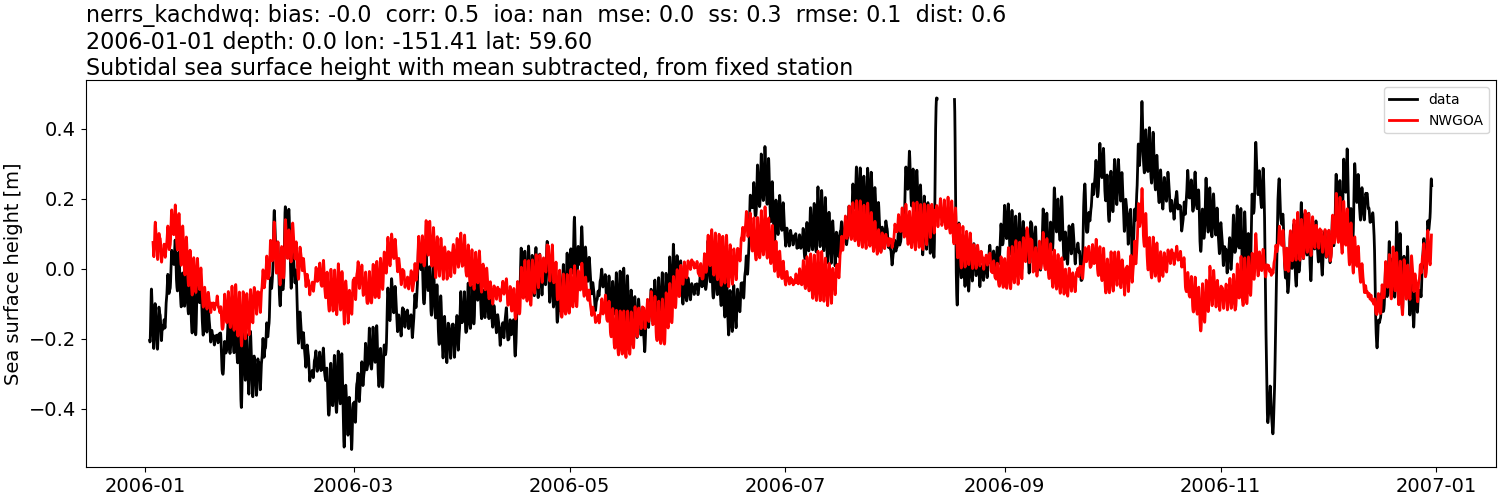
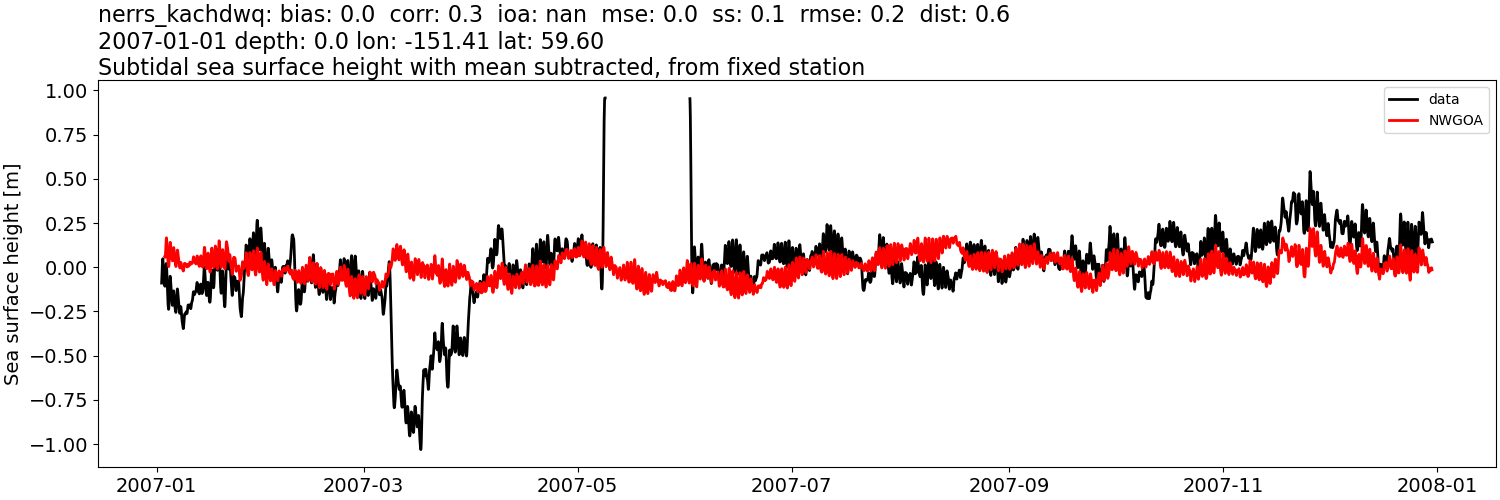
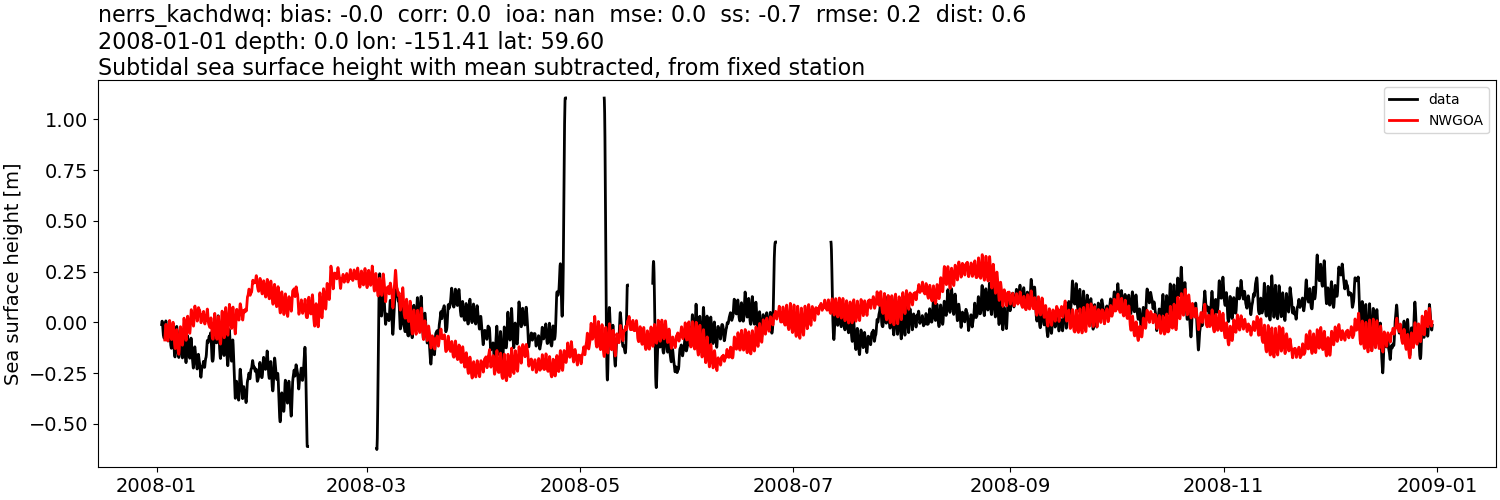
Sea surface height: mean subtracted#
CIOFS#
Comparison plots by year
2003
2004
2005
2006
2007
2008
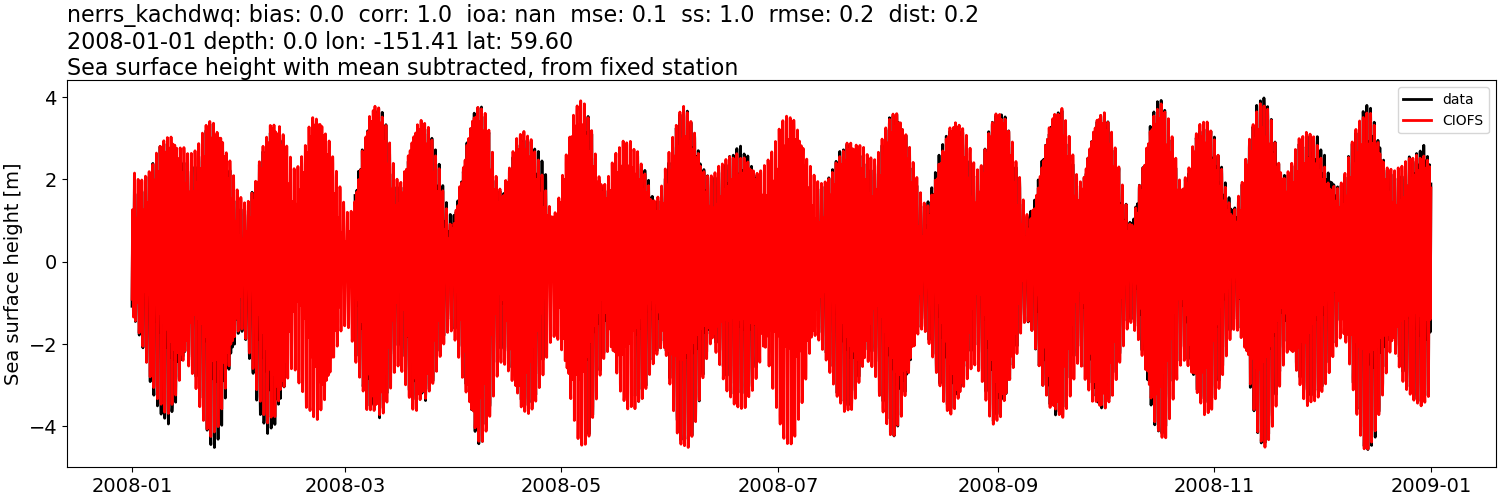
2009
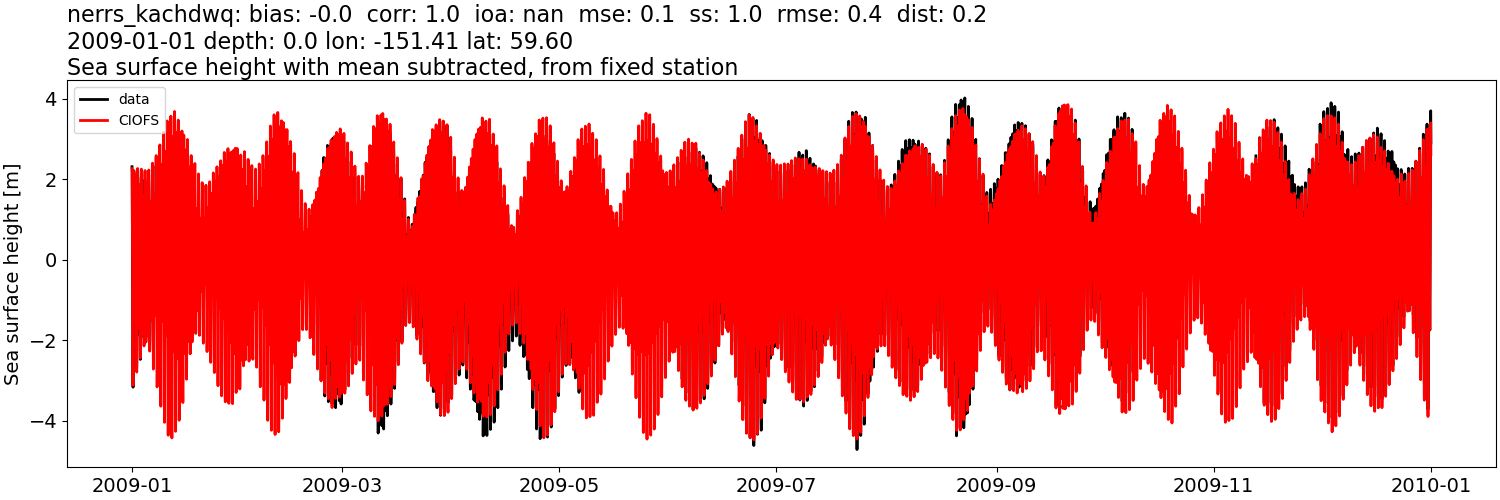
2010
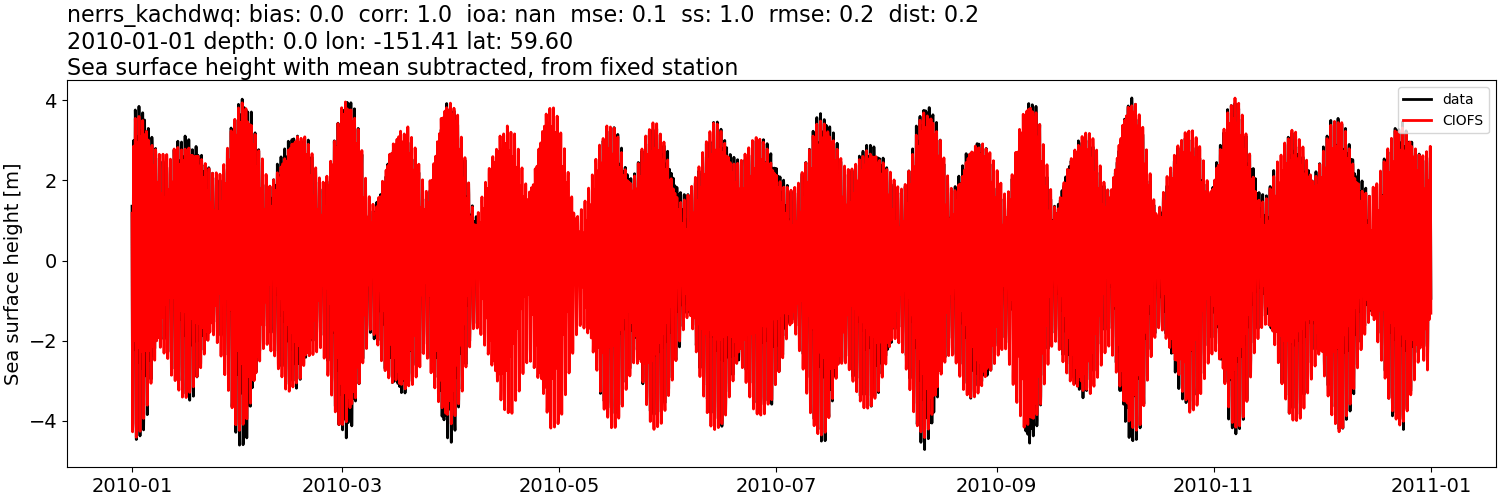
2011
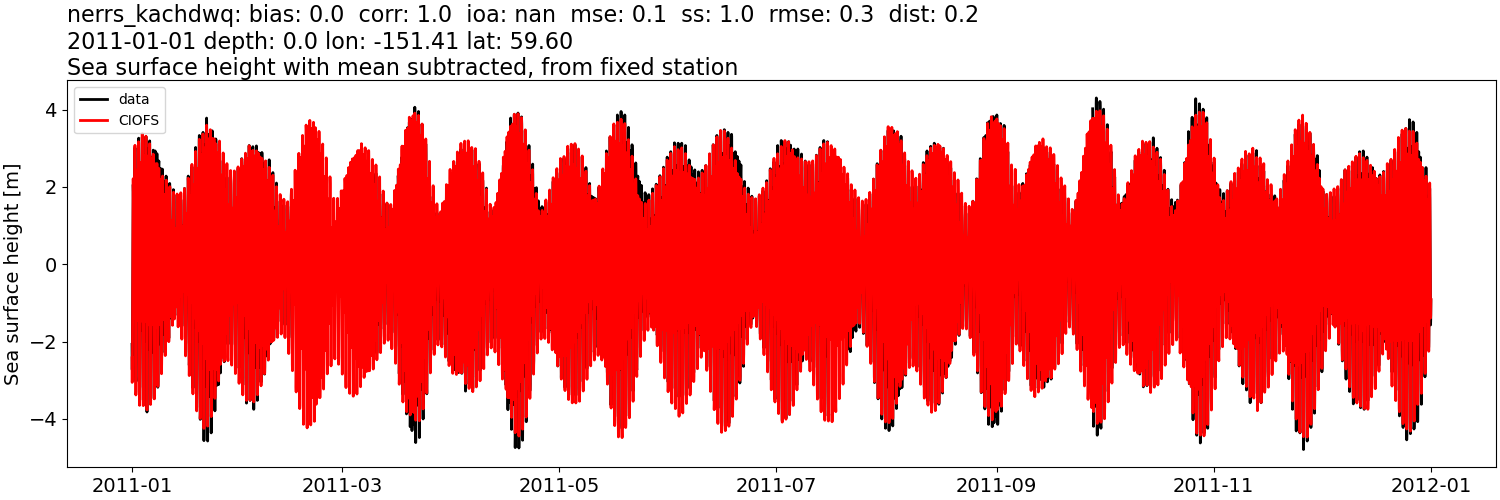
2012
2013
2014
2015
2016
2017
2018
2019
2020
2021
2022
NWGOA#
Comparison plots by year
2003
2004
2005
2006
2007
2008
Sea surface height: mean subtracted, then tidally-filtered#
CIOFS#
Comparison plots by year
2003
2004
2005
2006
2007
2008
2009
2010
2011
2012
2013
2014
2015
2016
2017
2018

2019
2020
2021
2022
NWGOA#
Comparison plots by year
2003
2004
2005
2006
2007
2008
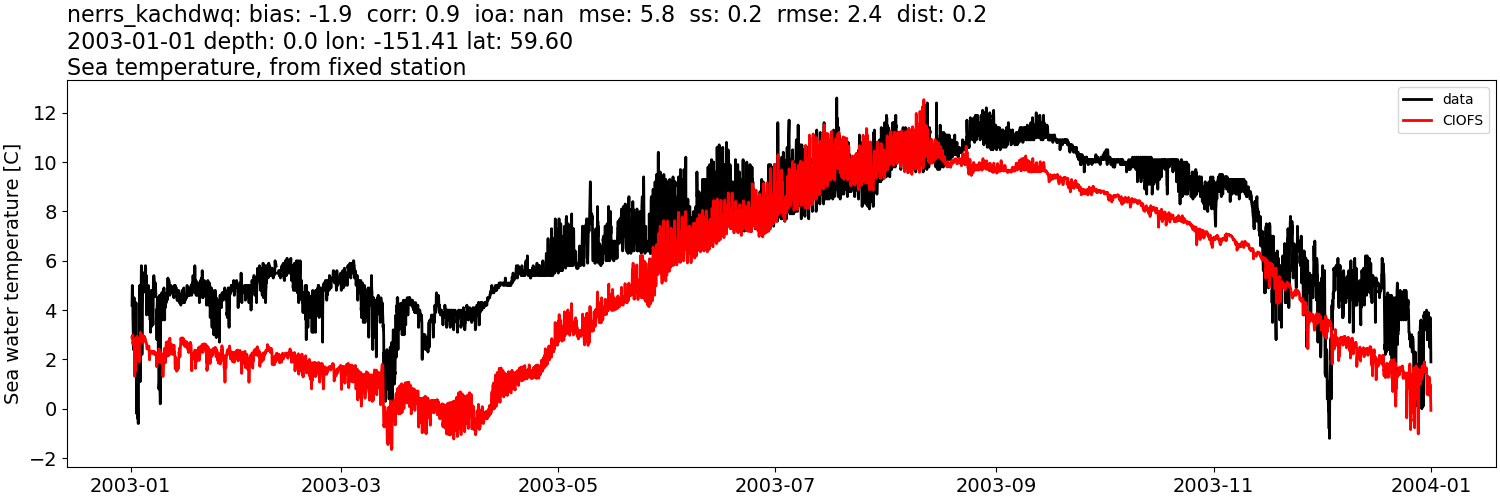
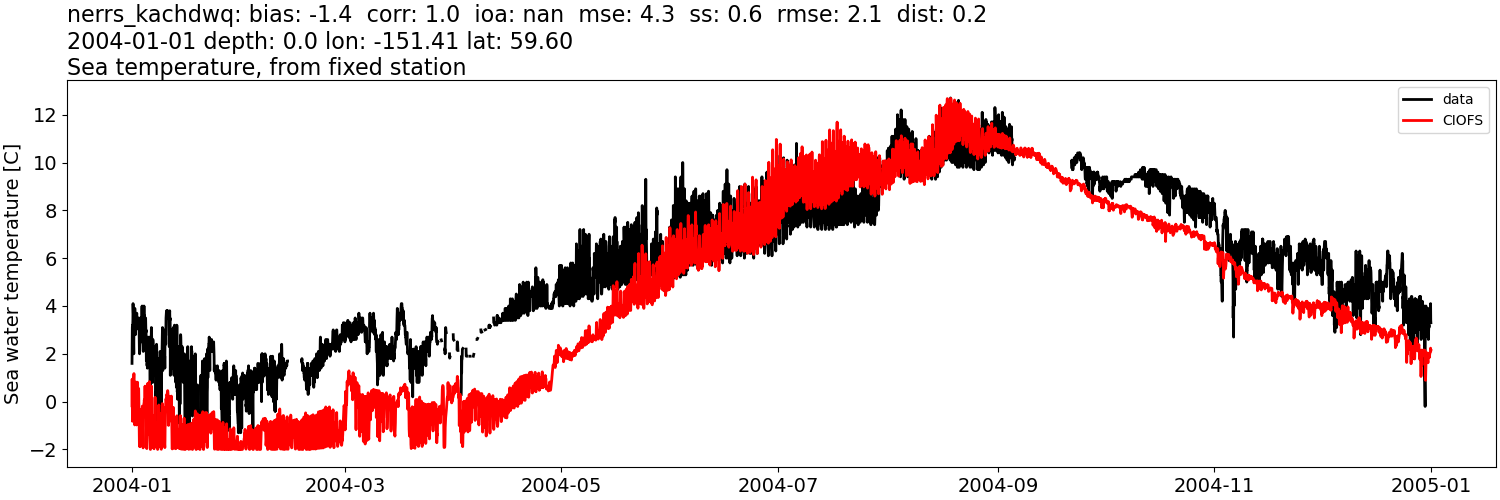
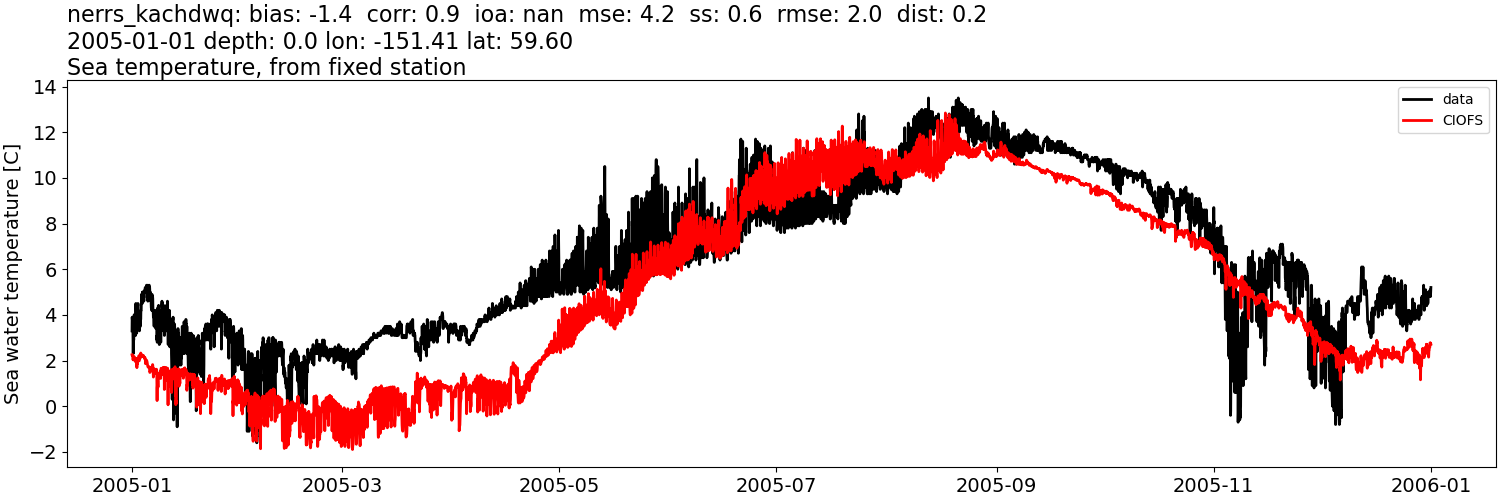
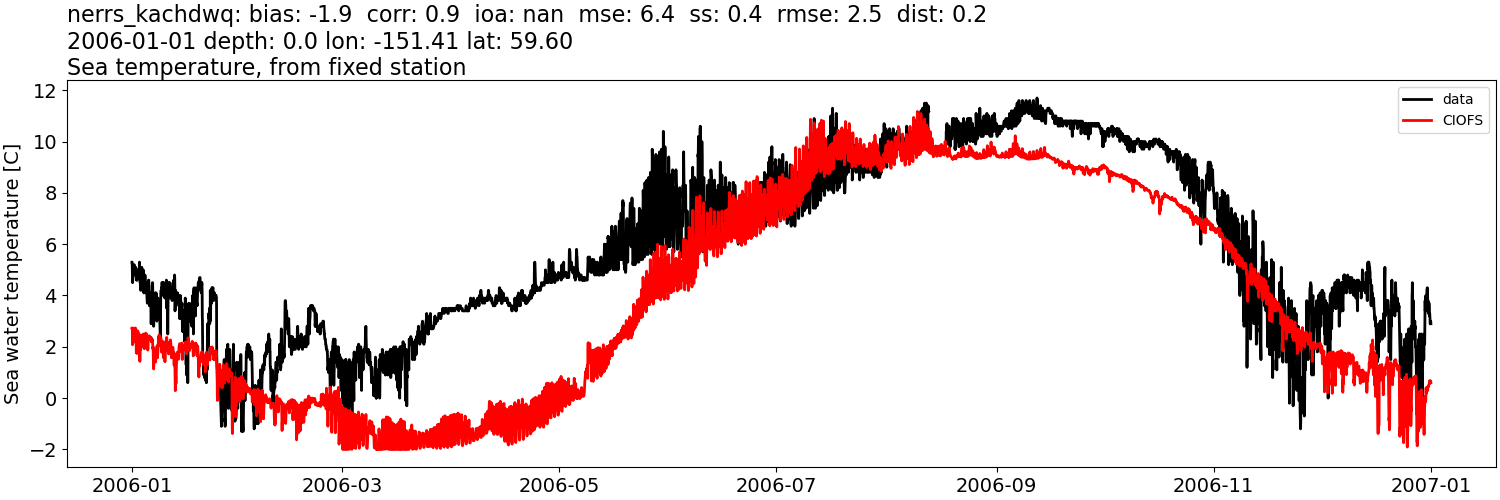
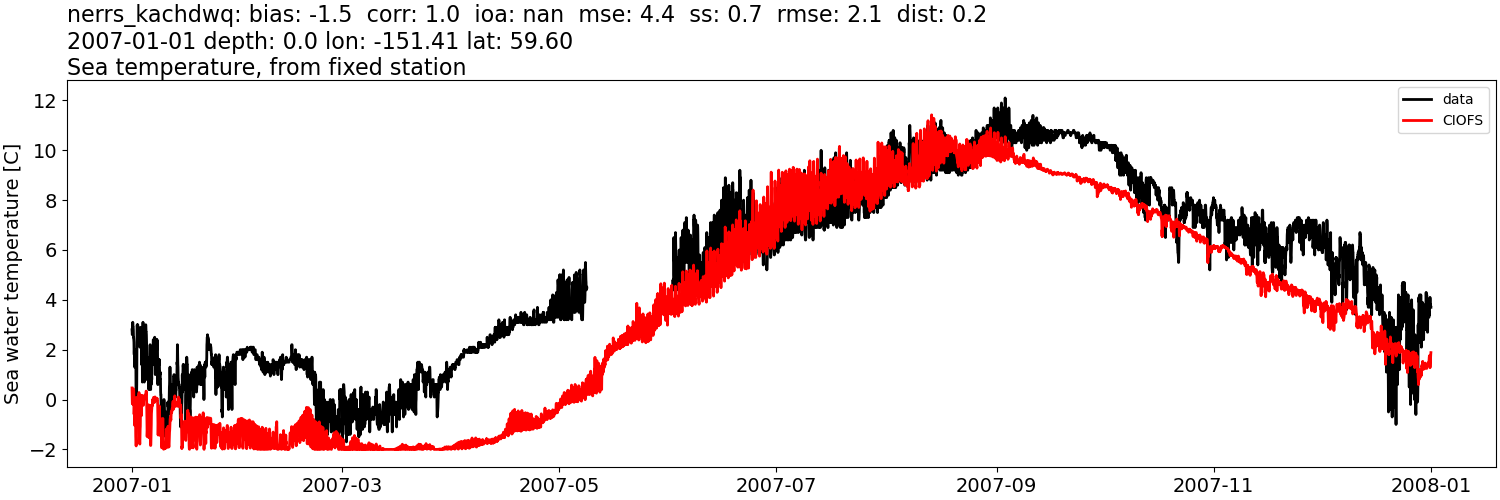
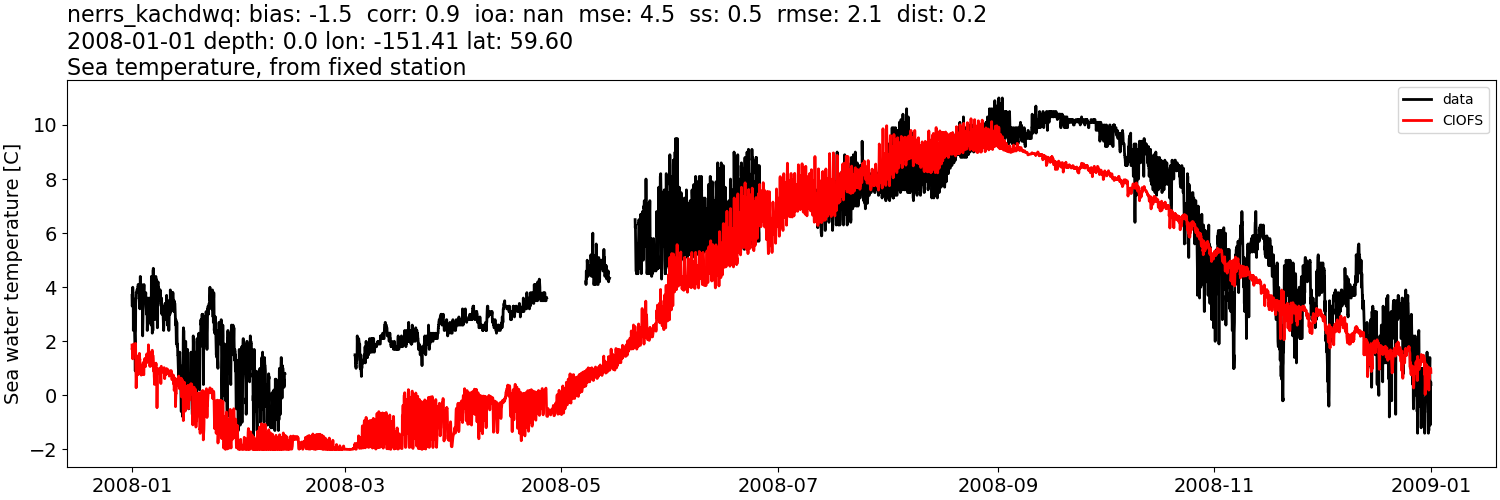
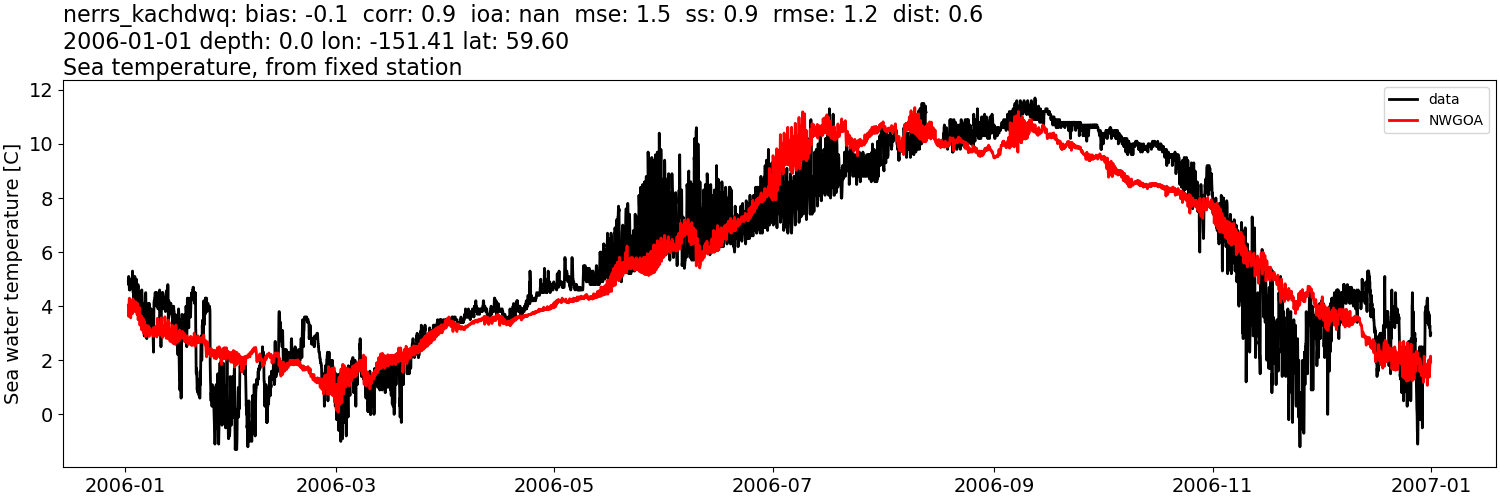
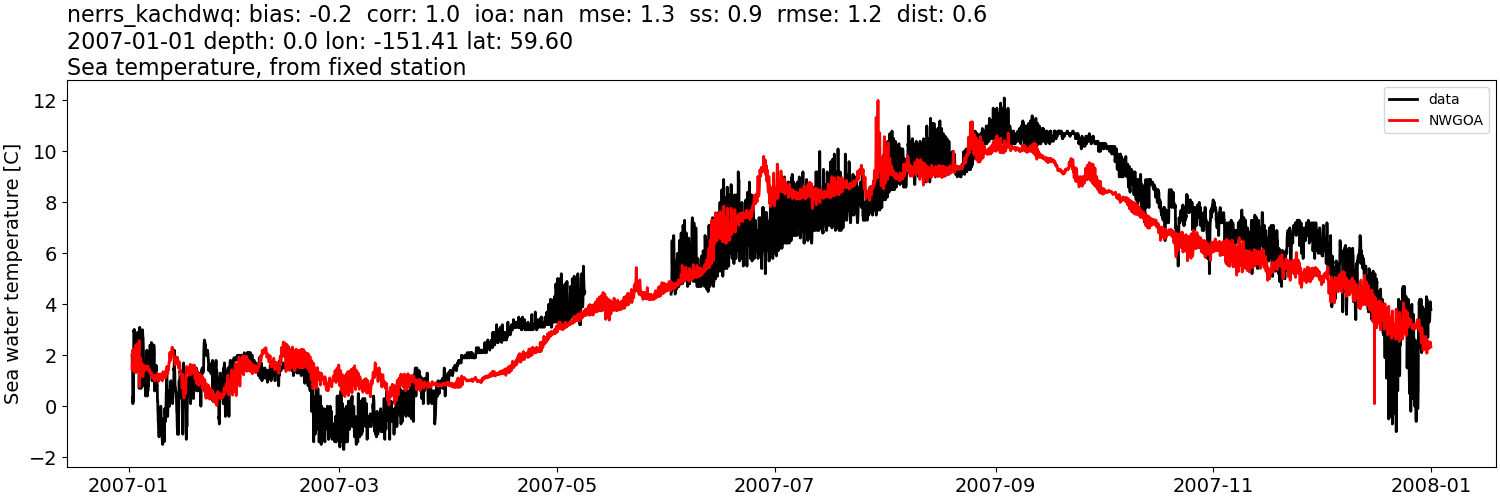
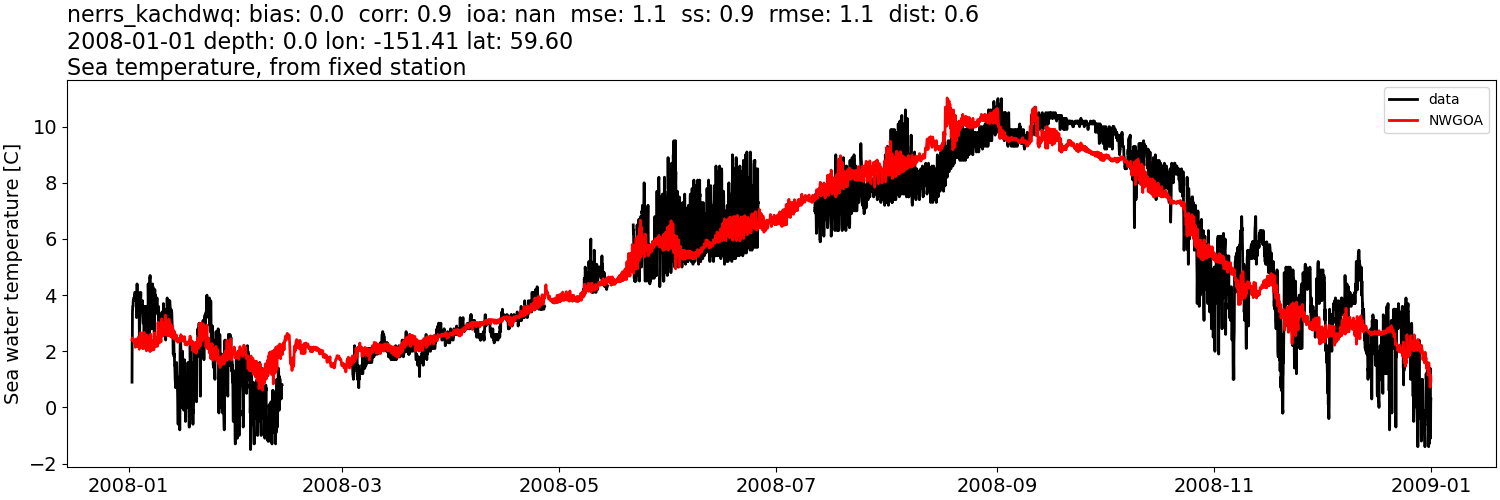
Sea water temperature:#
CIOFS#
Comparison plots by year
2003
2004
2005
2006
2007
2008
2009
2010
2011
2012
2013
2014
2015
2016
2017
2018

2019
2020
2021
2022
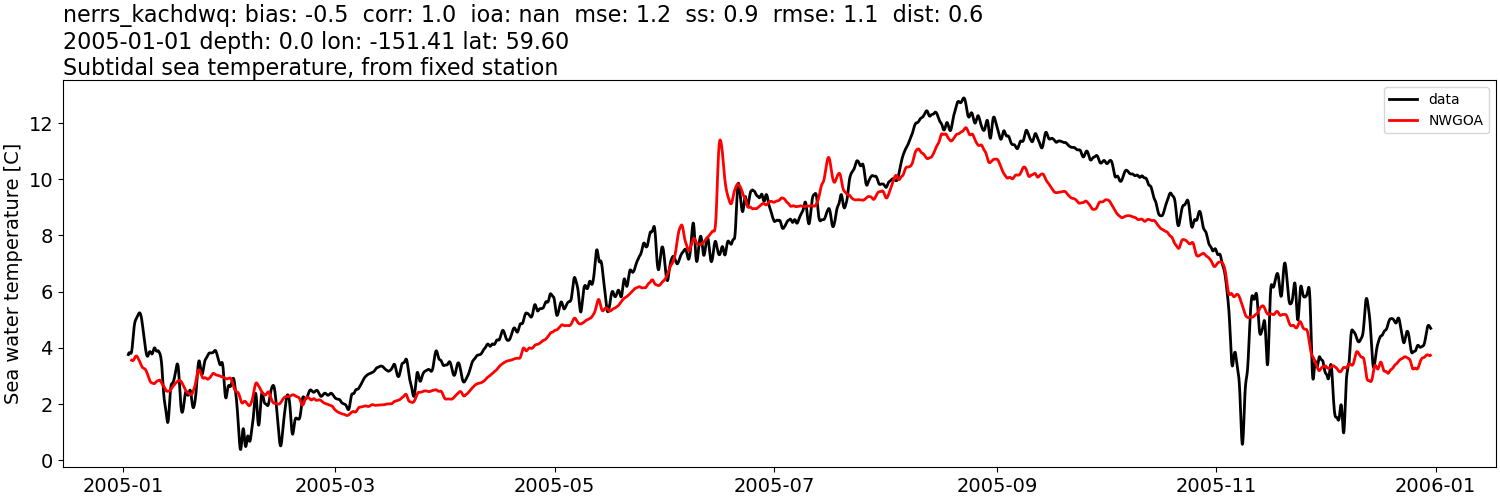
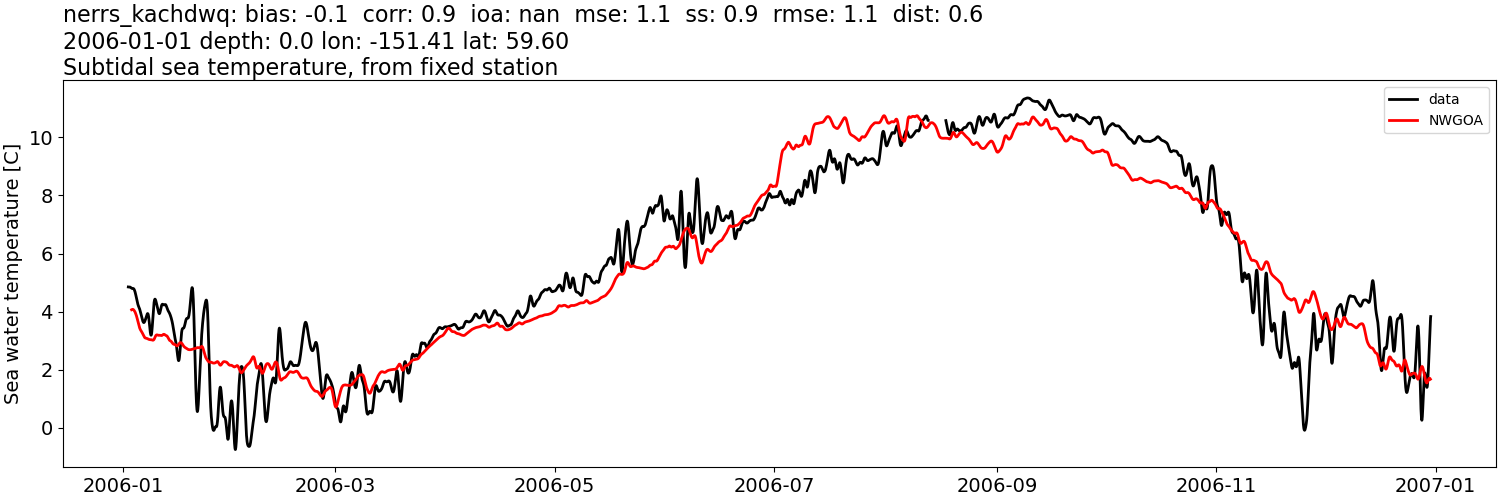
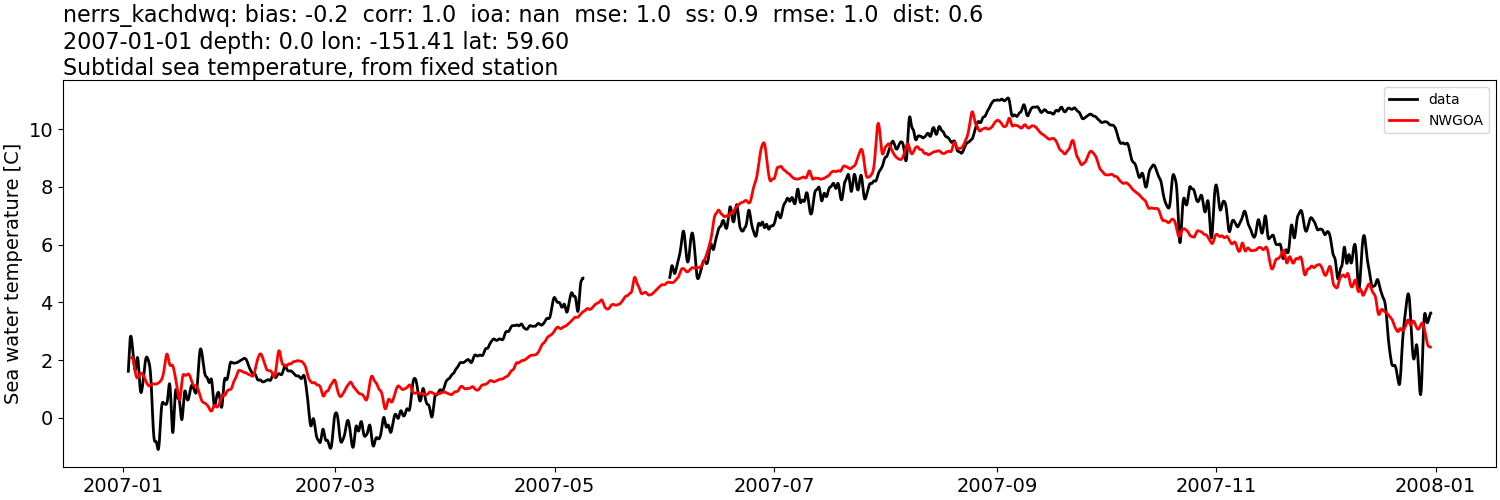
NWGOA#
Comparison plots by year
2003
2004
2005
2006
2007
2008
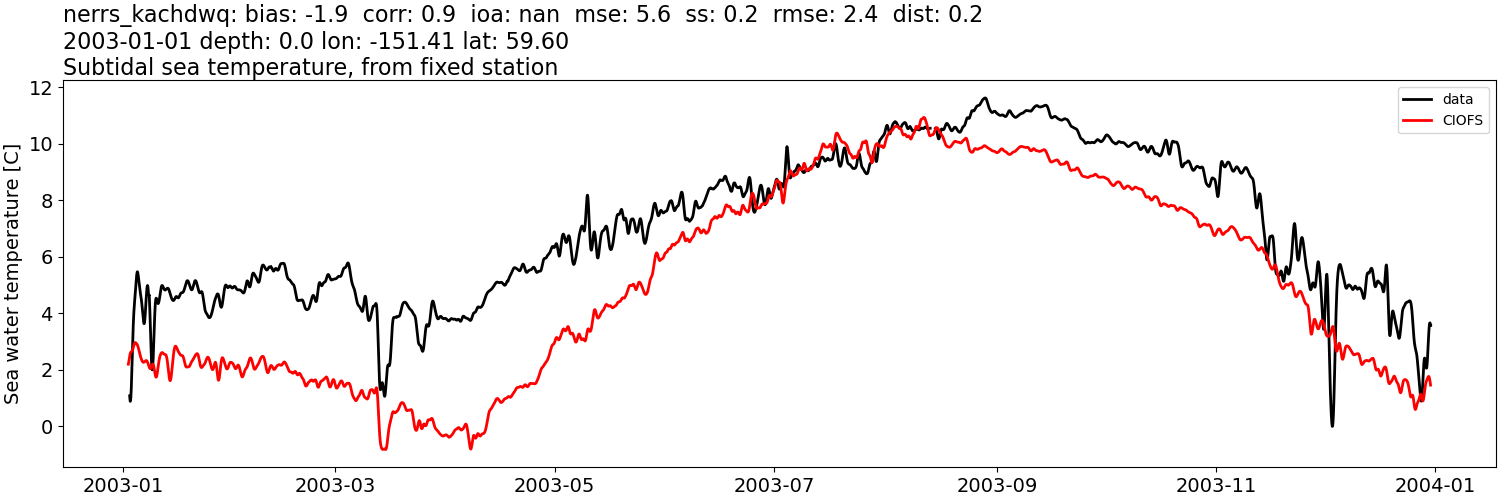
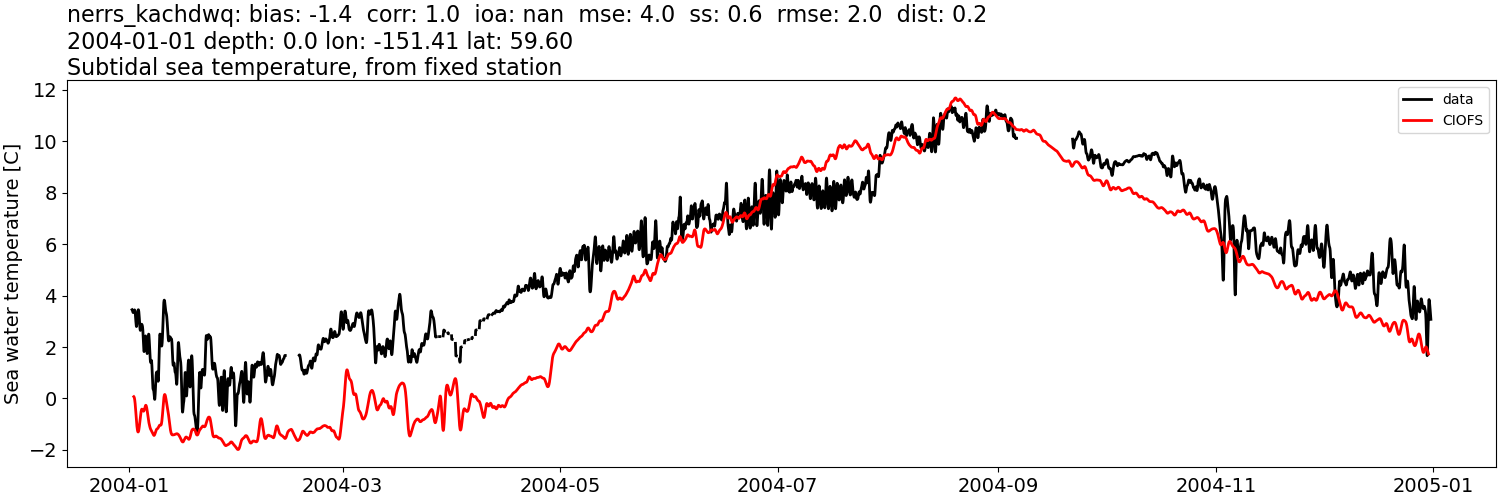
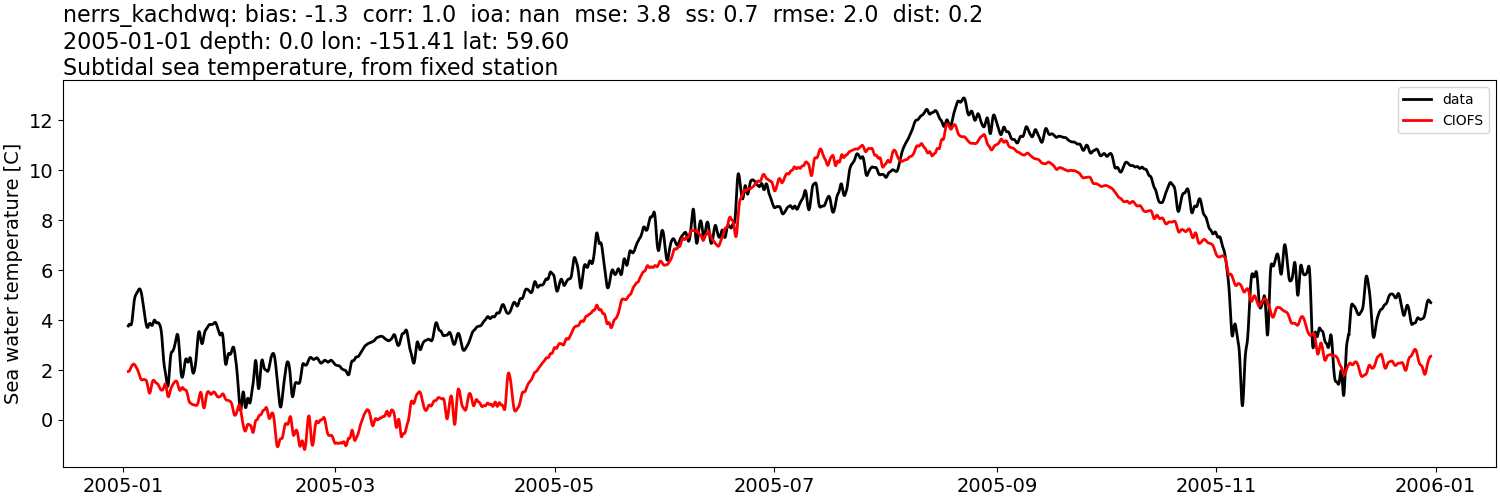
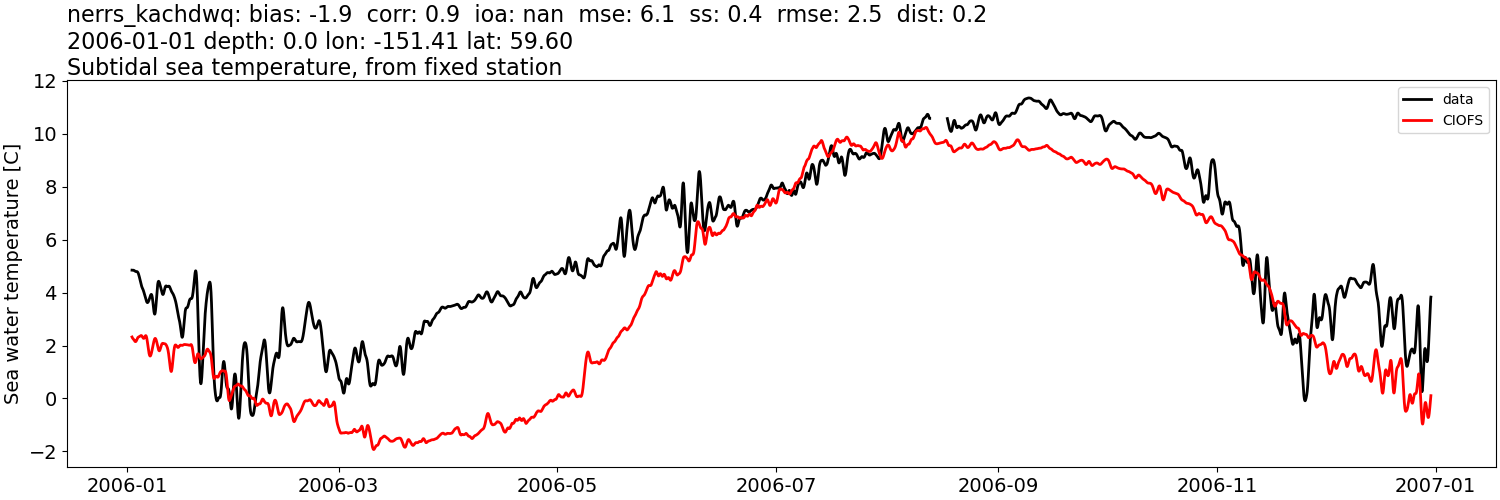
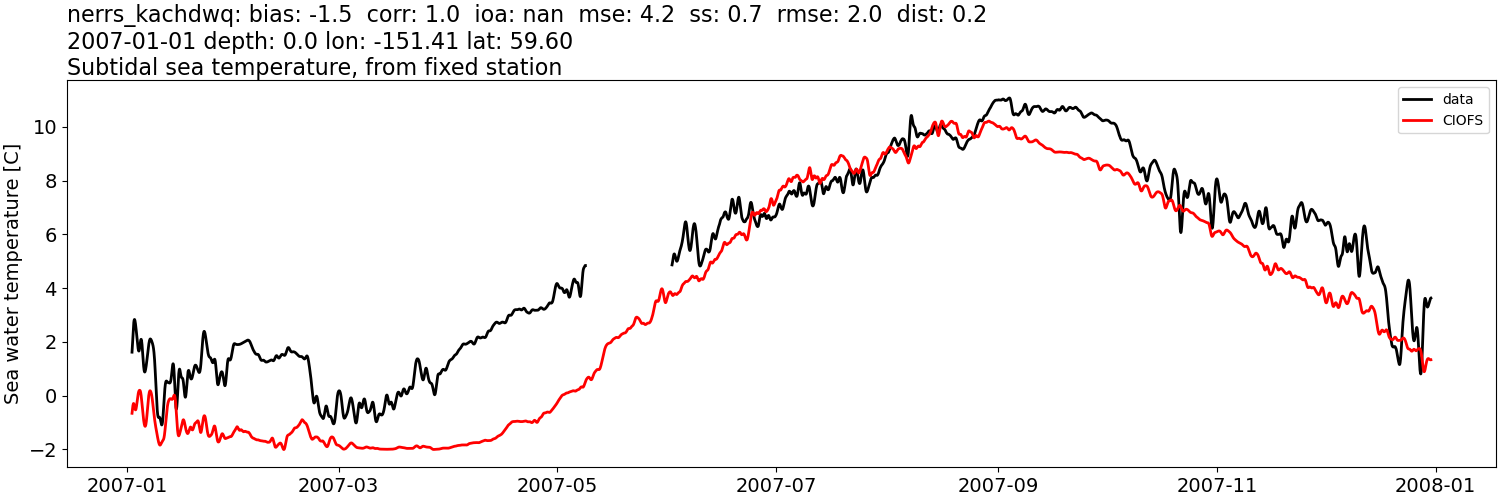
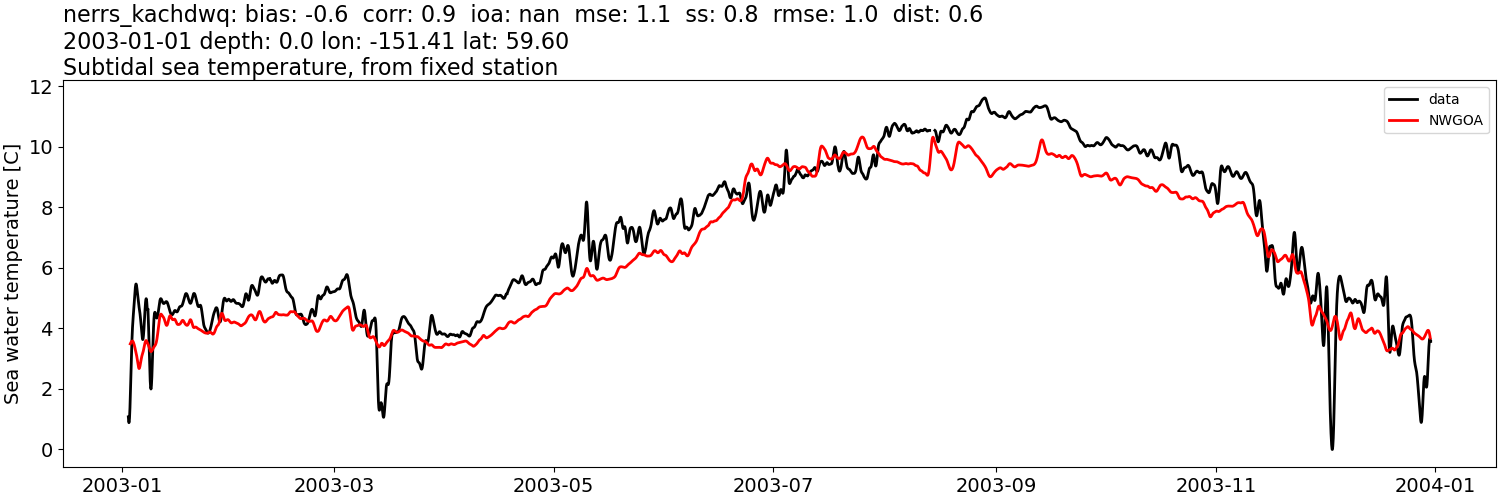
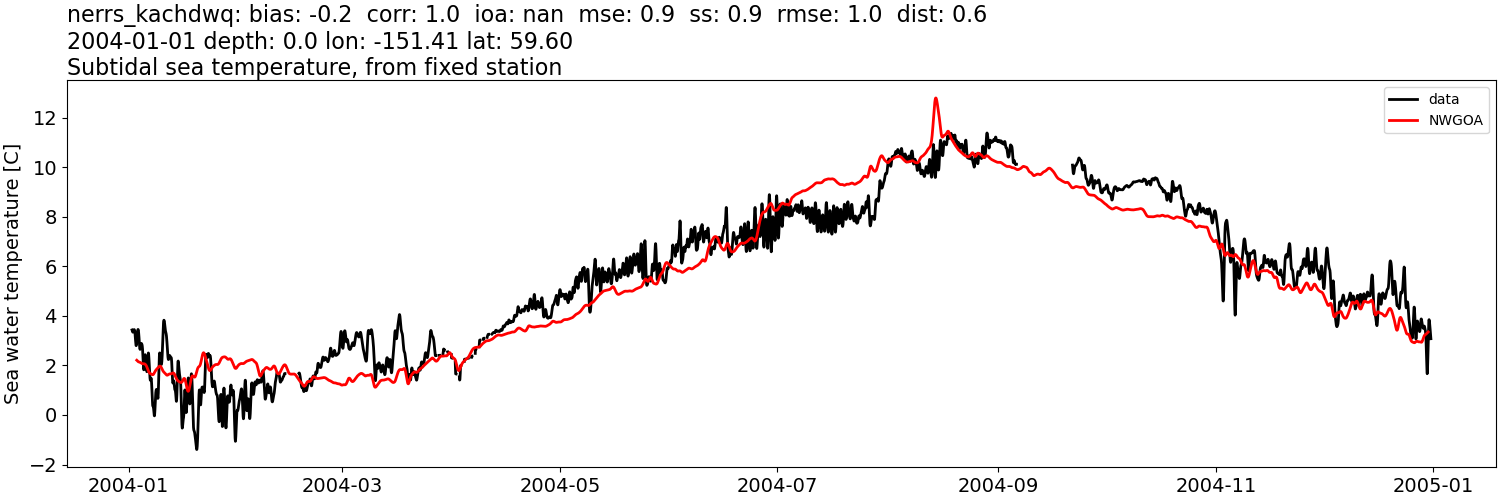
Sea water temperature: tidally-filtered#
CIOFS#
Comparison plots by year
2003
2004
2005
2006
2007
2008
2009

2010
2011
2012
2013
2014
2015
2016
2017
2018
2019
2020
2021
2022
NWGOA#
Comparison plots by year
2003
2004
2005
2006
2007
2008

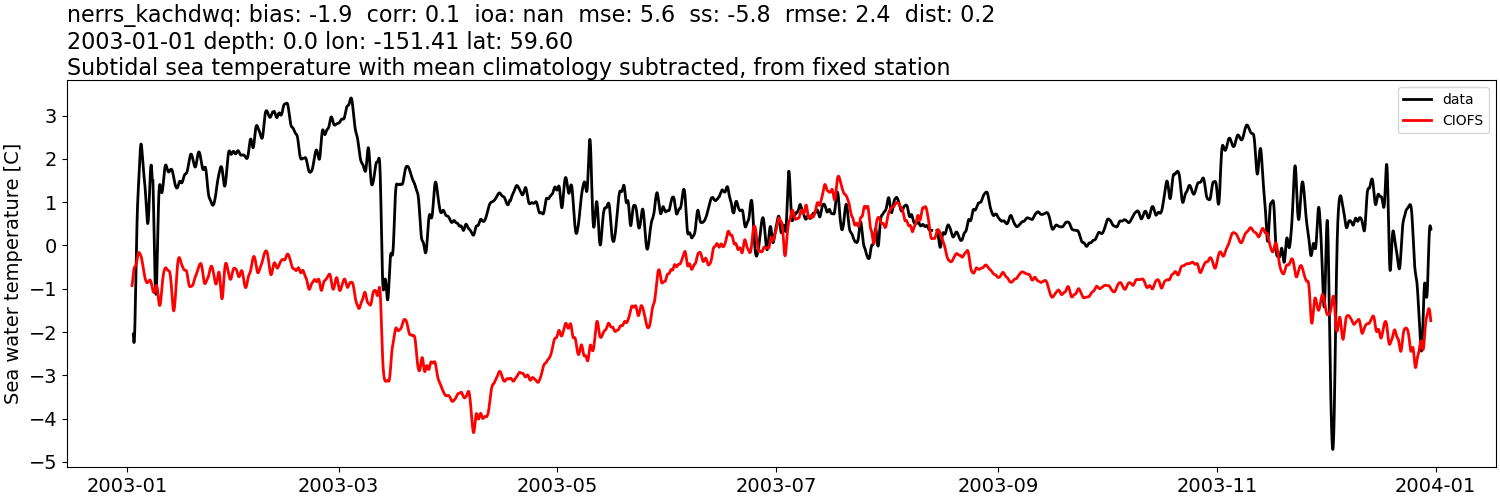
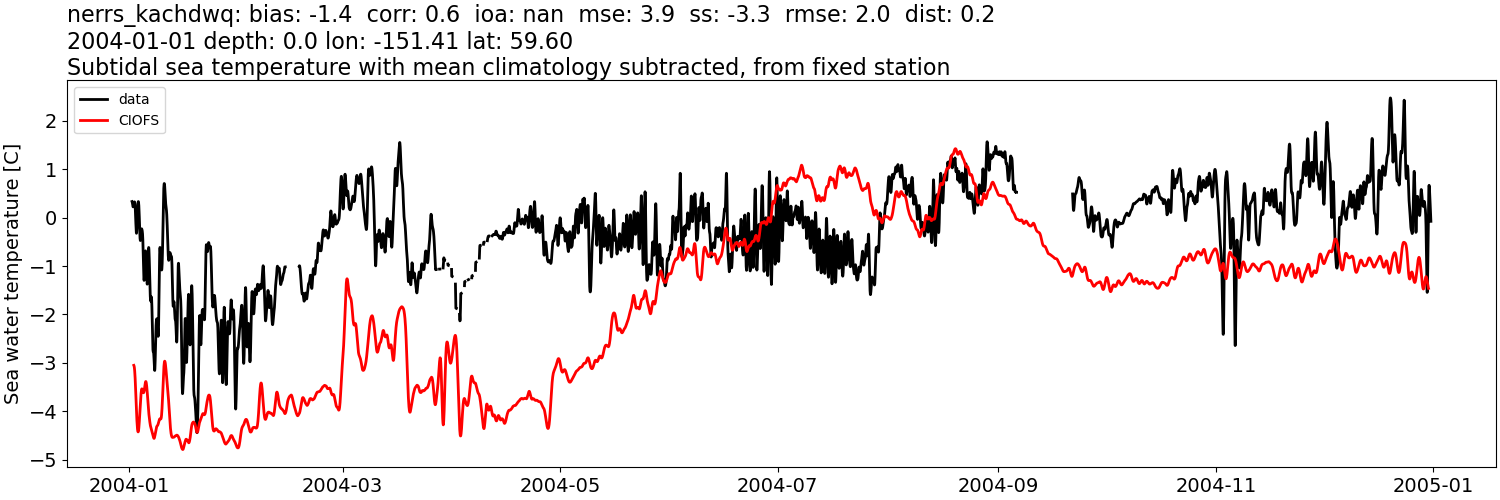
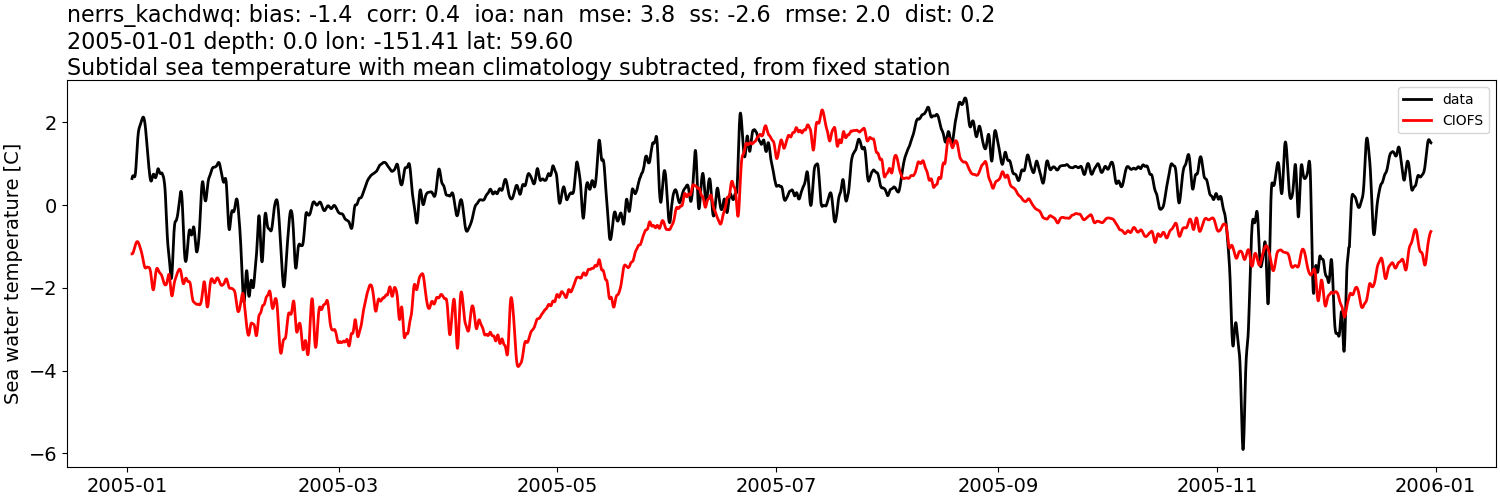
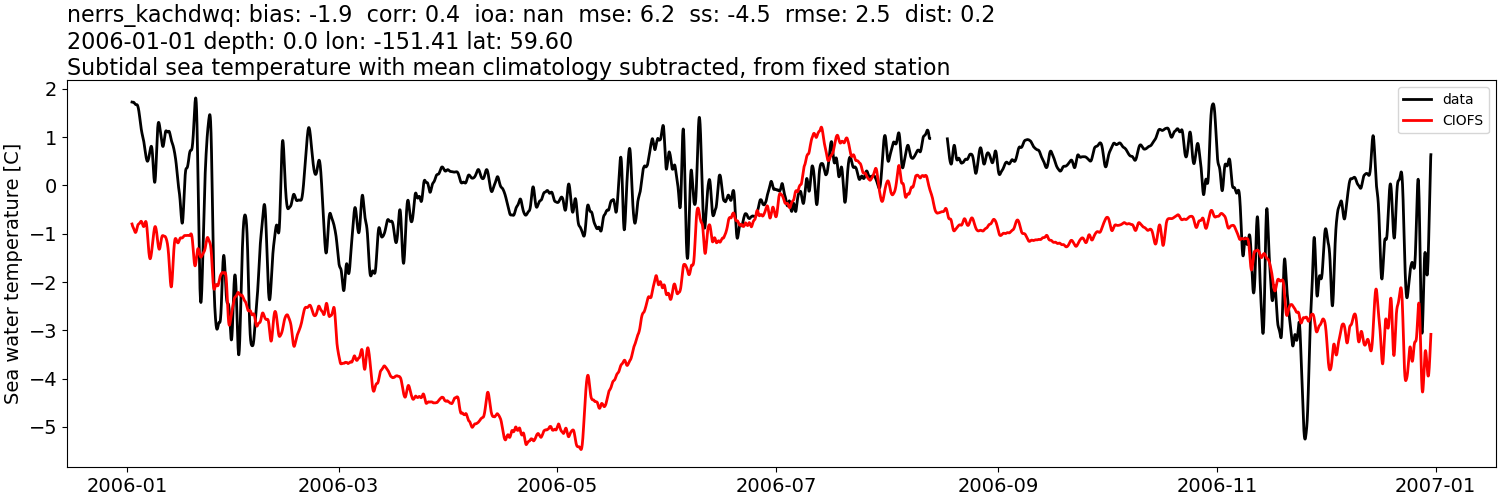
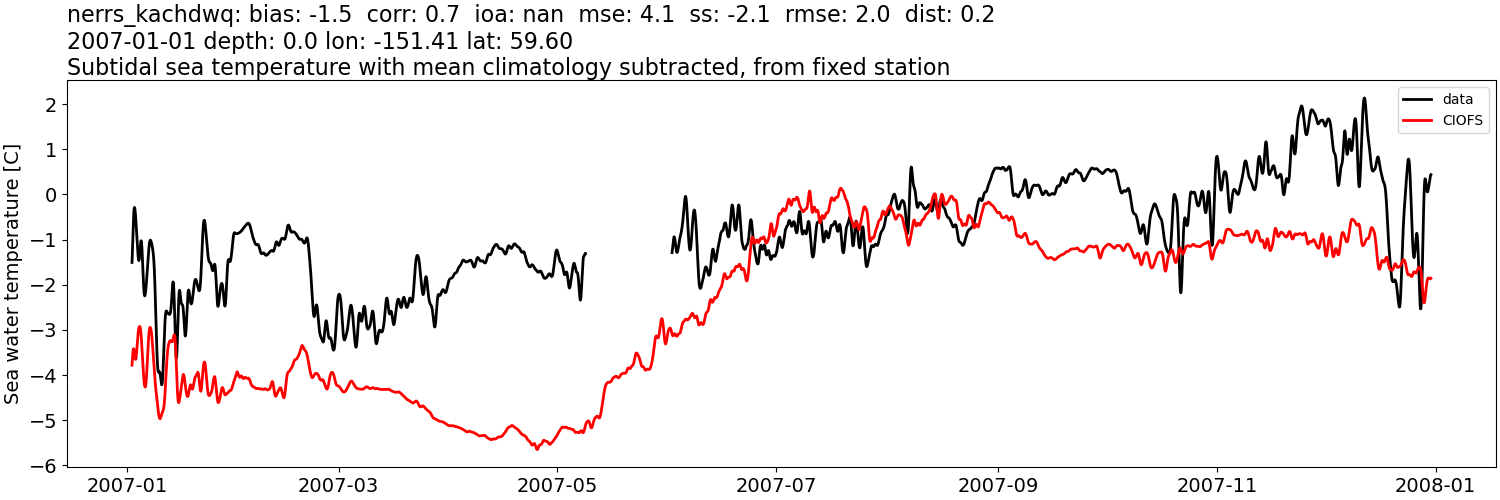
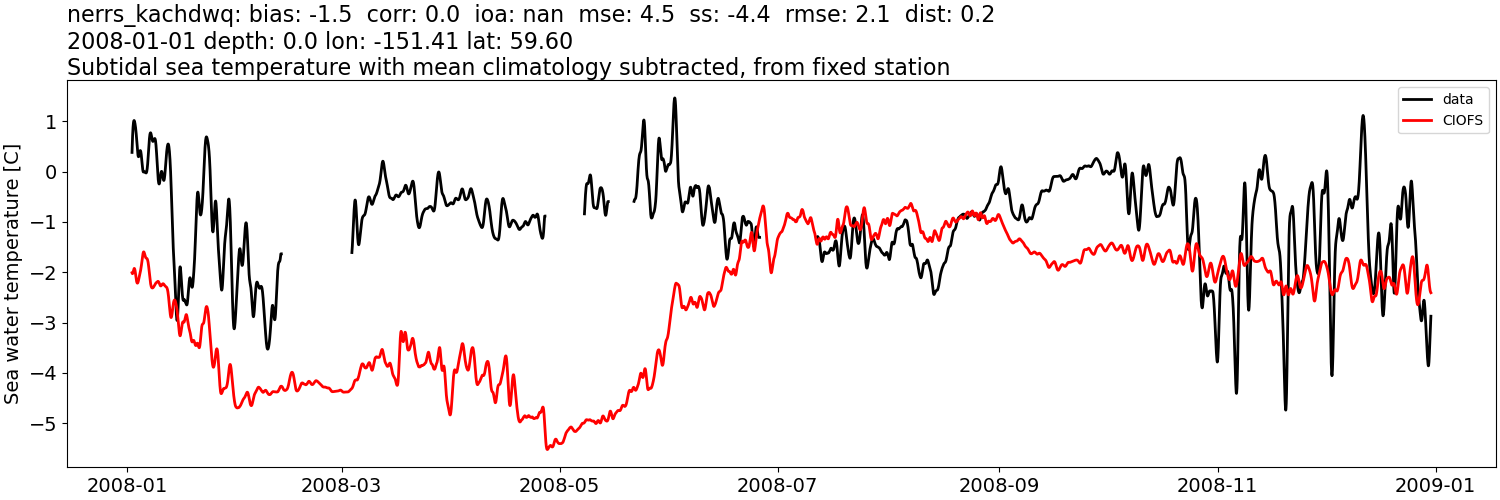
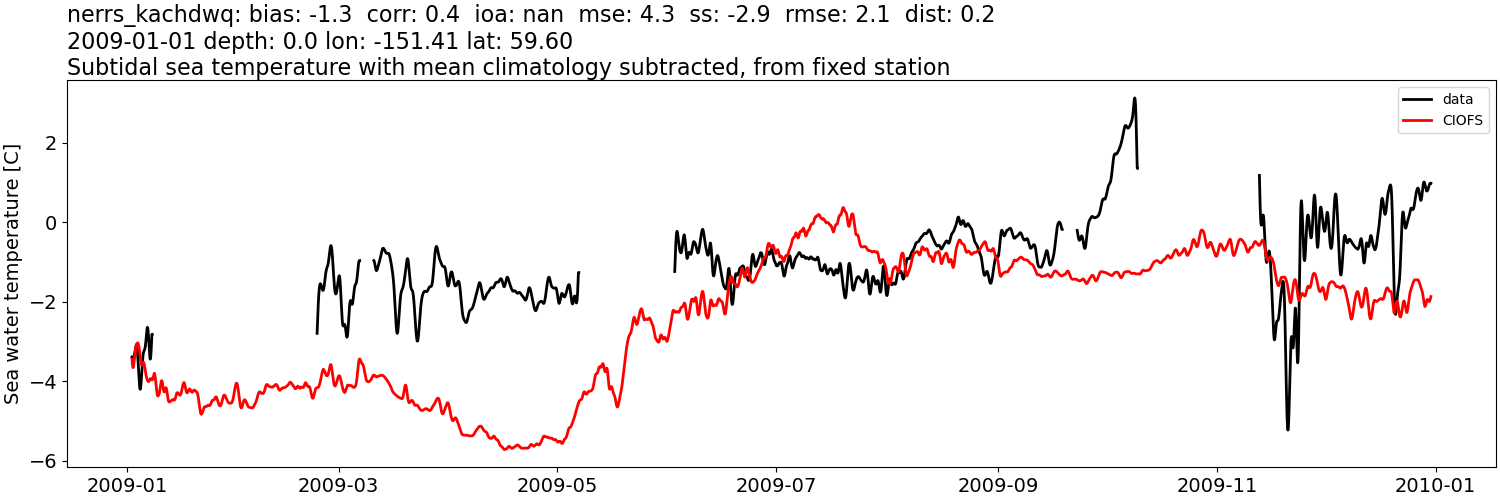
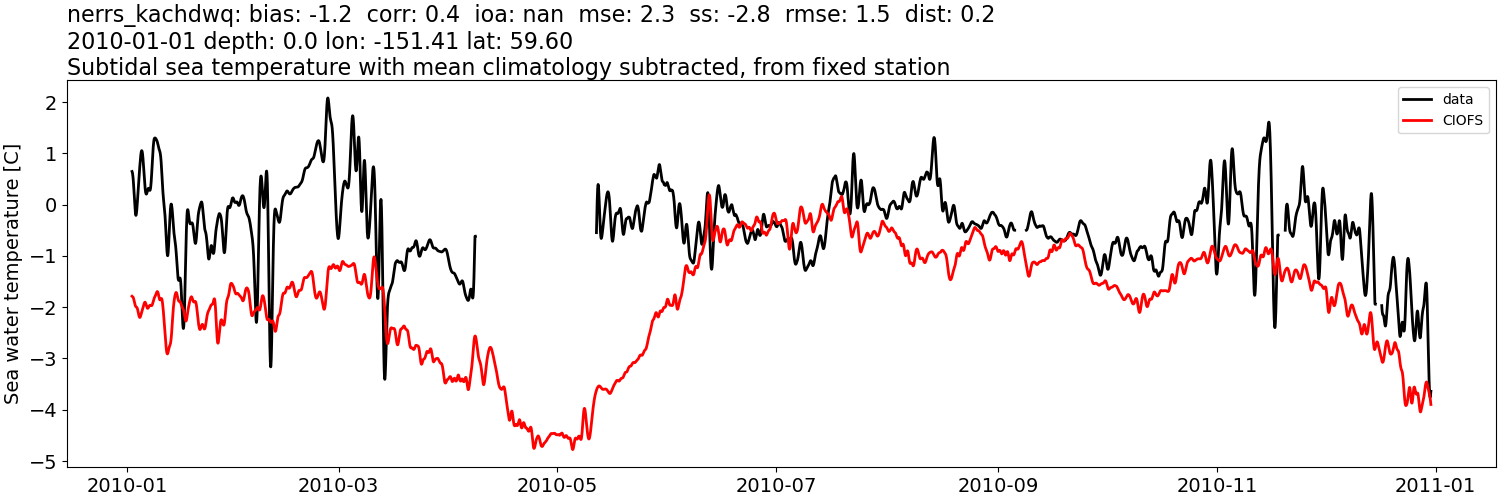
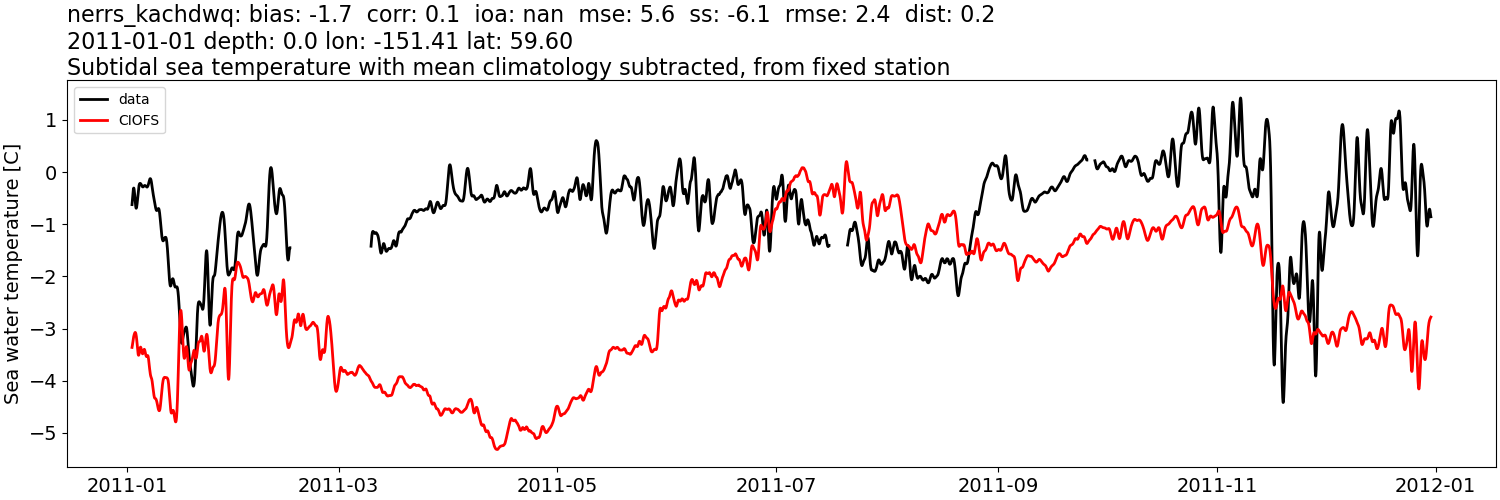
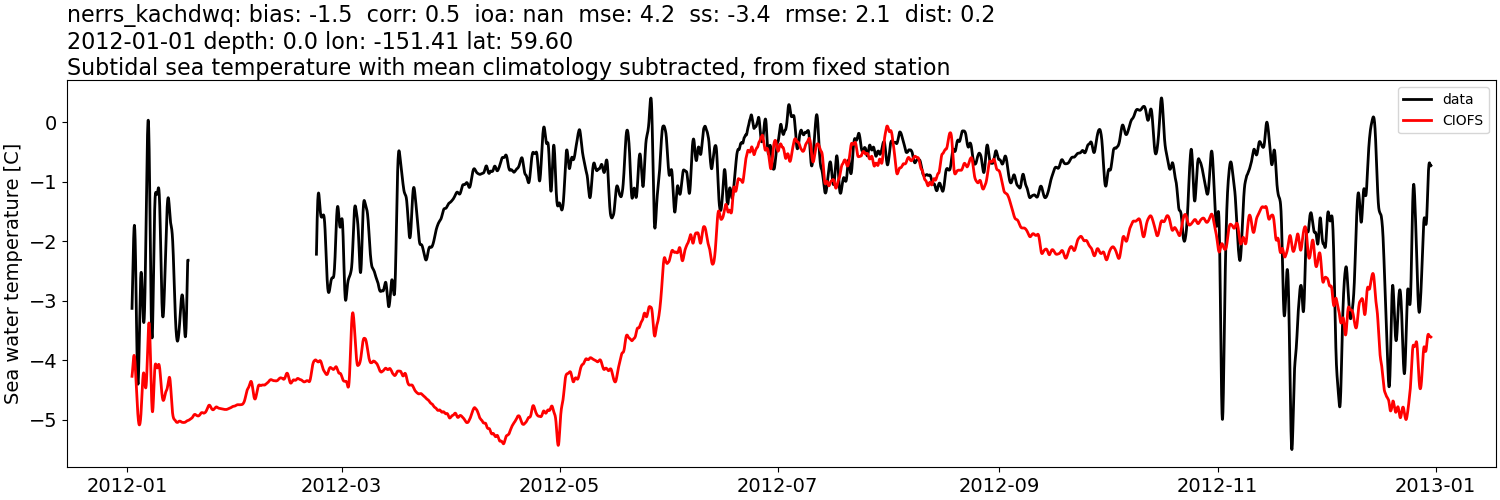
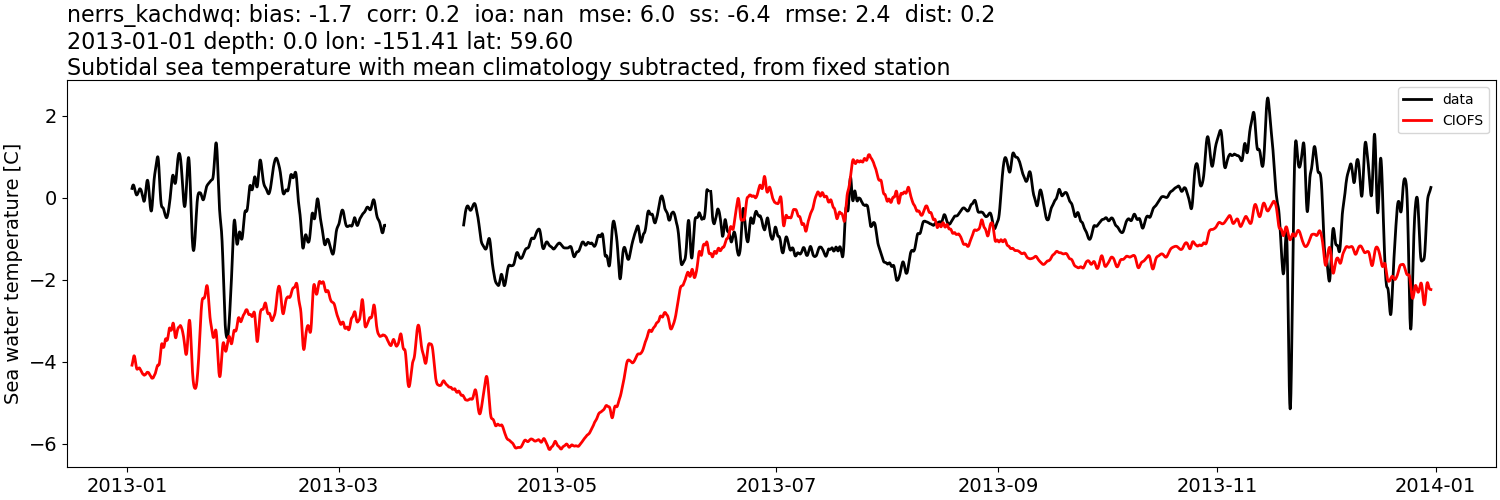
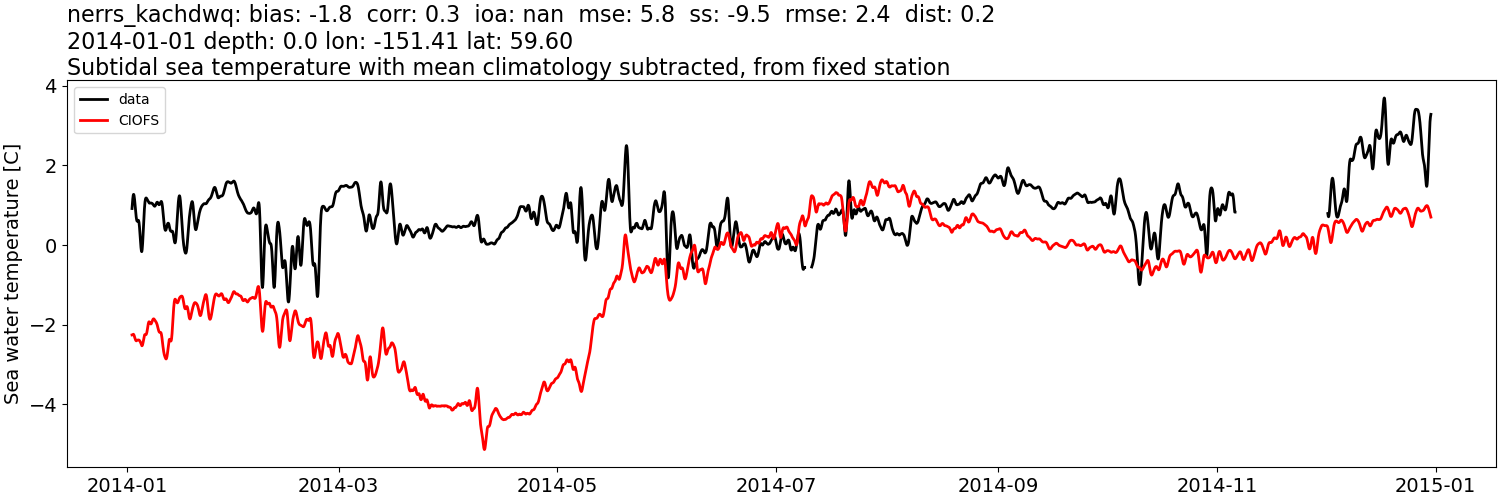
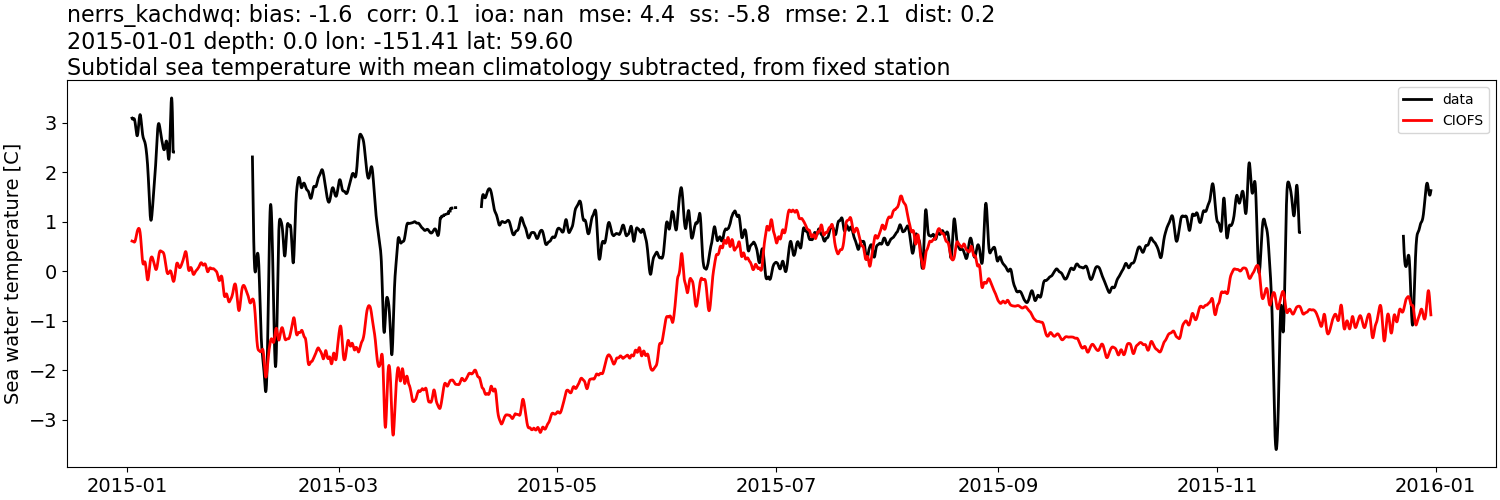
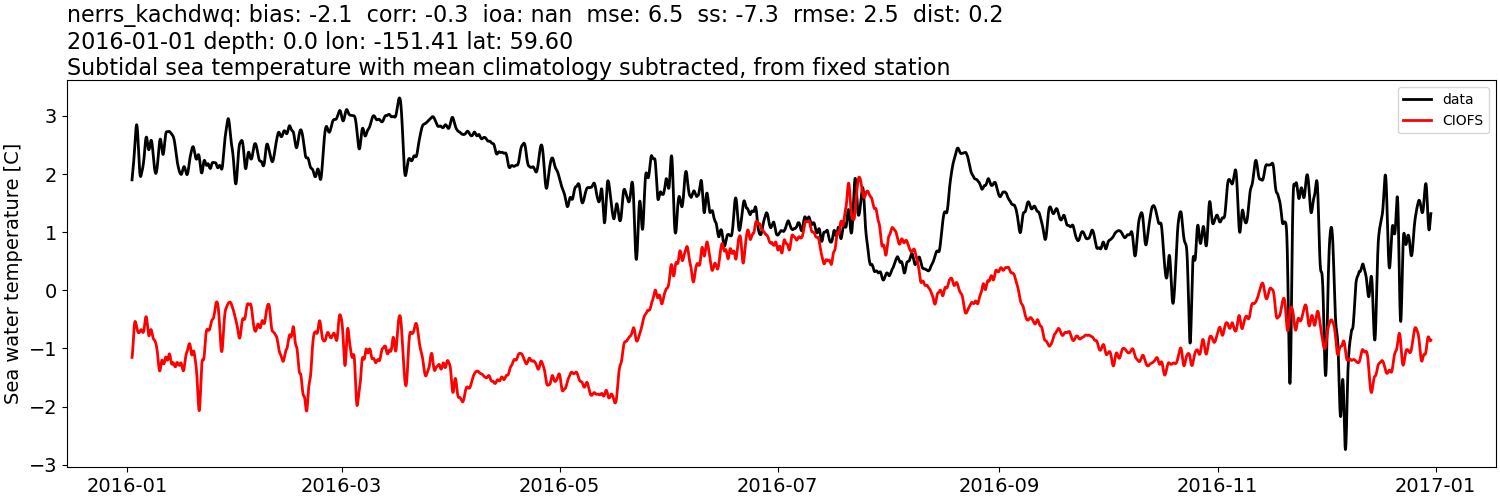
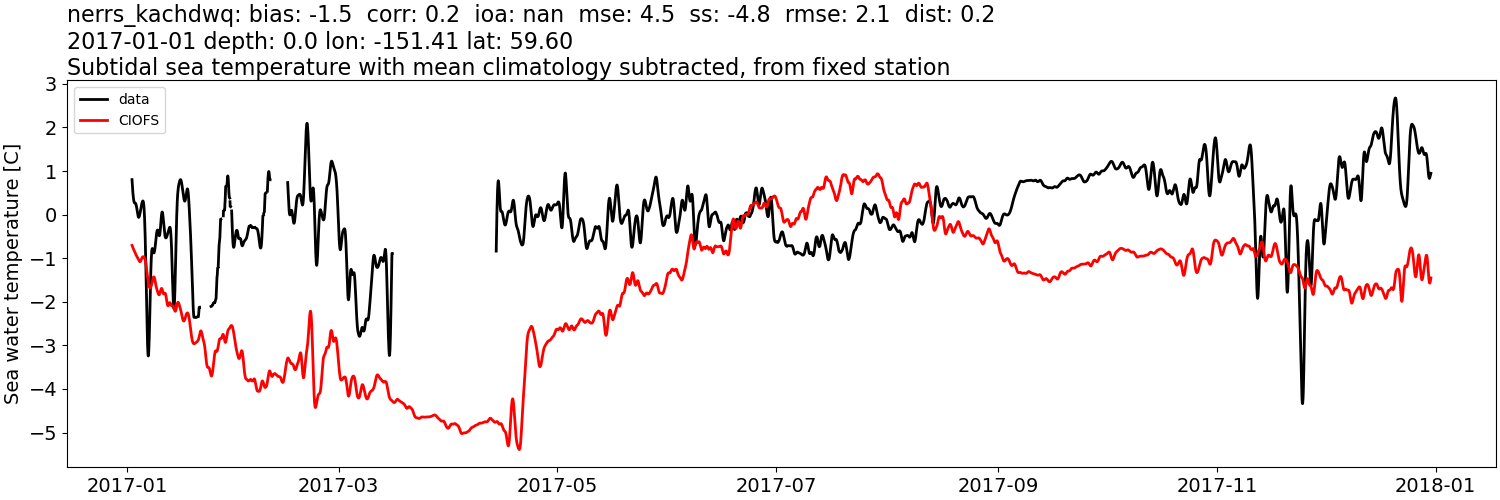
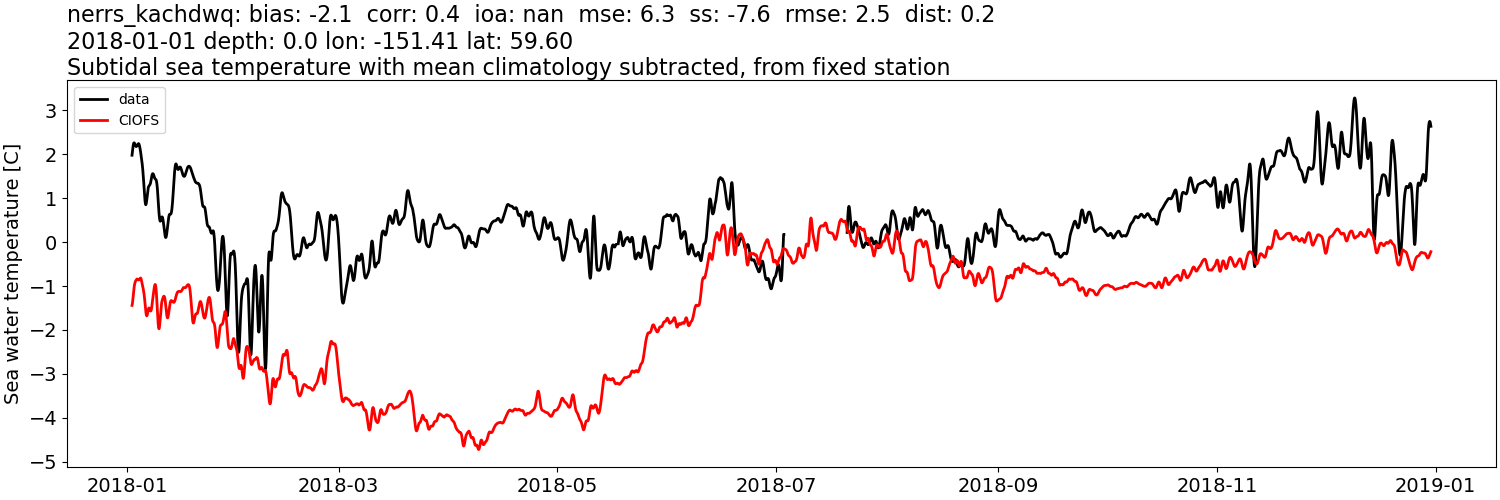
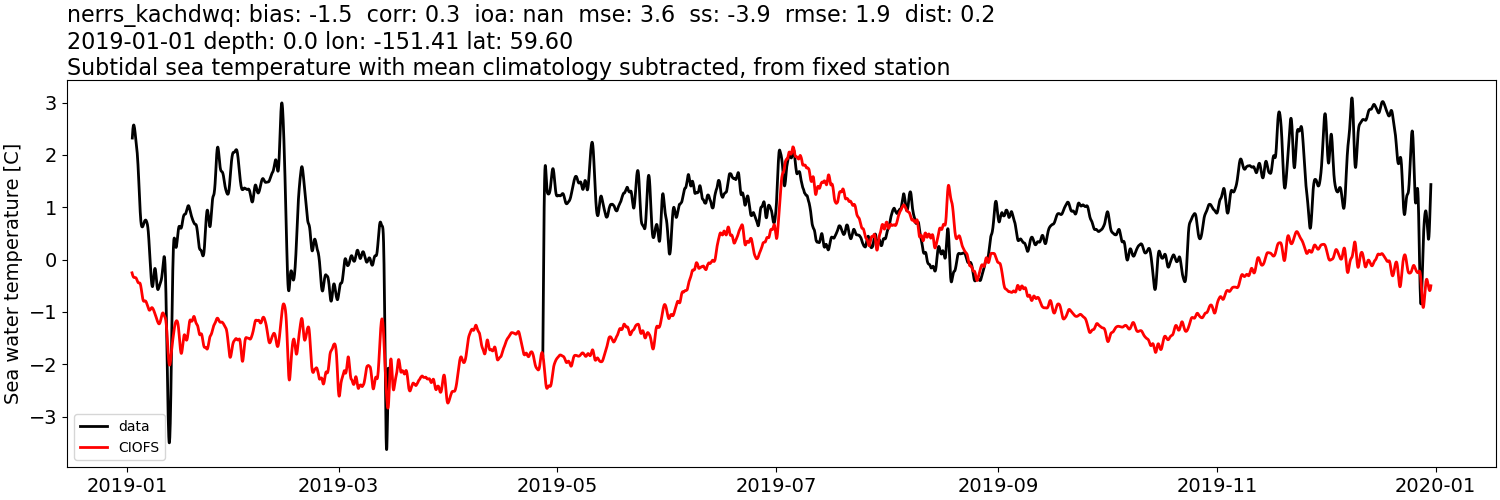
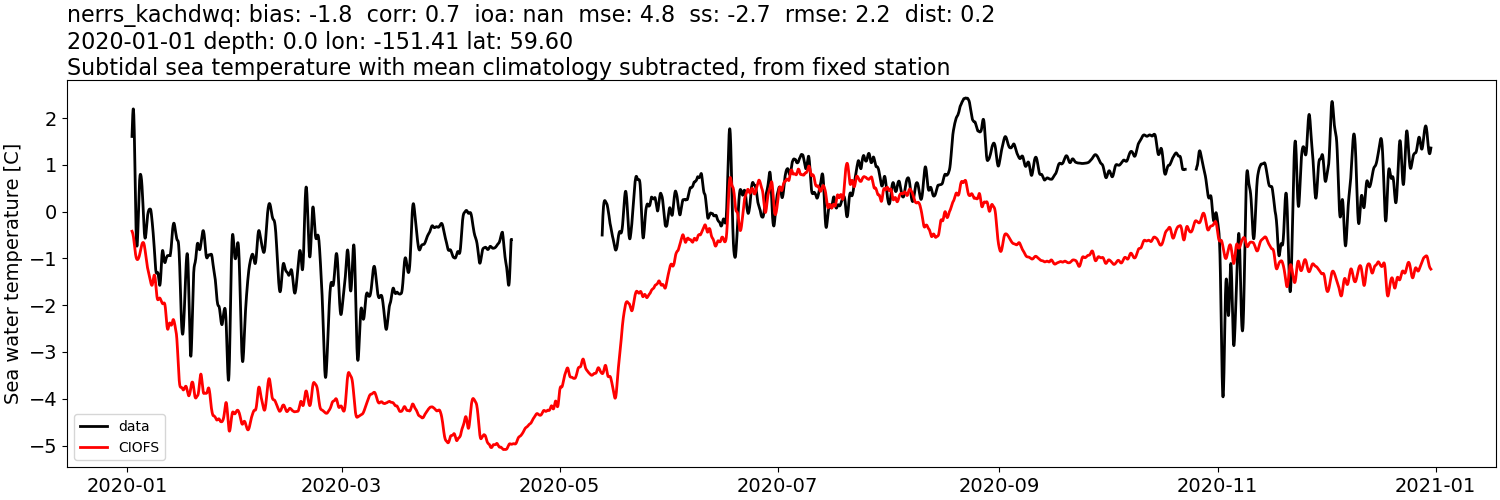
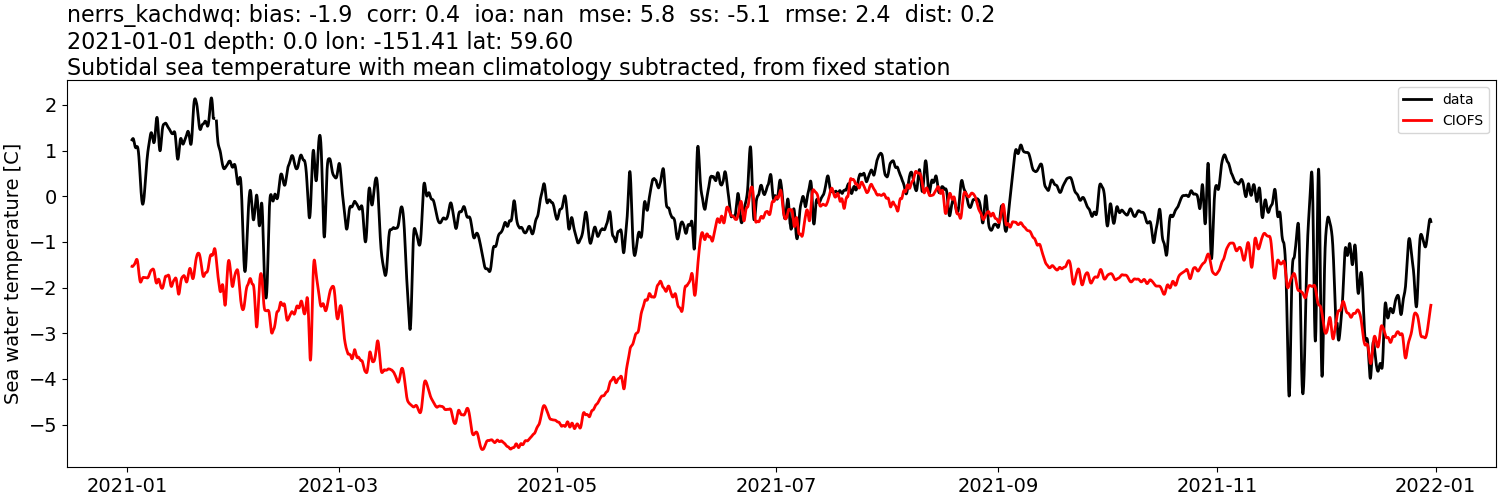
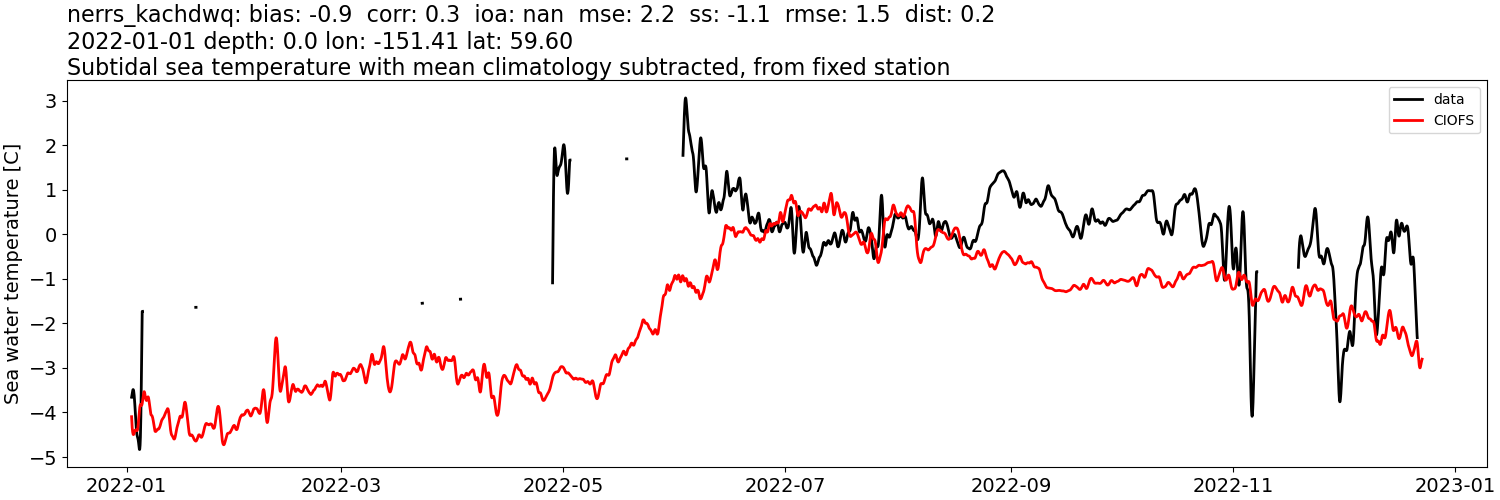
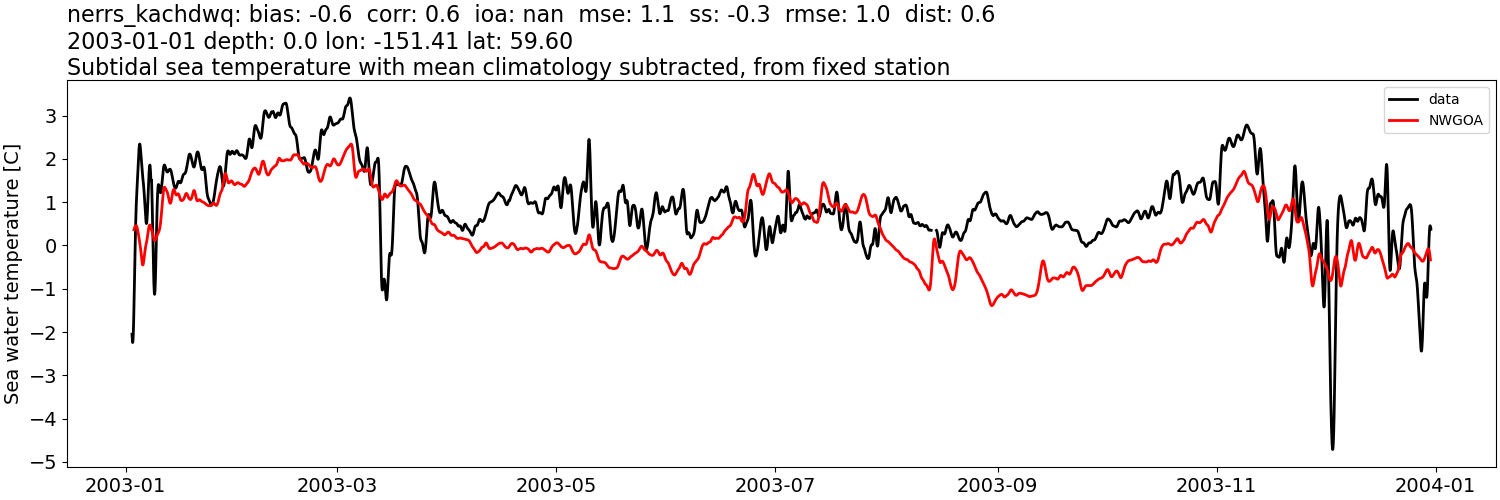
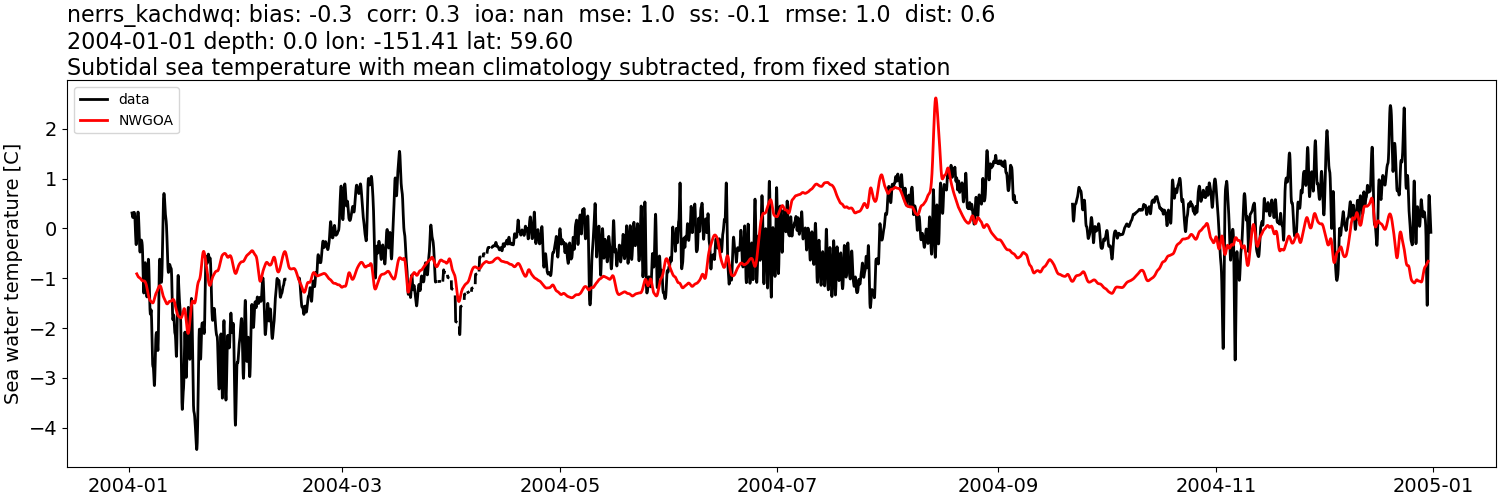
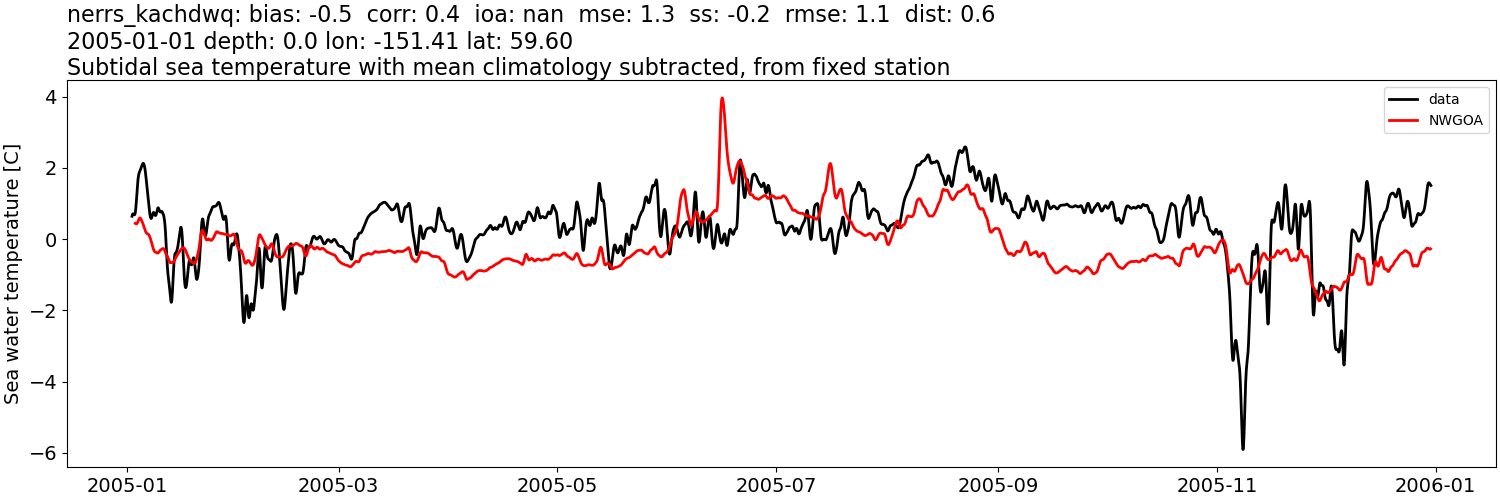
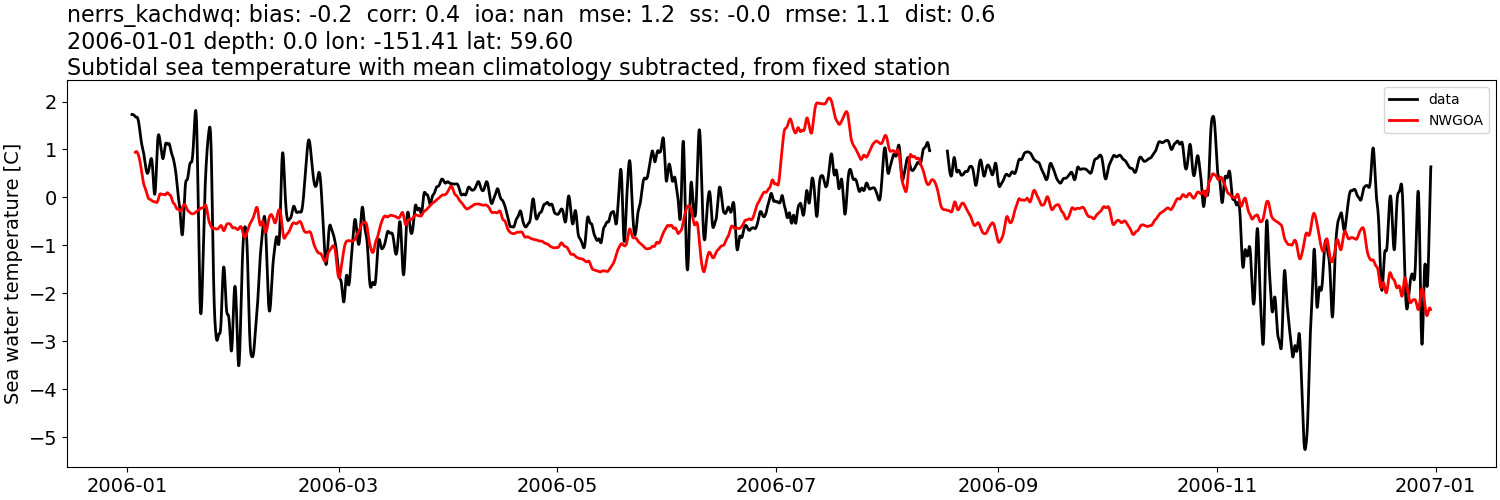
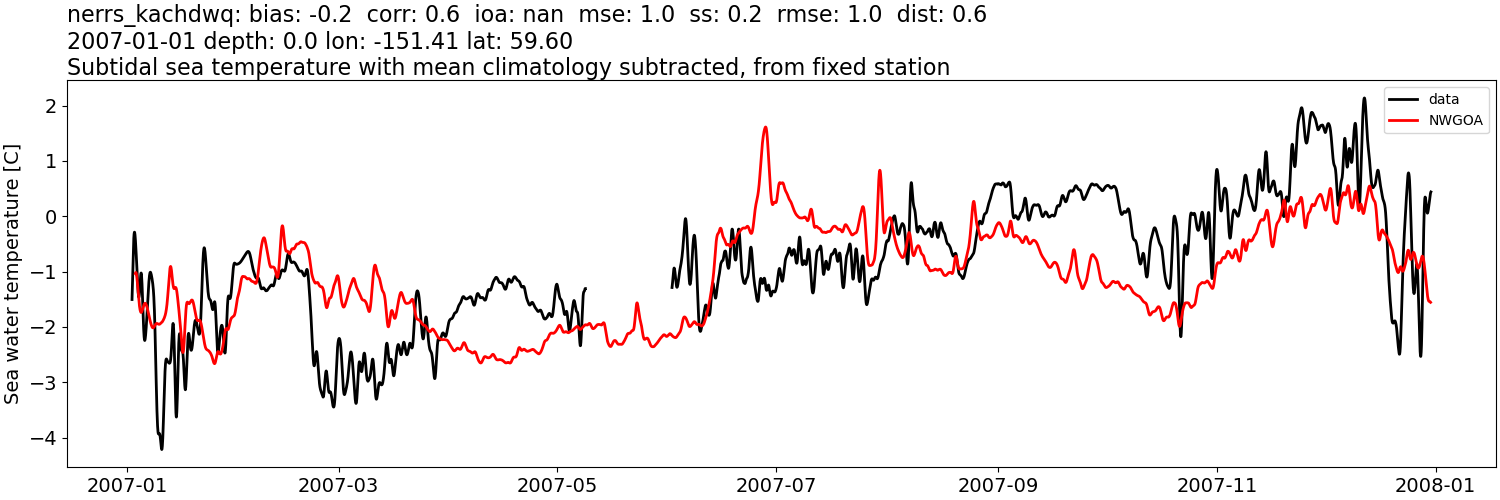
Sea water temperature: tidally-filtered, then monthly mean from data subtracted#
CIOFS#
Comparison plots by year
2003
2004
2005
2006
2007
2008
2009
2010
2011
2012
2013
2014
2015
2016
2017
2018
2019
2020
2021
2022
NWGOA#
Comparison plots by year
2003
2004
2005
2006
2007
2008