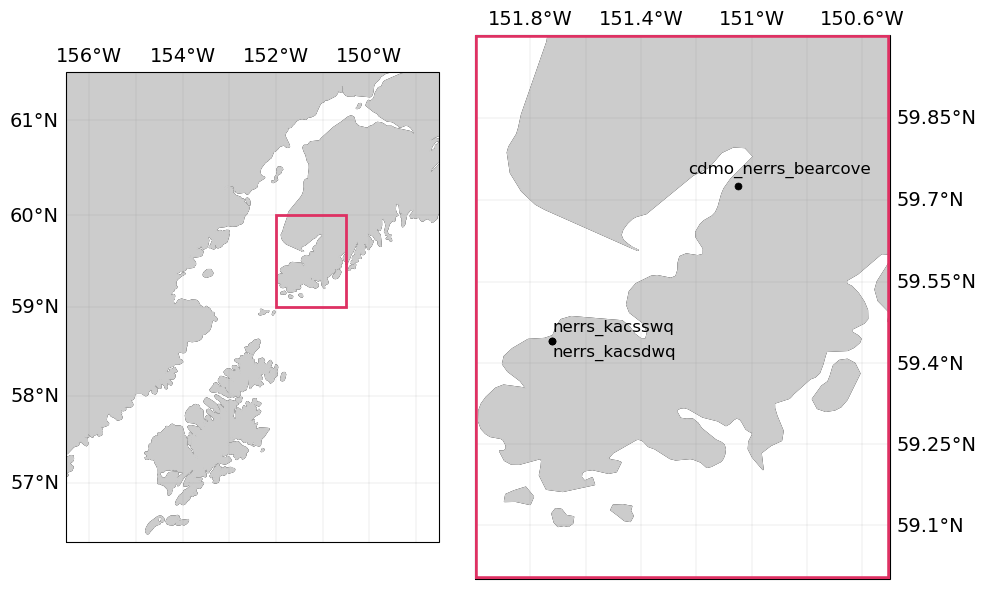
Moorings (KBNERR): Kachemak Bay: Bear Cove, Seldovia#
moorings_kbnerr_bear_cove_seldovia
See the full dataset page for more information: Moorings (KBNERR): Kachemak Bay: Bear Cove, Seldovia
Map of Moorings#
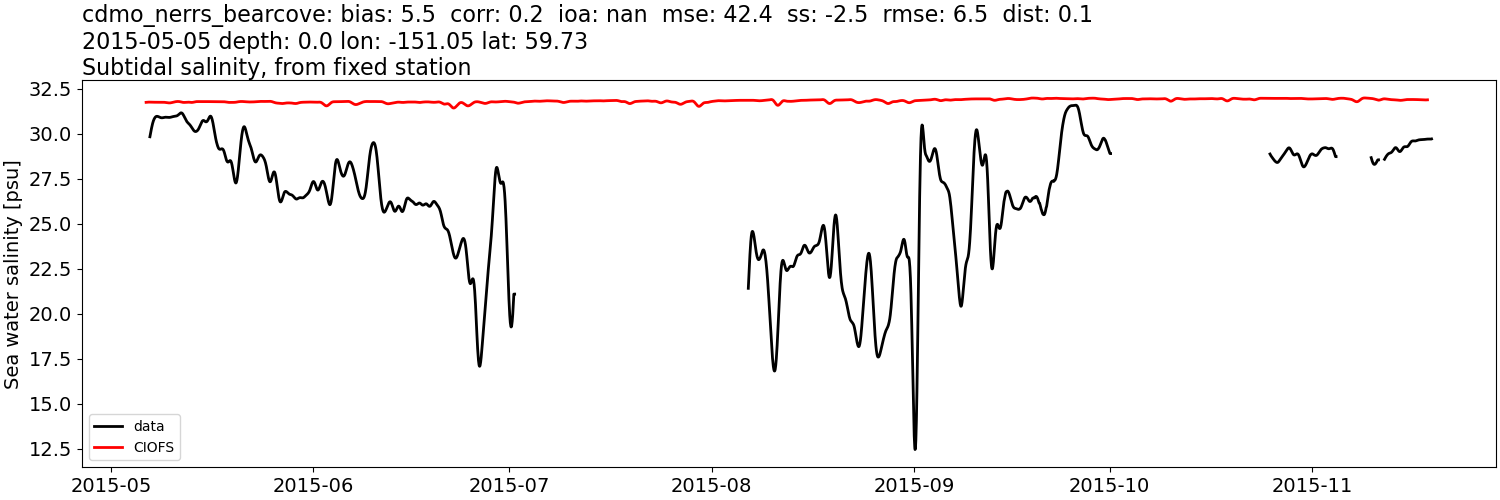
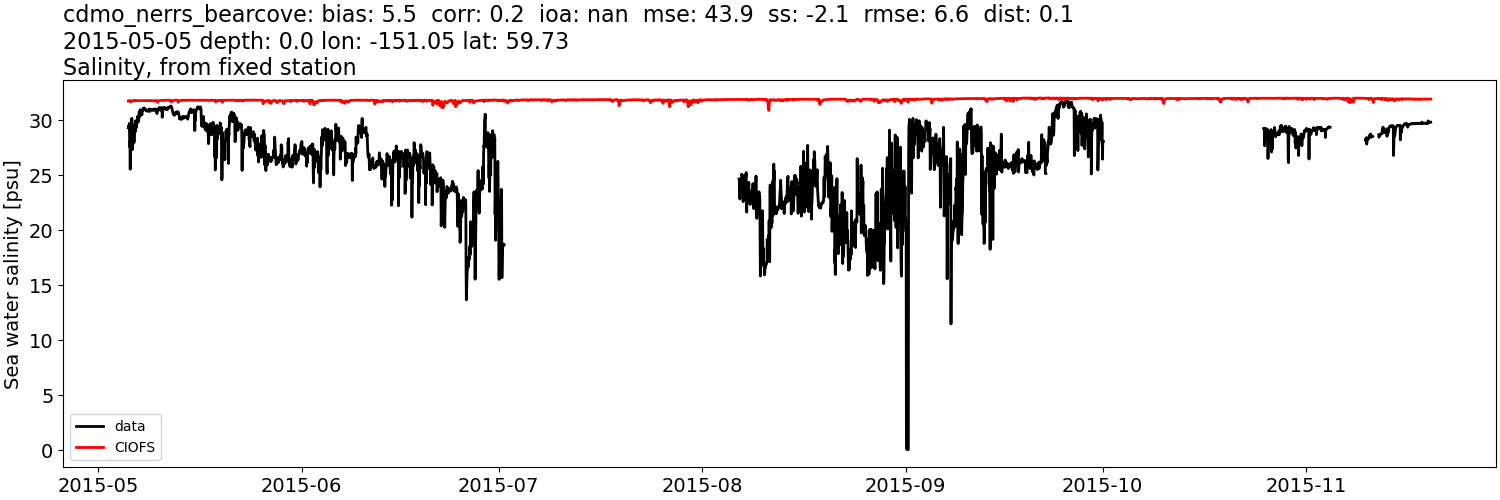
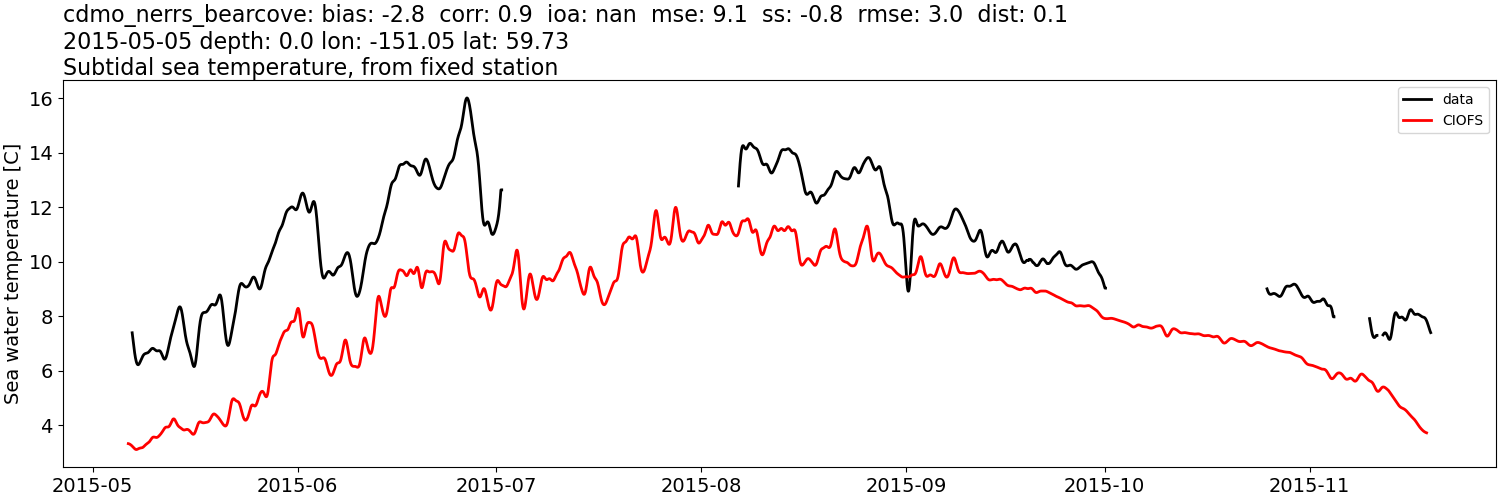
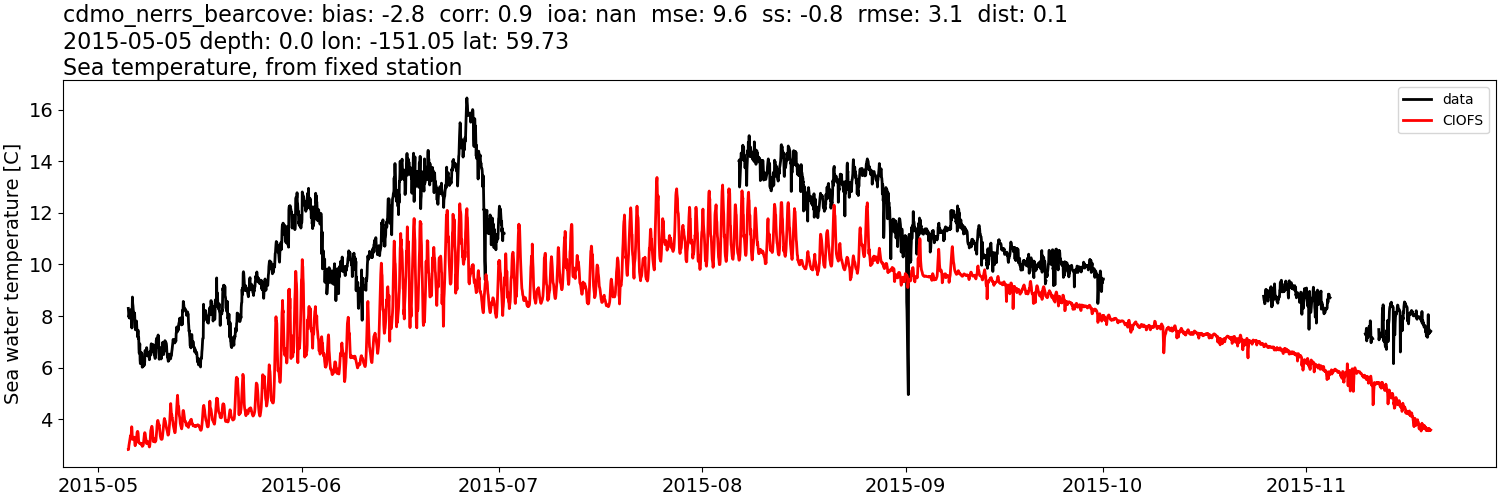
cdmo_nerrs_bearcove#
NWGOA: Data time range is 2015-05-05 to 2015-11-20 but model ends 2009-01-01.
Sea water salinity: tidally-filtered#
CIOFS#
Sea water salinity:#
CIOFS#
Sea water temperature: tidally-filtered#
CIOFS#
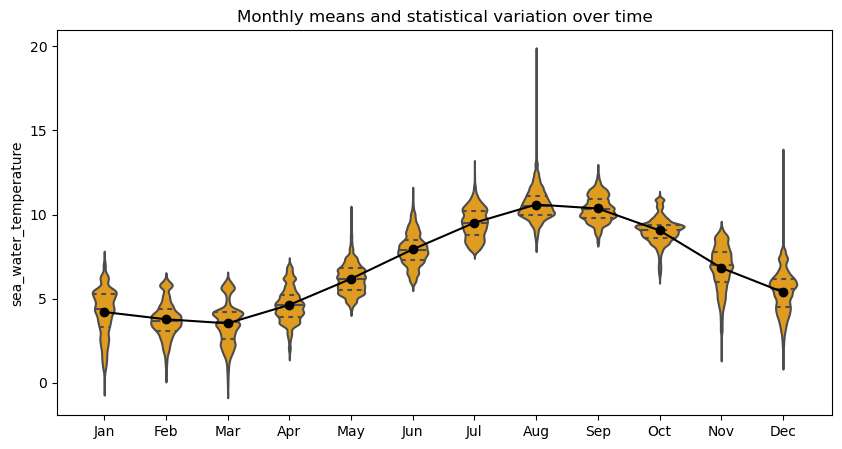
Sea water temperature:#
CIOFS#
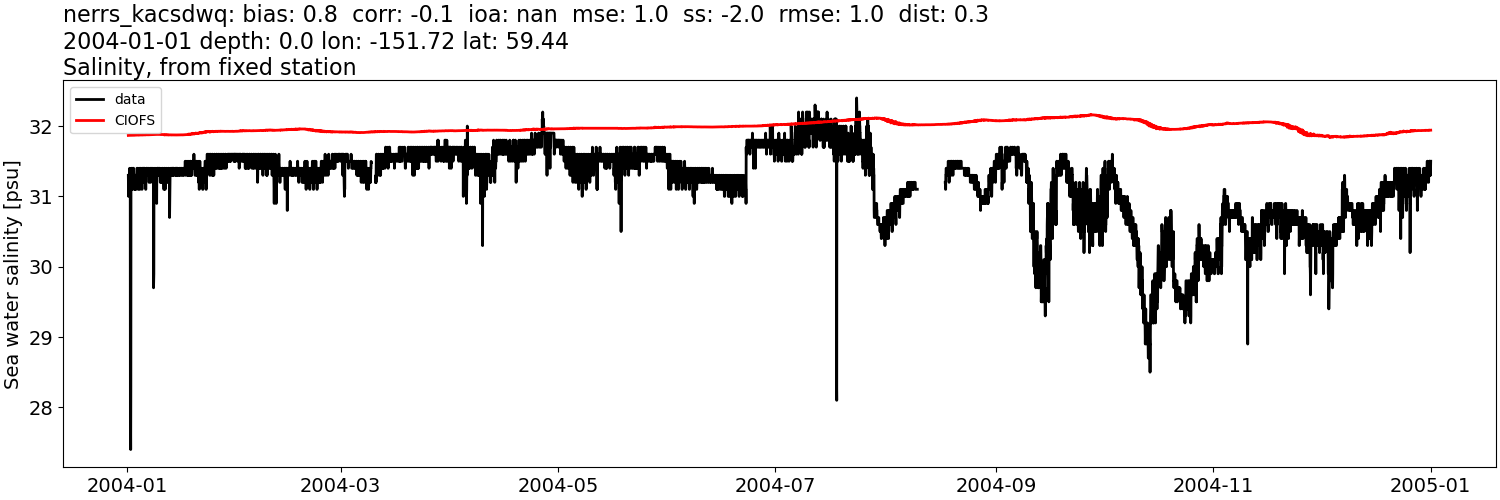
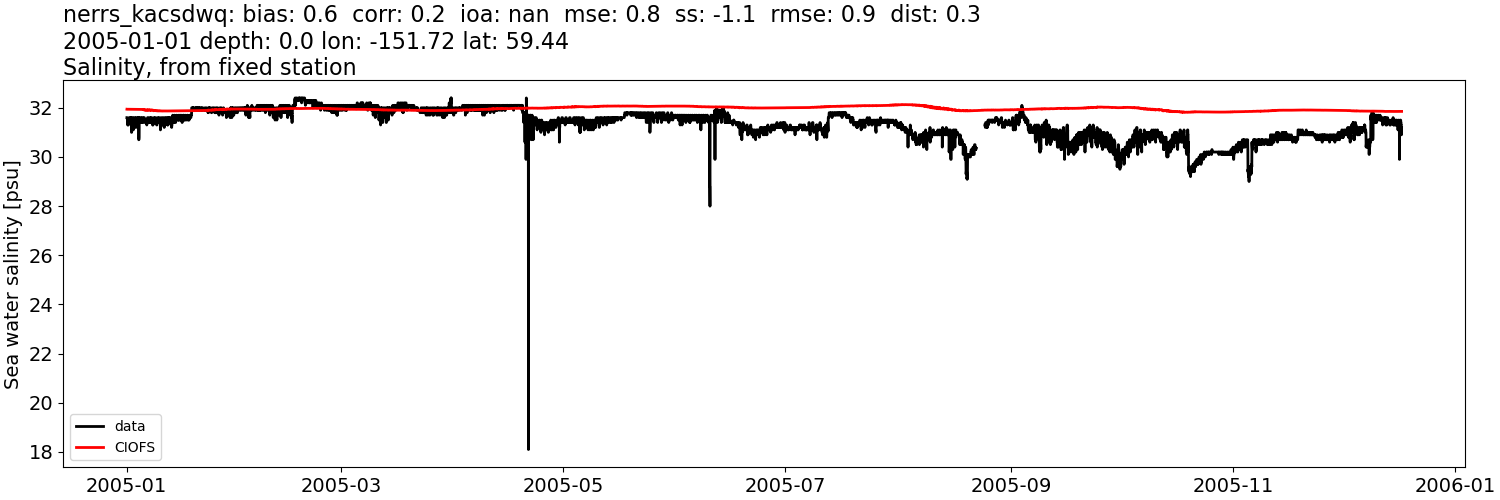
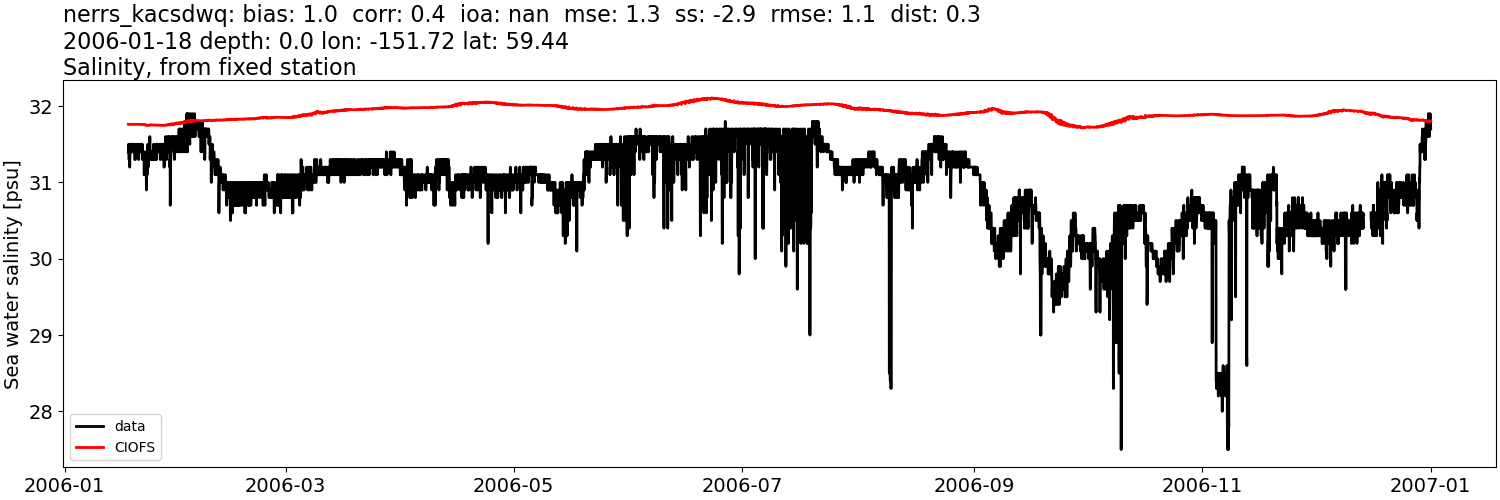
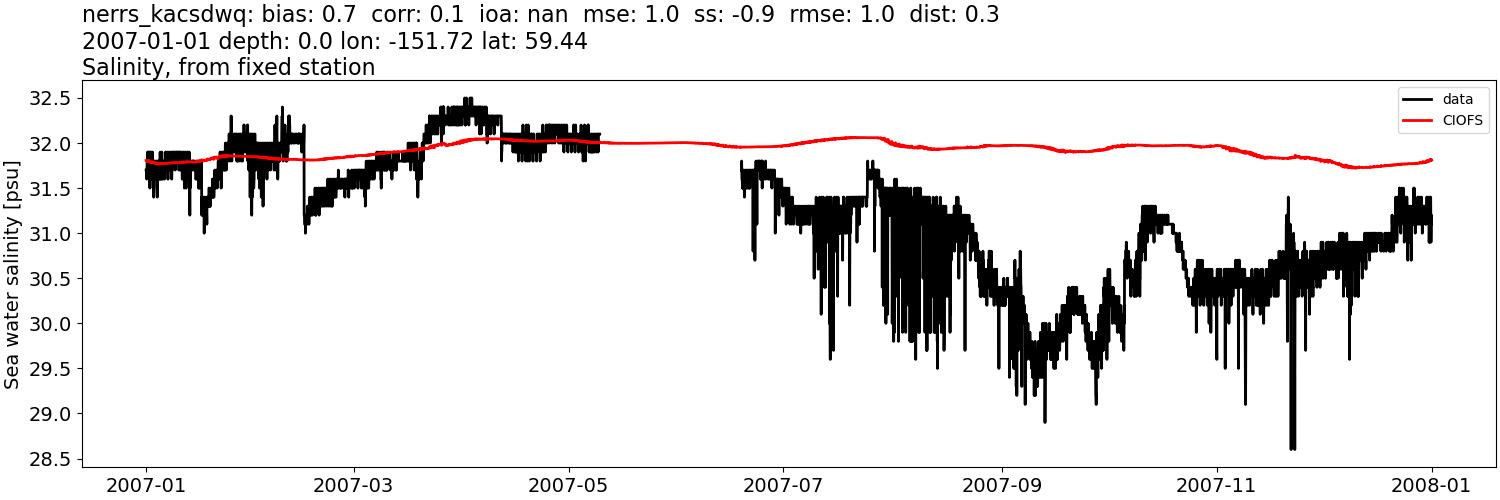
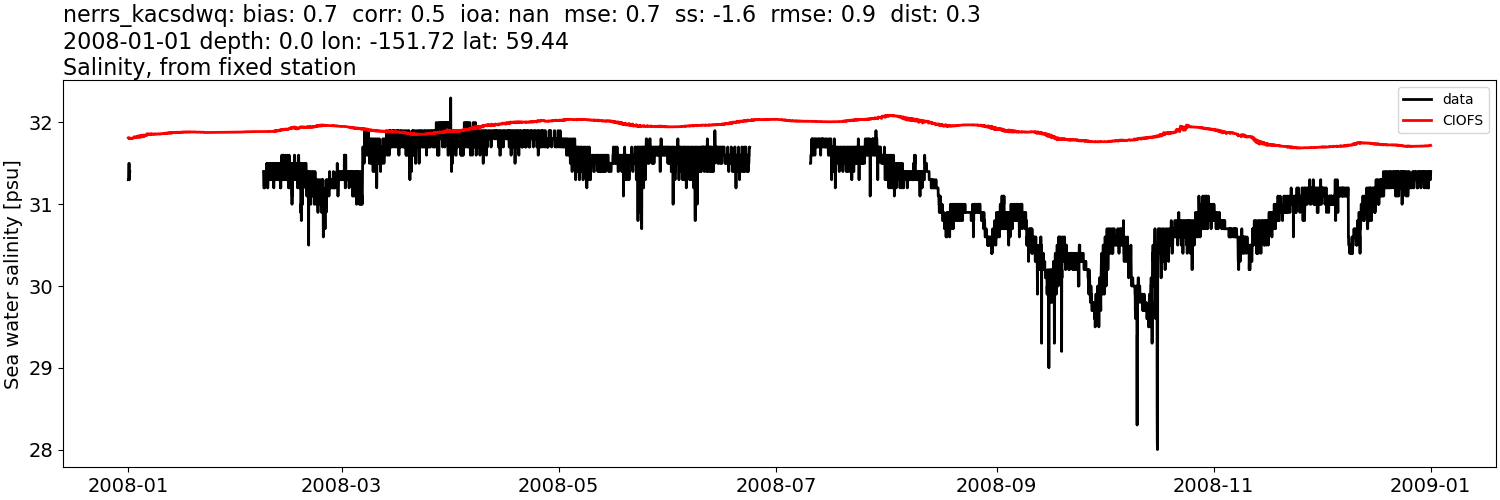
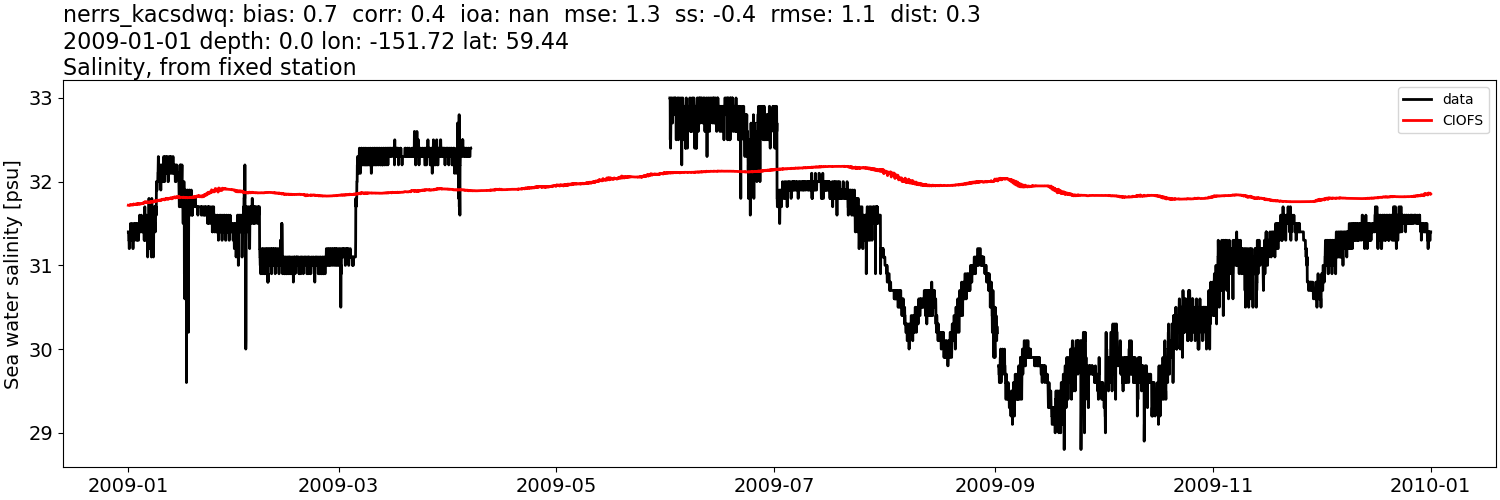
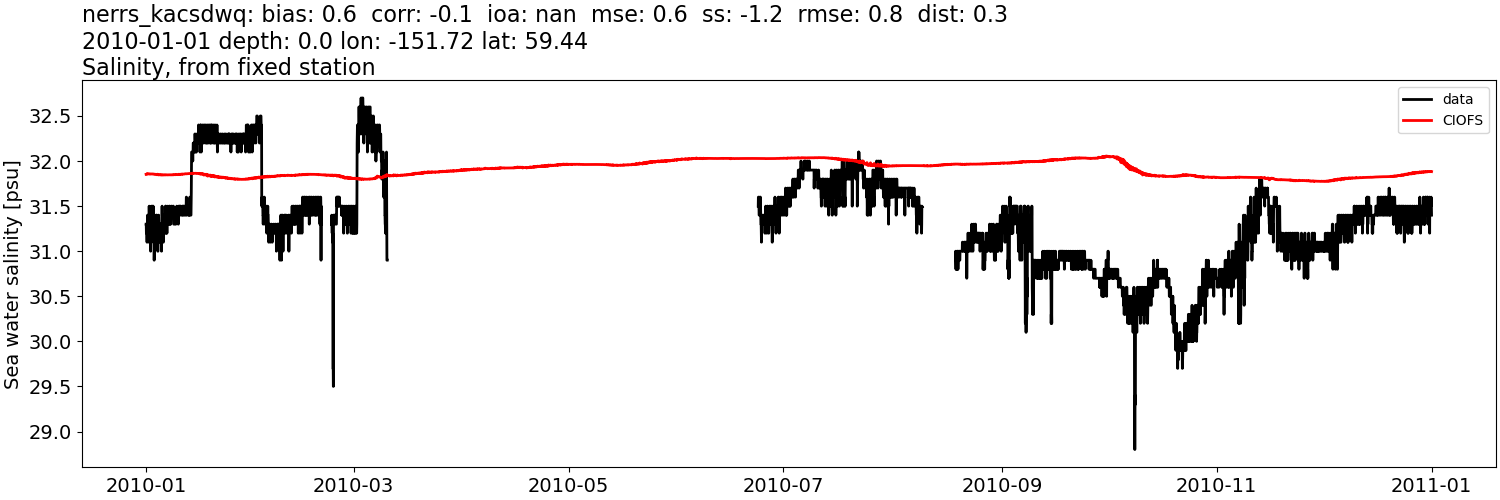
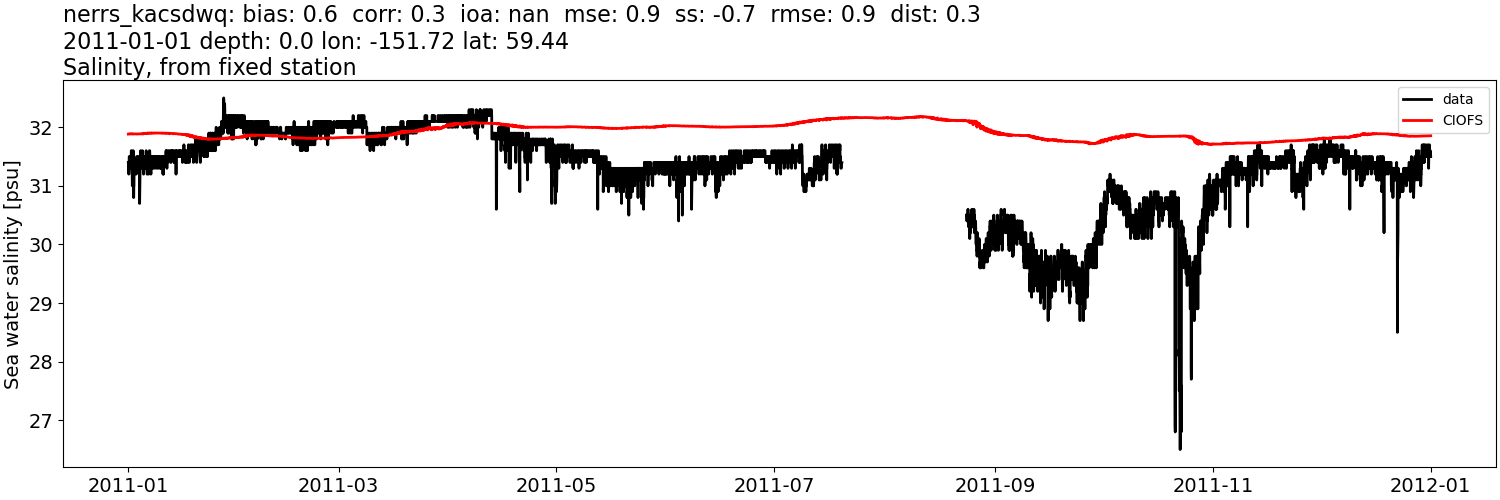
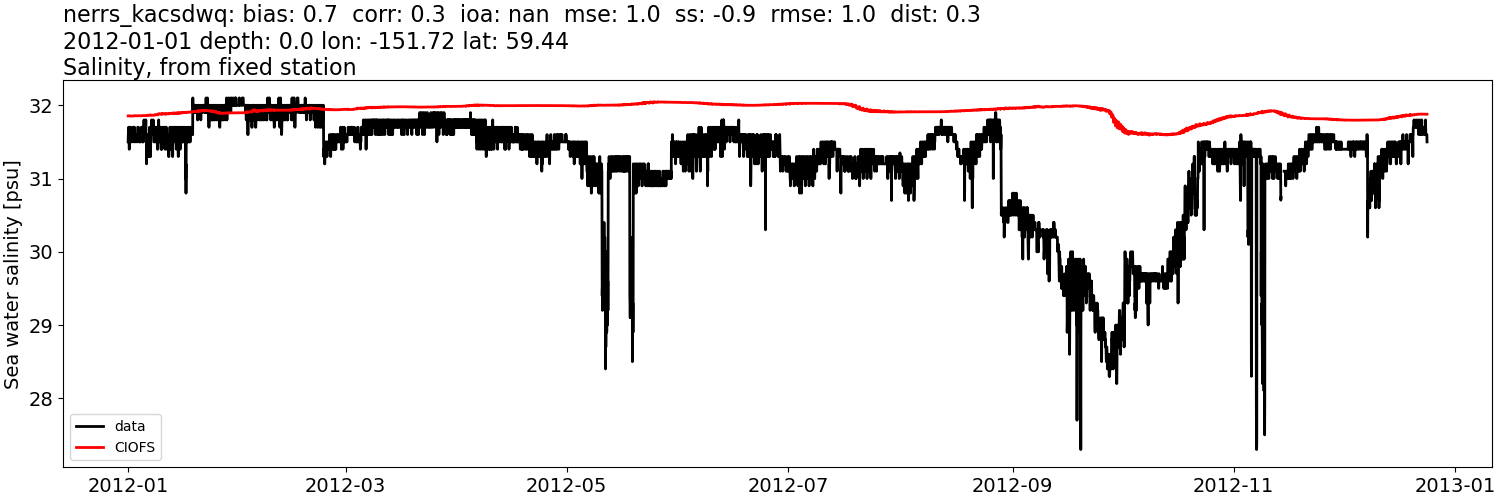
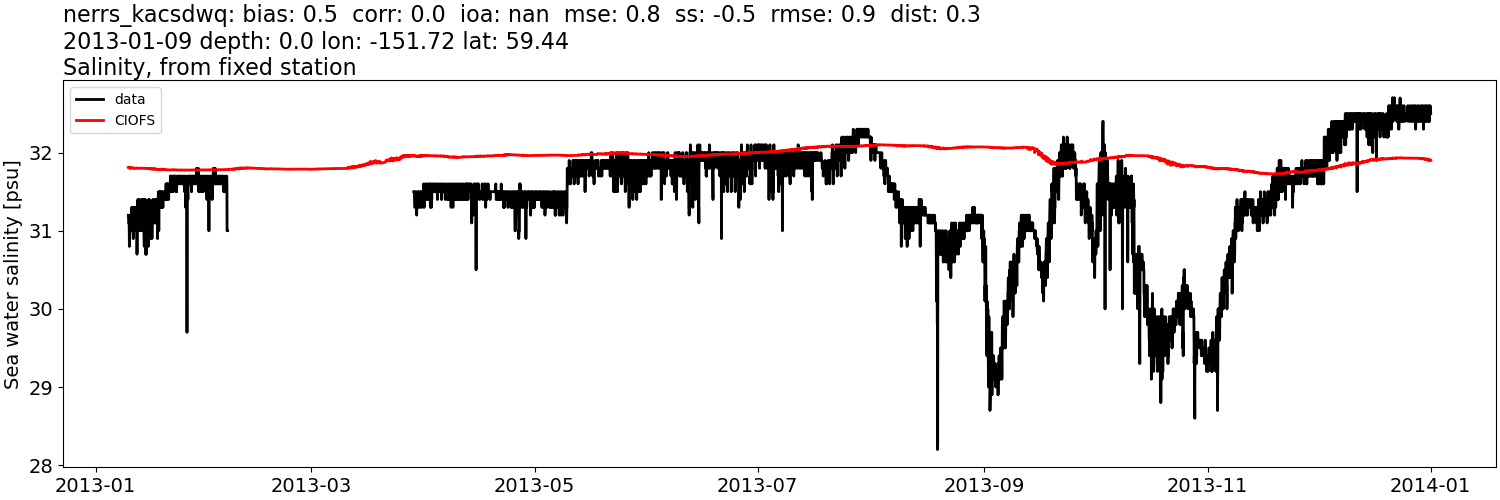
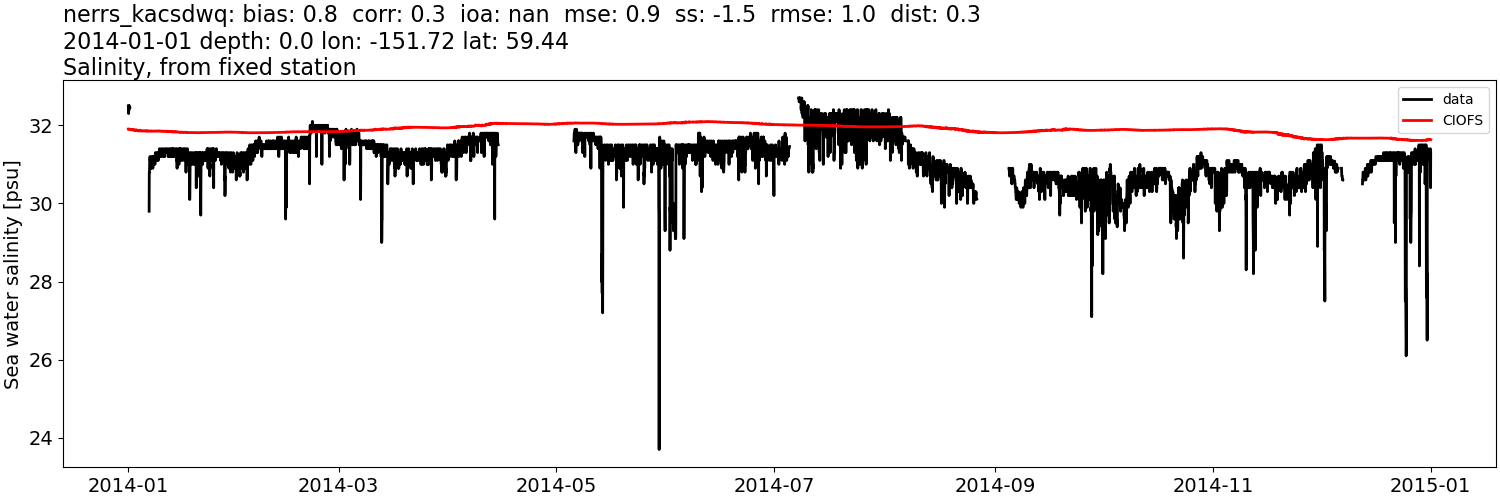
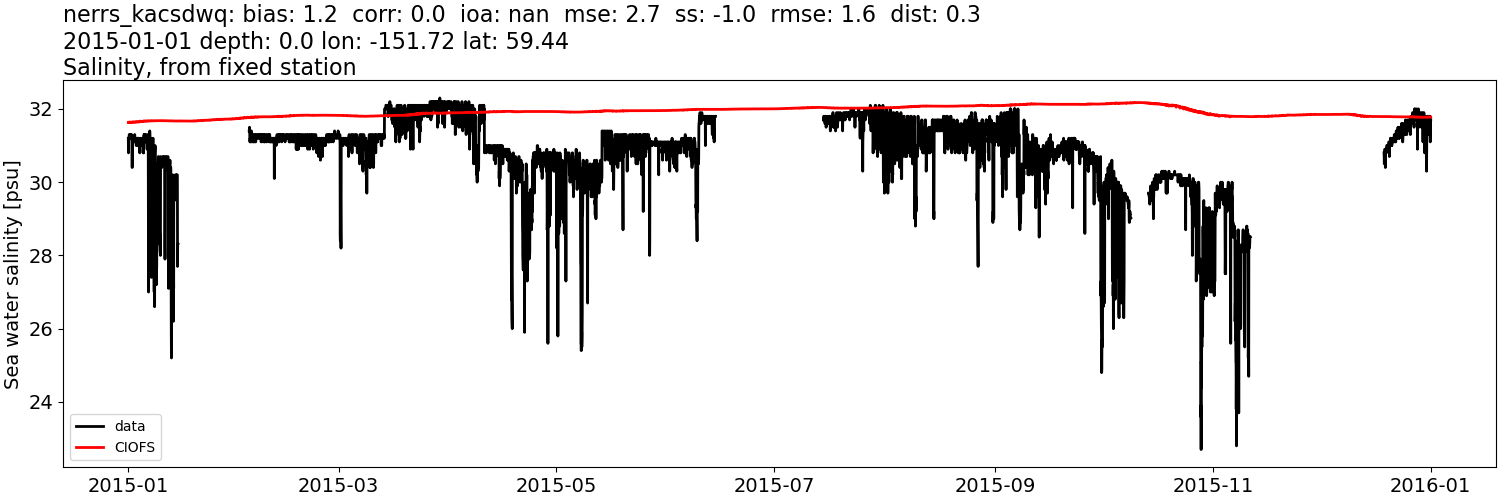
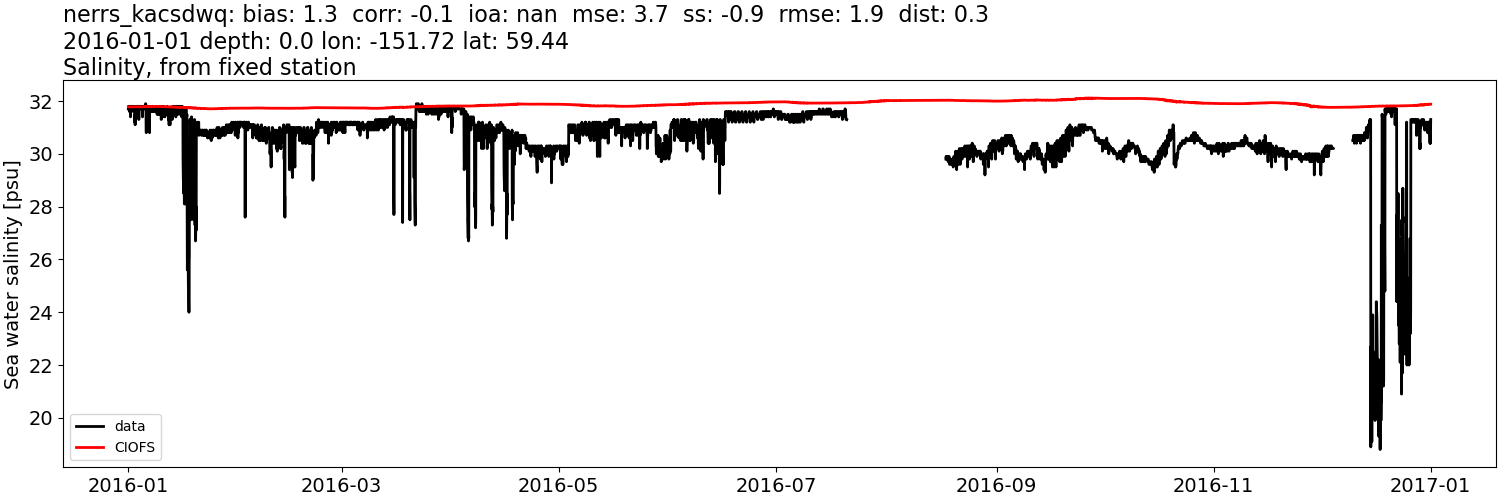
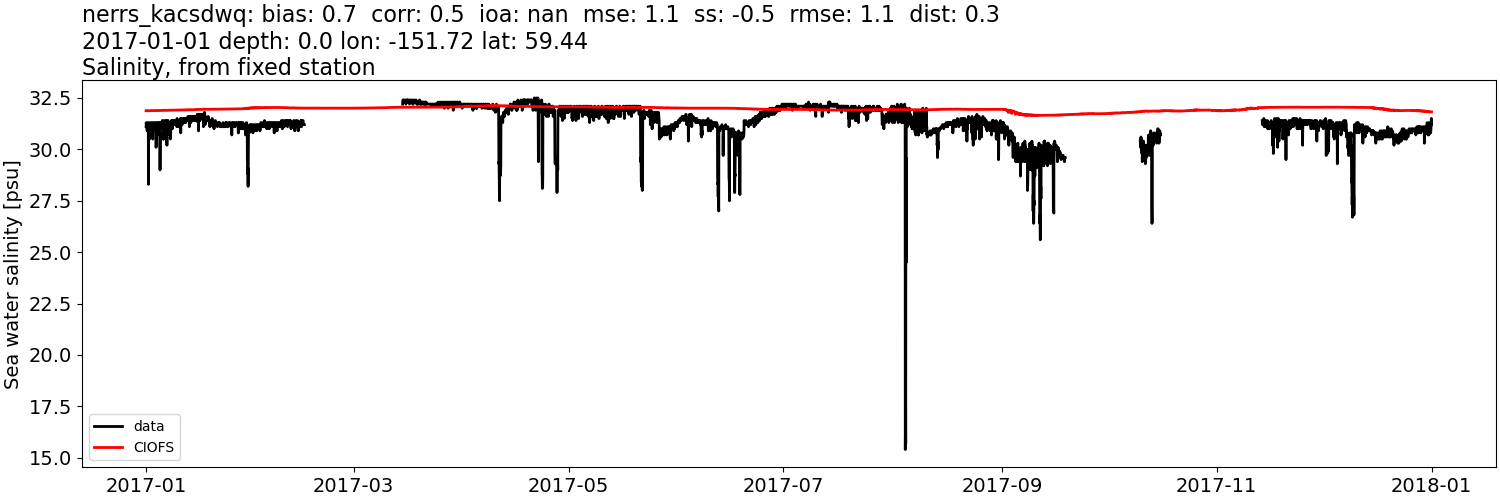
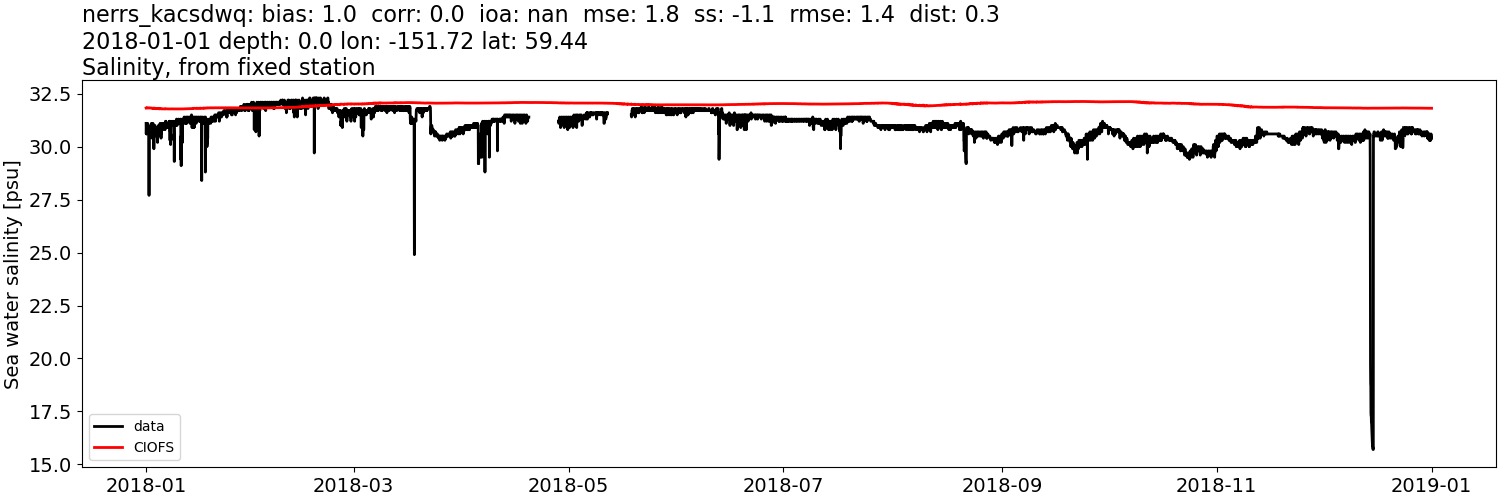
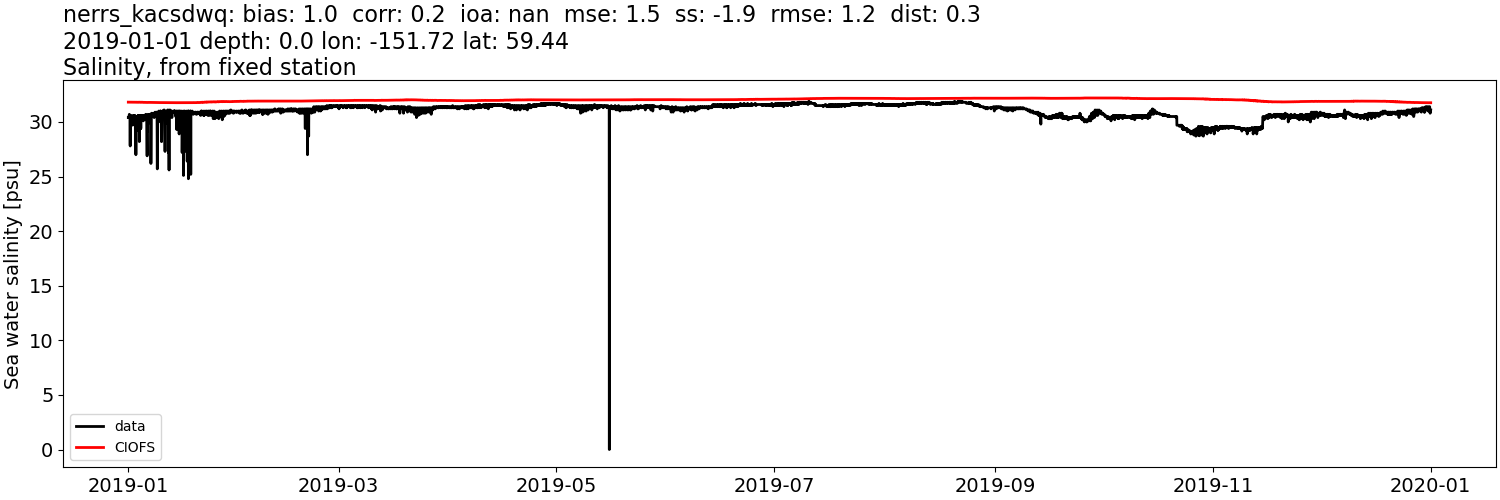
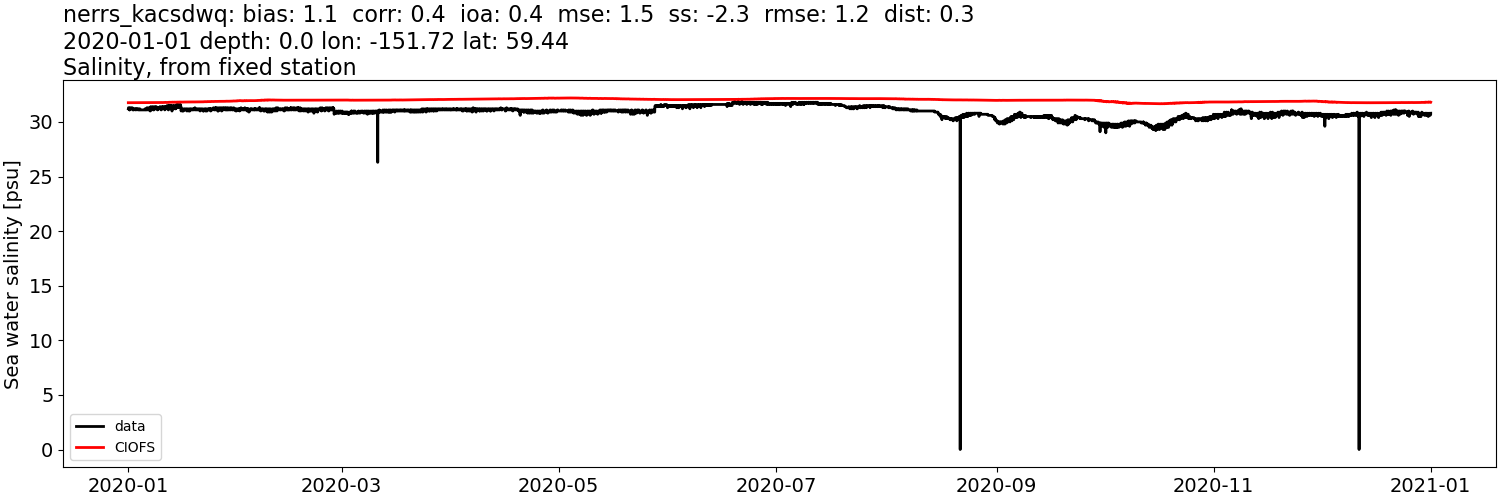
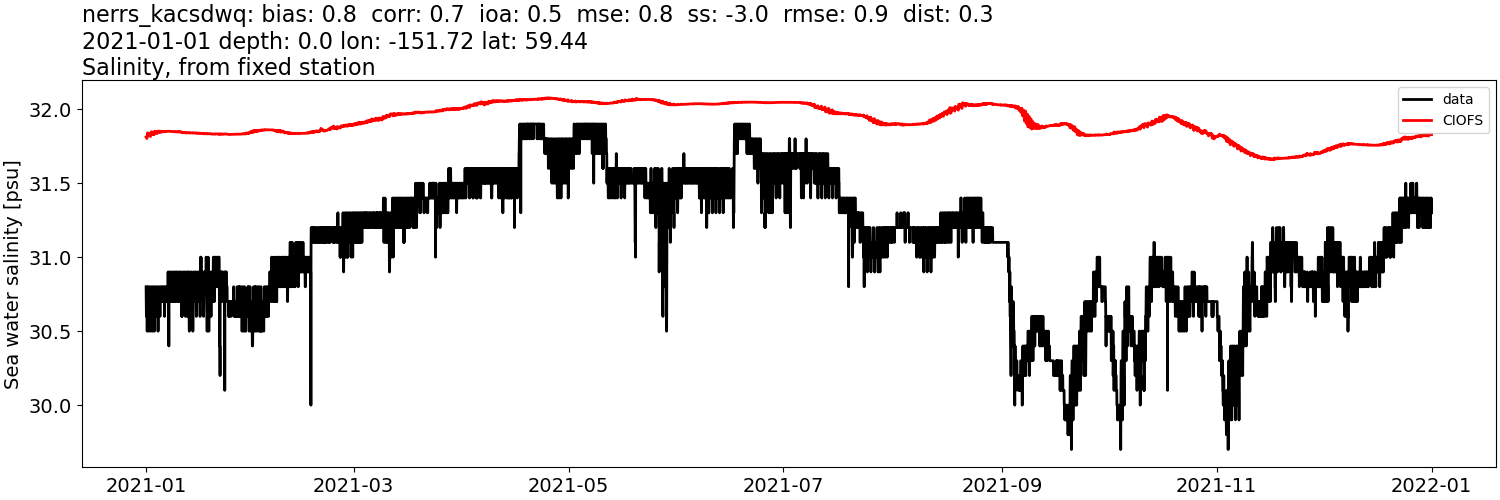
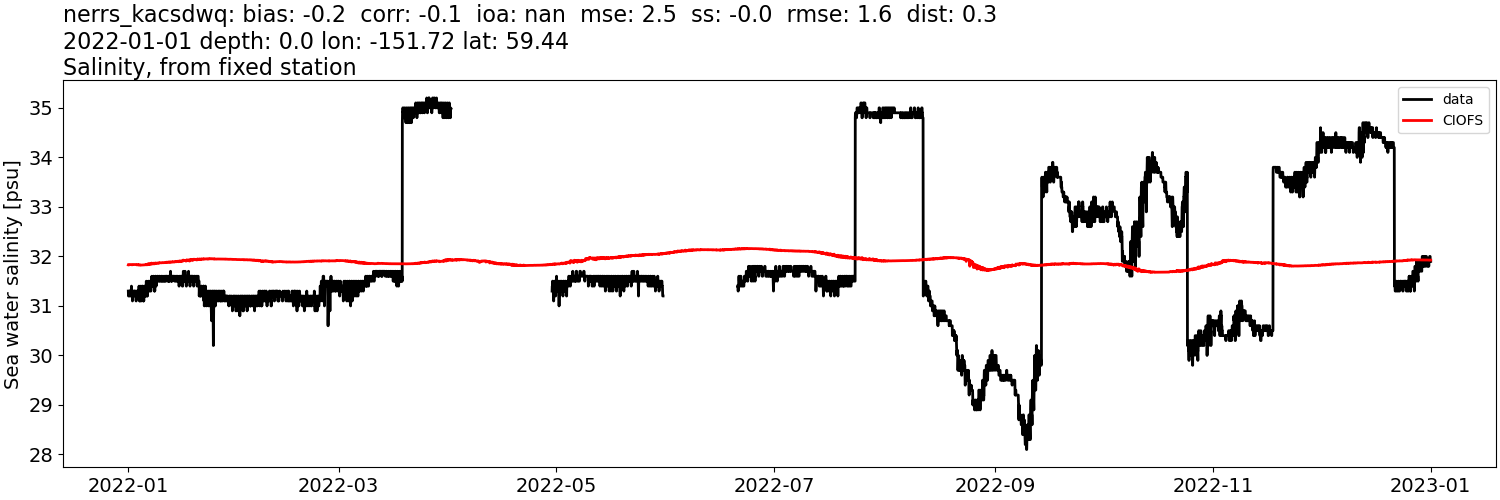
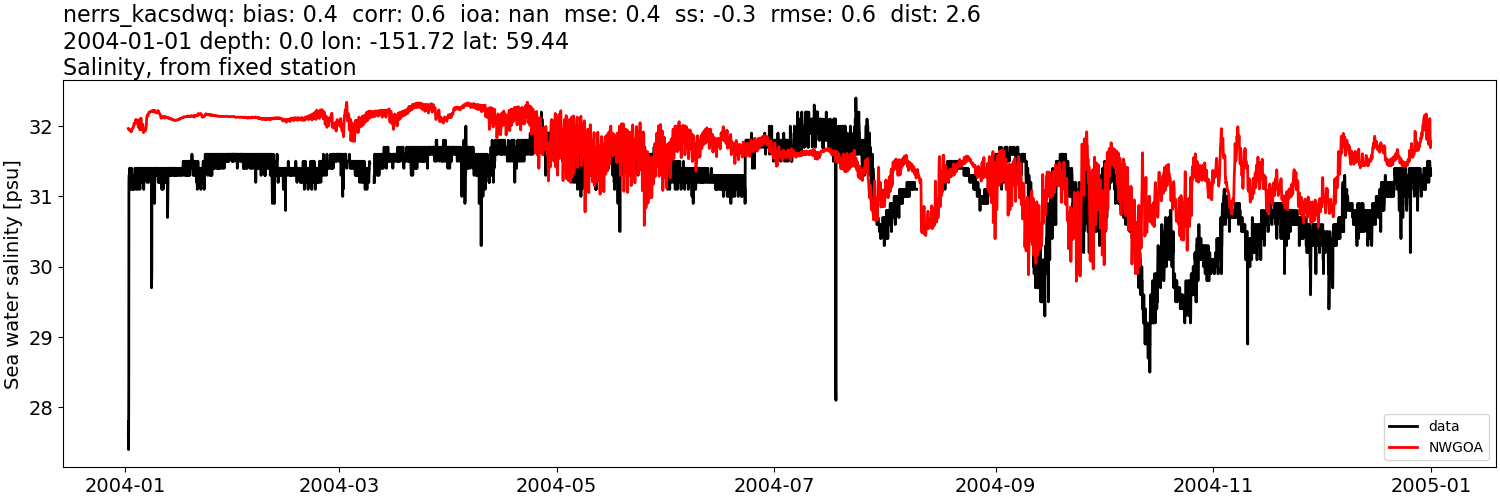
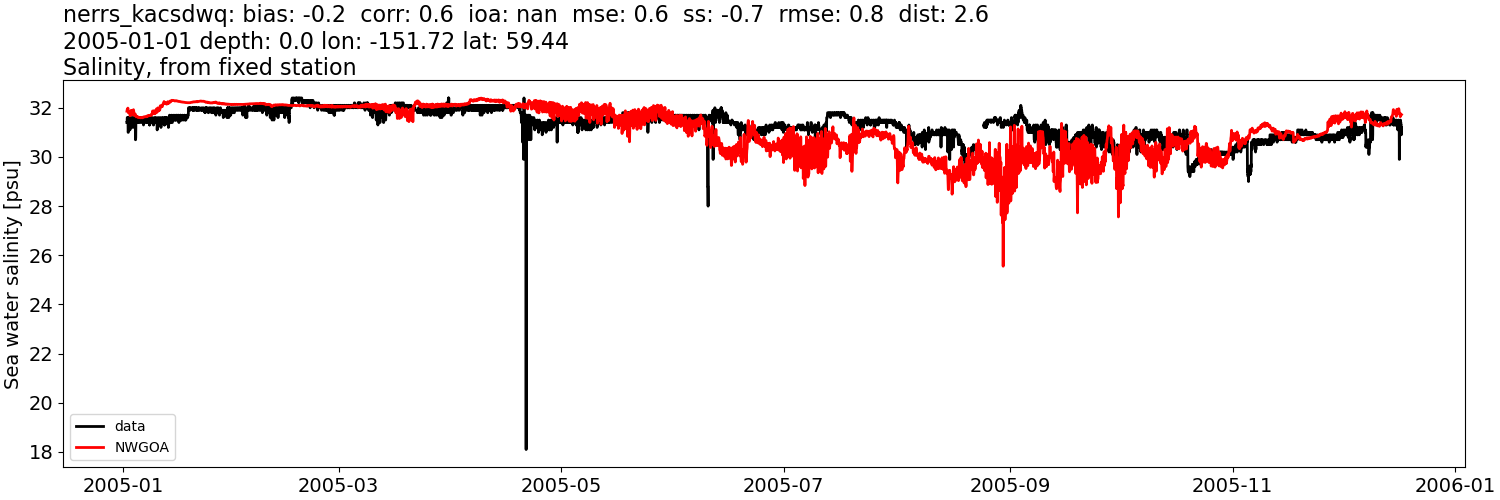
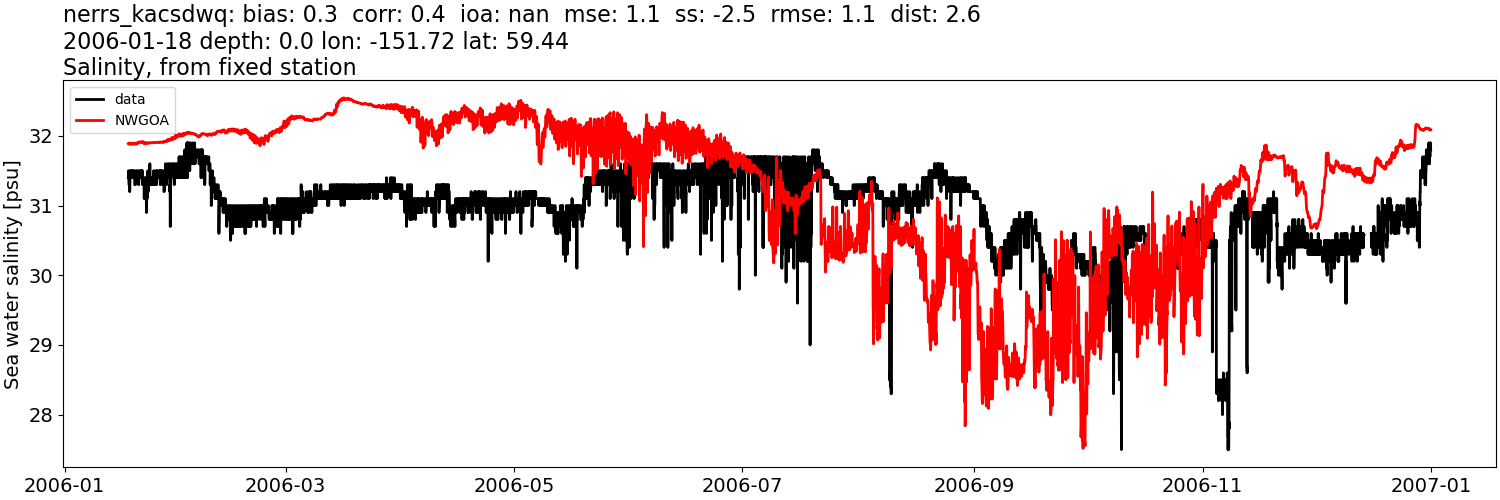
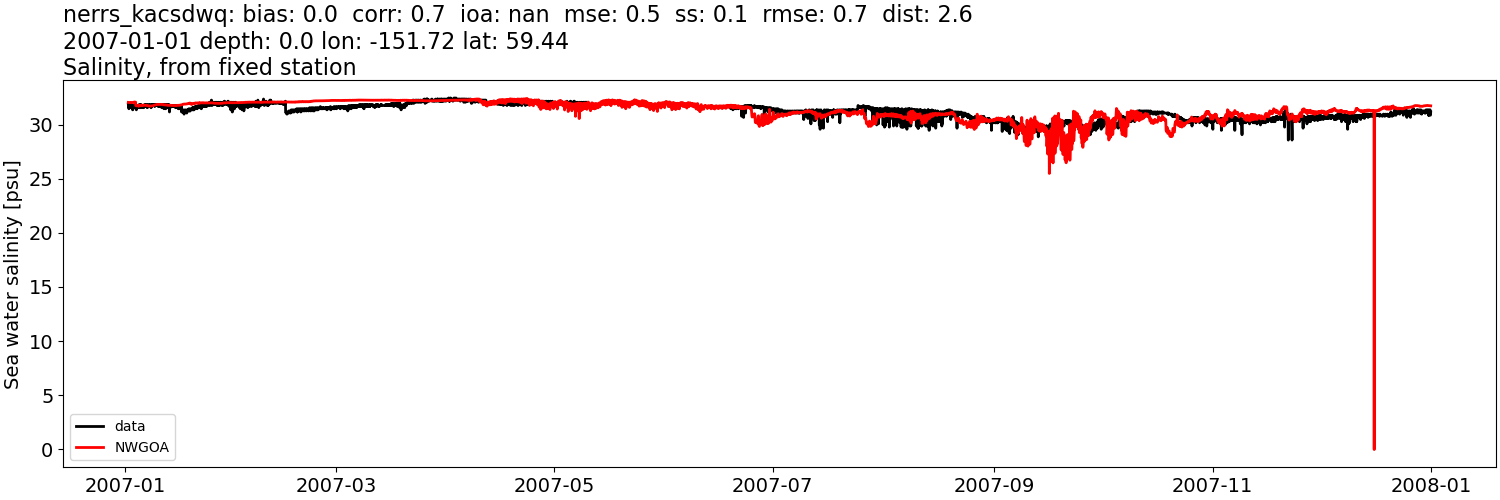
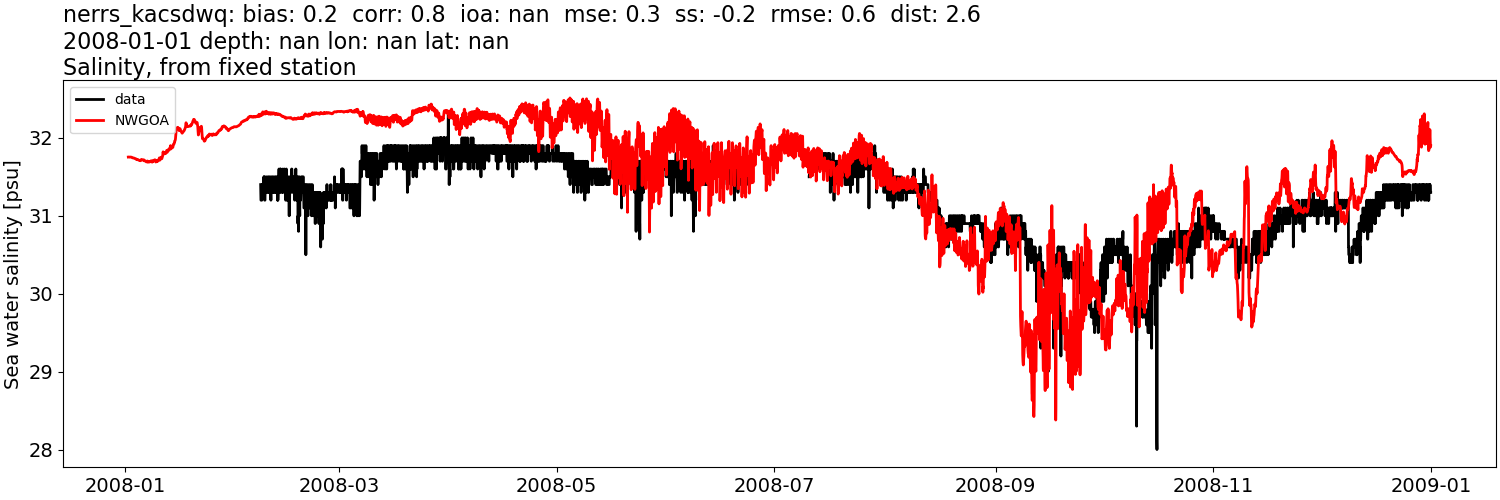
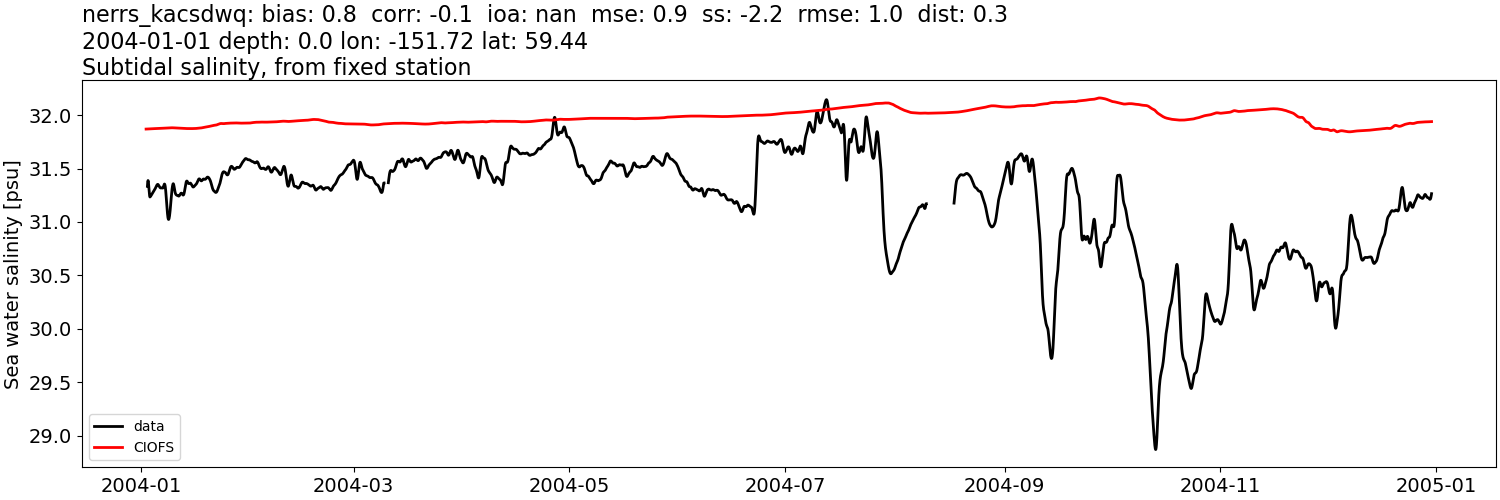
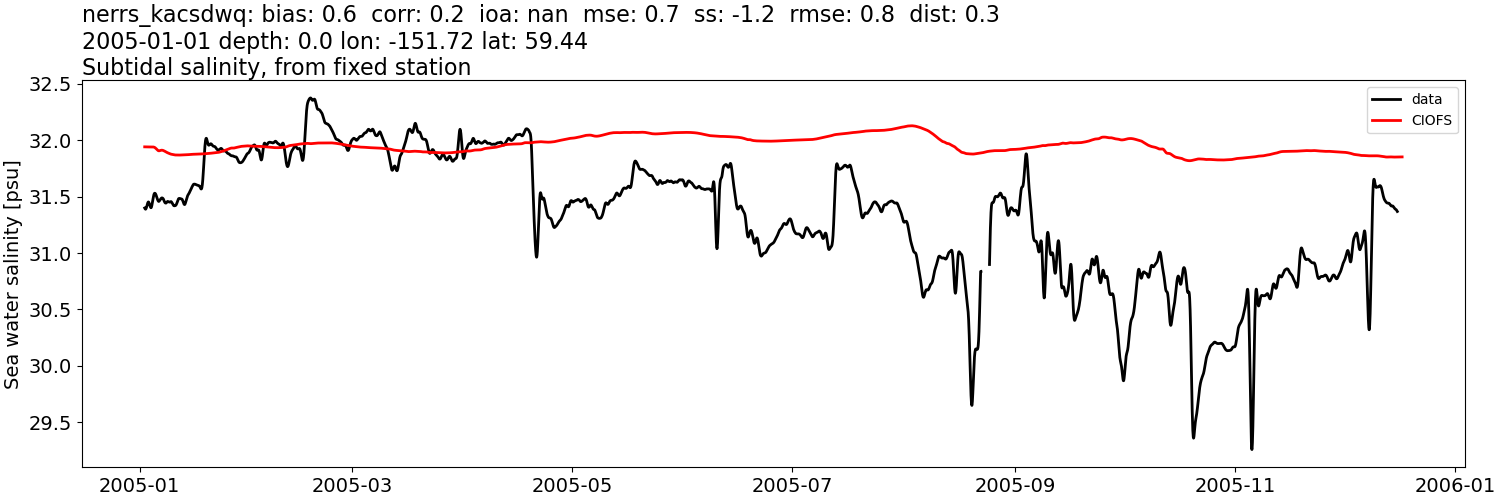
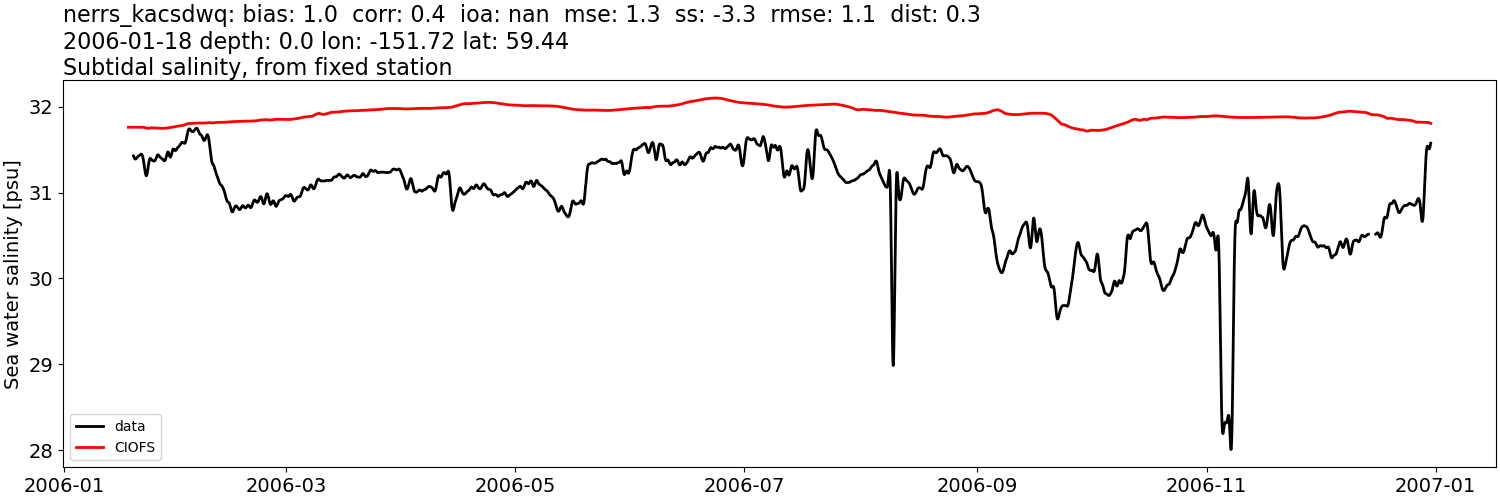
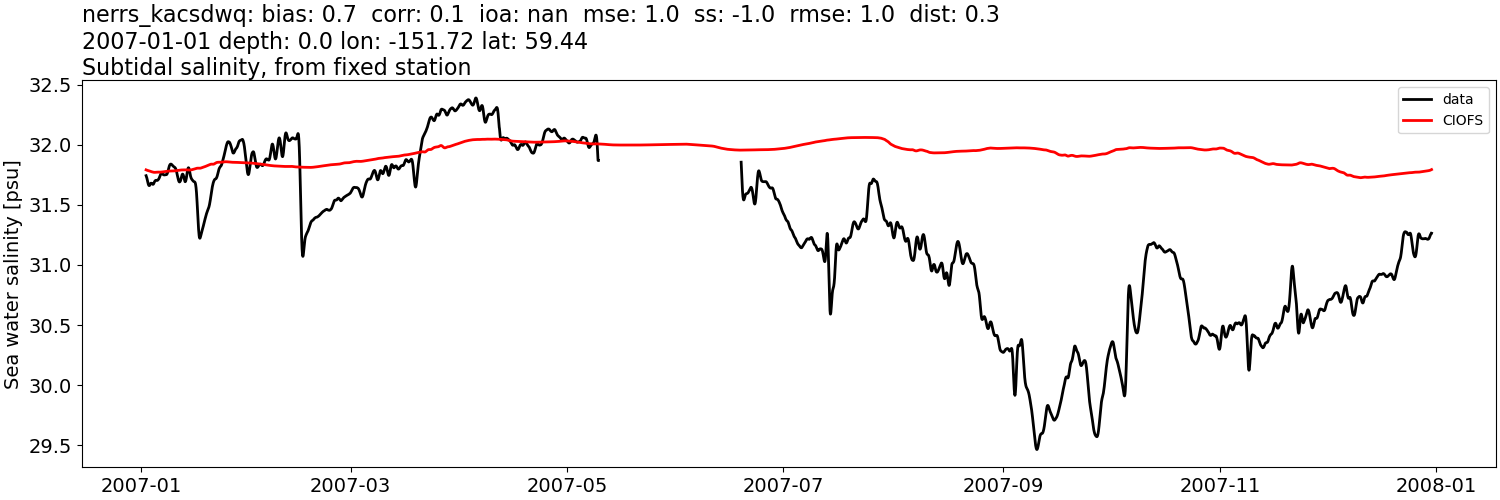
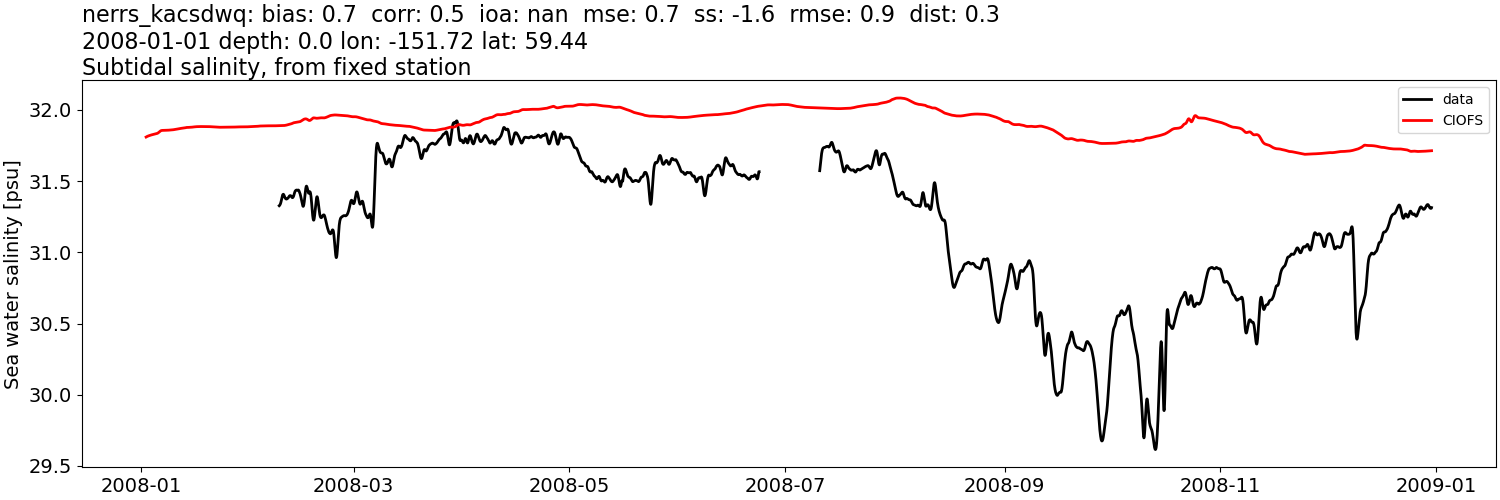
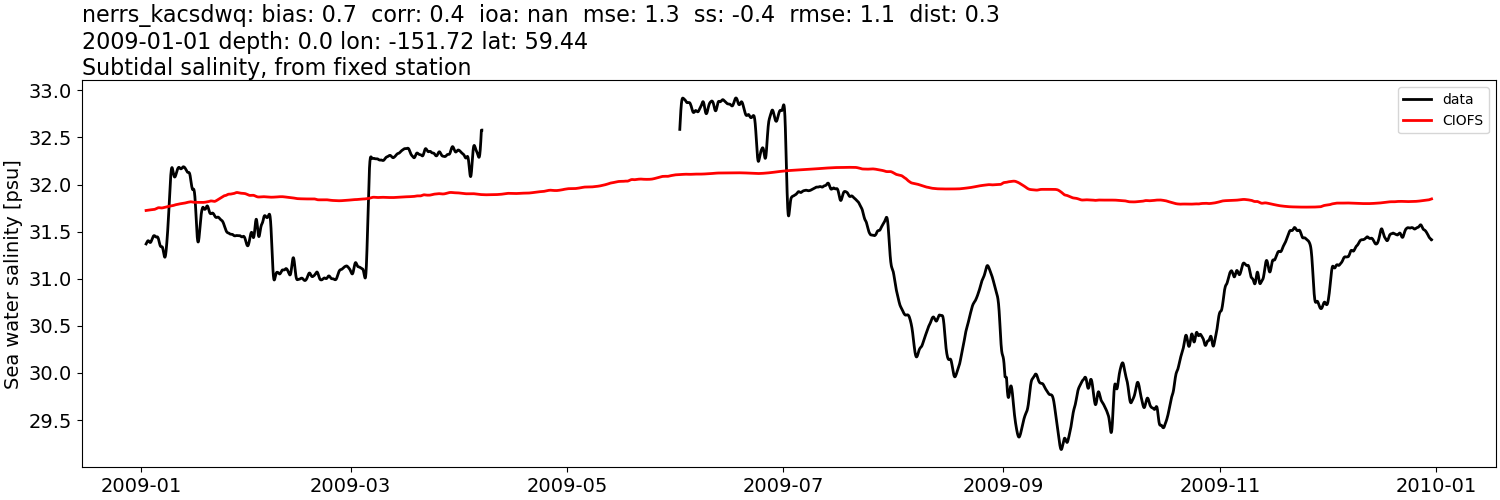
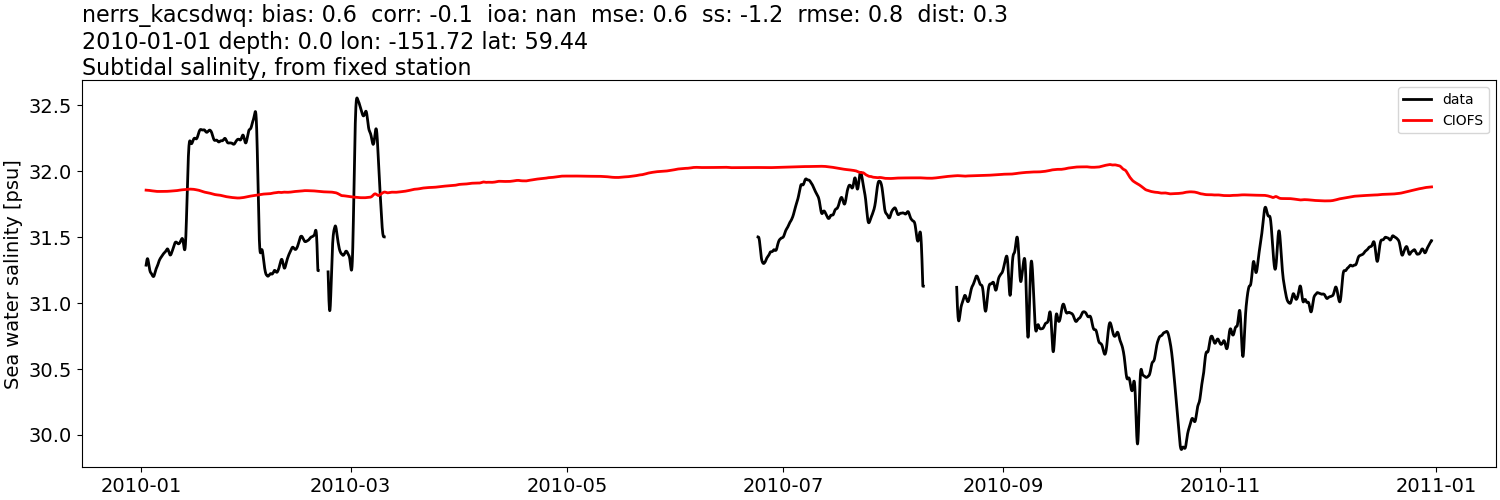
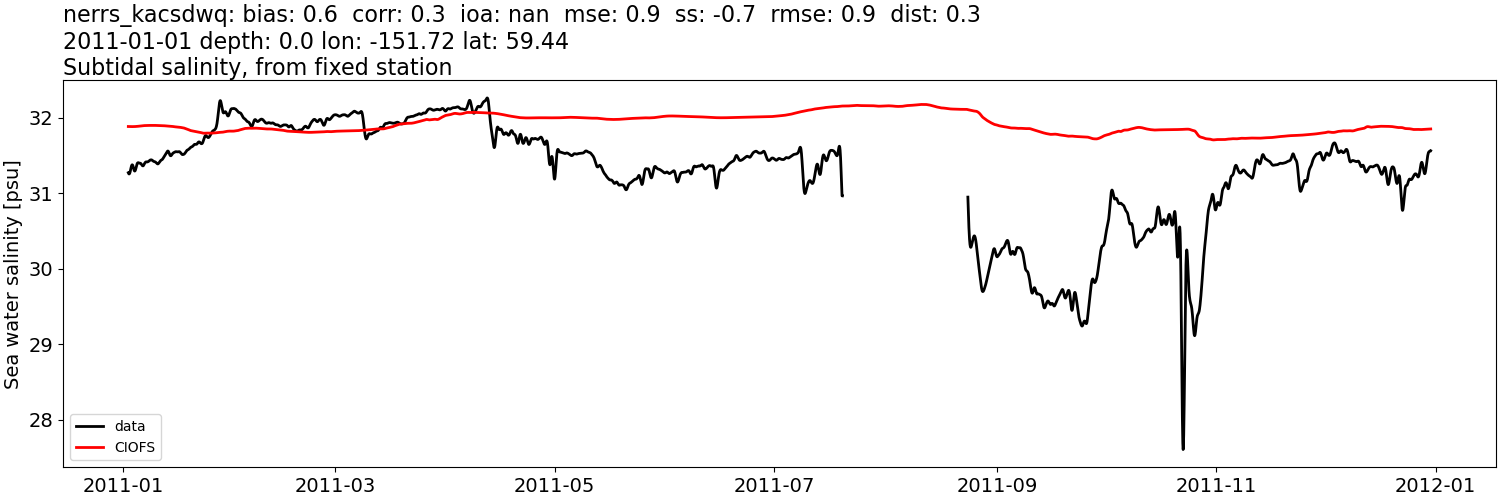
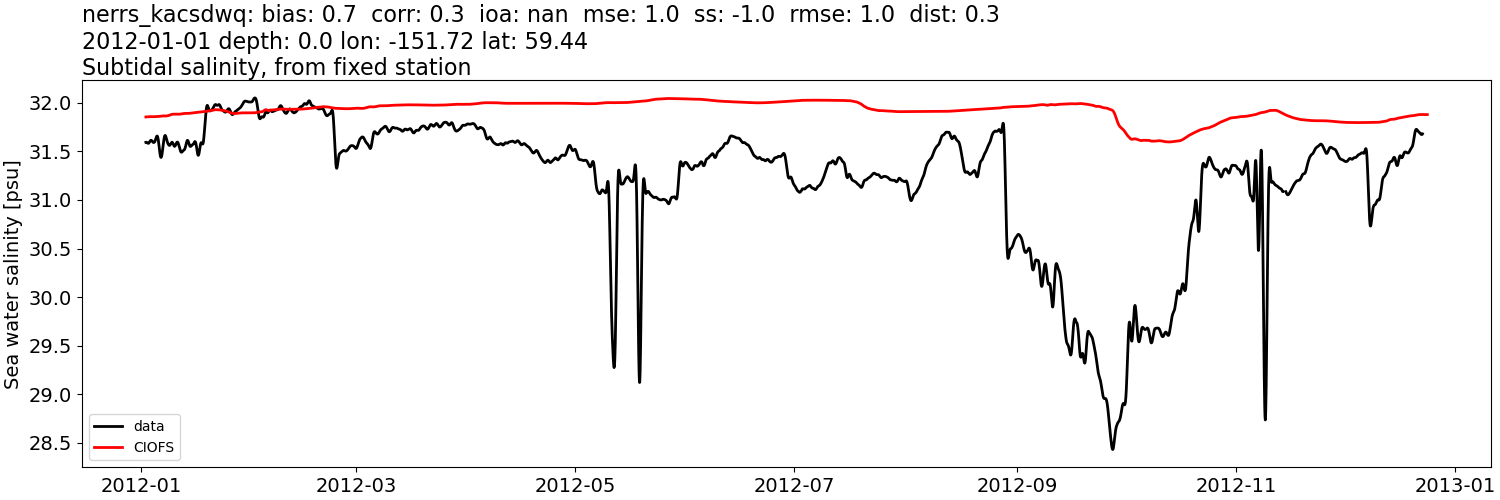
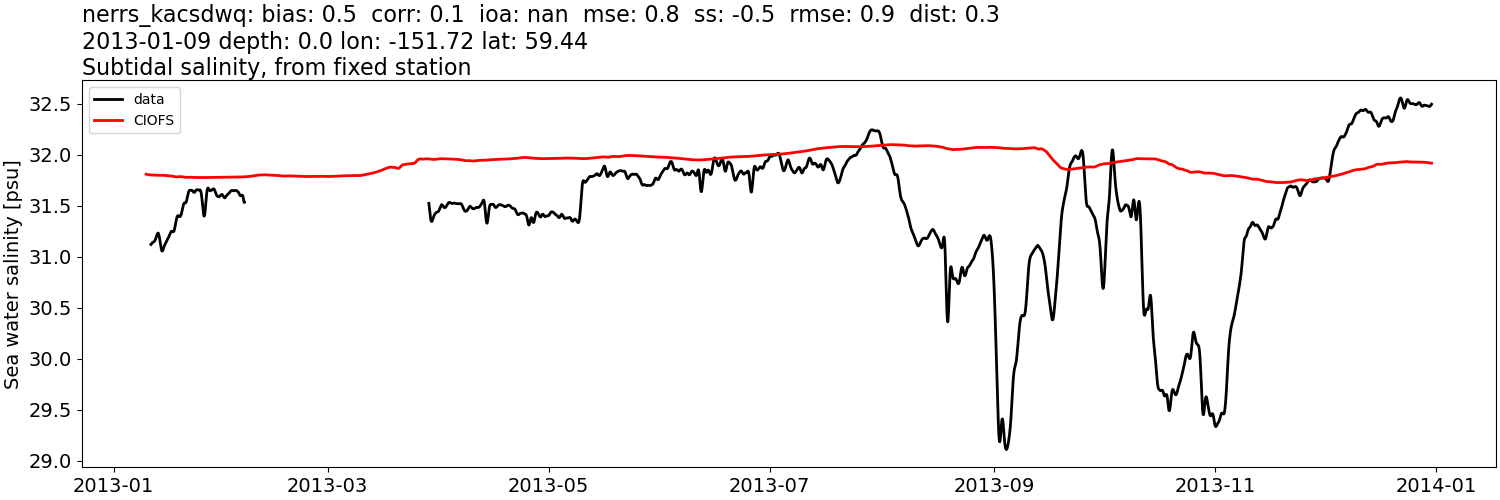
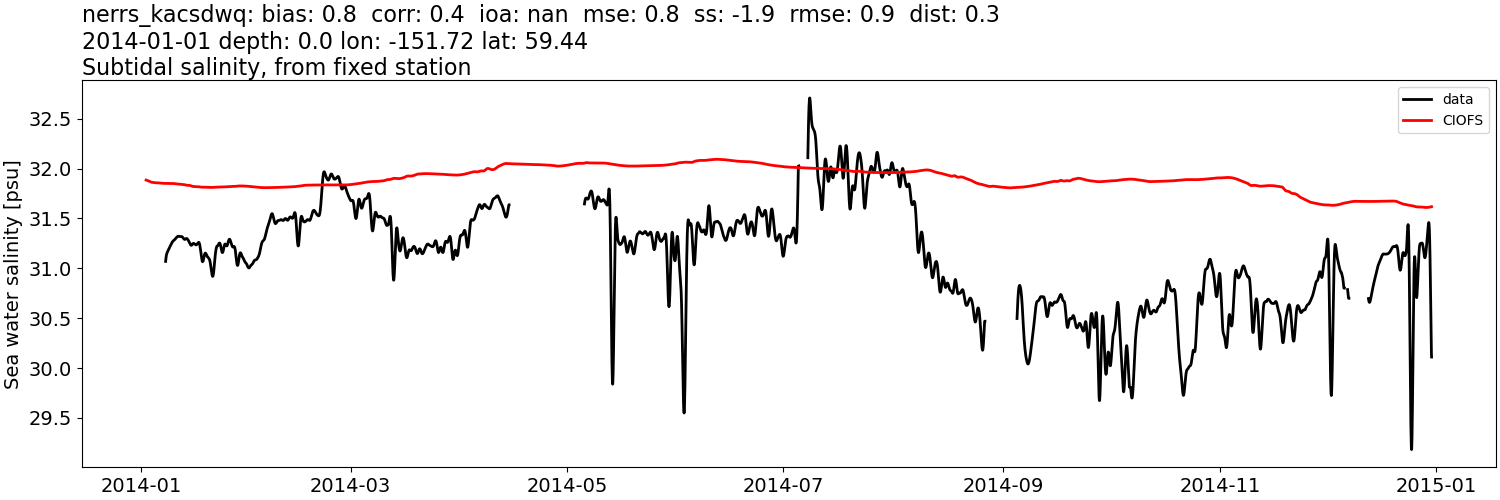
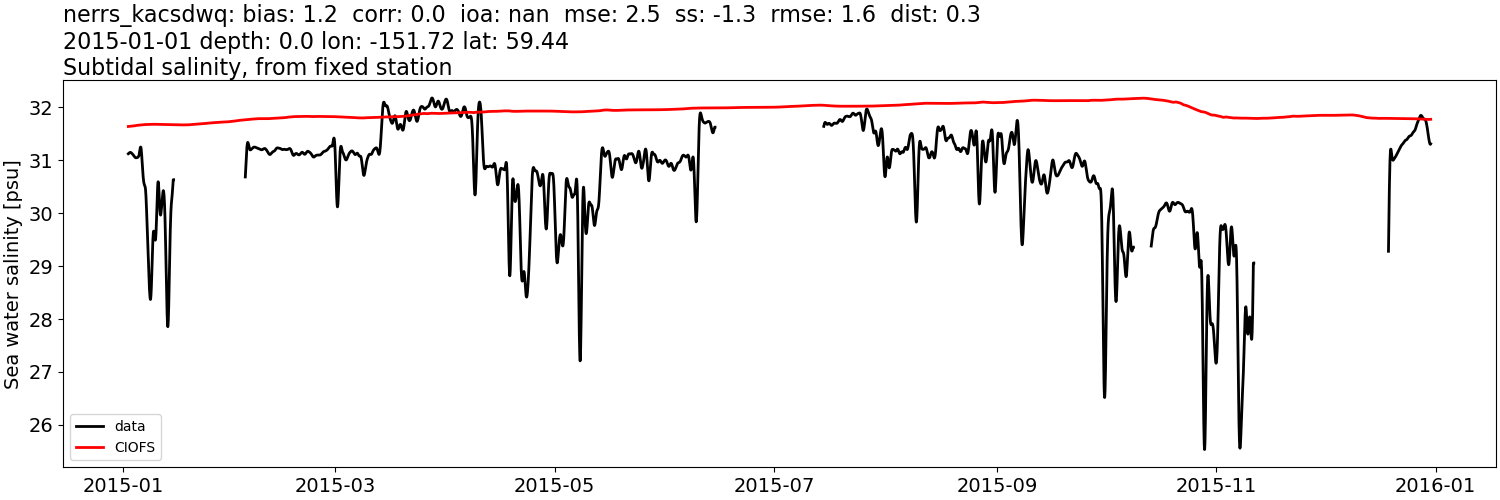
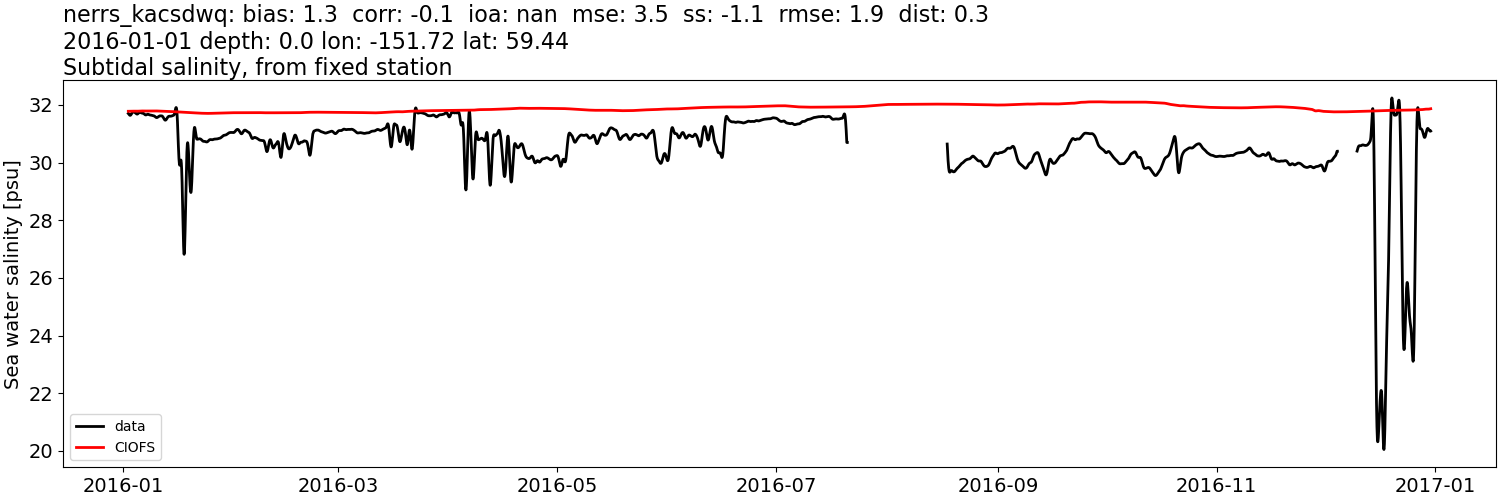
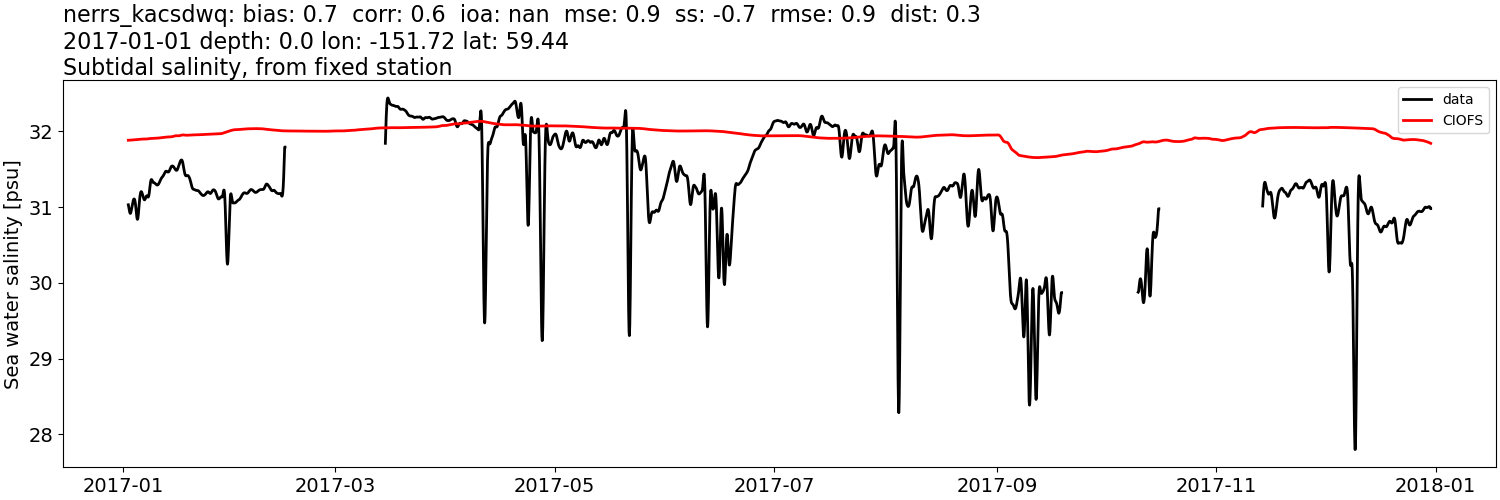
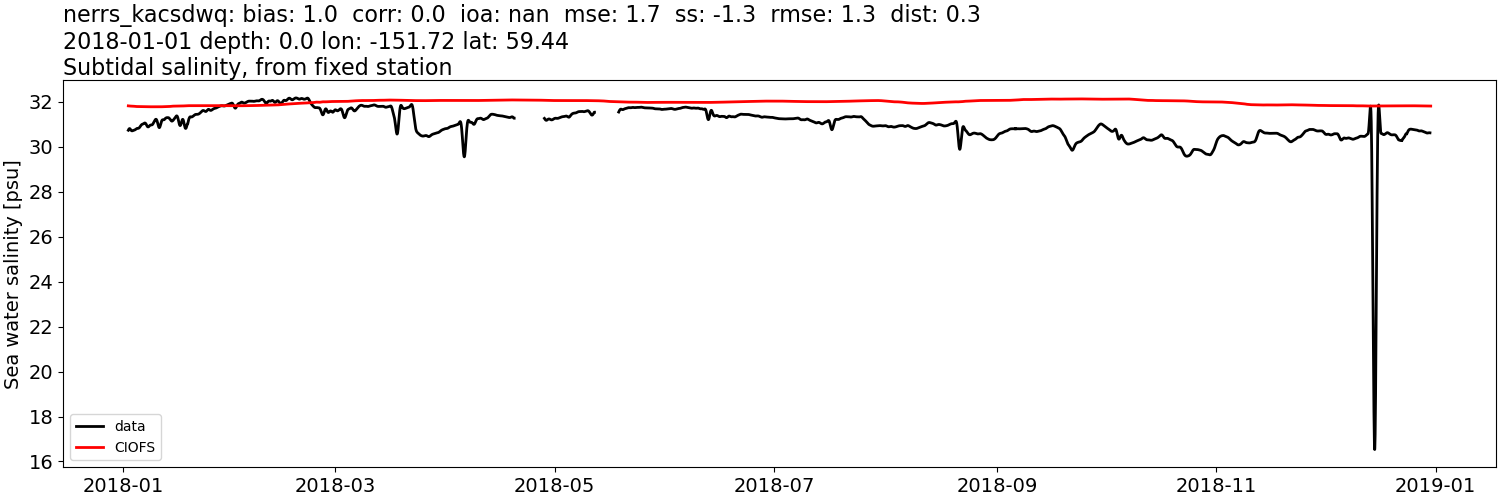
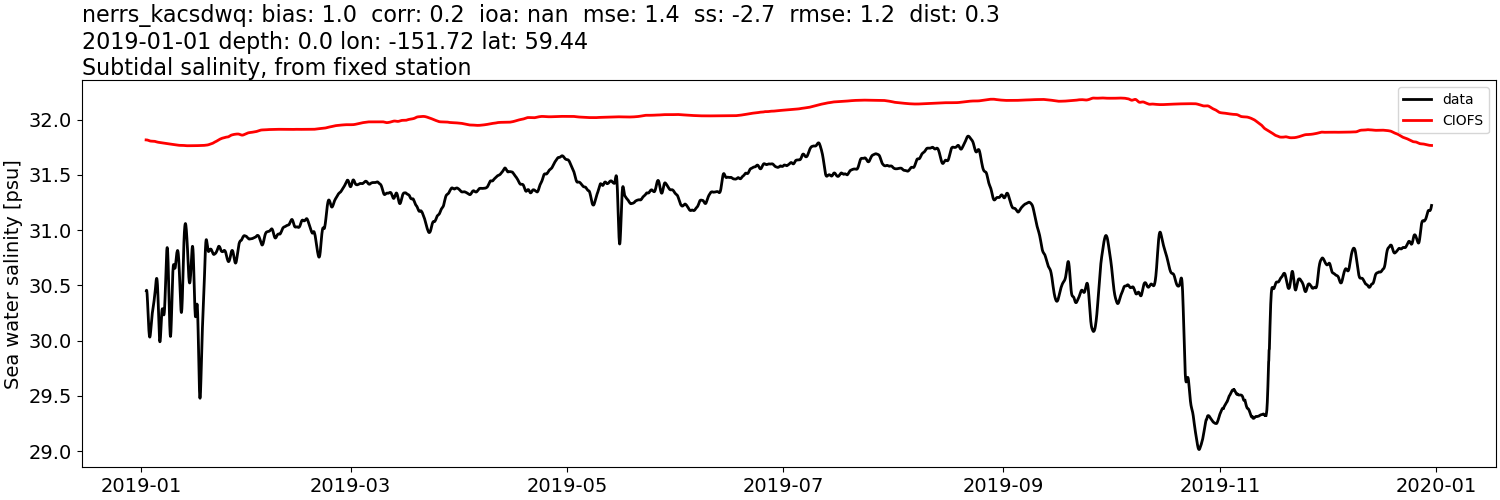
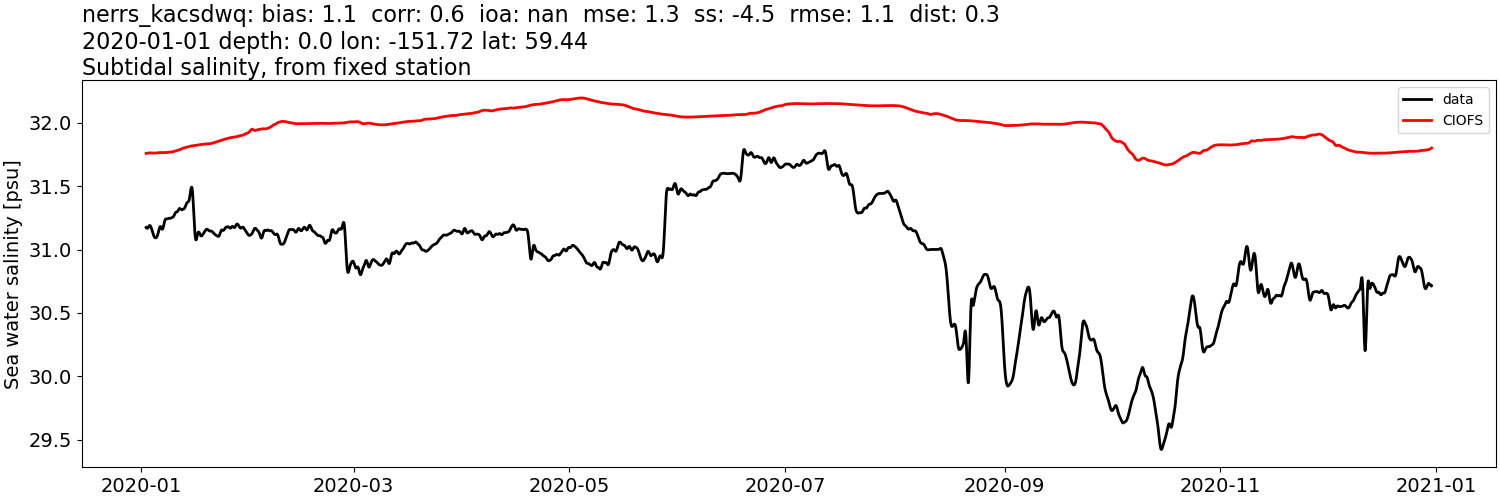
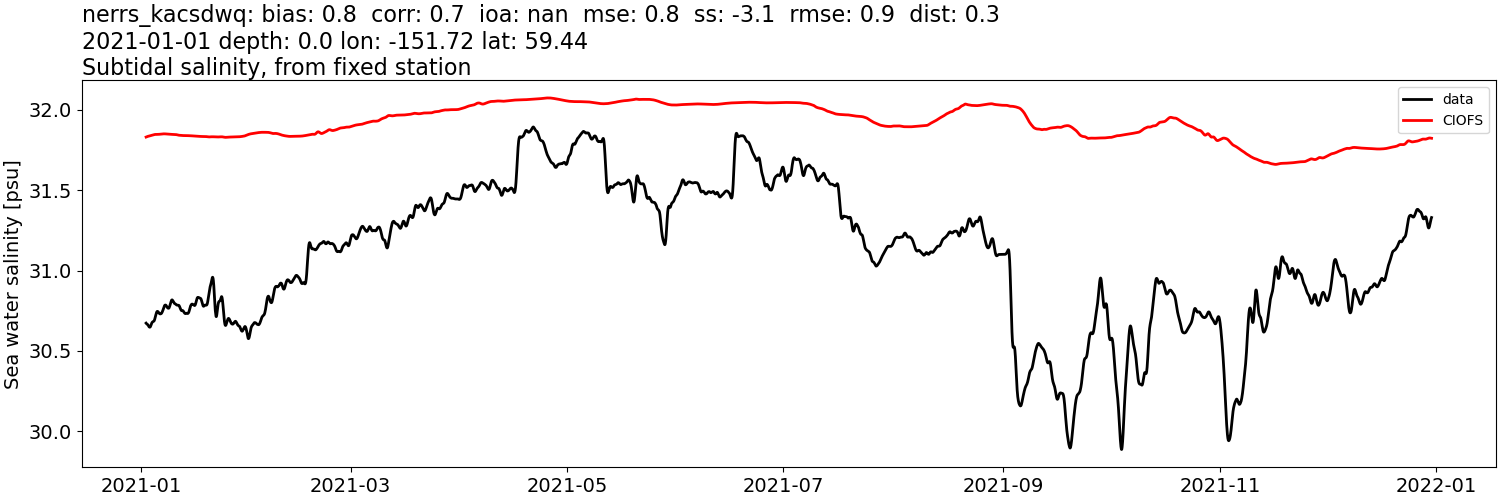
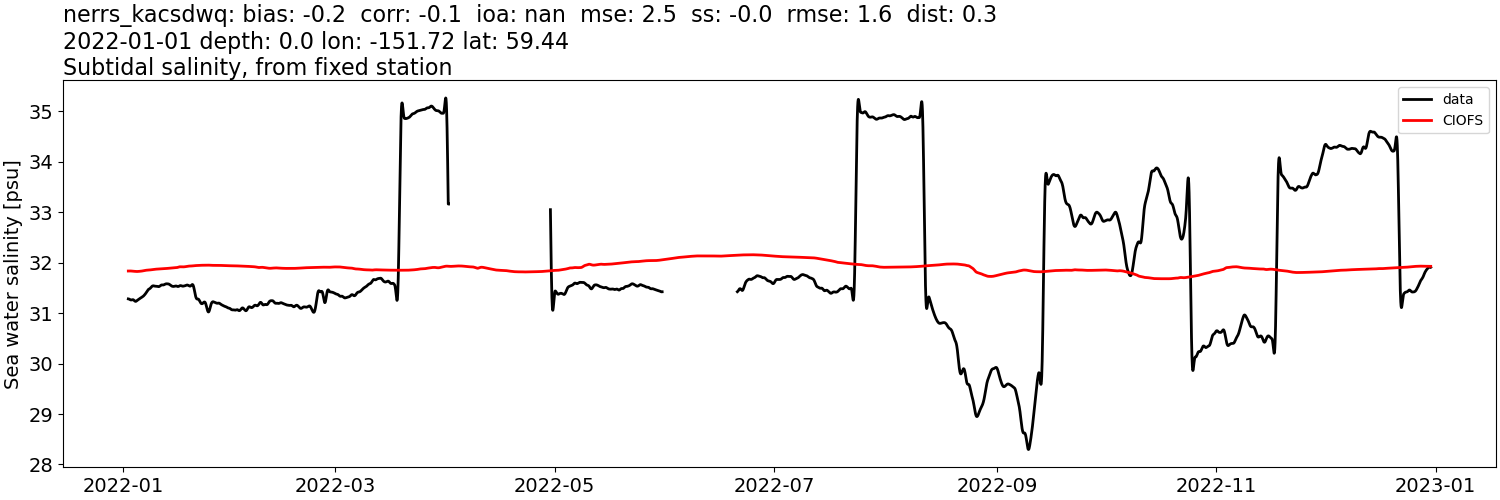
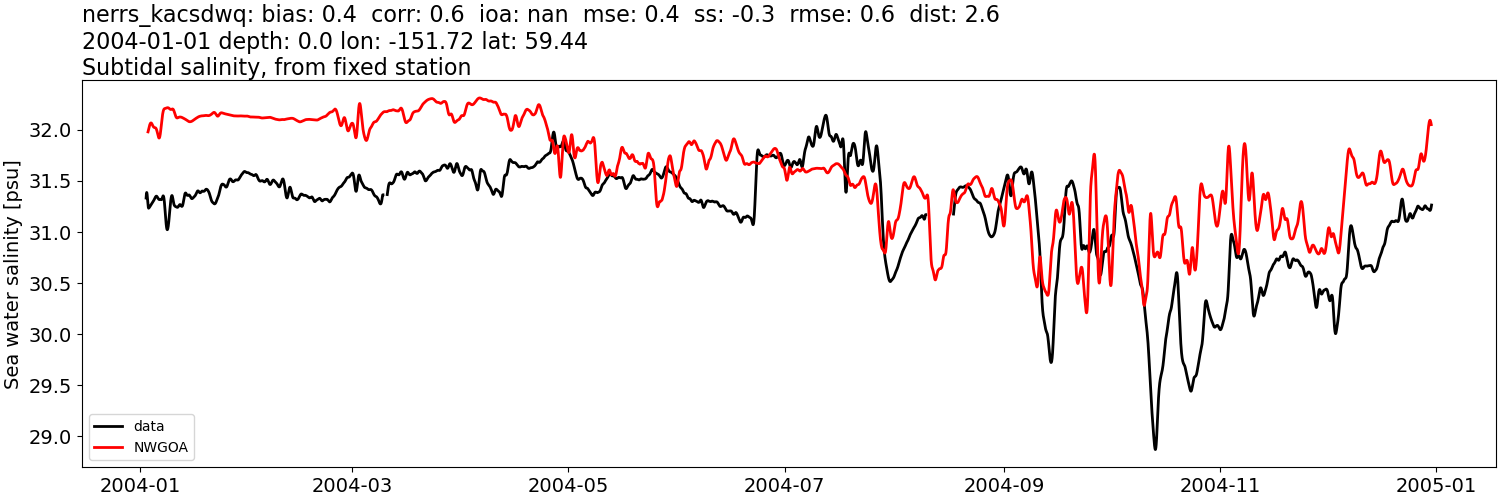
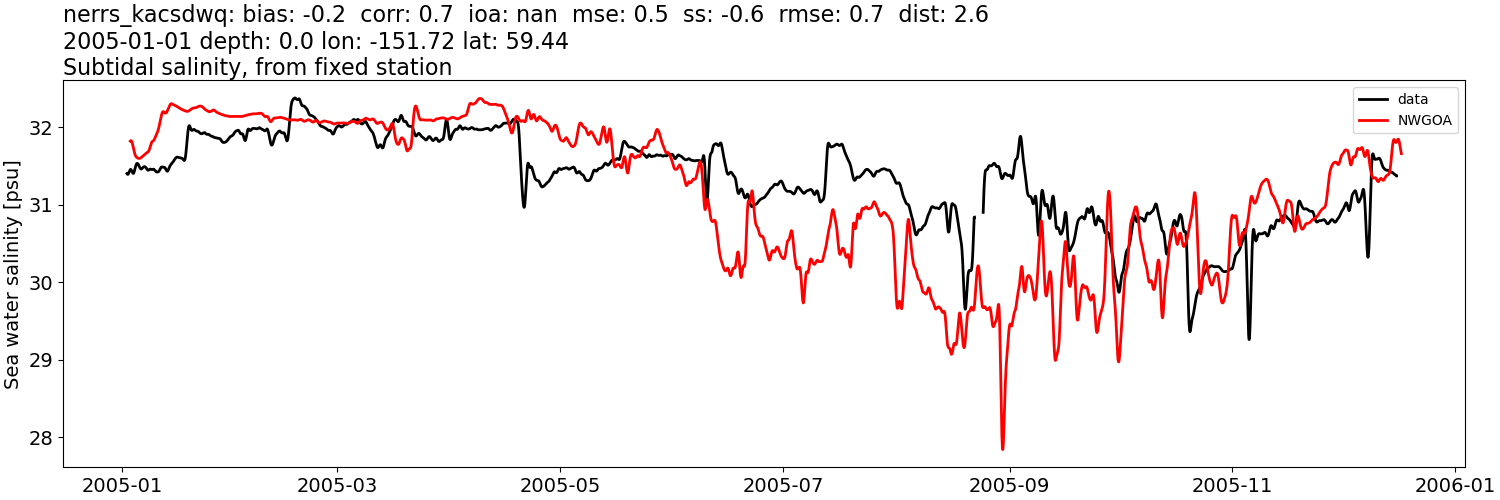
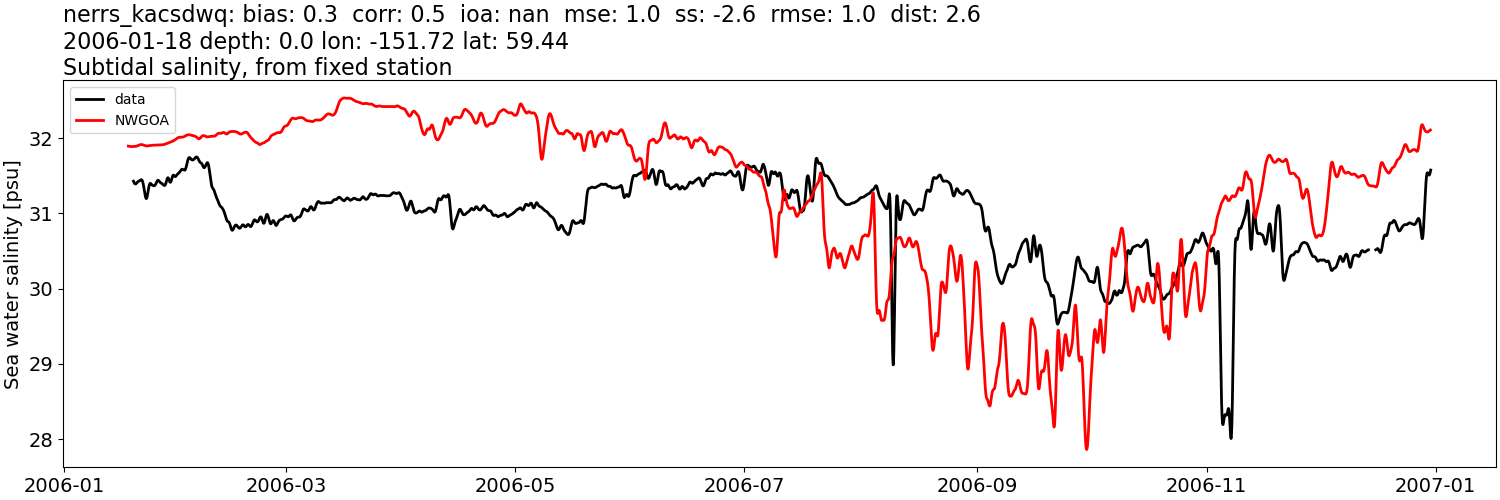
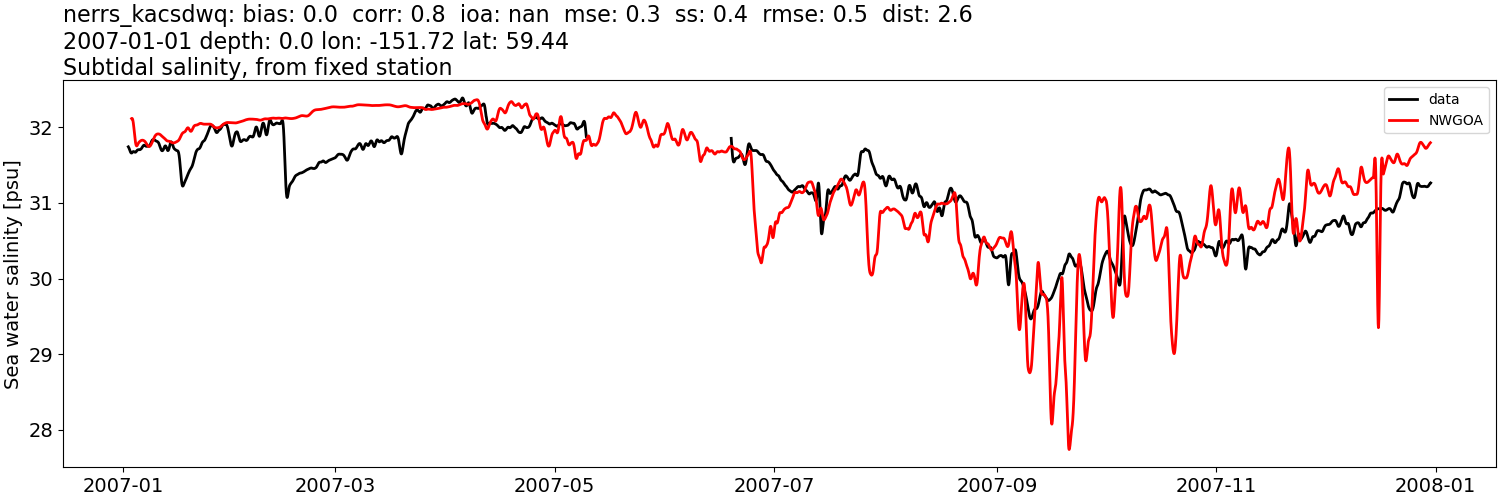
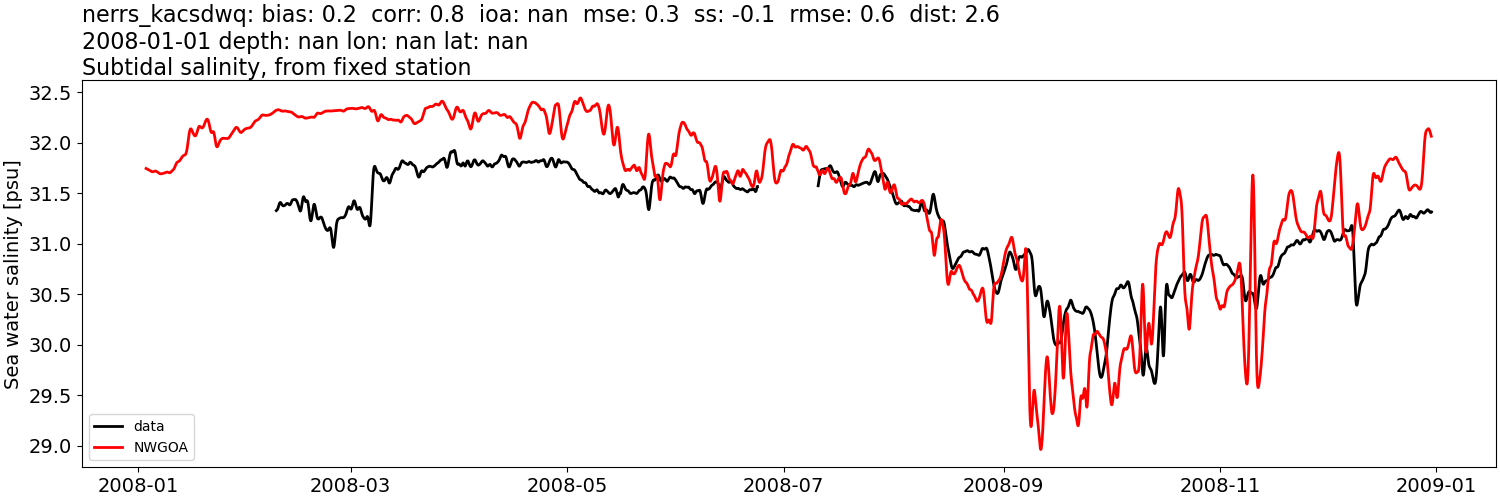
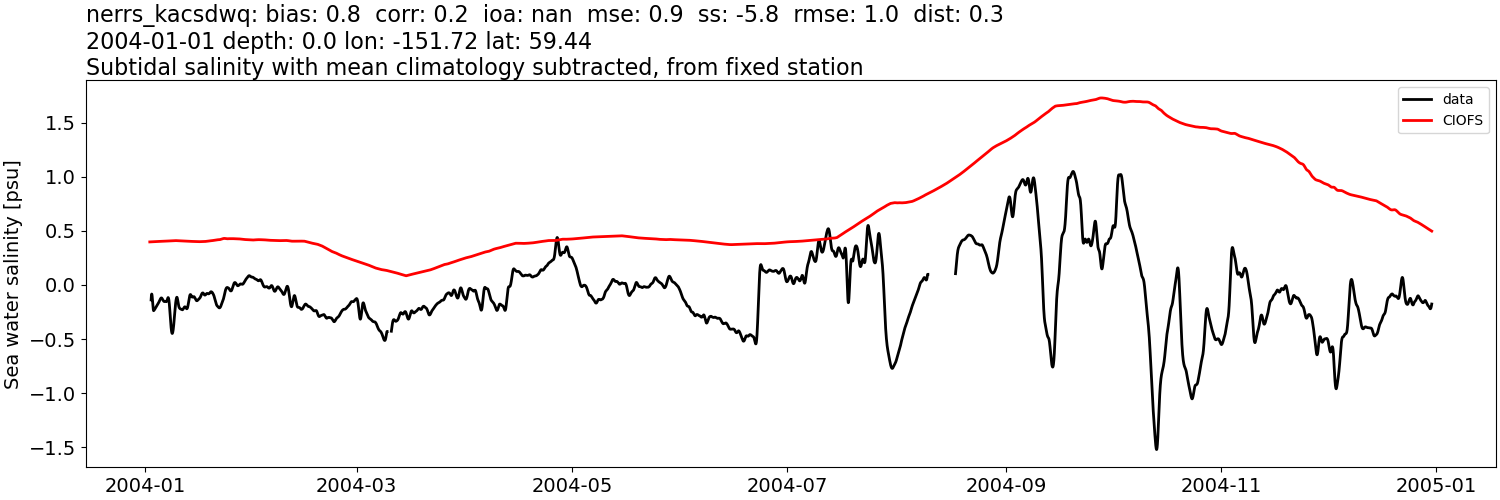
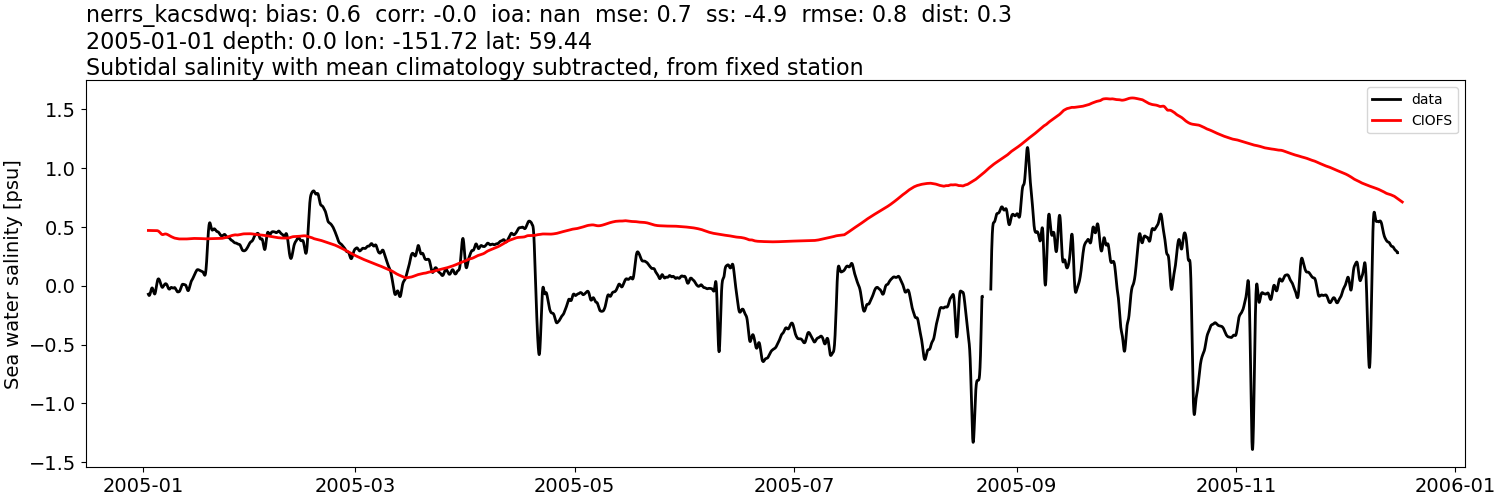
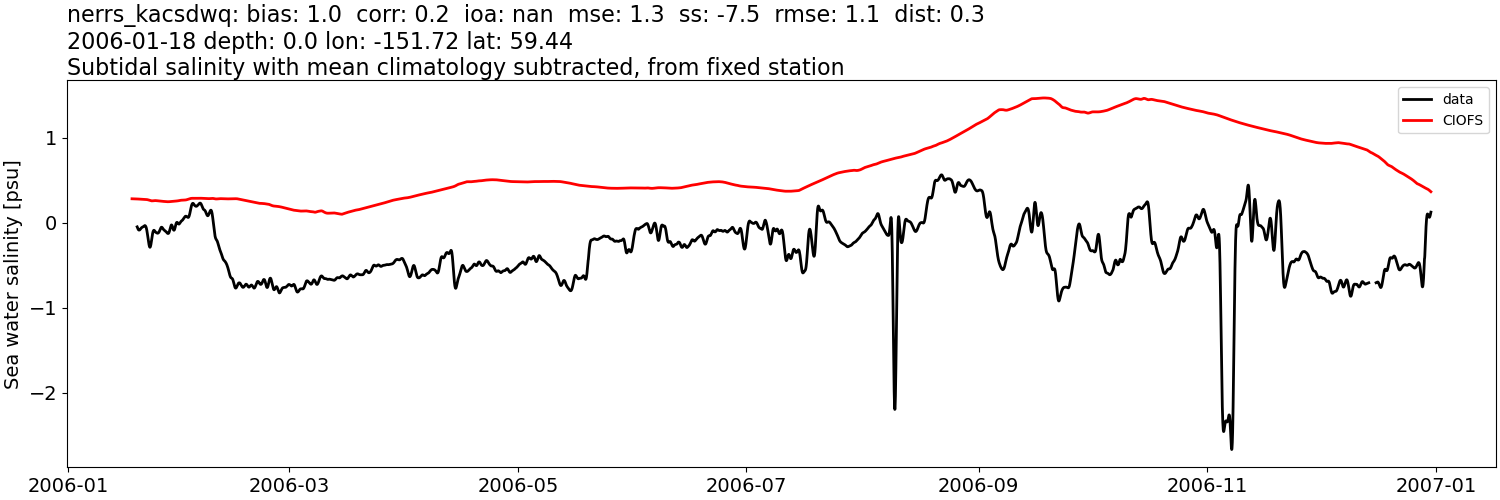
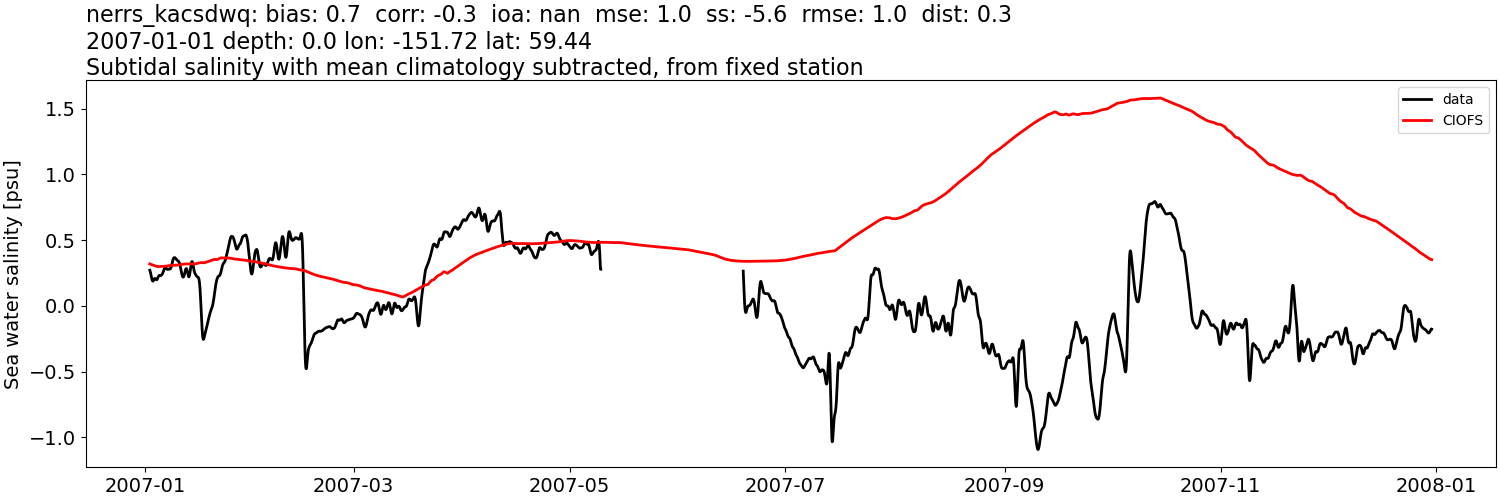
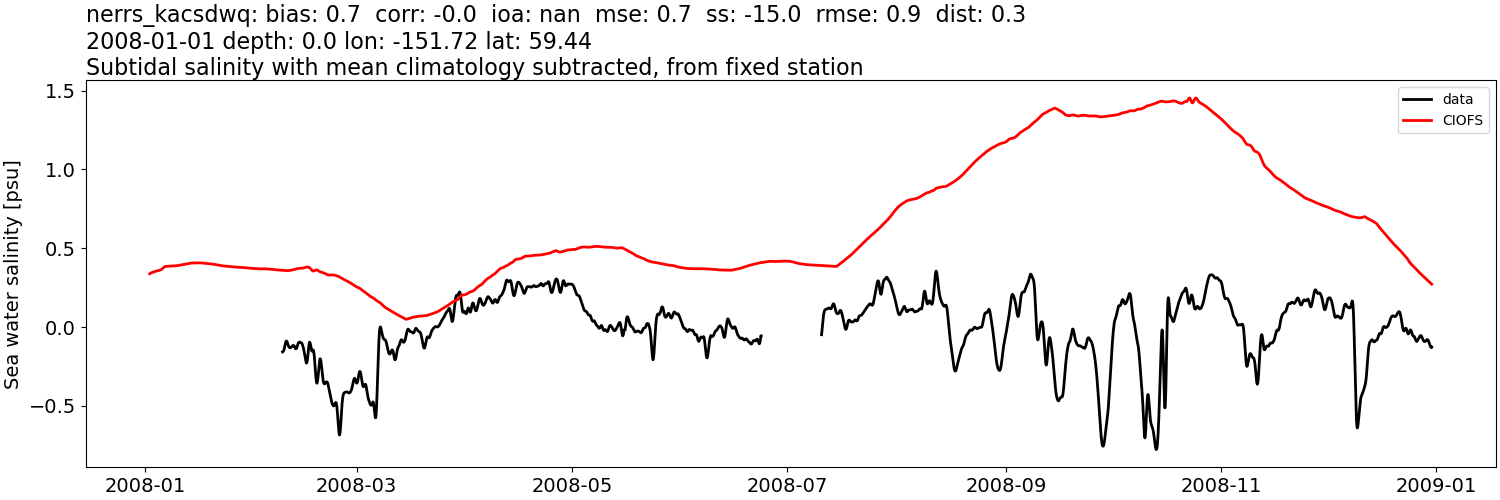
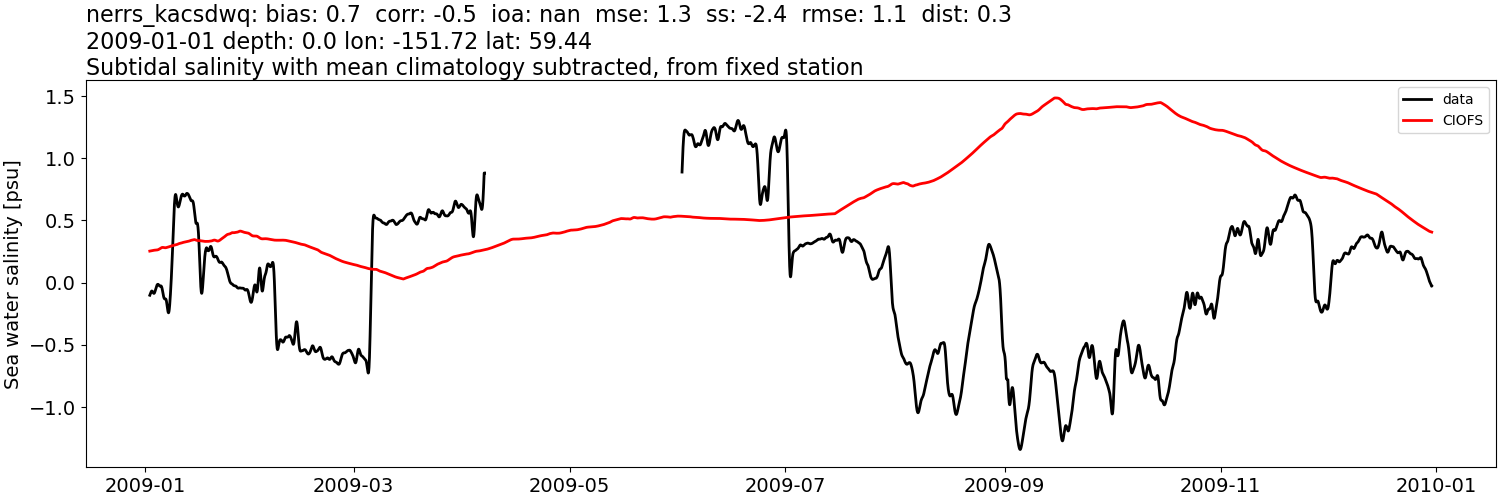
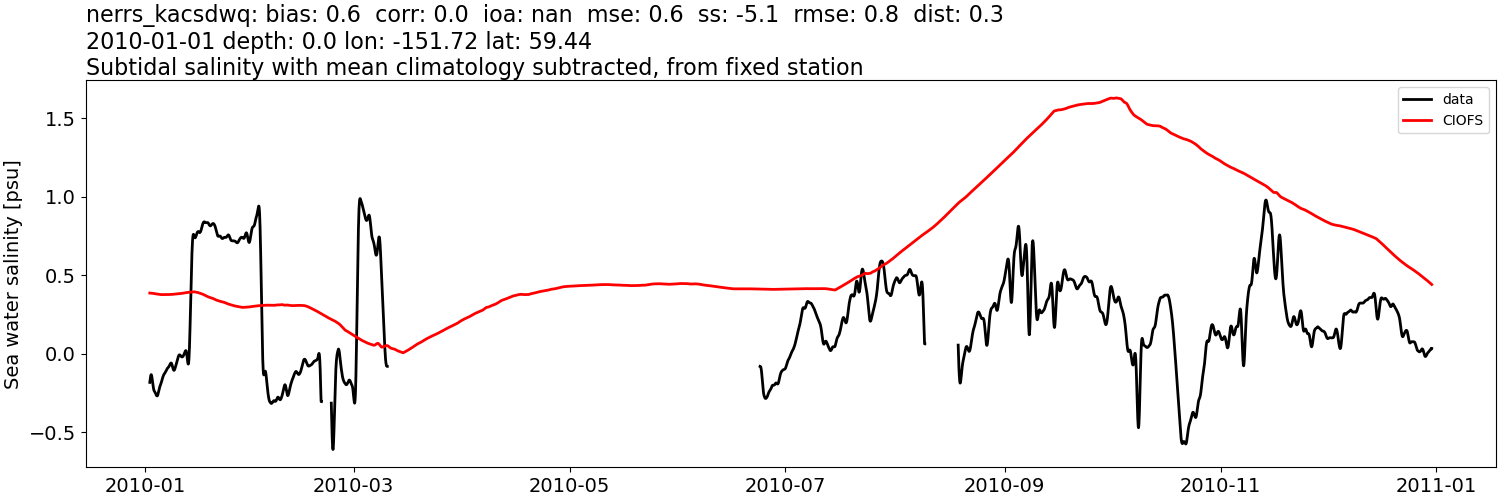
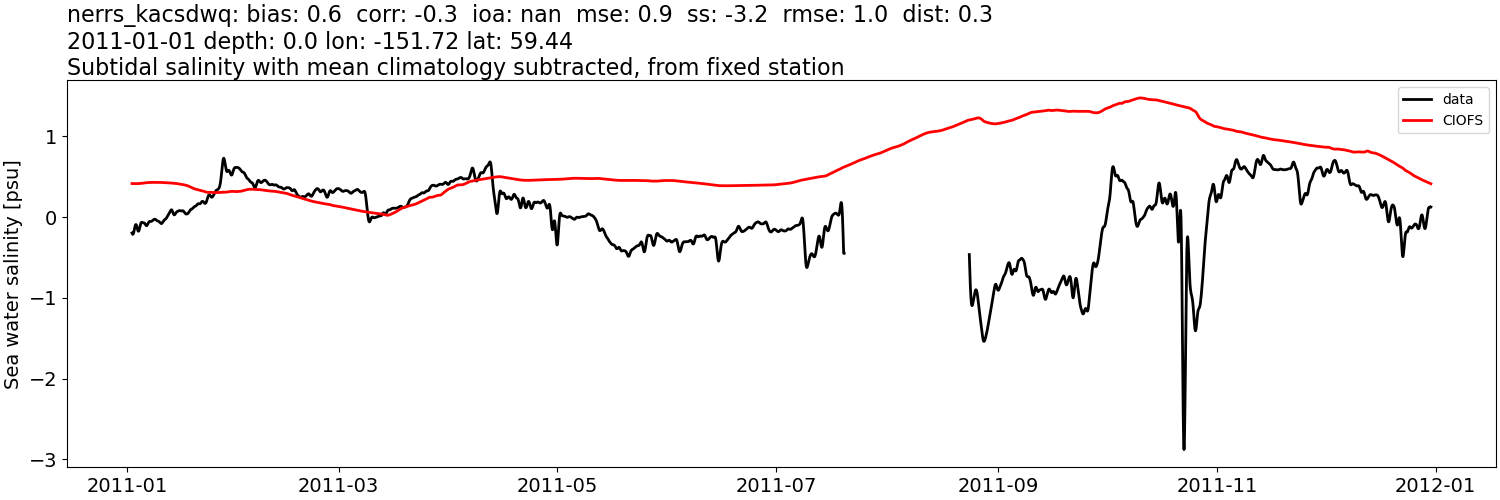
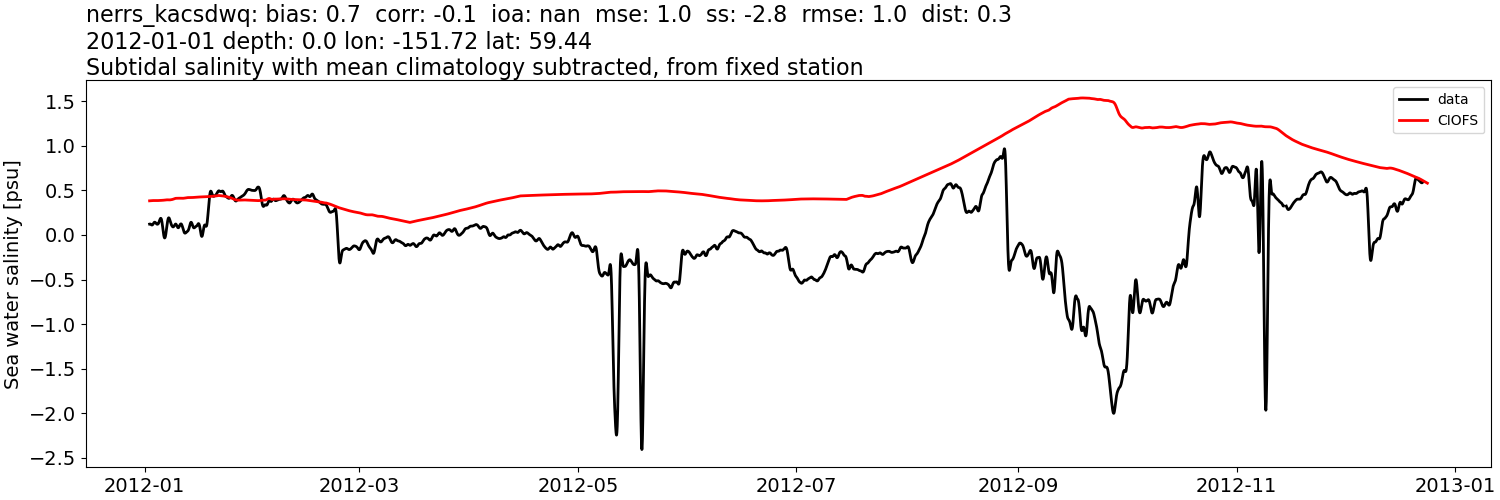
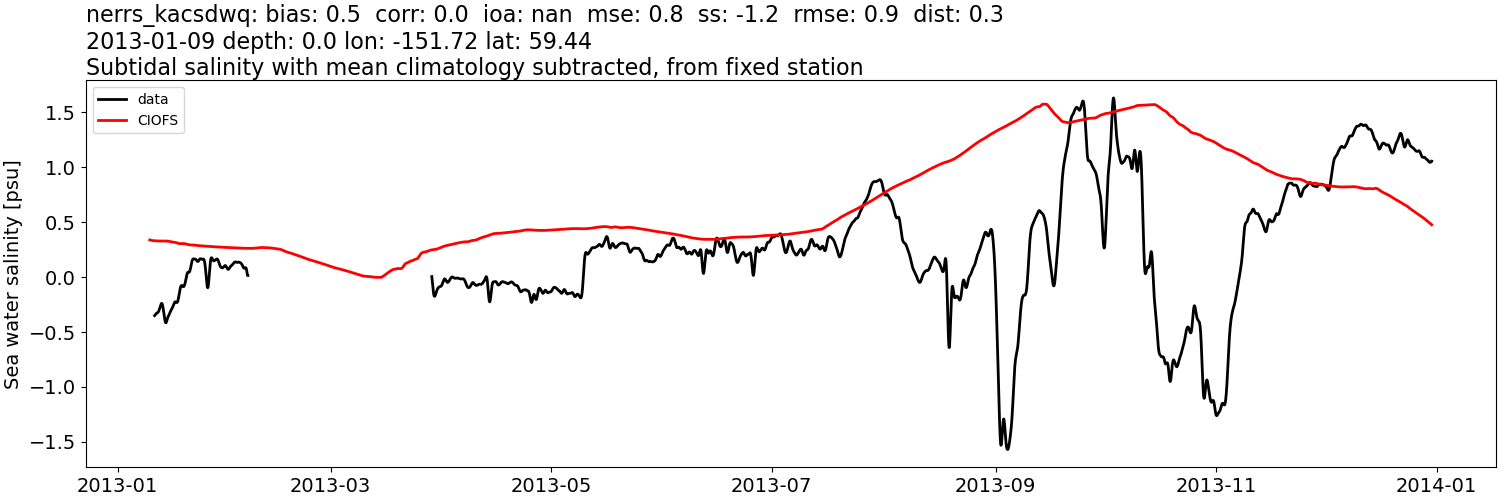
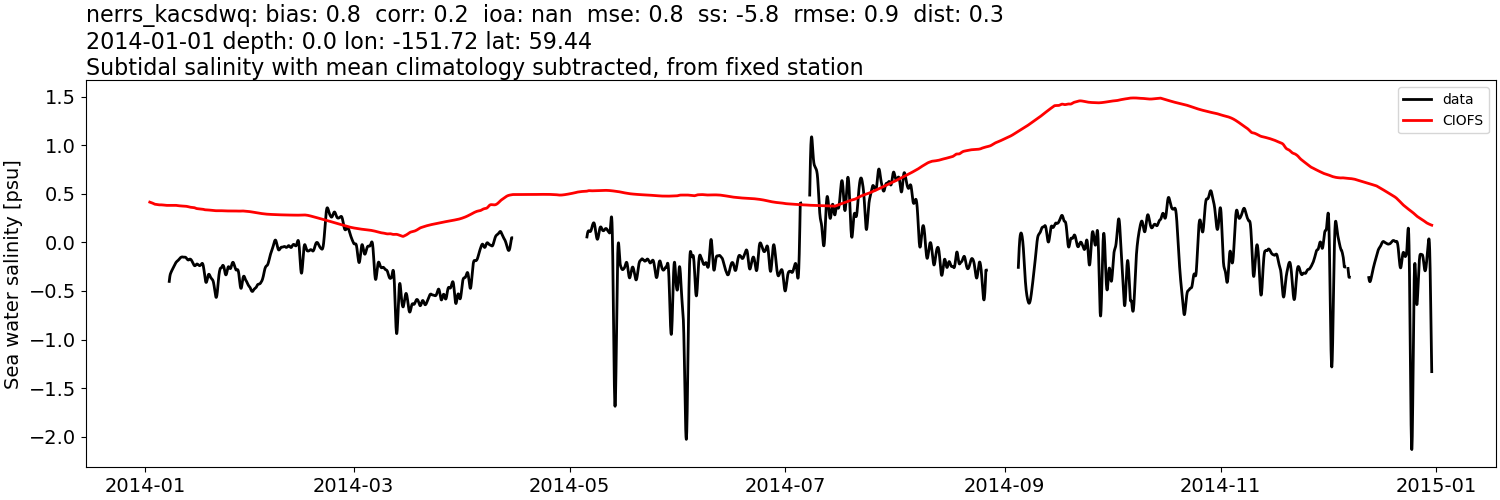
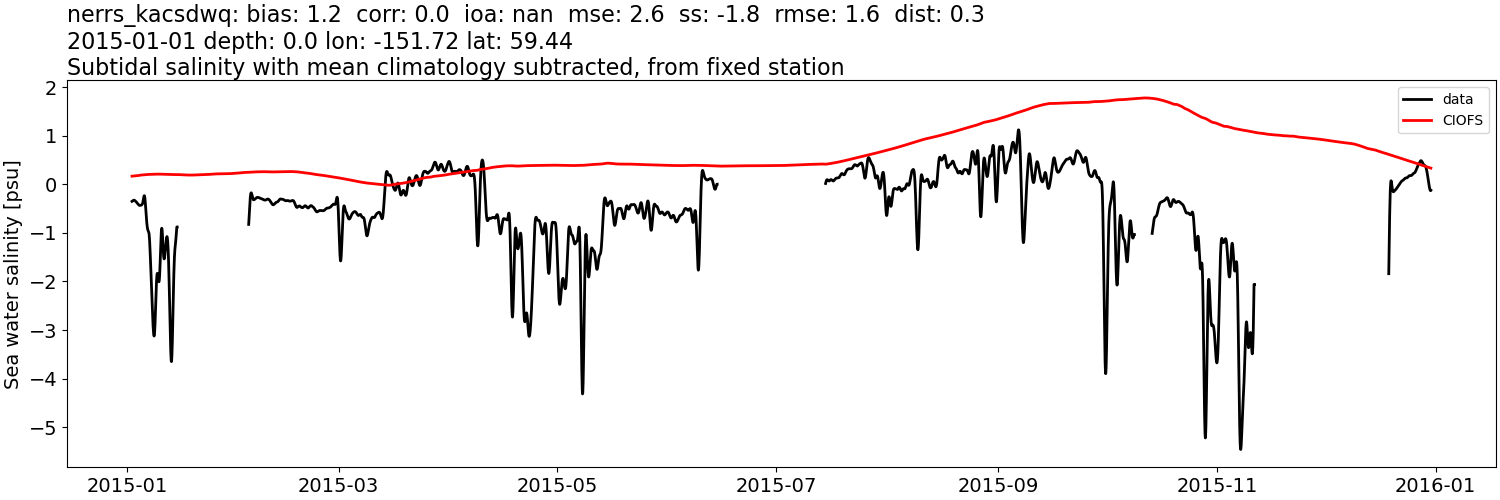
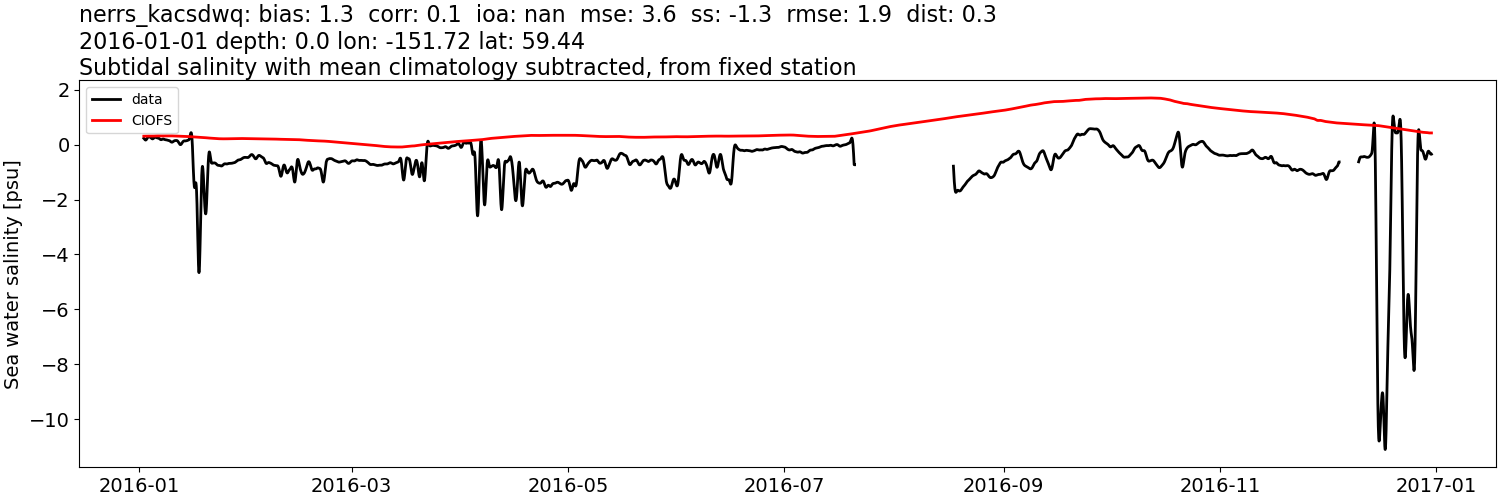
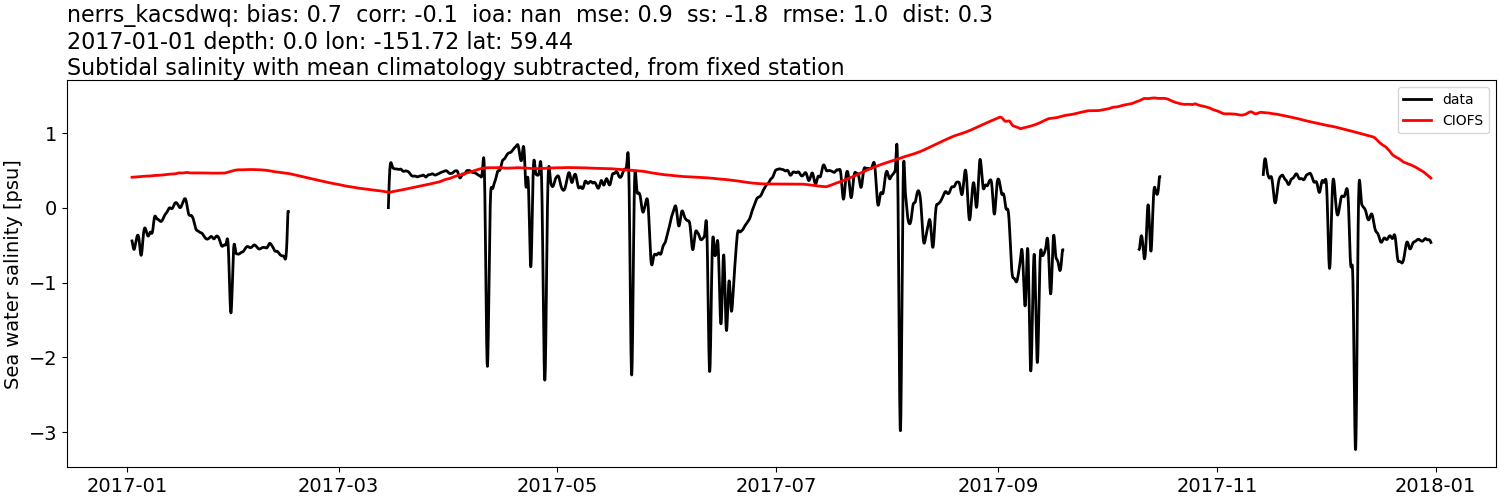
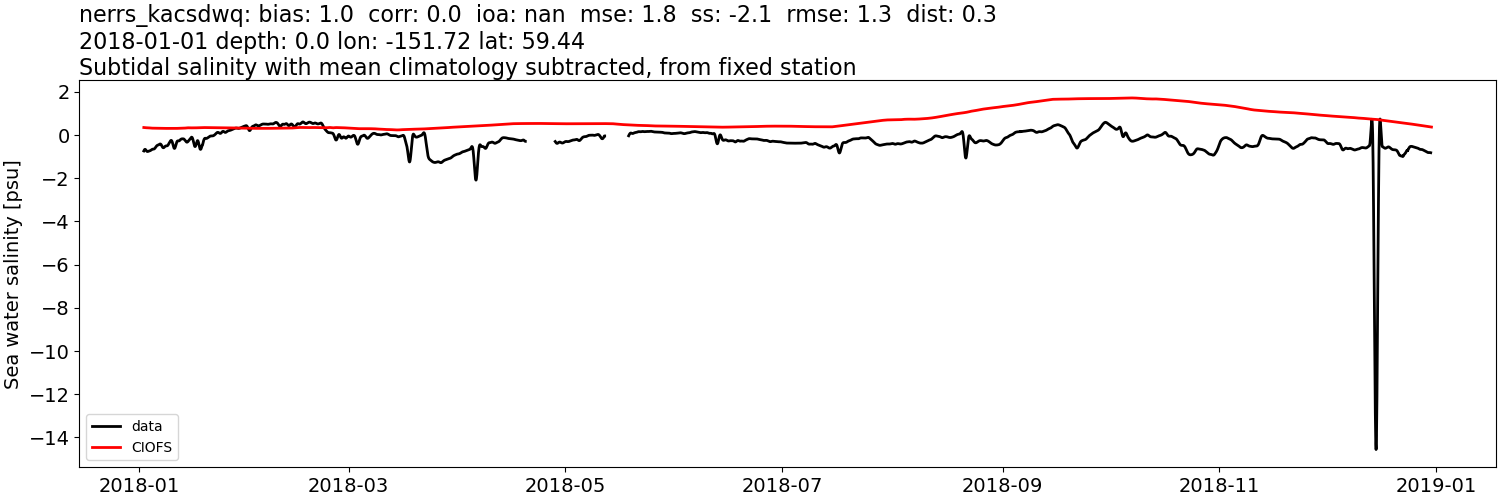
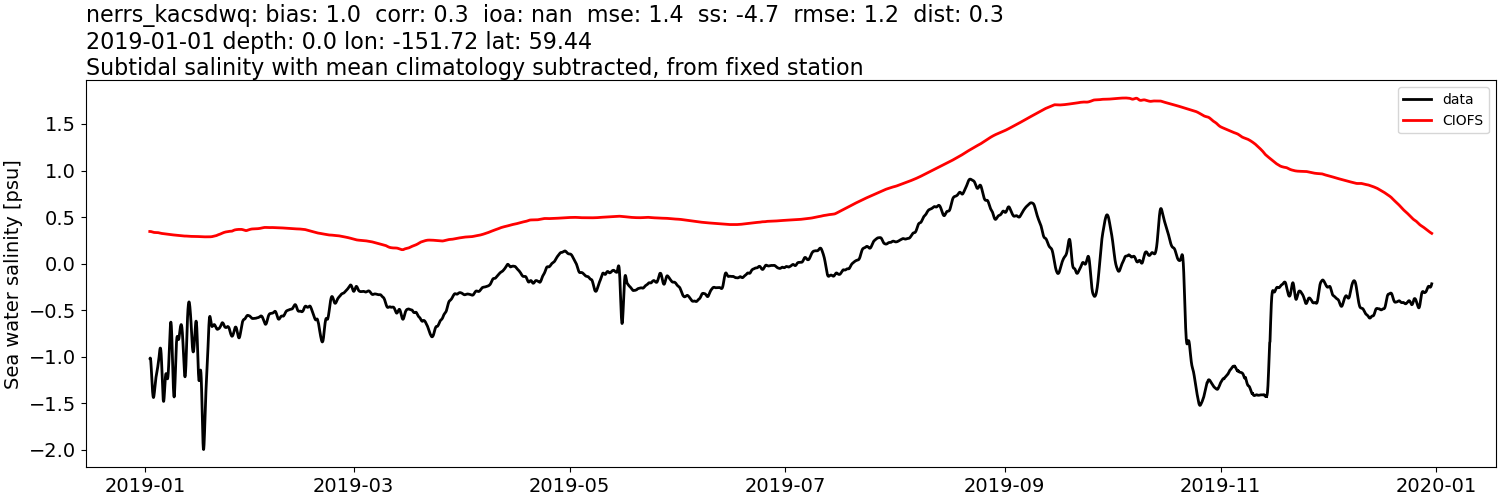
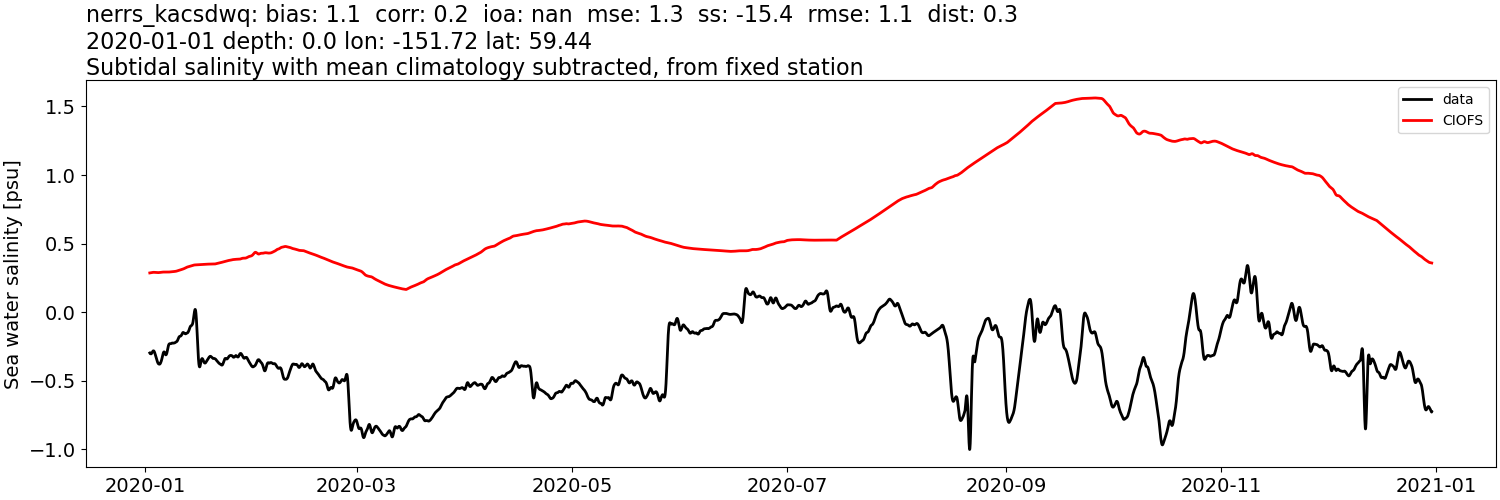
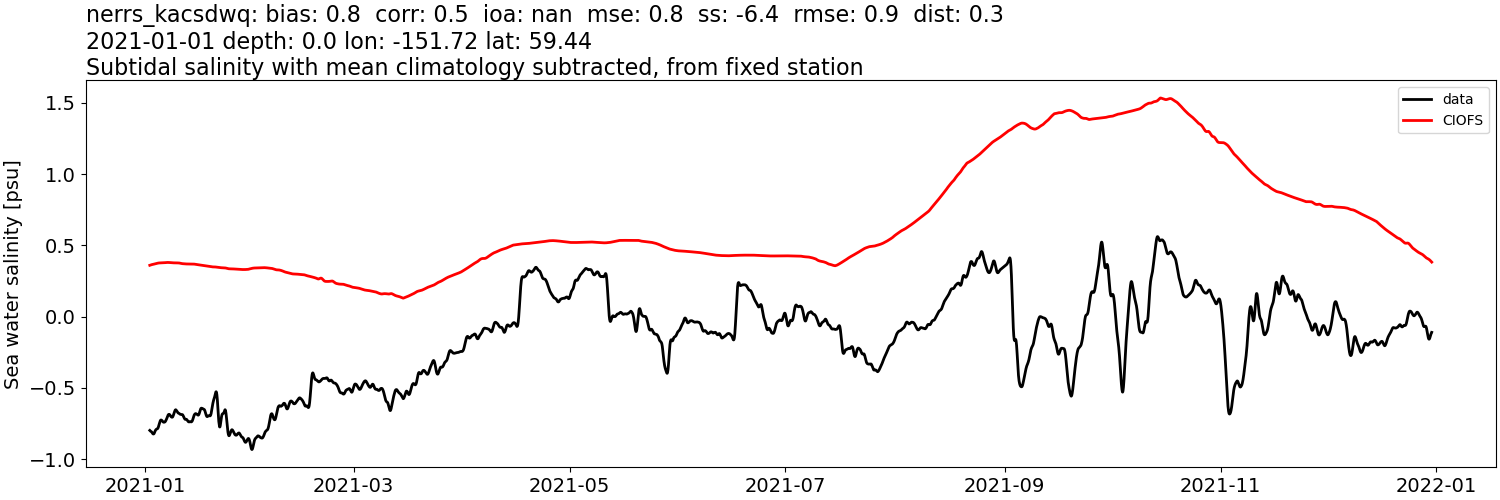
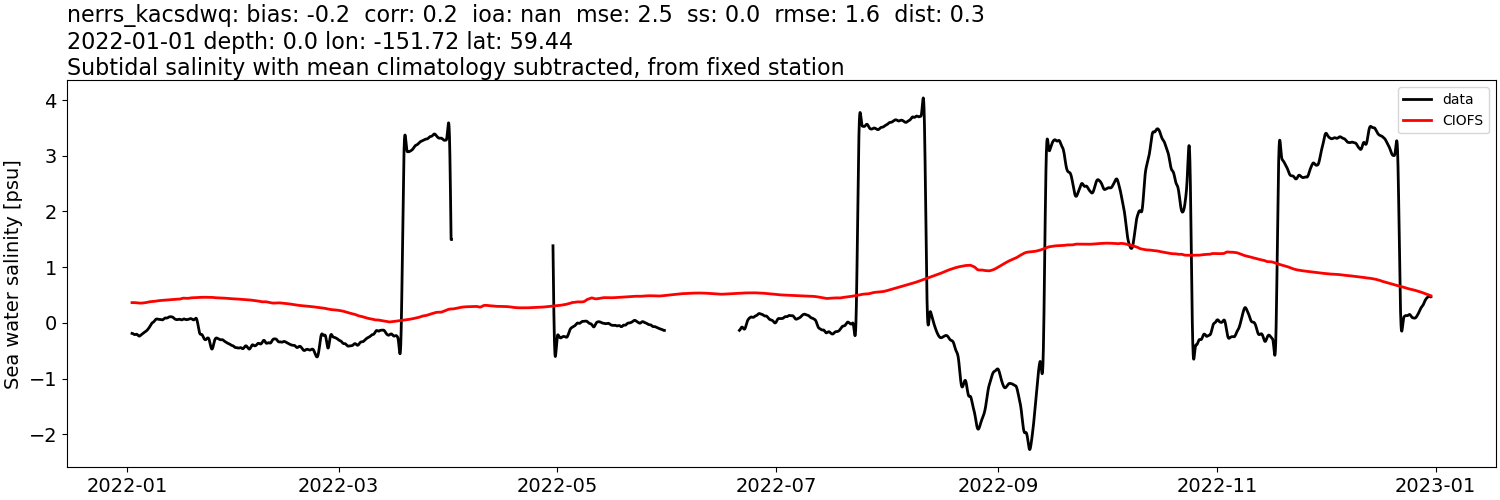
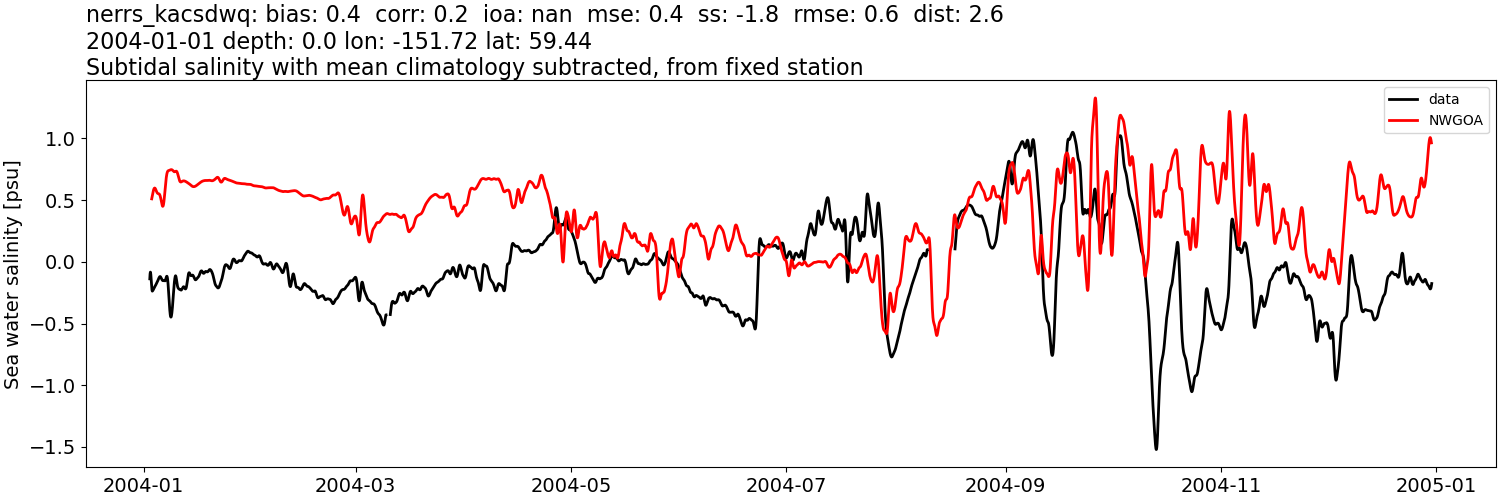
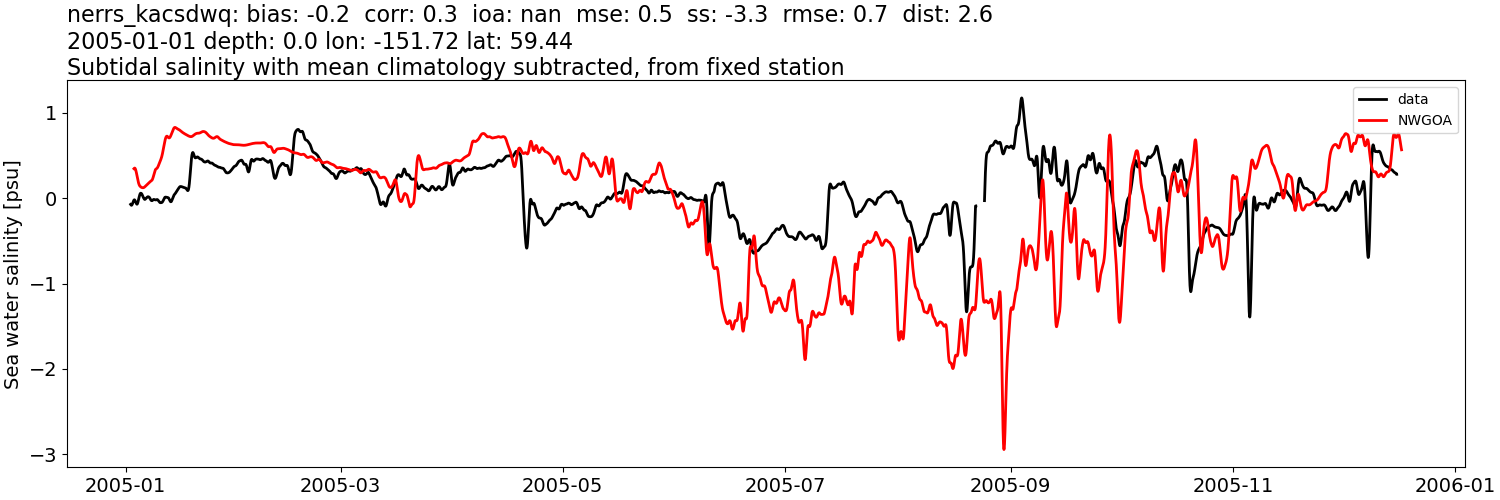
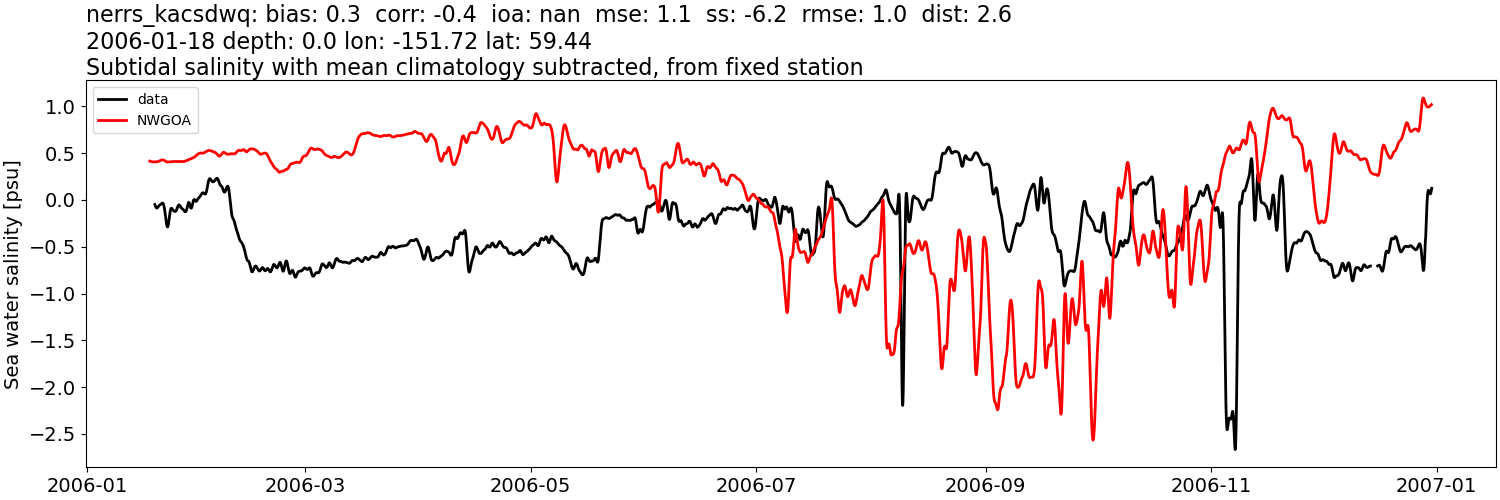
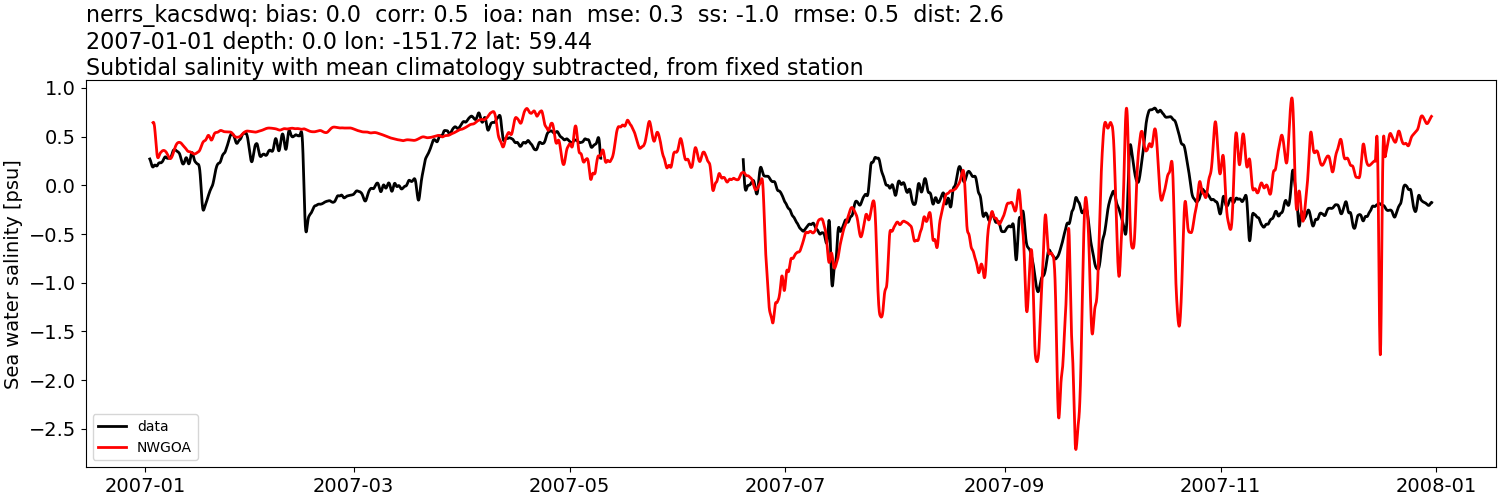
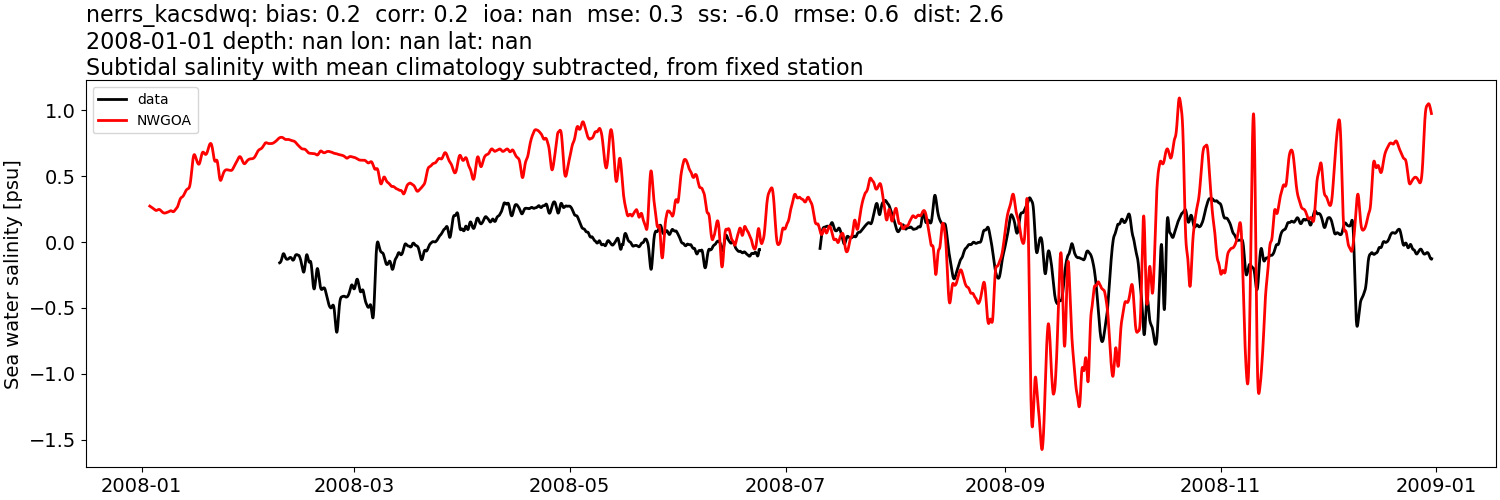
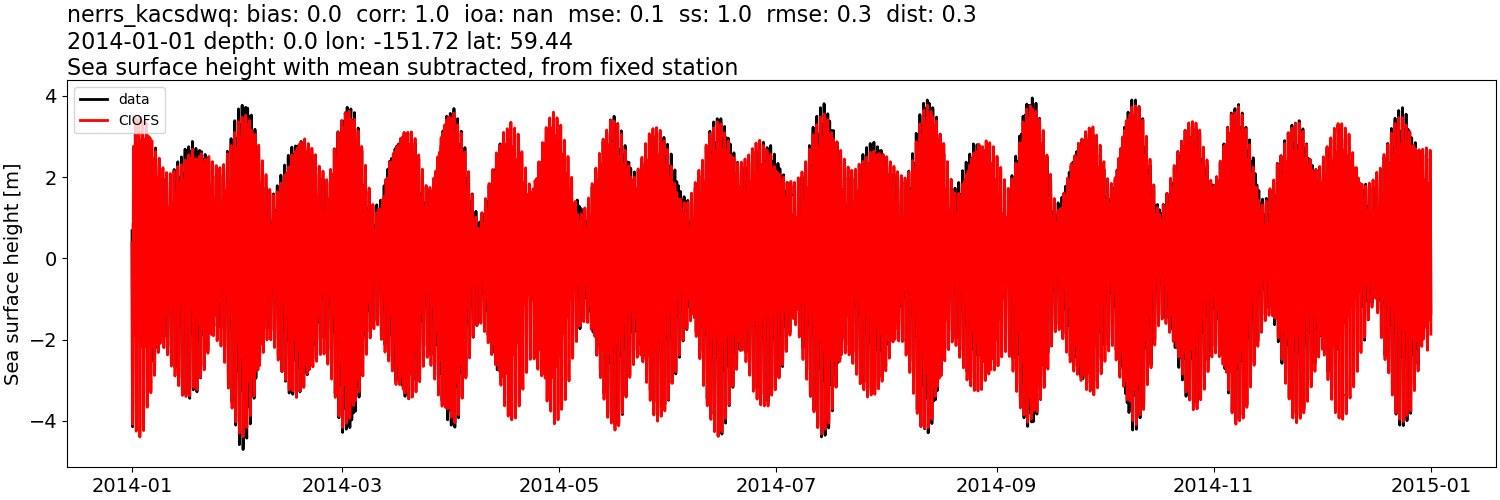
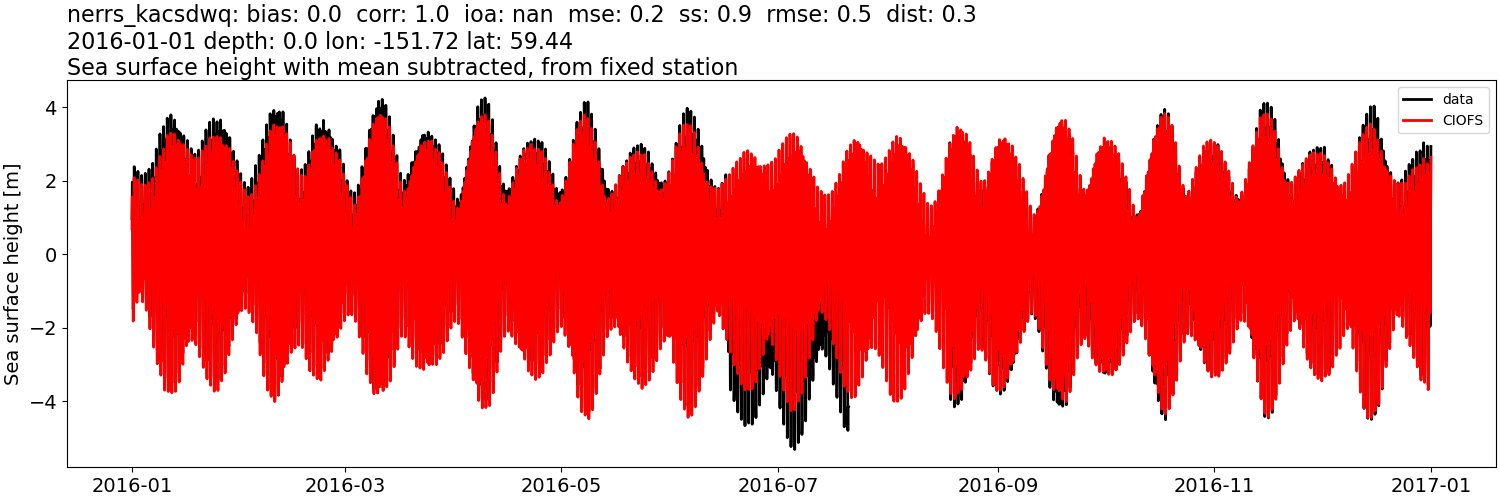
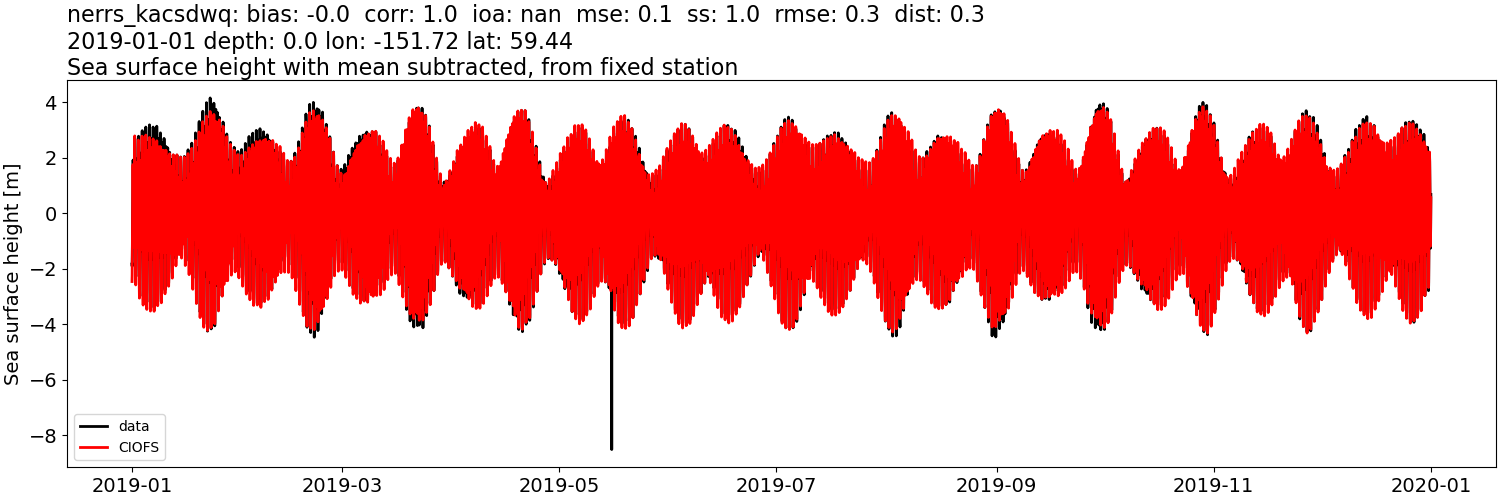
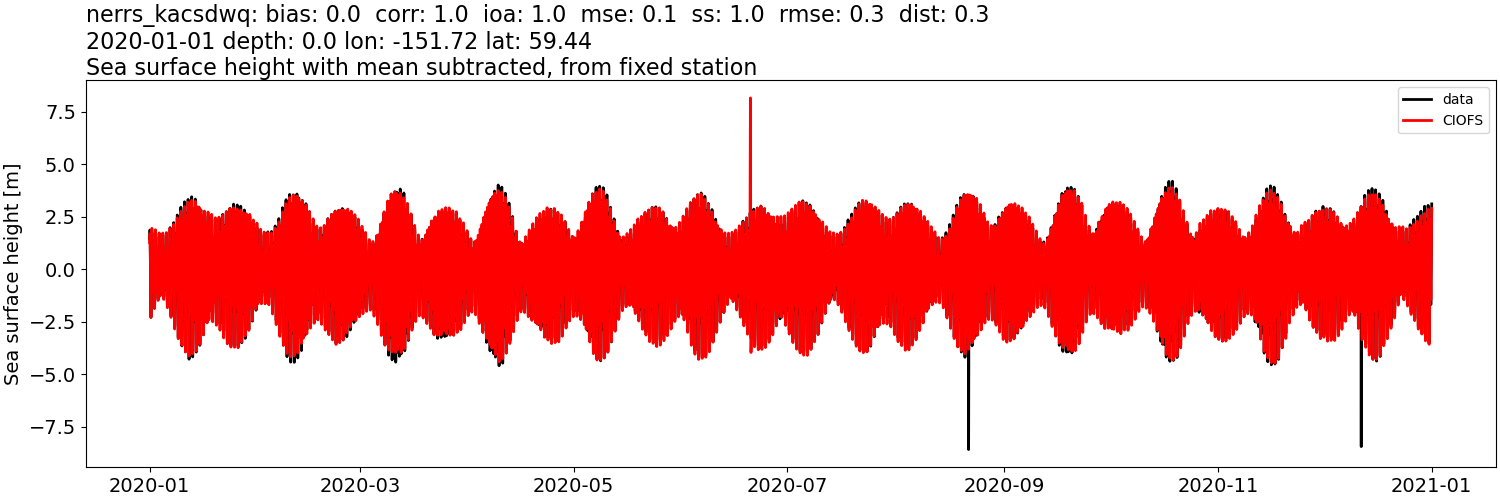
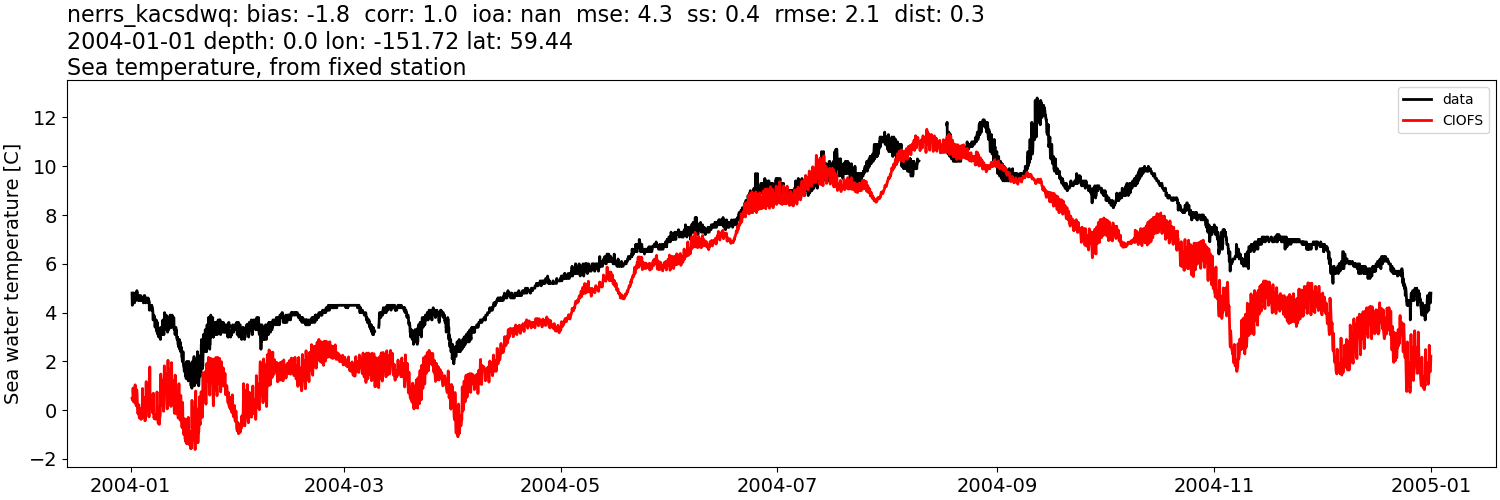
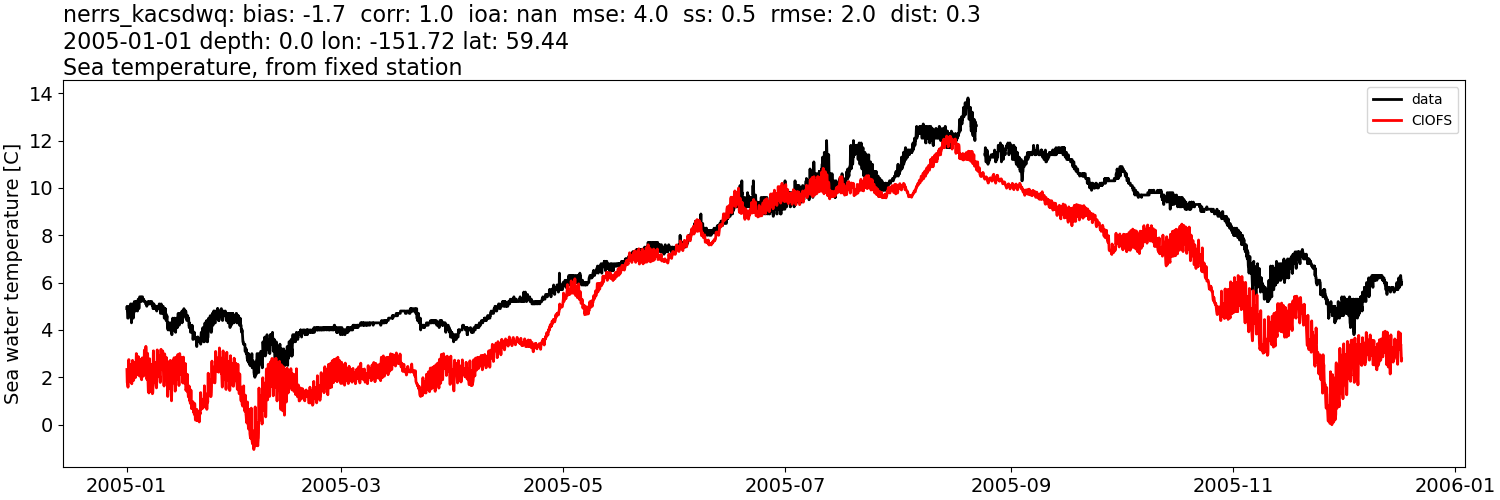
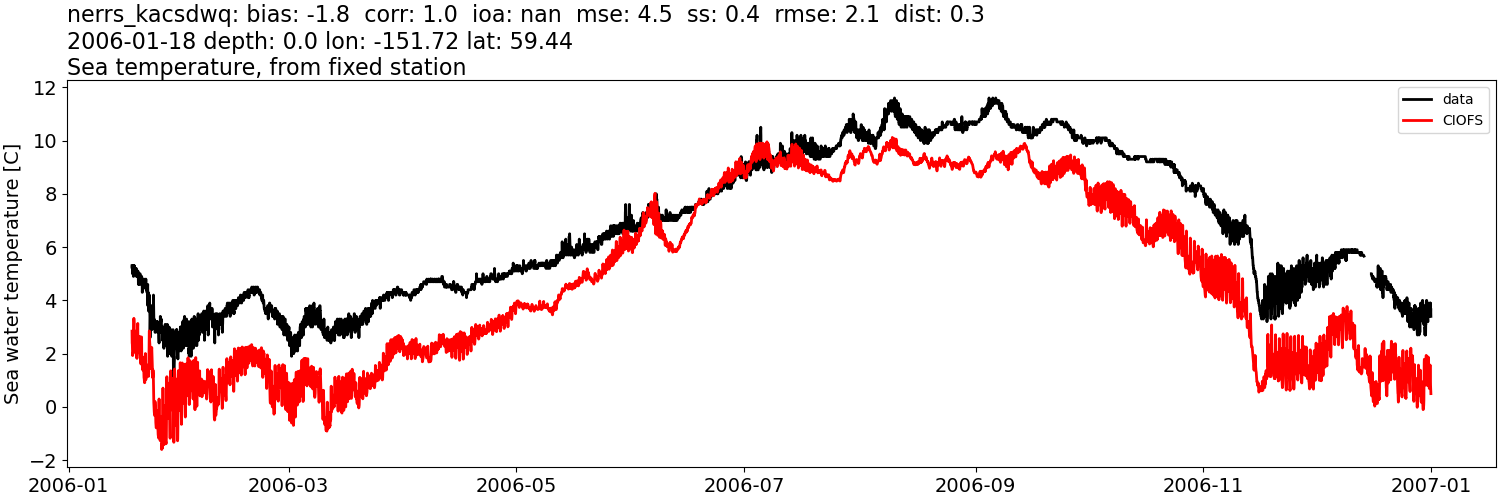
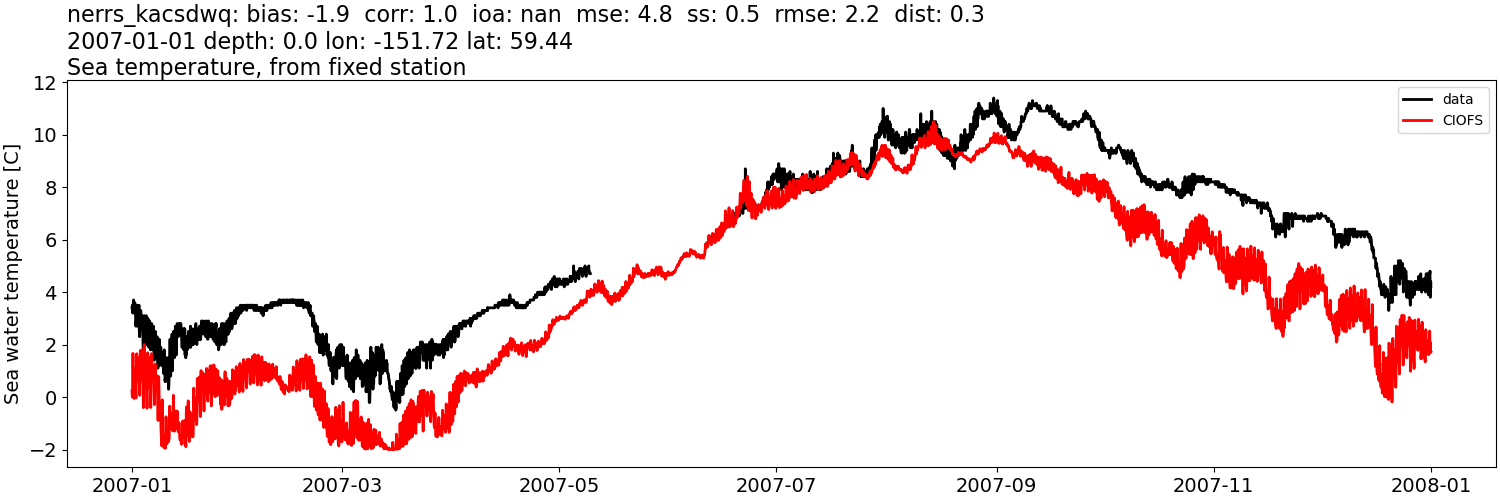
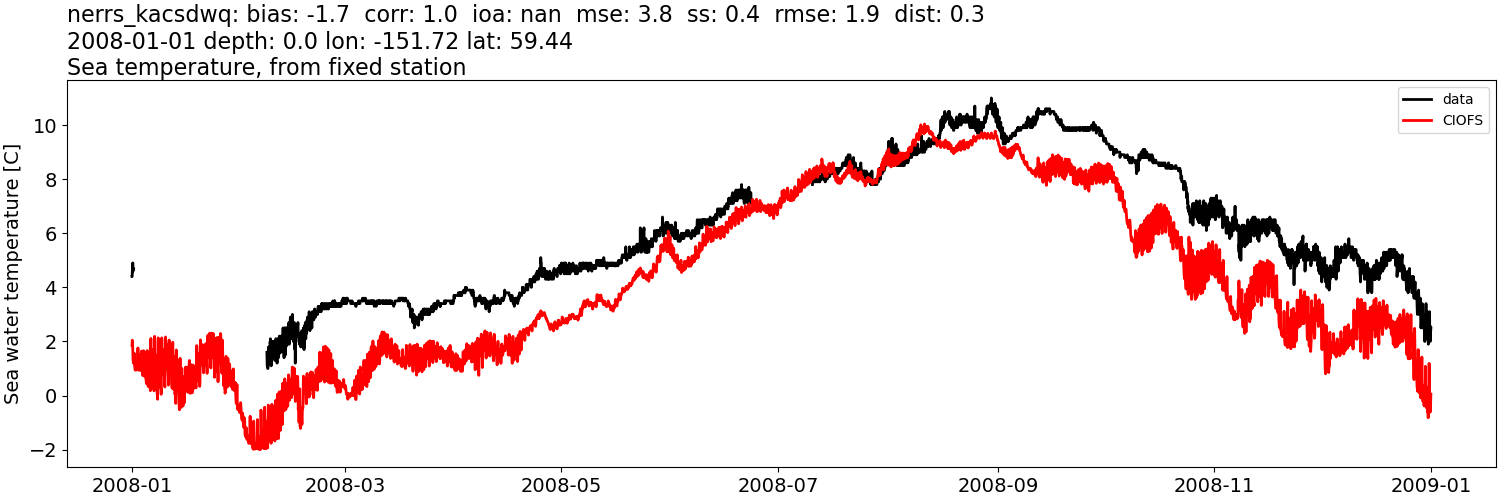
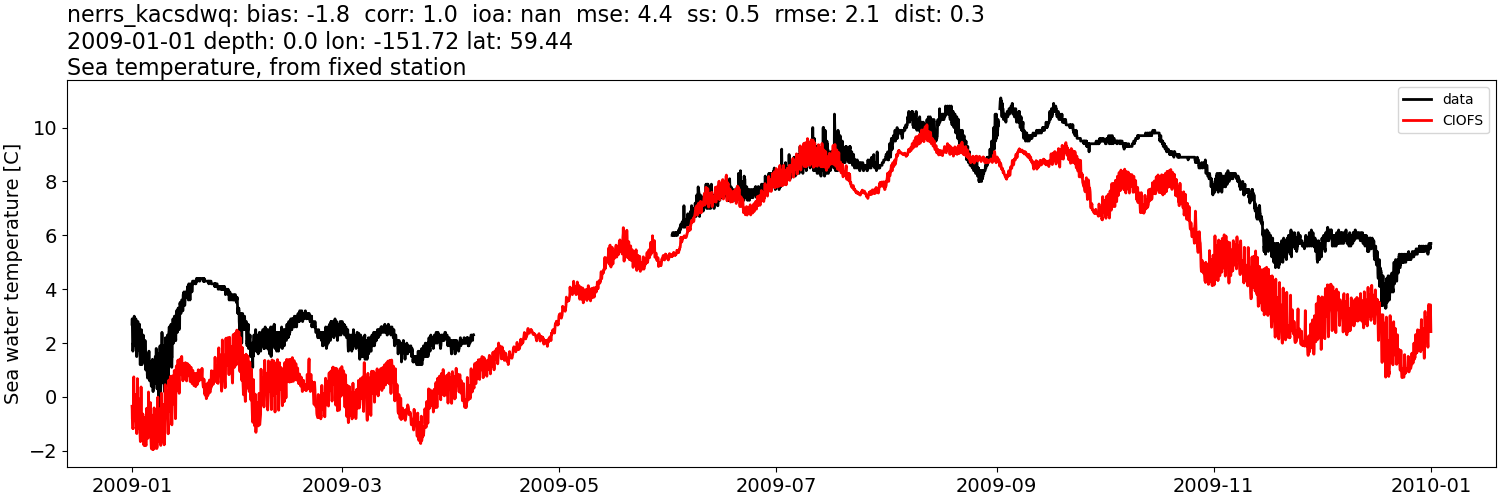
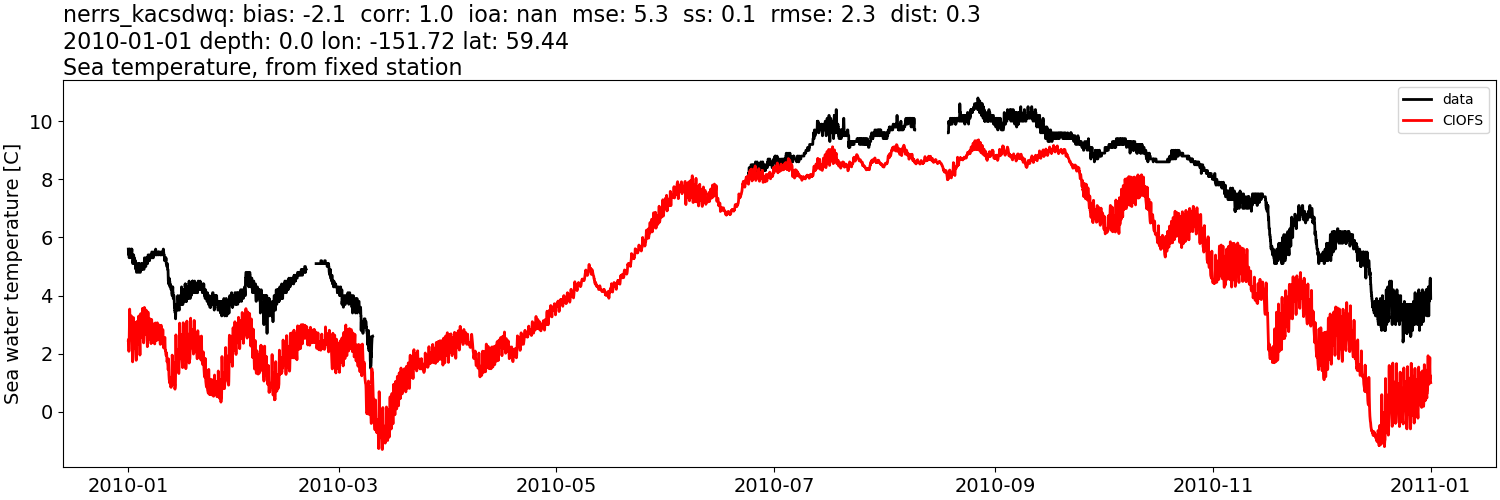
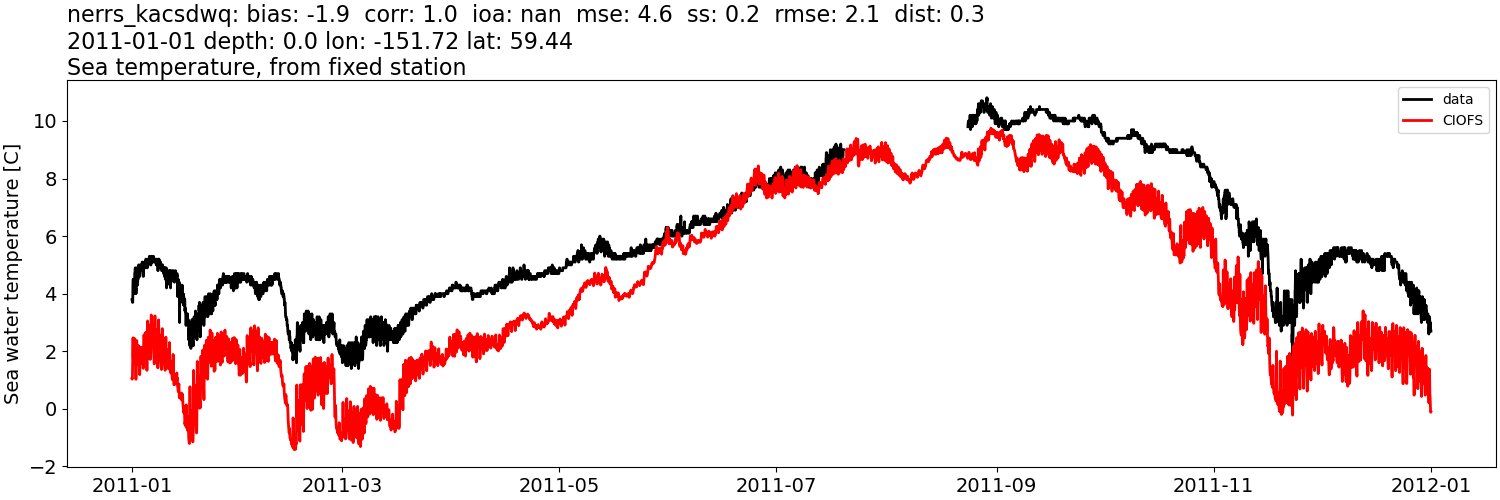
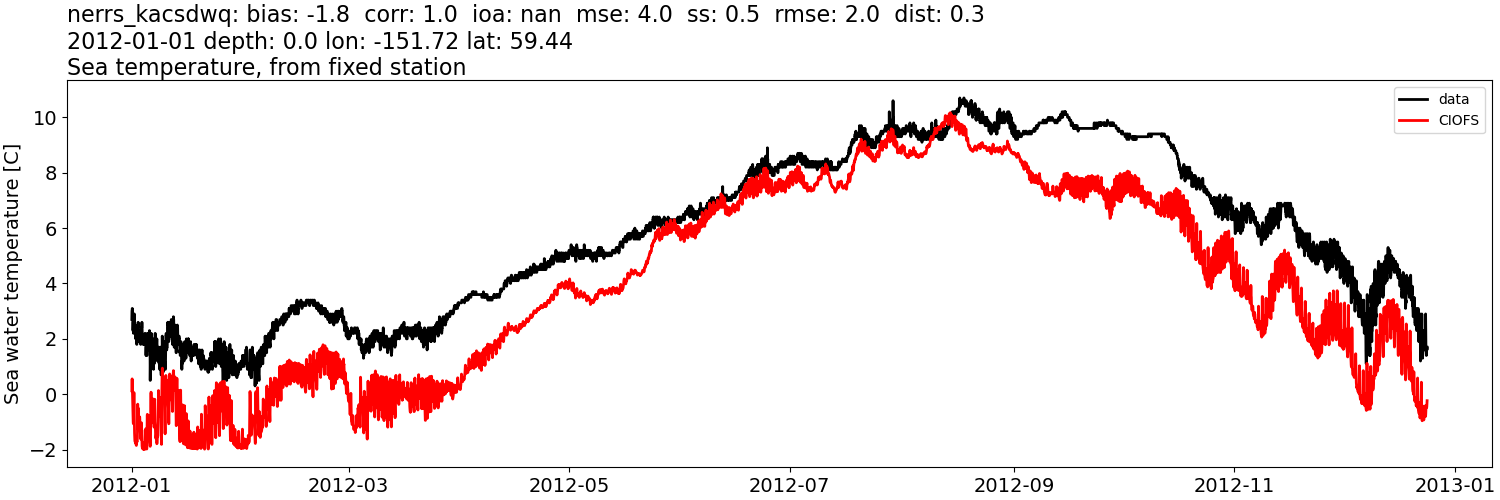
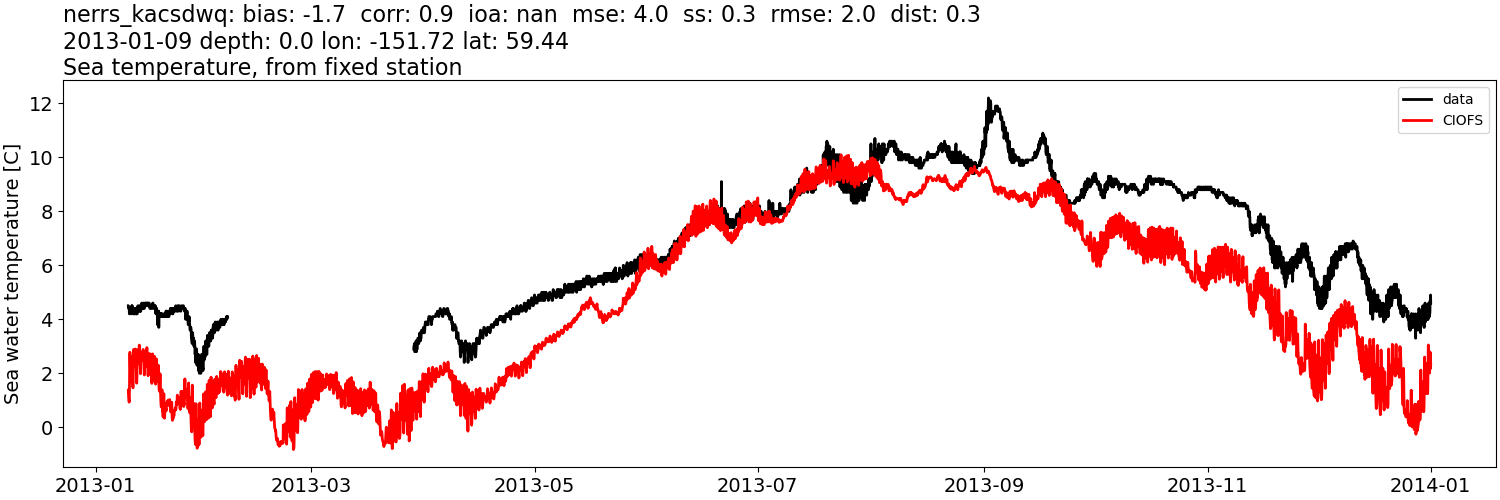
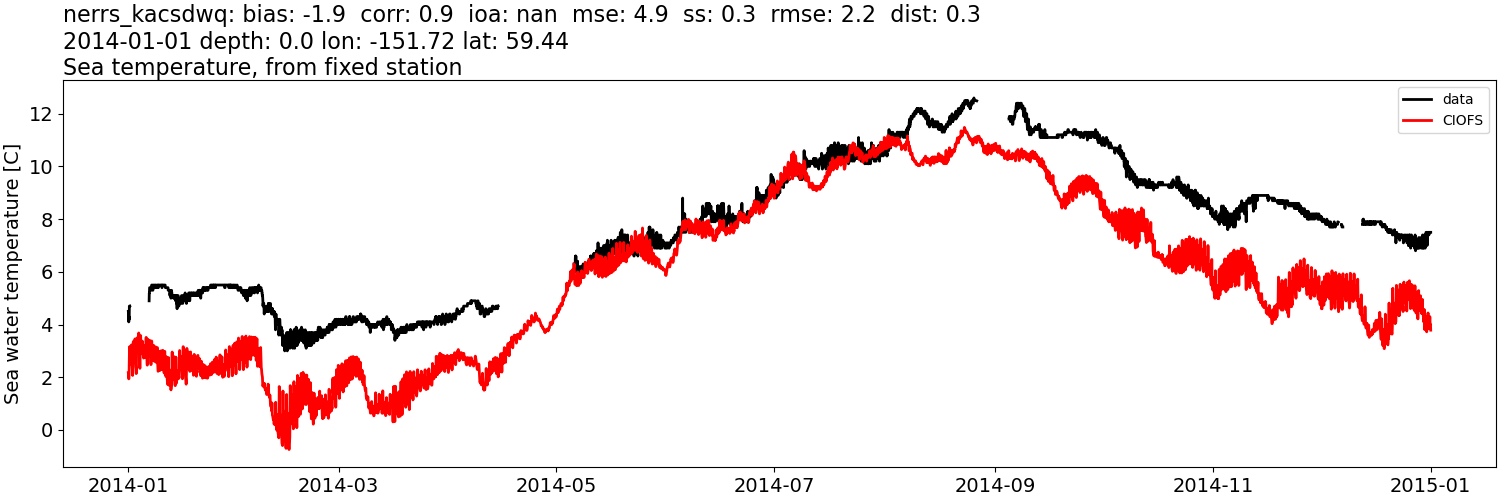
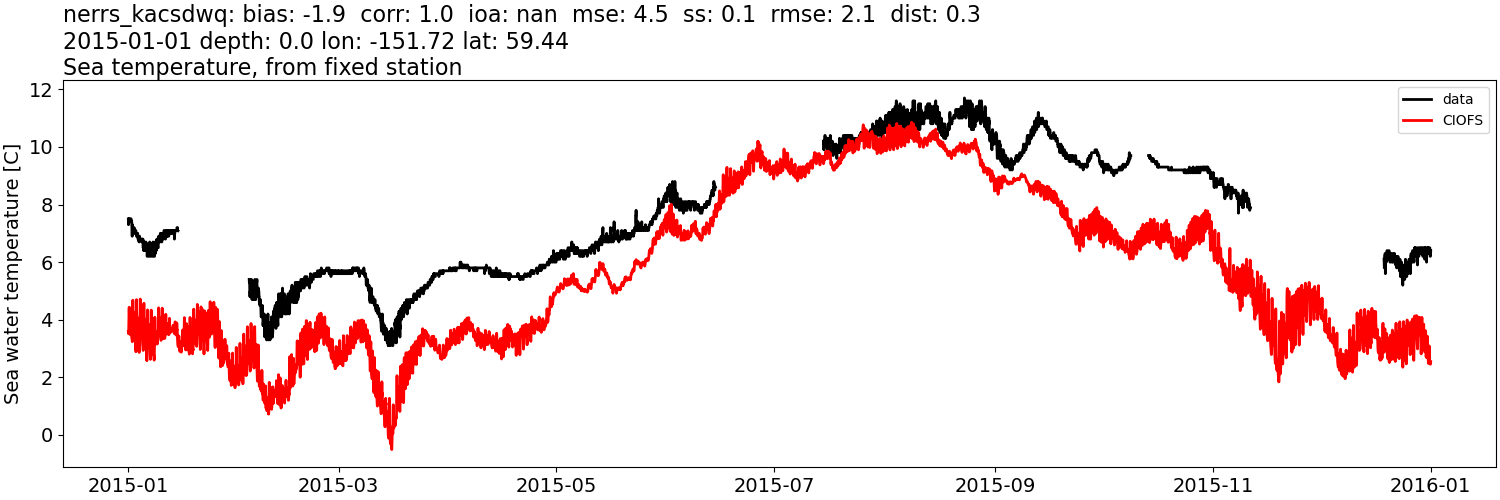
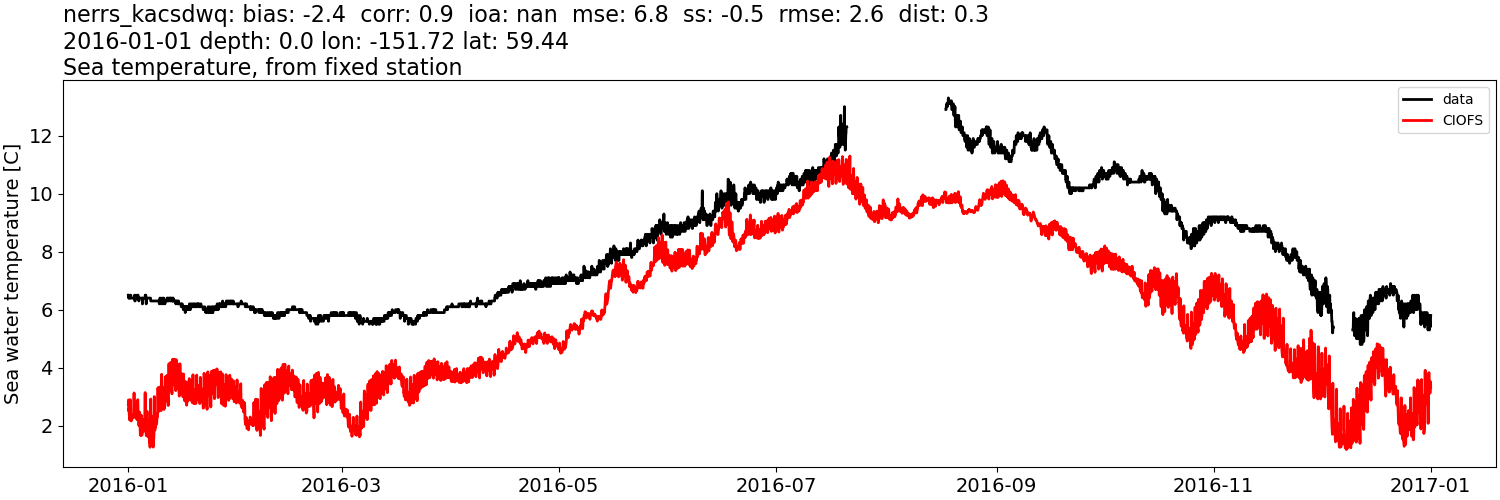
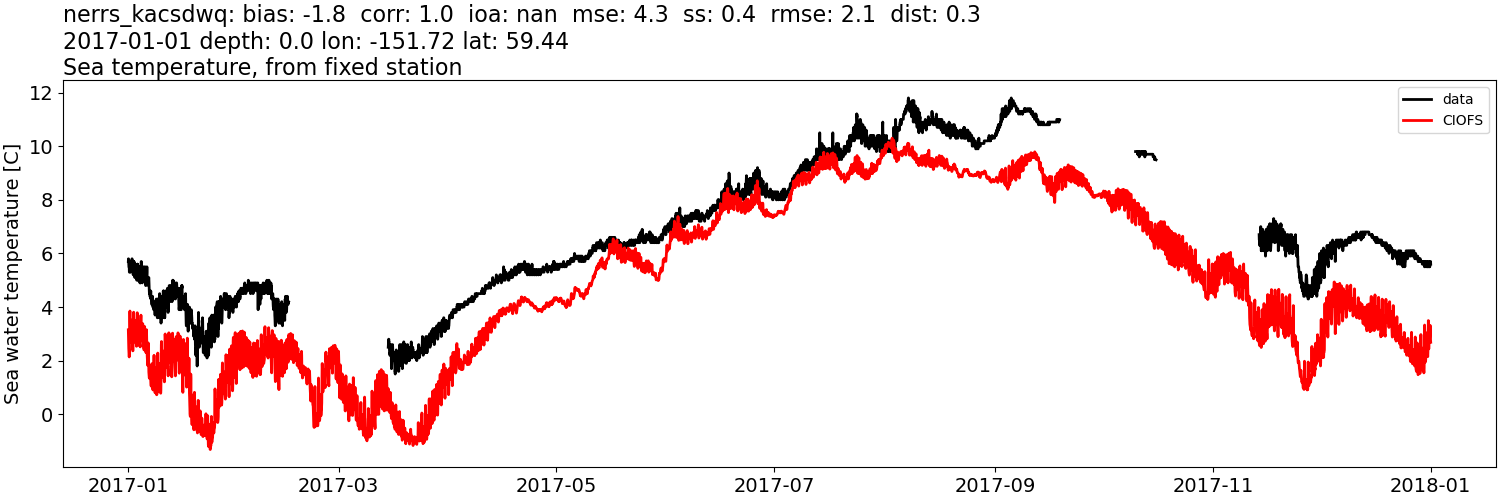
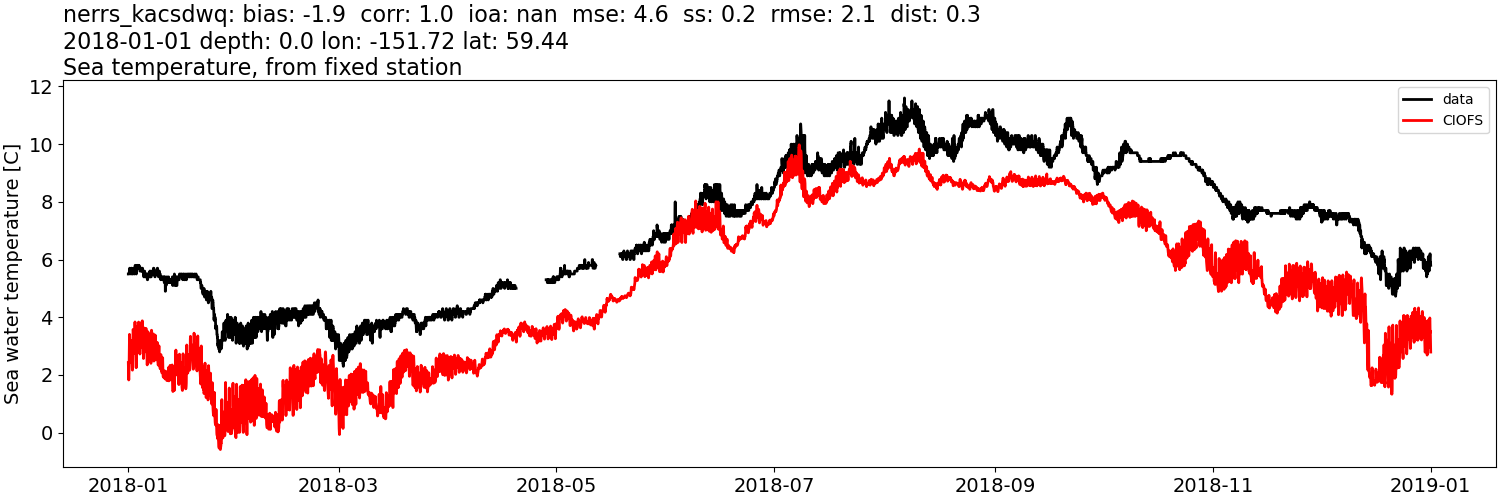
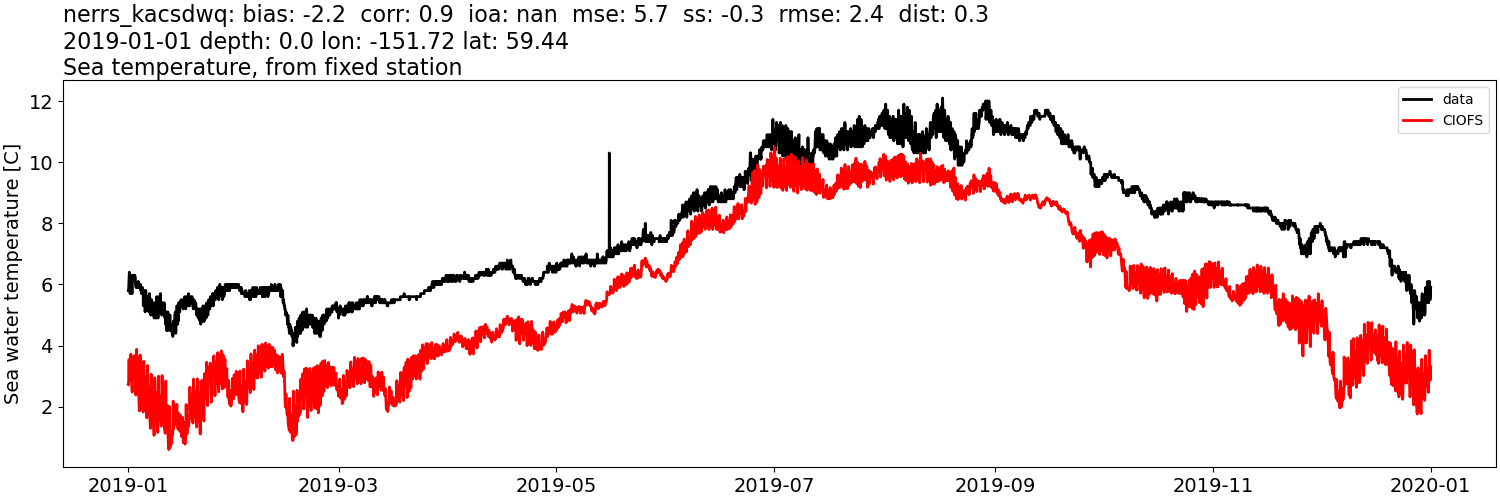
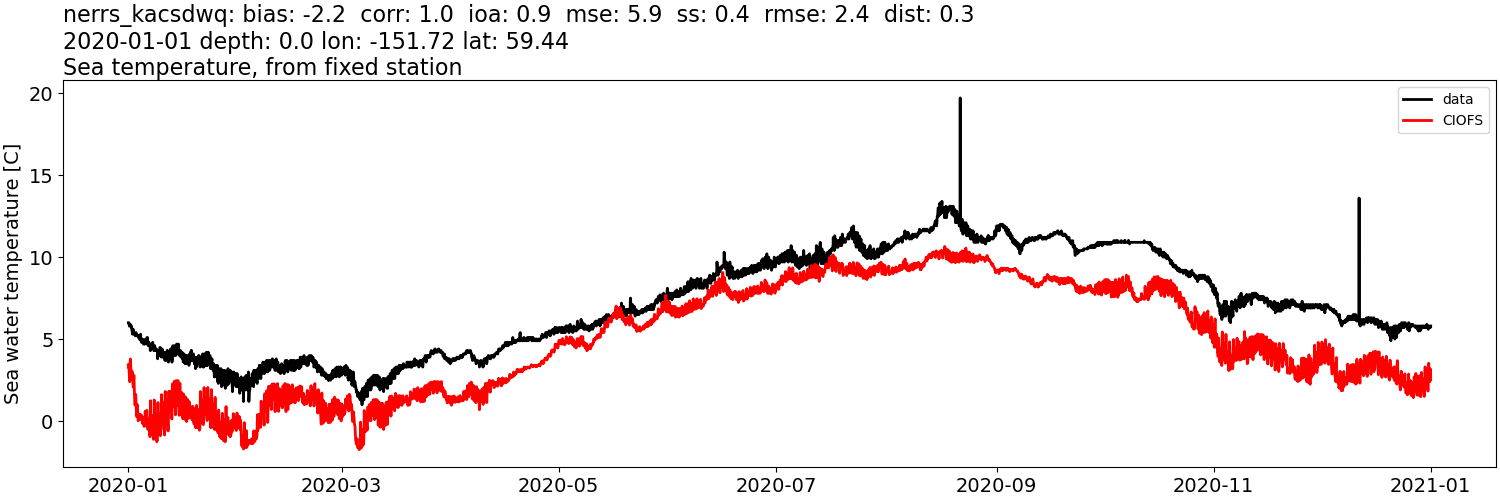
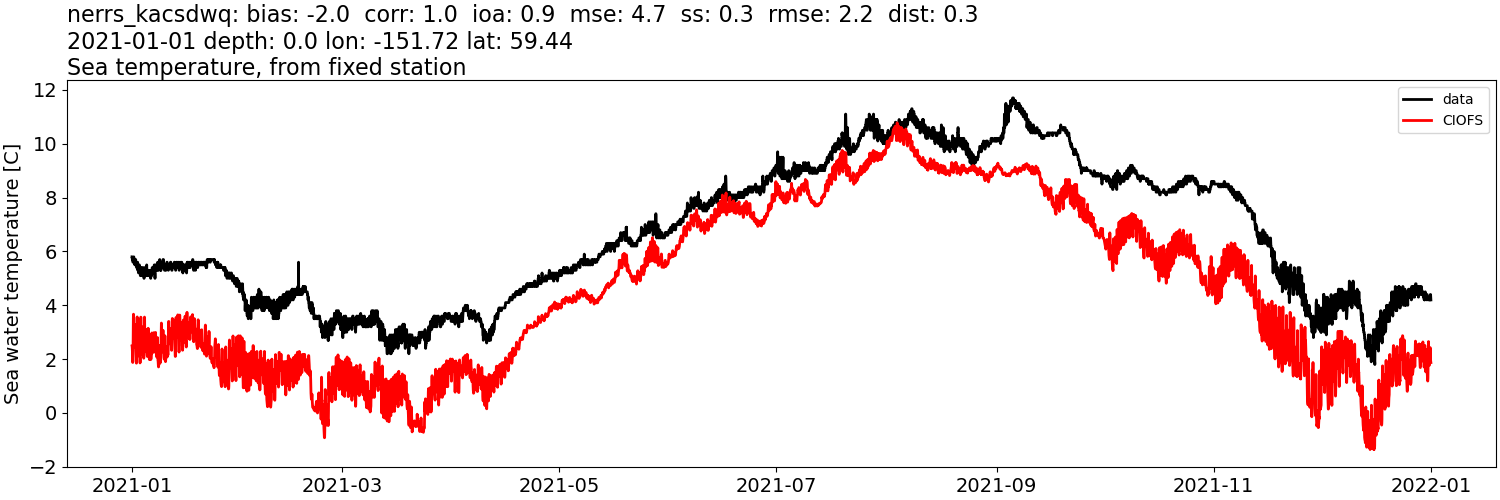
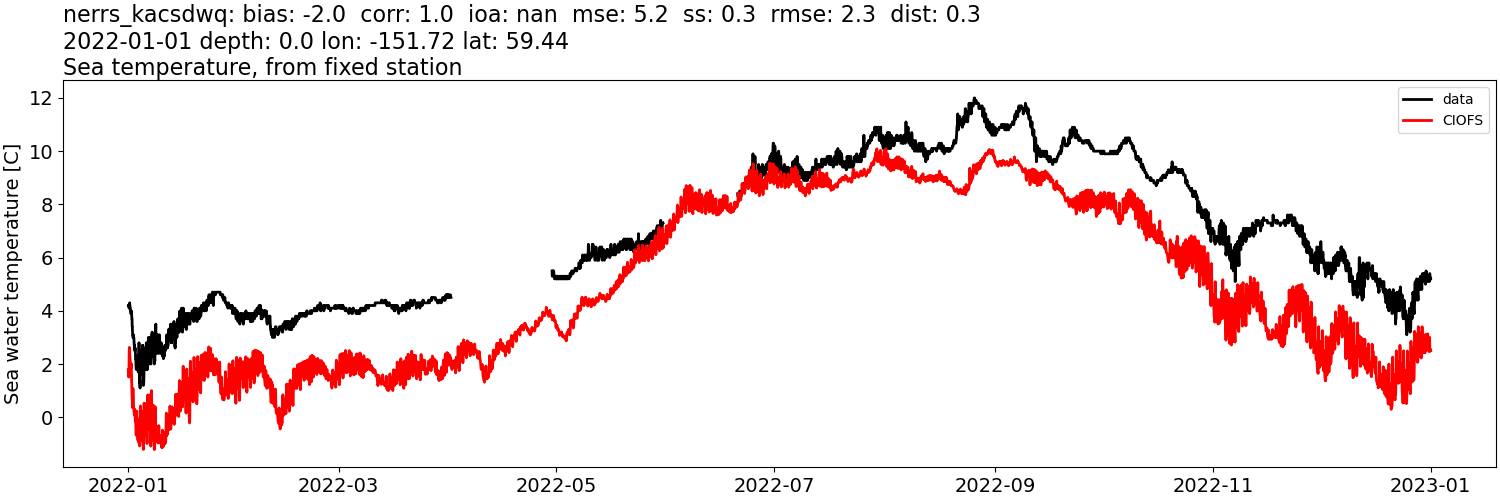
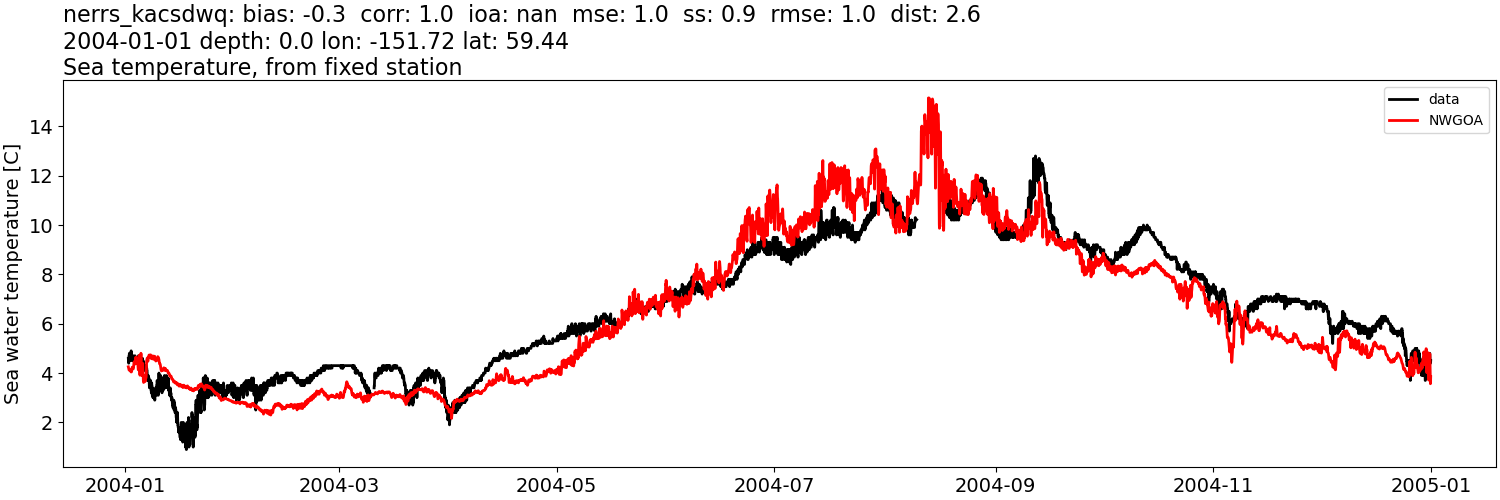
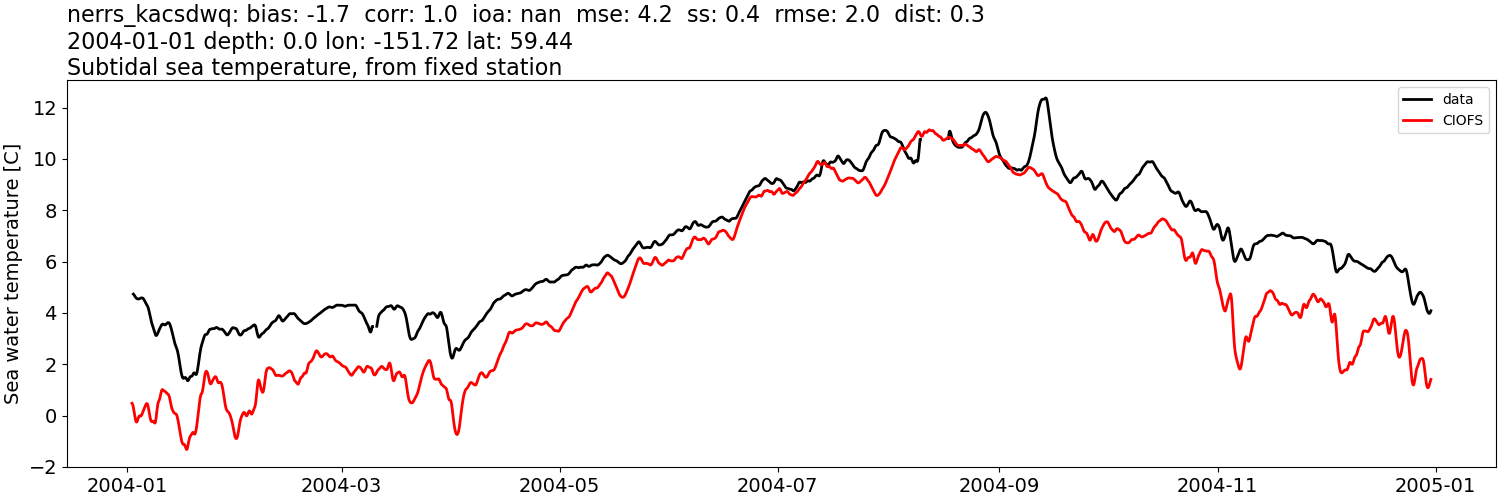
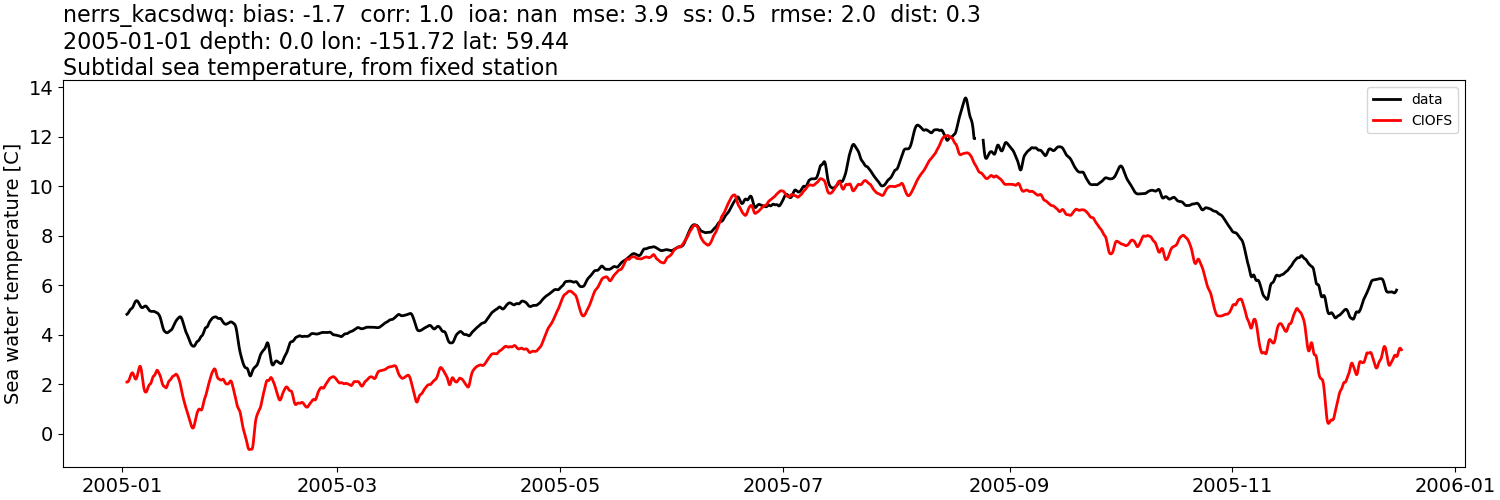
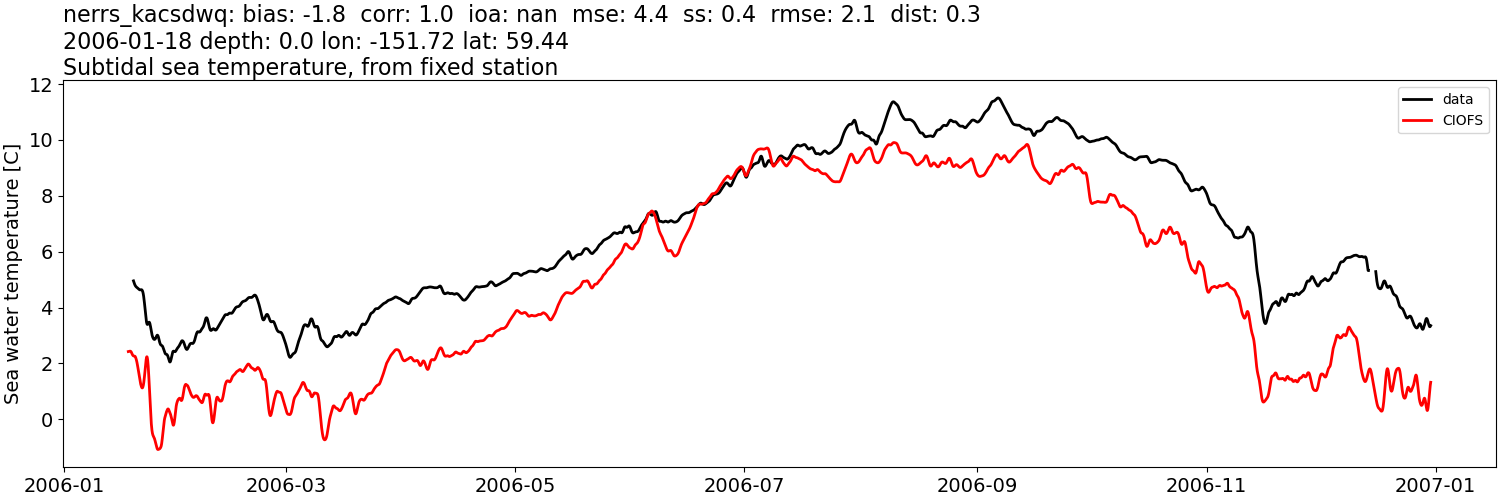
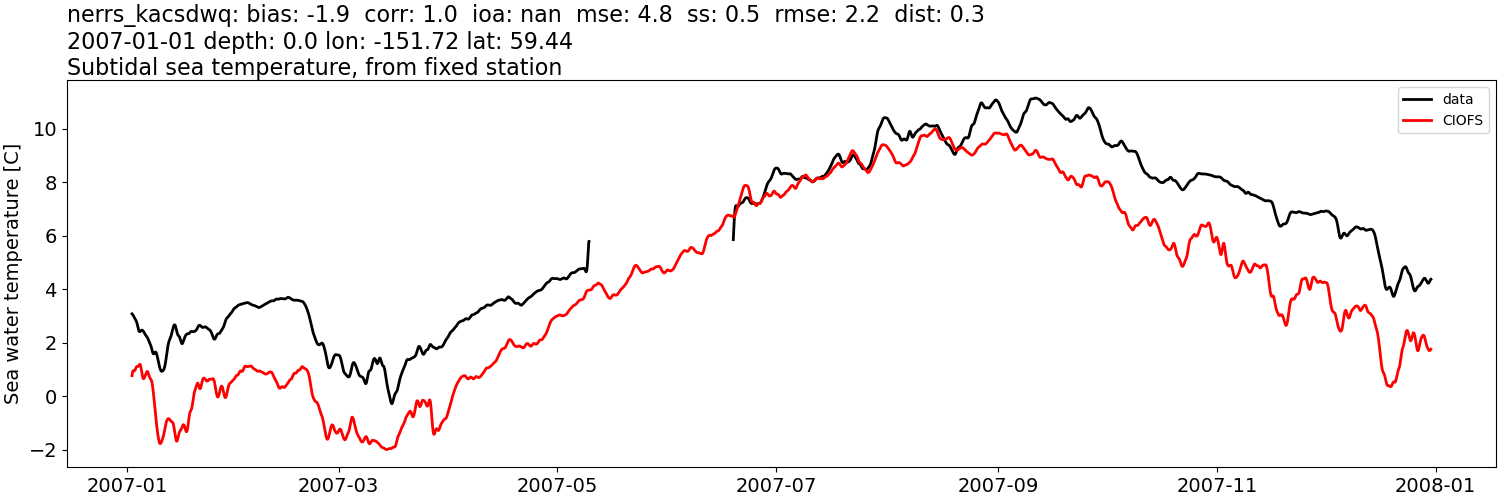
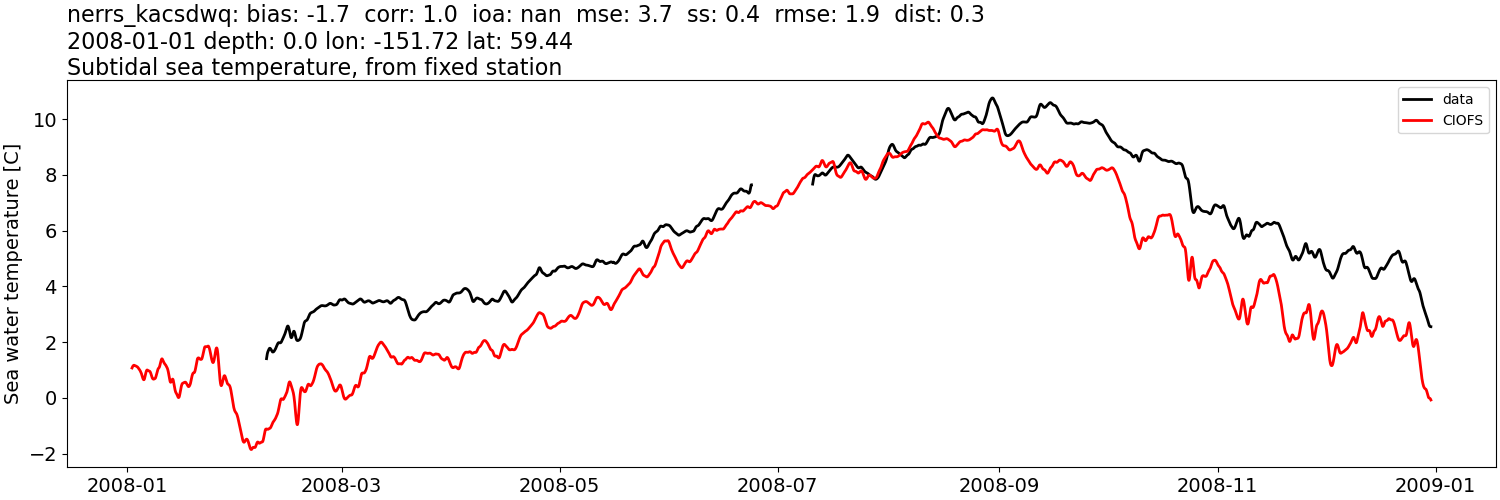
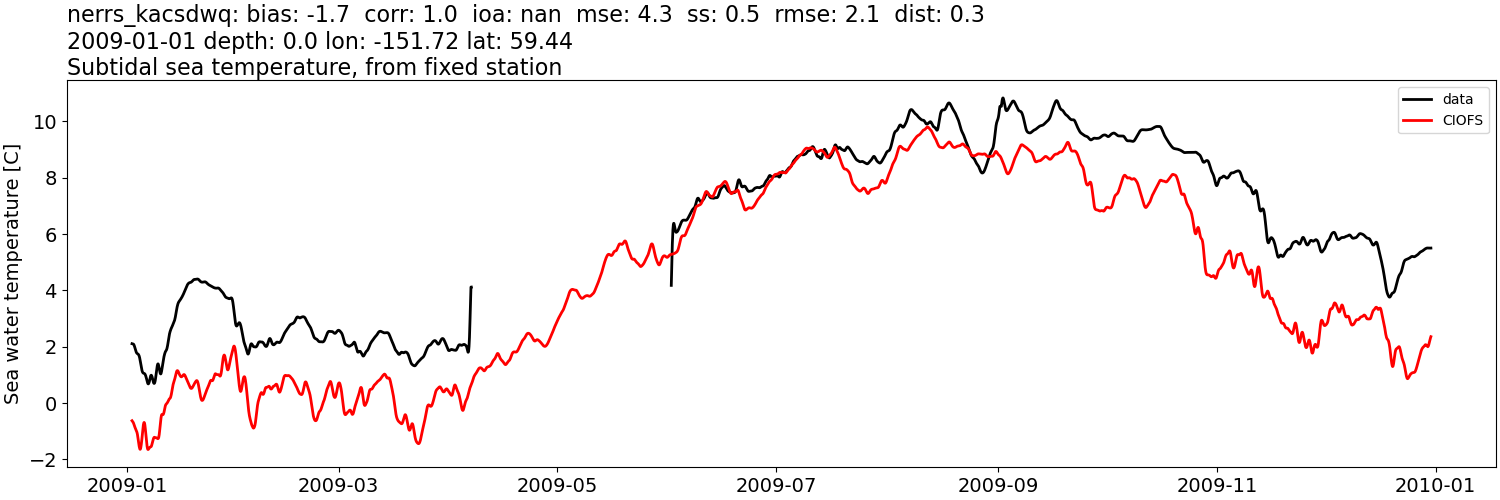
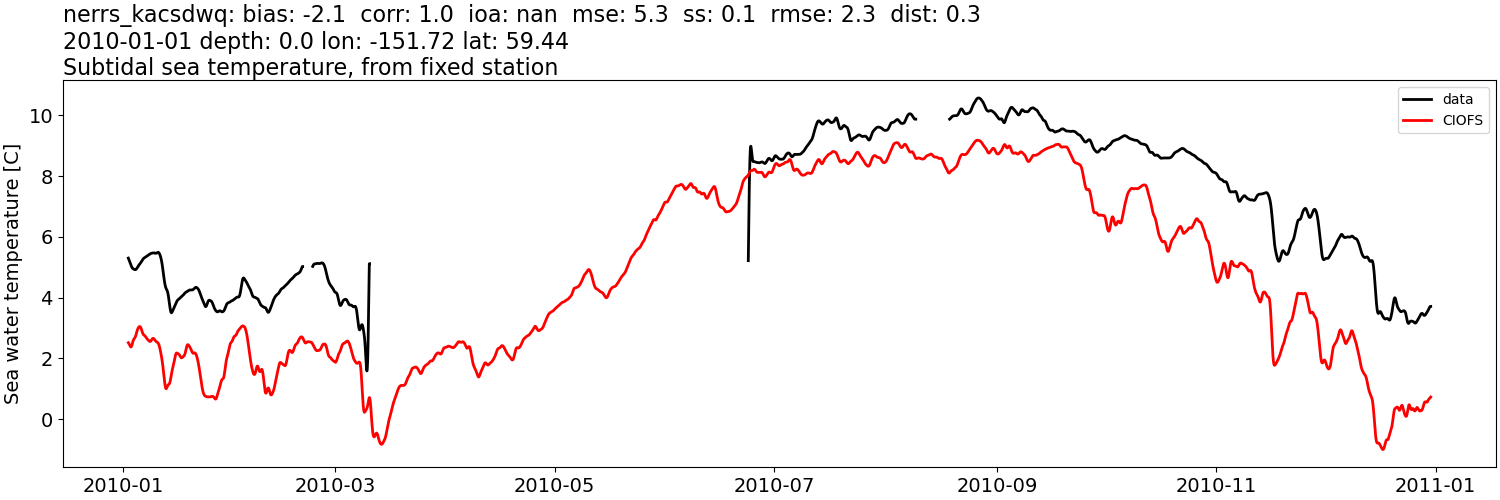
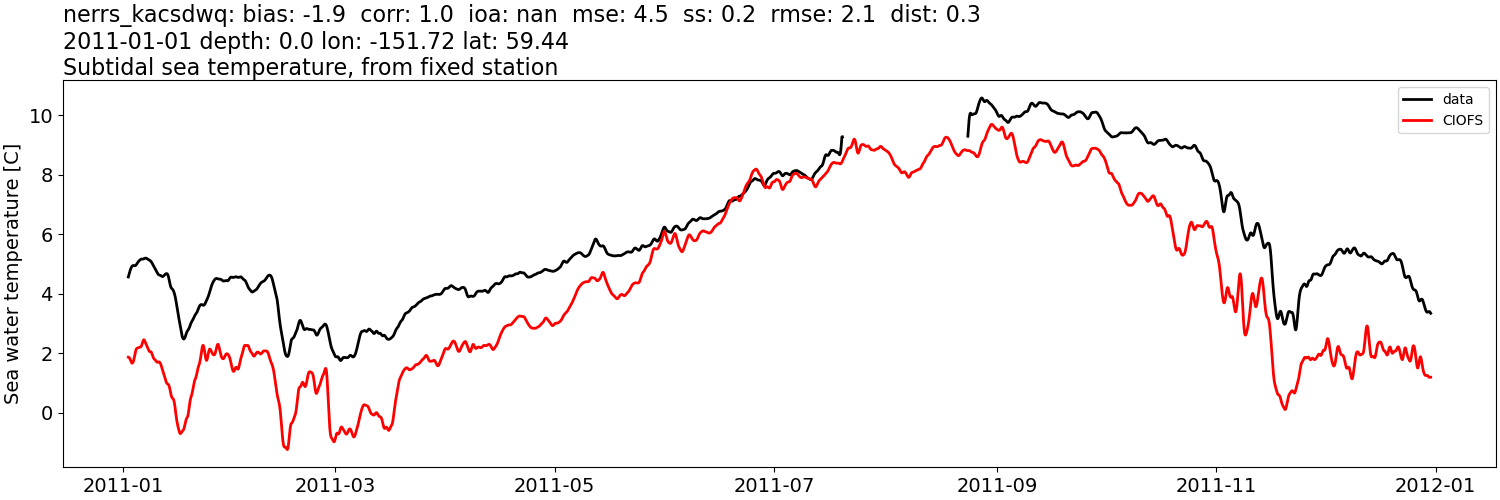
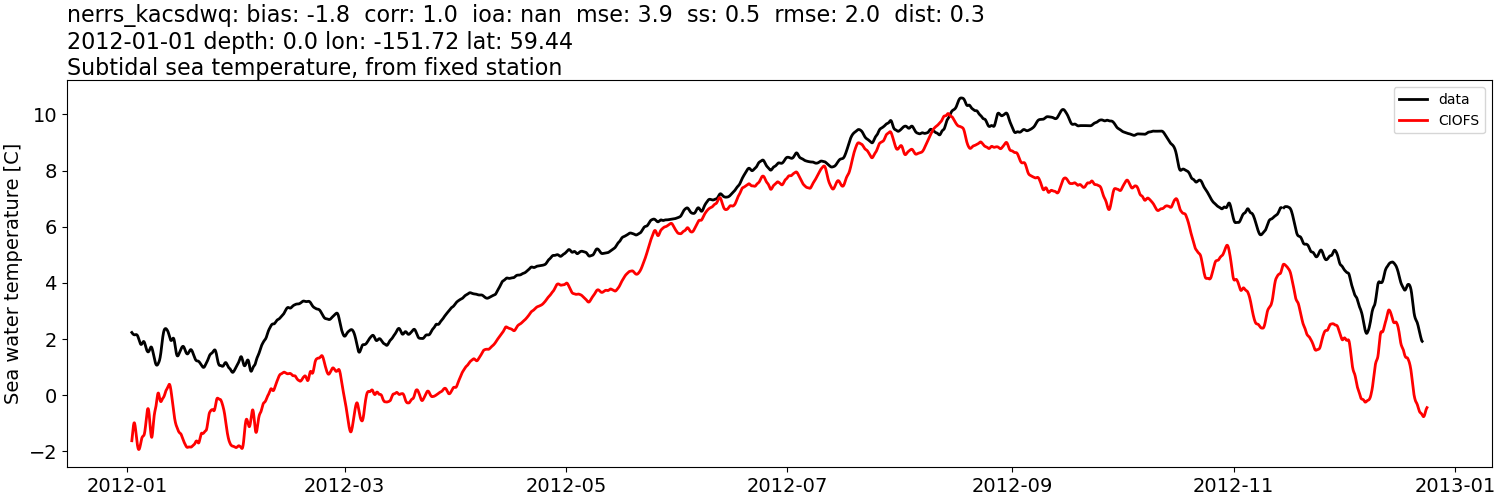
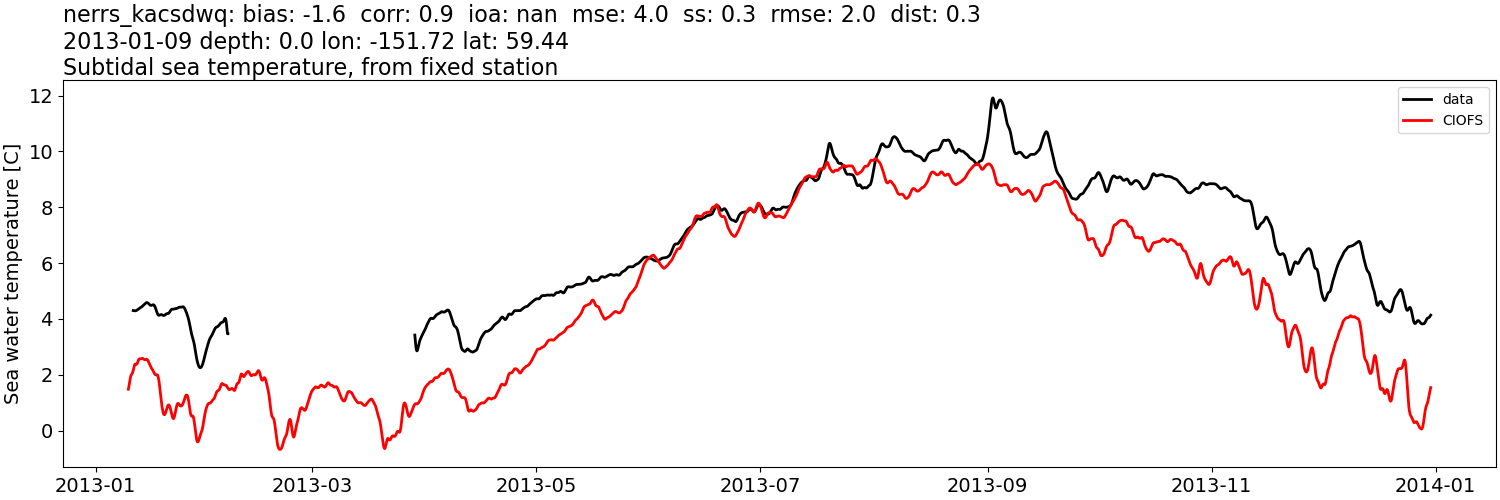
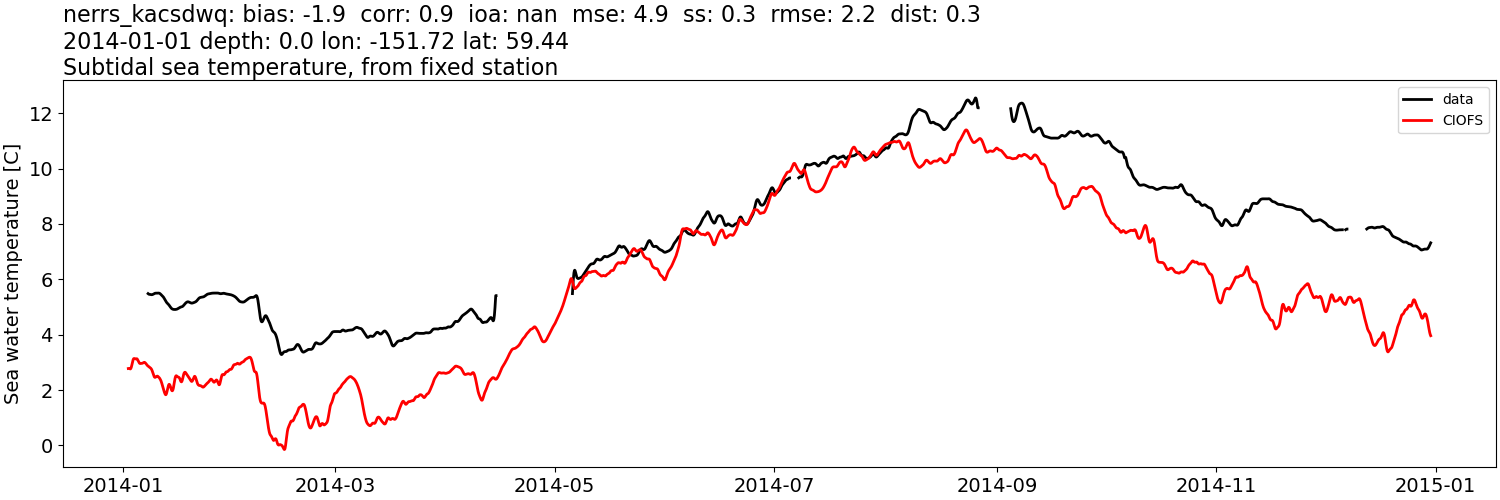
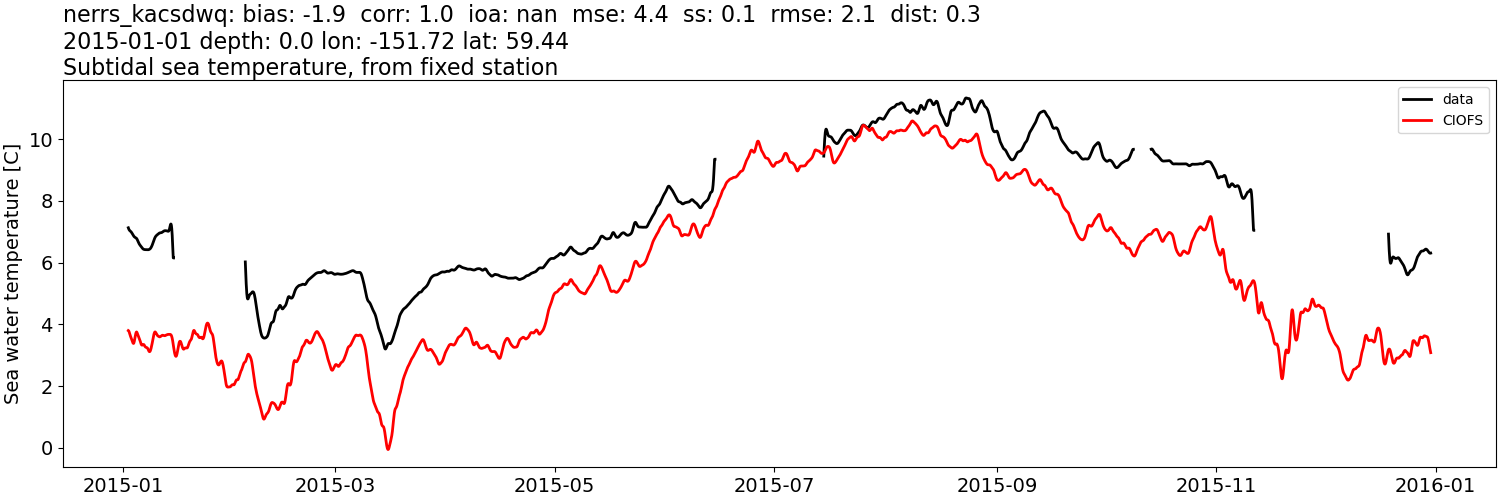
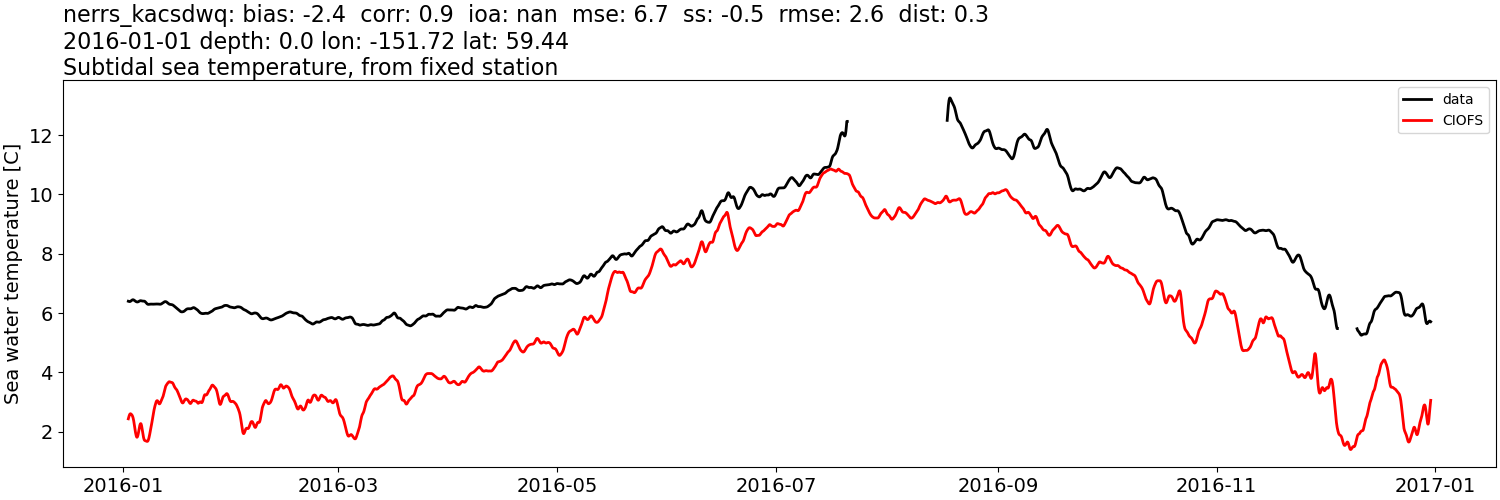
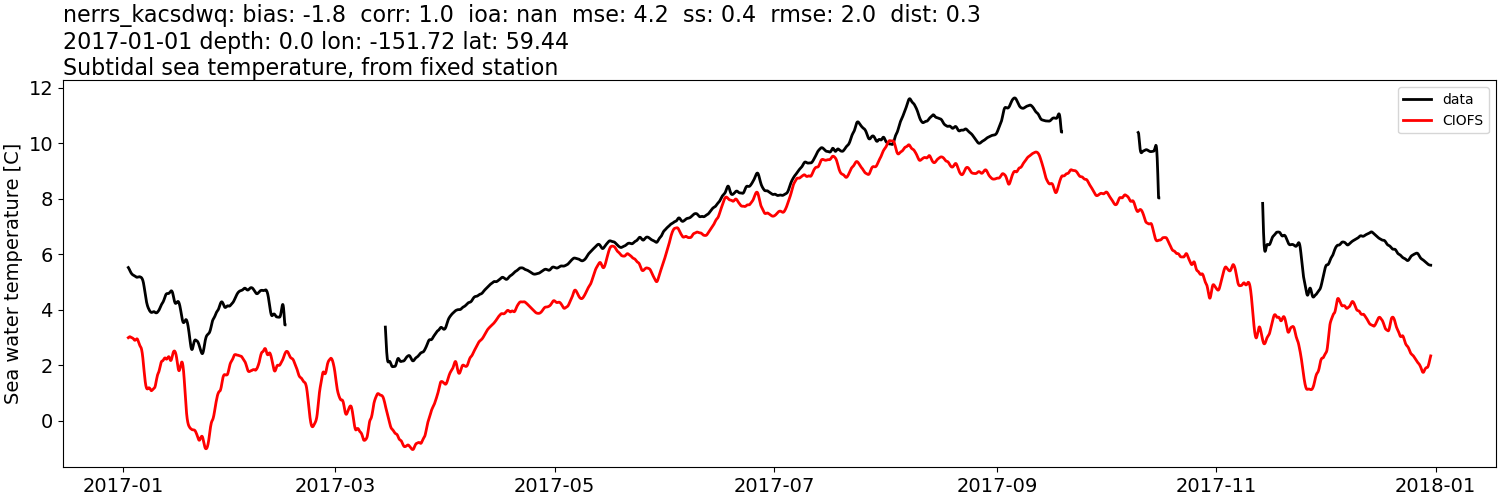
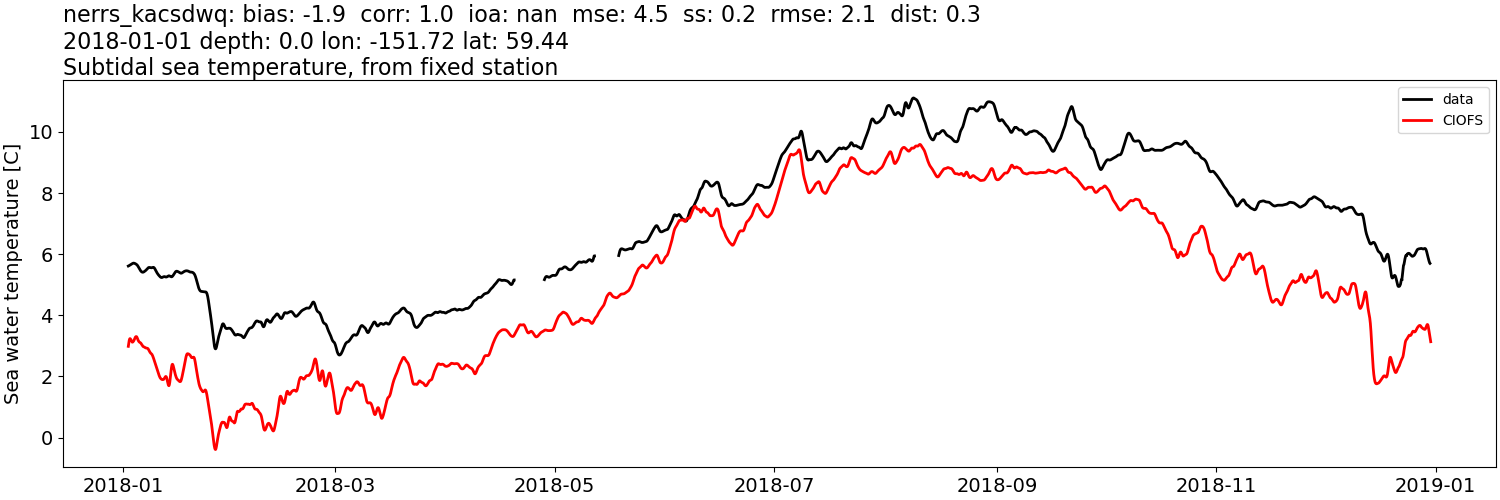
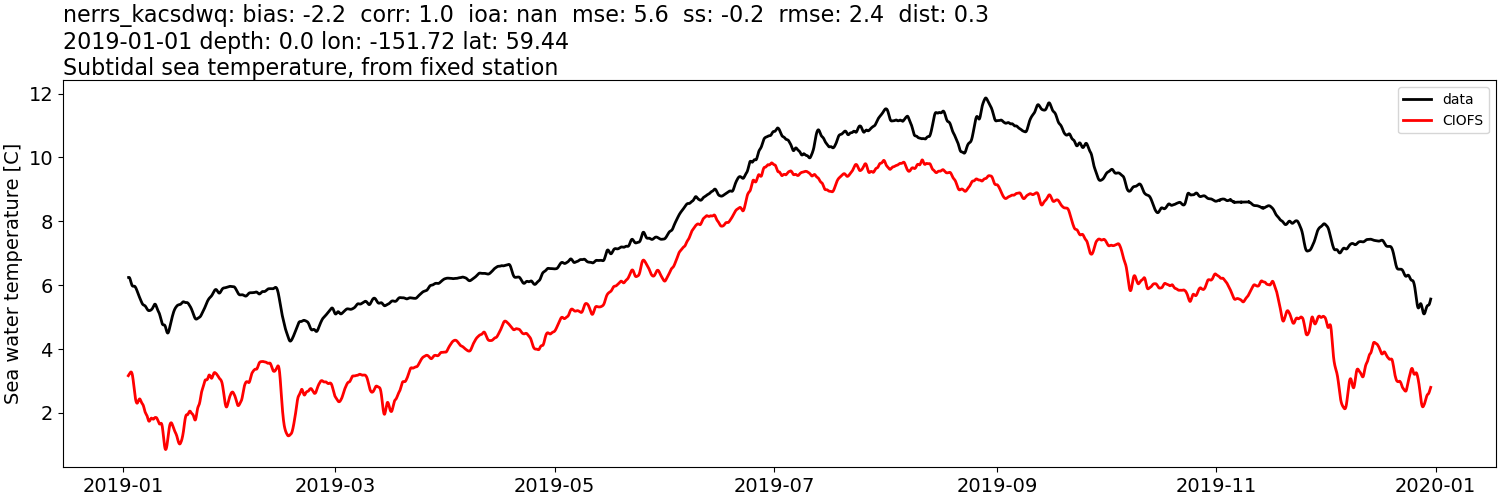
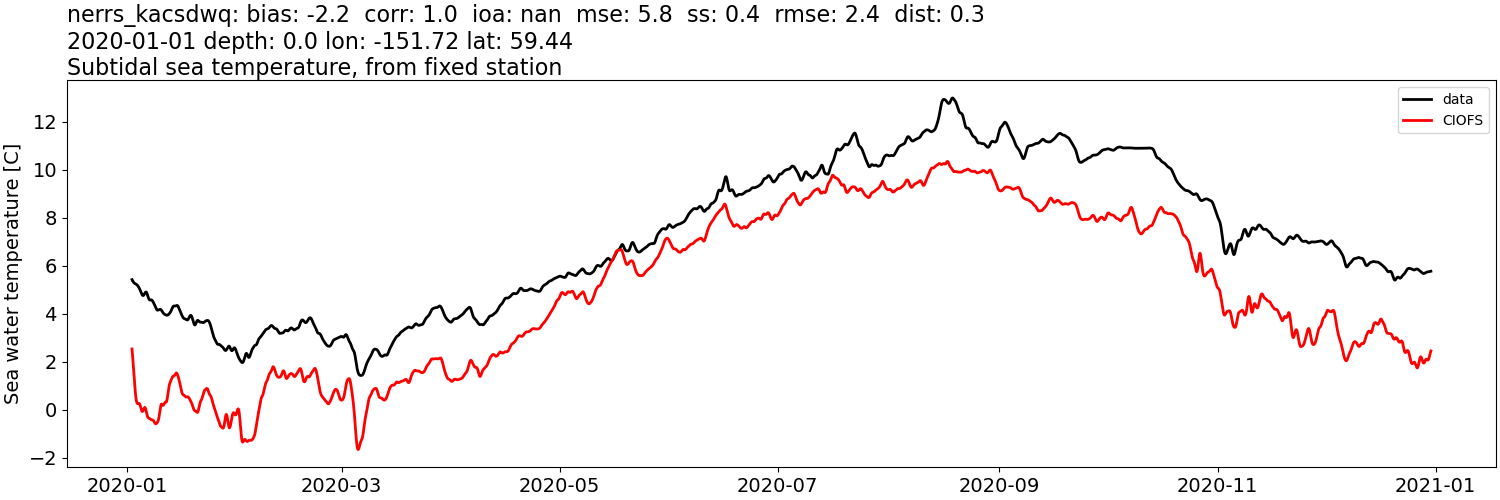
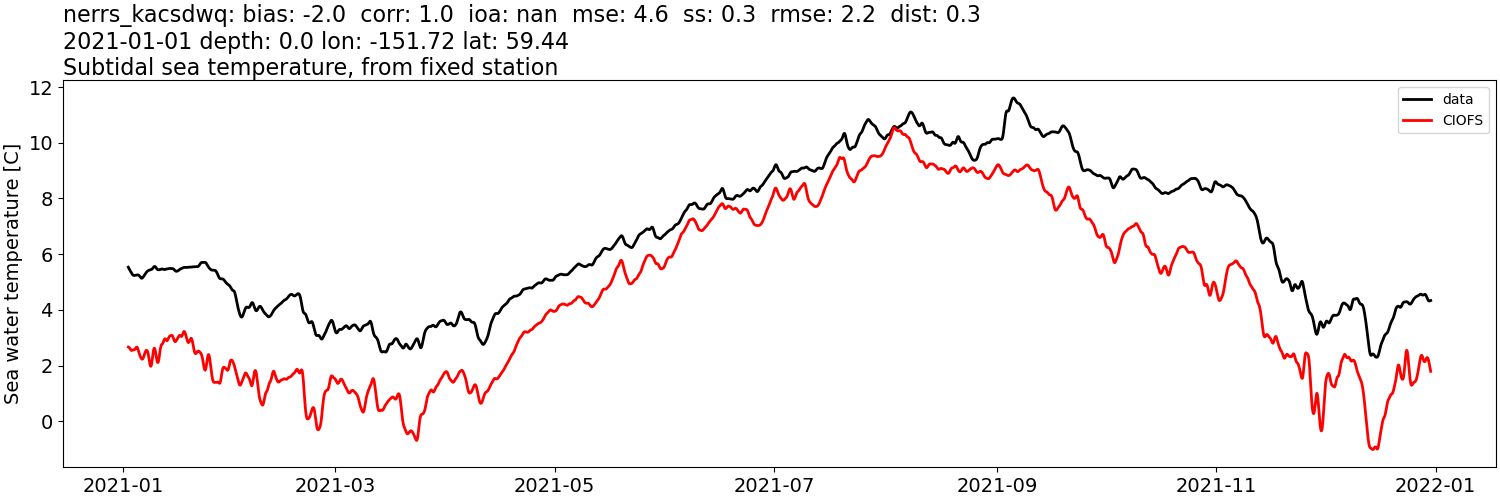
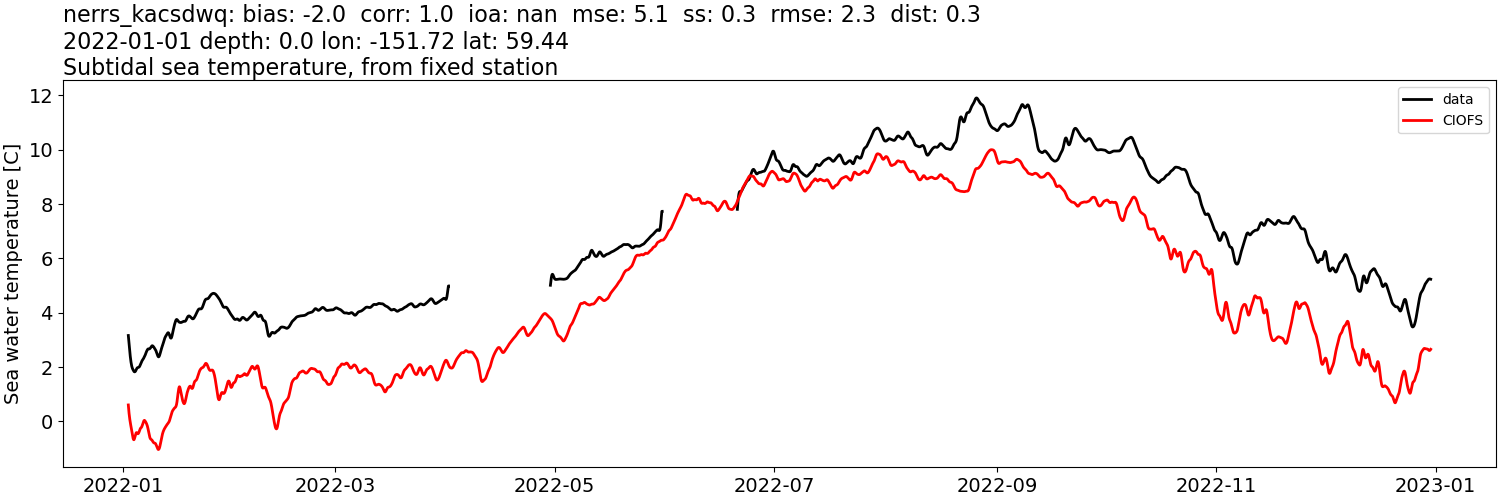
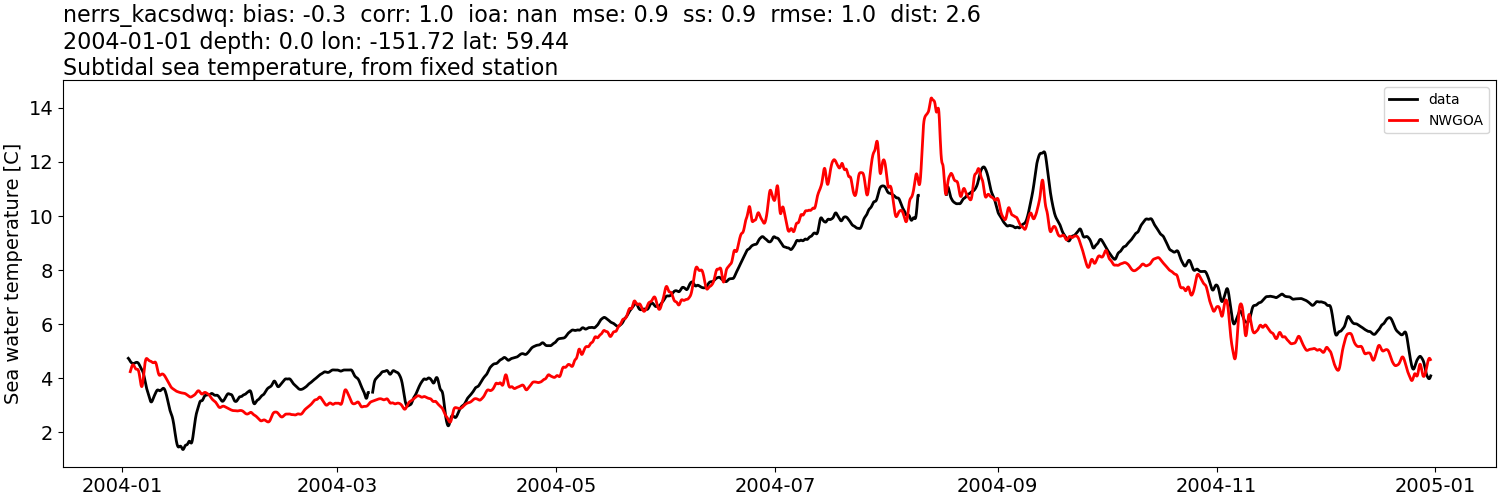
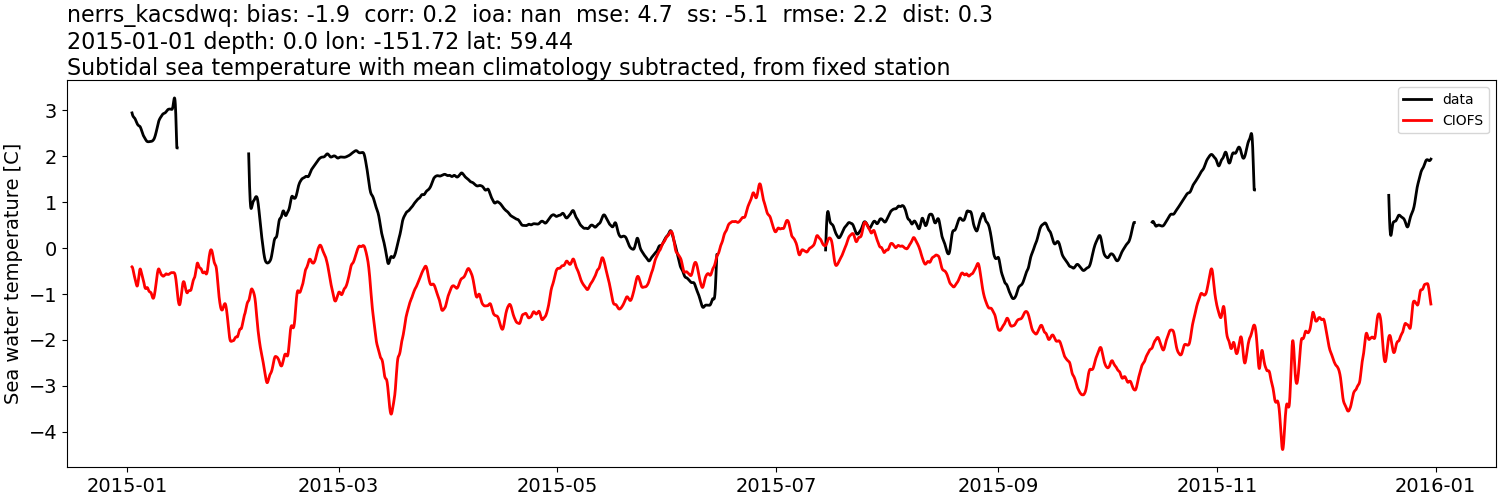
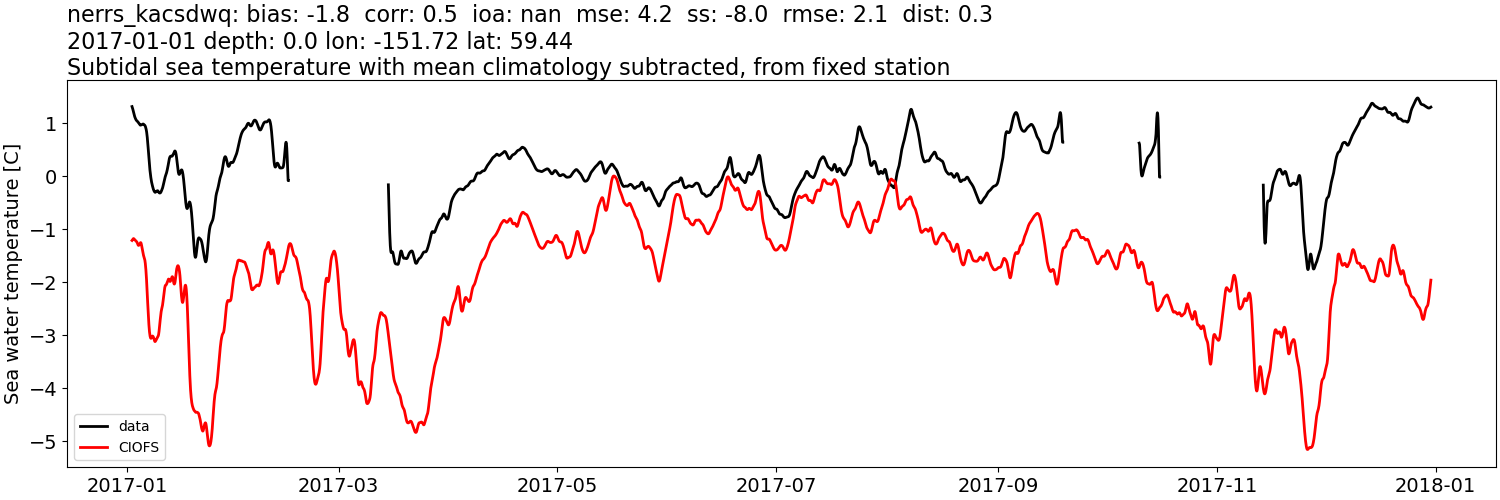
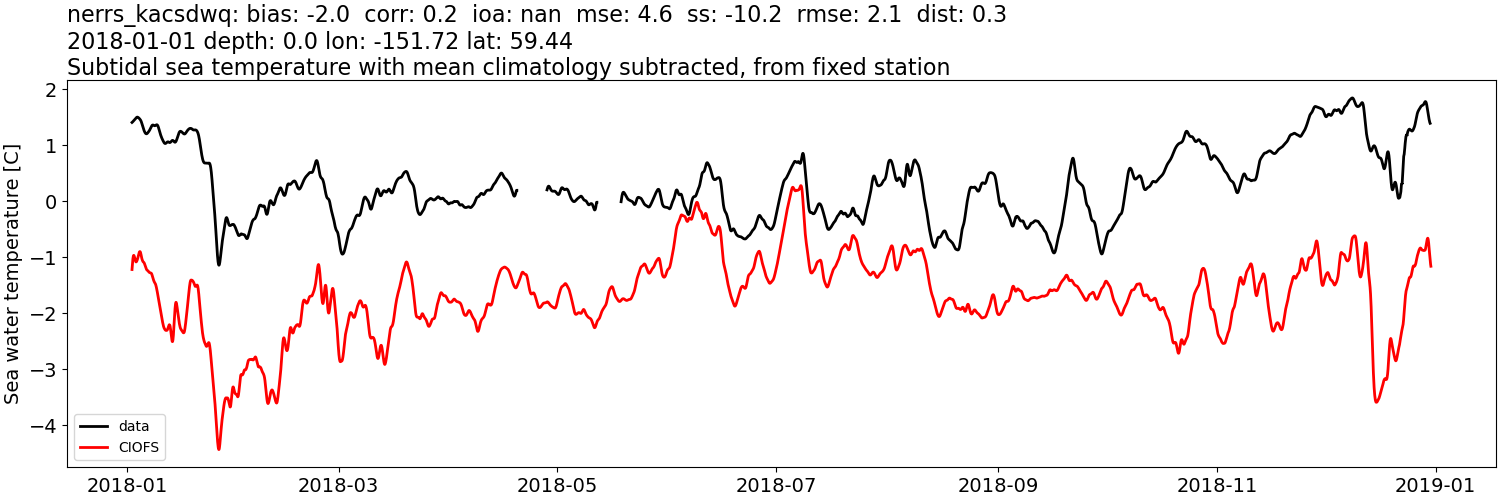
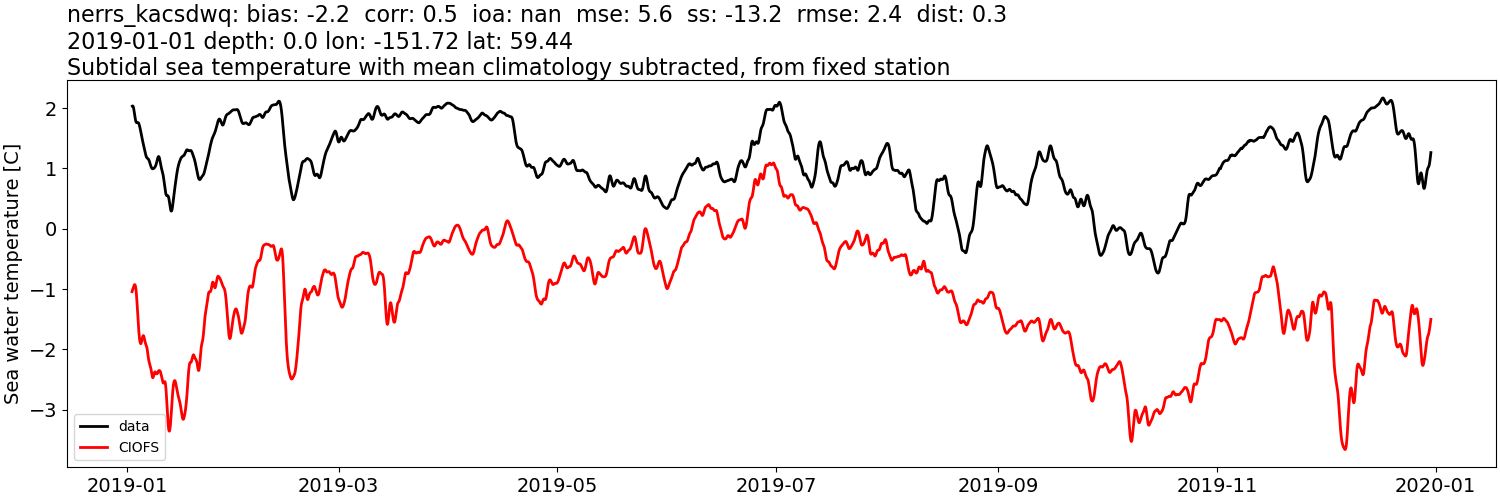
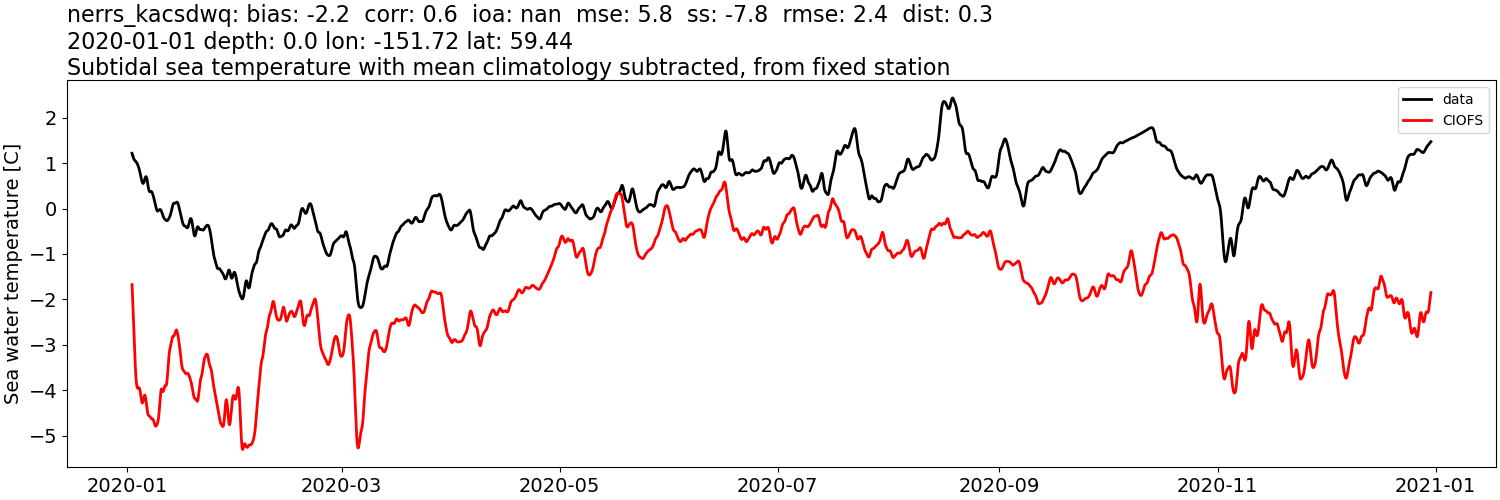
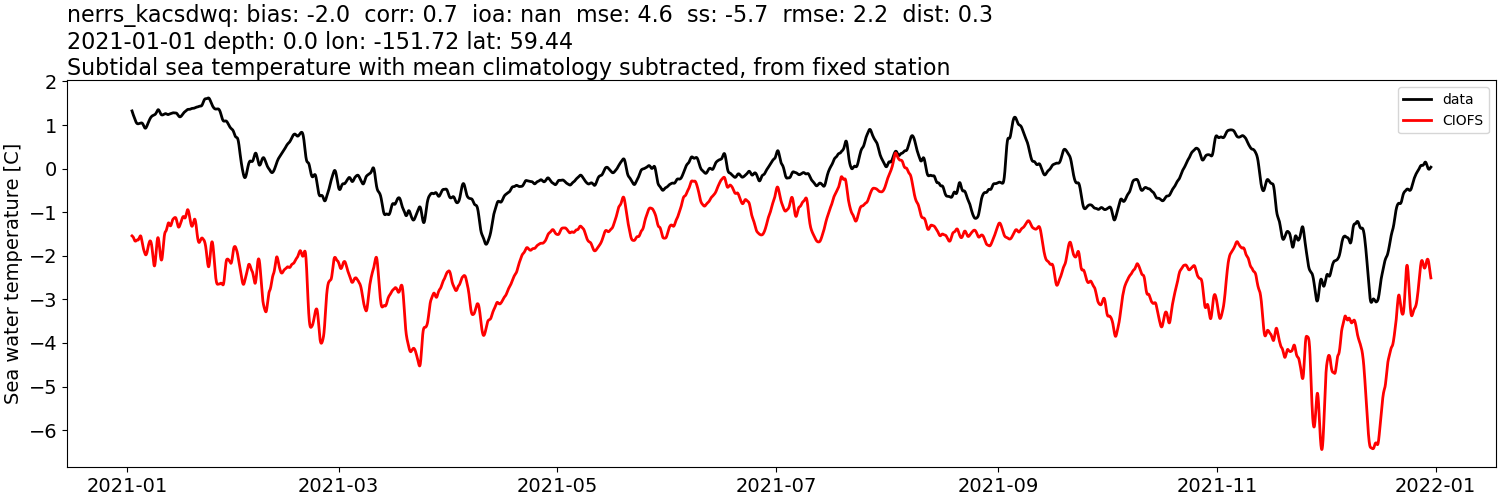
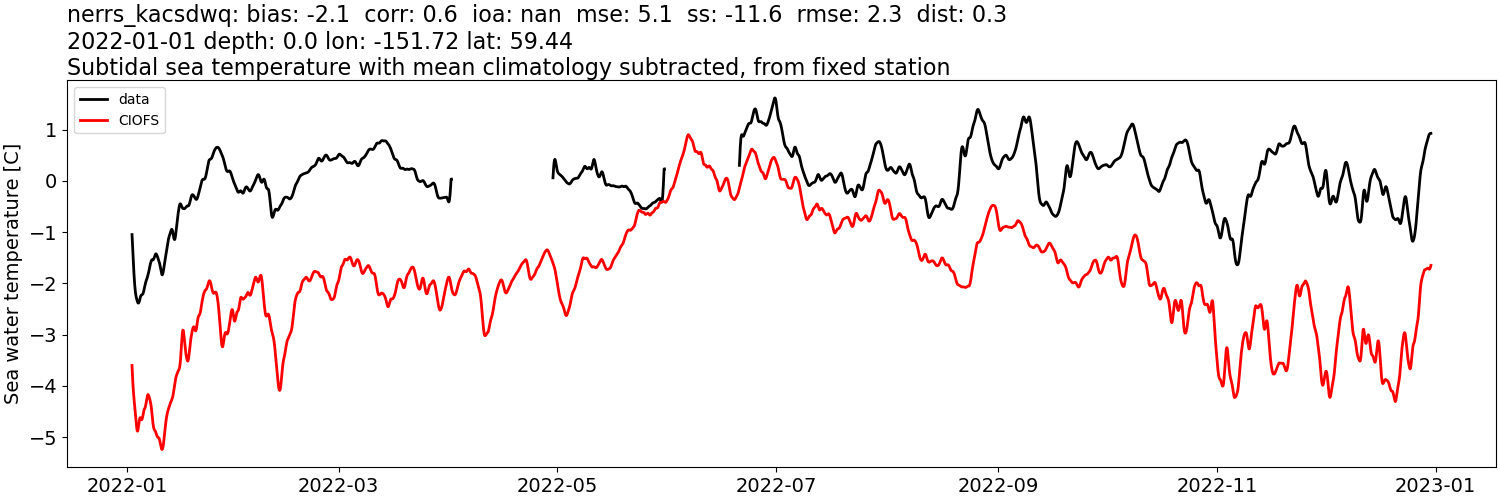
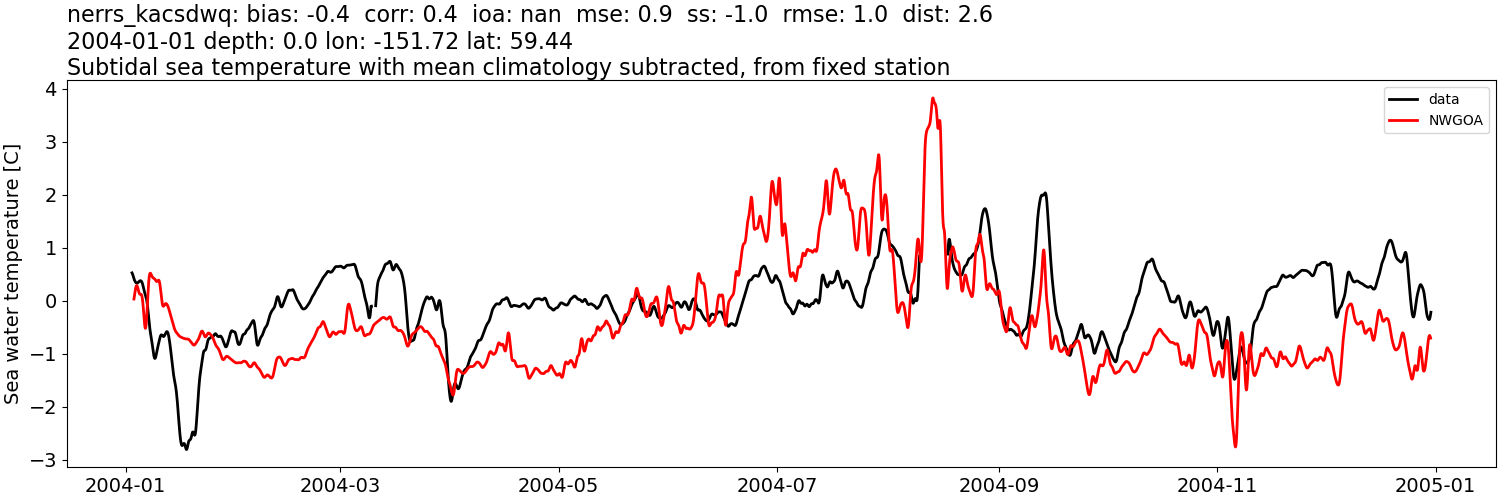
nerrs_kacsdwq#
Sea water salinity:#
CIOFS#
Comparison plots by year
2004
2005
2006
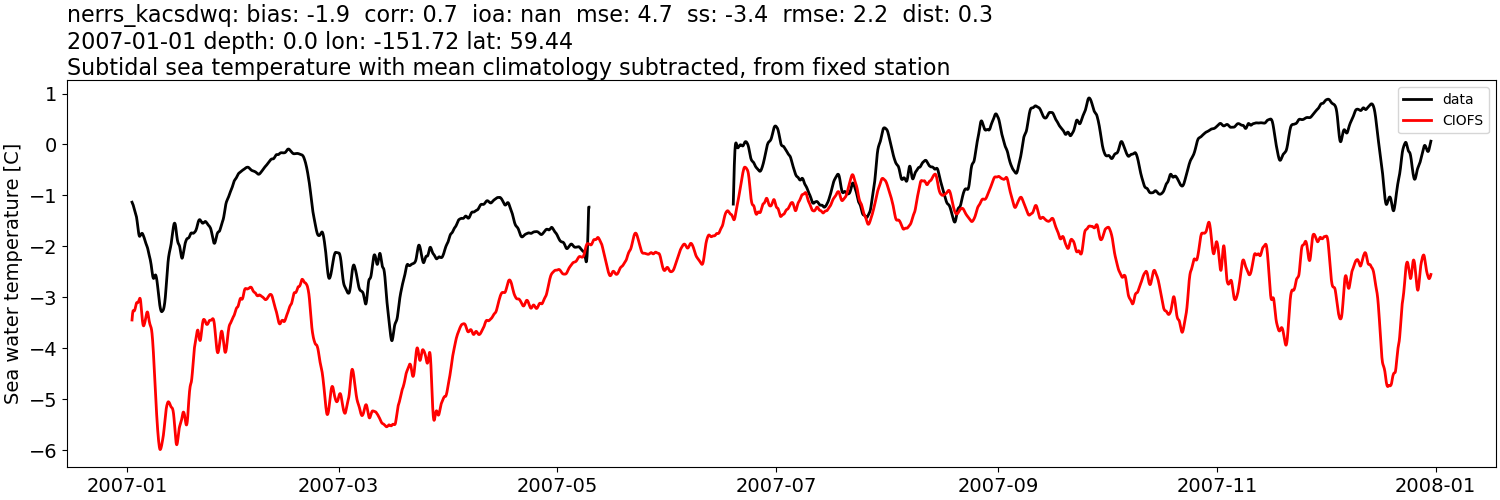
2007
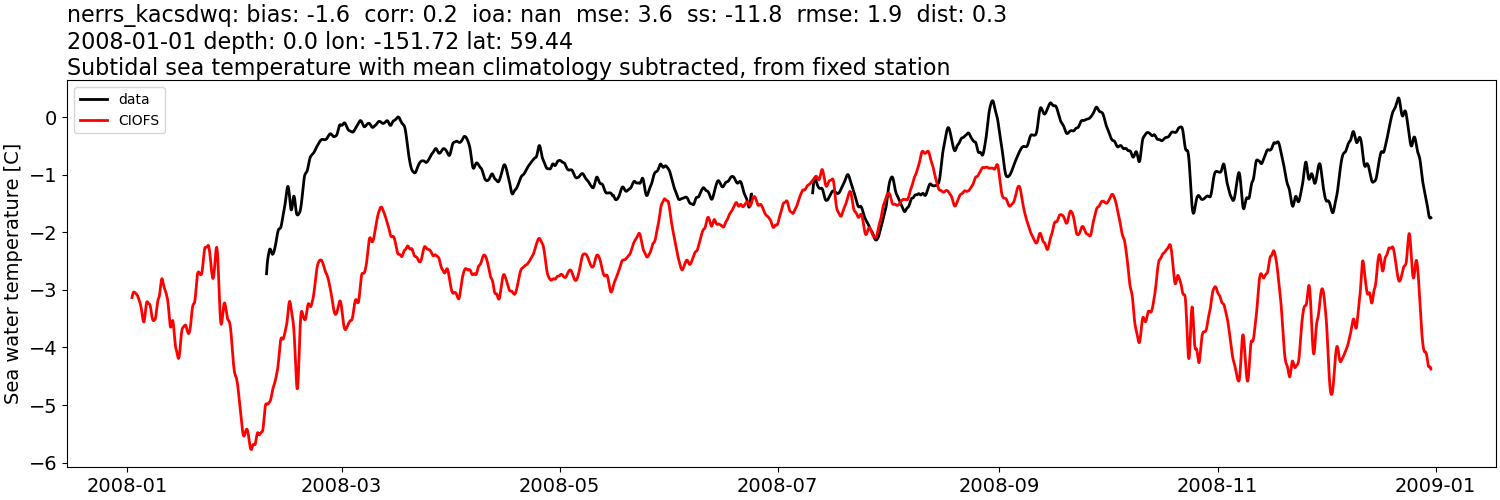
2008
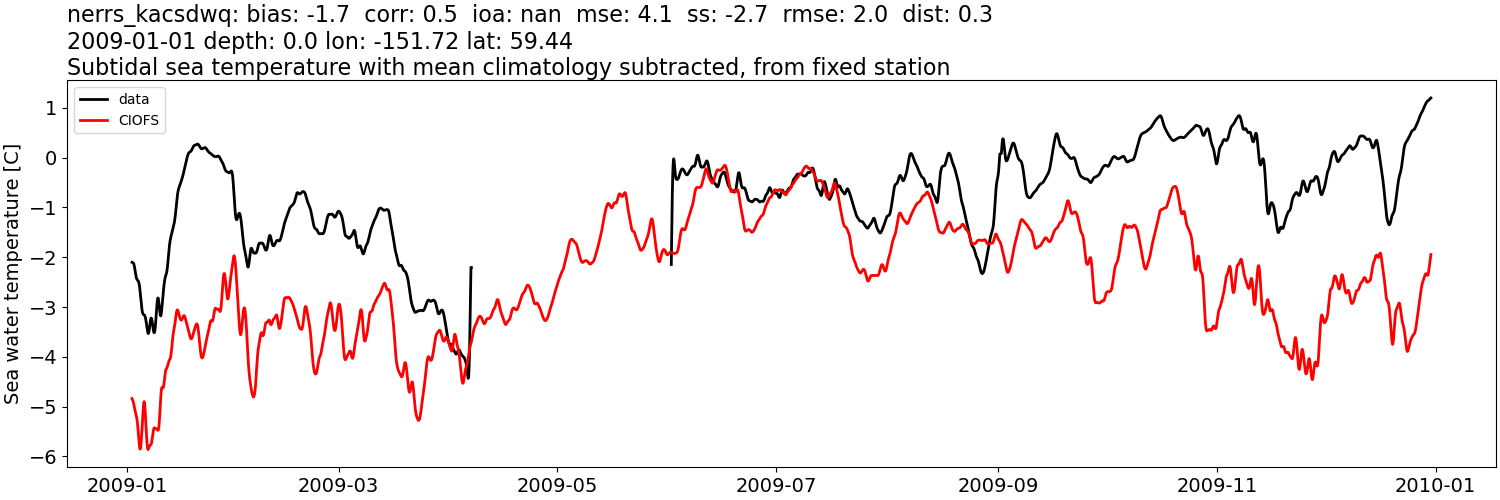
2009
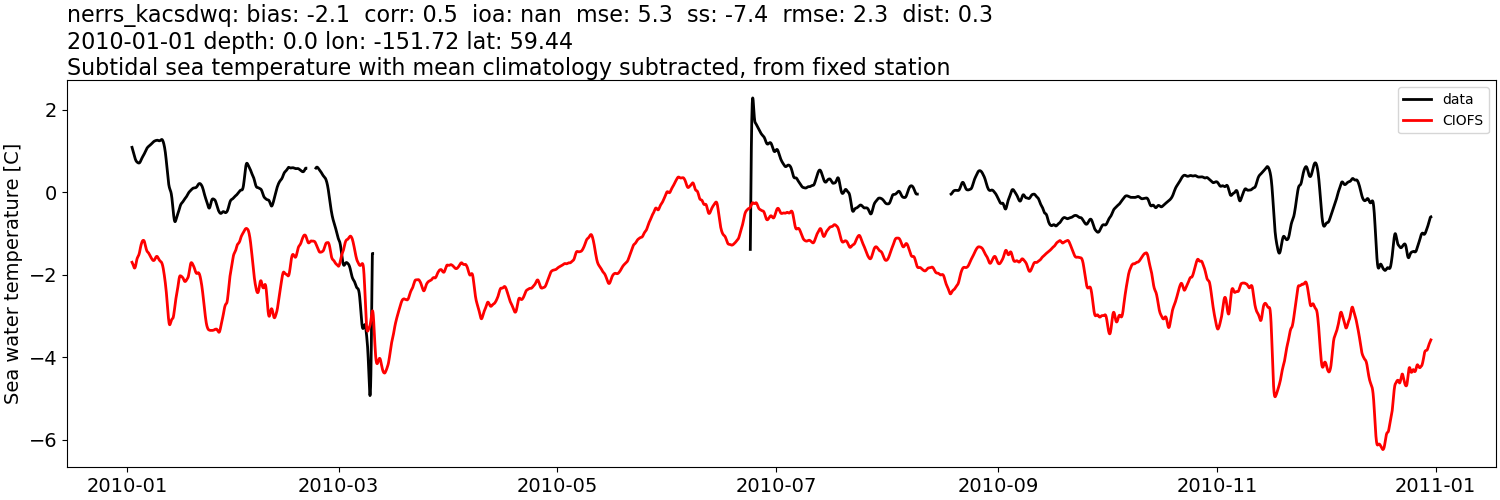
2010
2011
2012
2013
2014
2015
2016
2017
2018
2019
2020
2021
2022
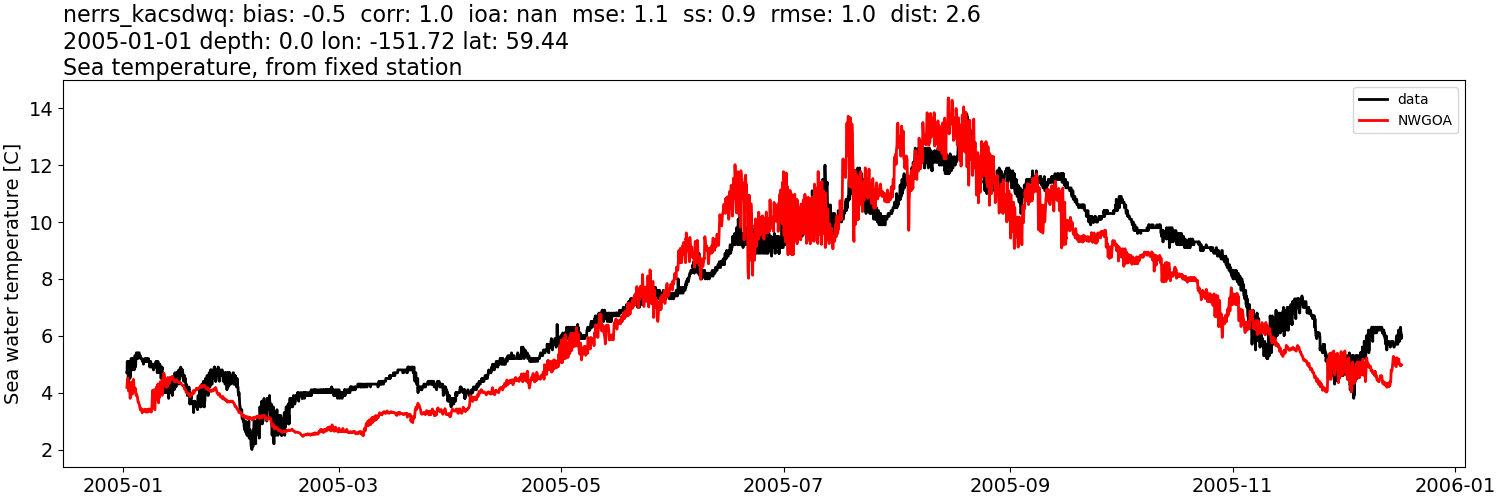
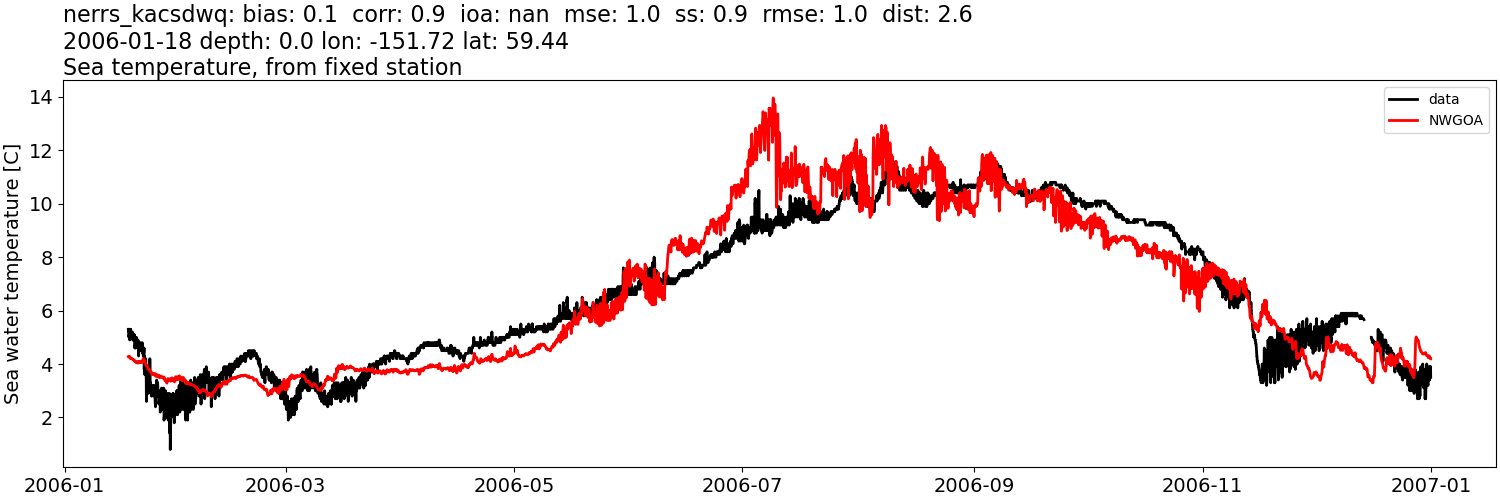
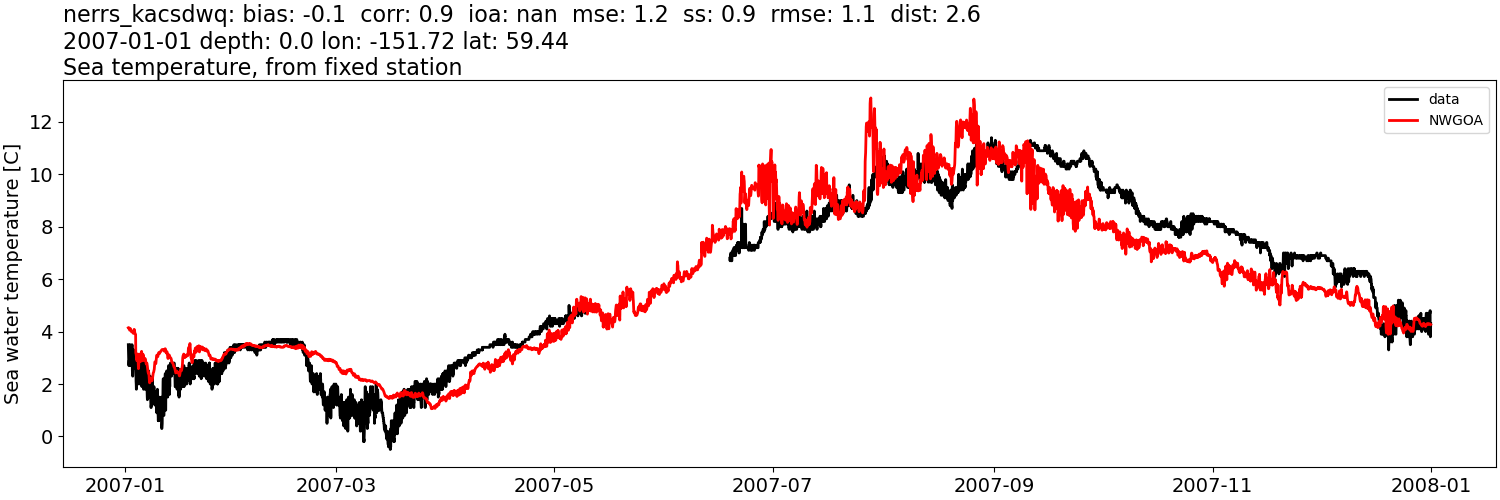
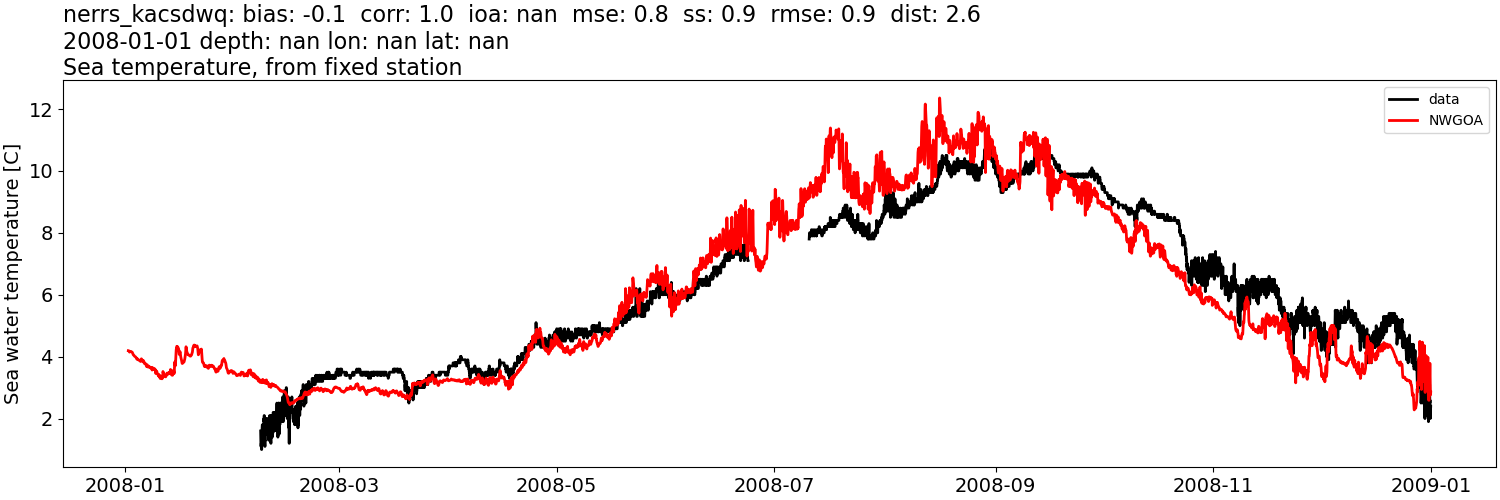
NWGOA#
Comparison plots by year
2004
2005
2006
2007
2008
Sea water salinity: tidally-filtered#
CIOFS#
Comparison plots by year
2004
2005
2006
2007
2008
2009
2010
2011
2012
2013
2014
2015
2016
2017
2018
2019
2020
2021
2022
NWGOA#
Comparison plots by year
2004
2005
2006
2007
2008
Sea water salinity: tidally-filtered, then monthly mean from data subtracted#
CIOFS#
Comparison plots by year
2004
2005
2006
2007
2008
2009
2010
2011
2012
2013
2014
2015
2016
2017
2018
2019
2020
2021
2022
NWGOA#
Comparison plots by year
2004
2005
2006
2007
2008
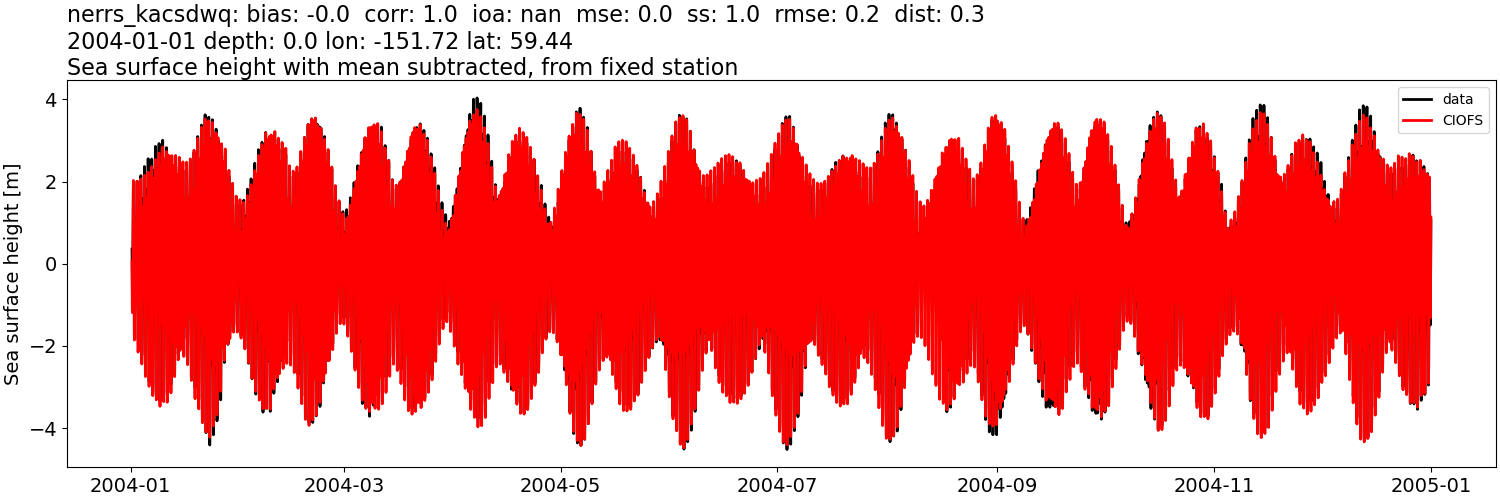
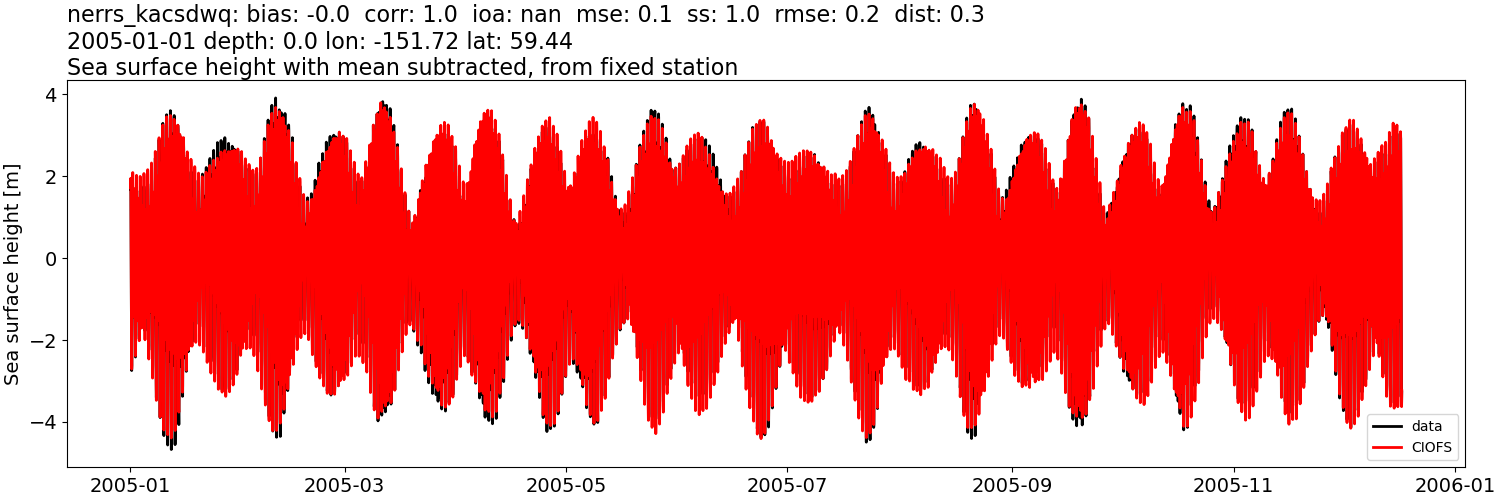
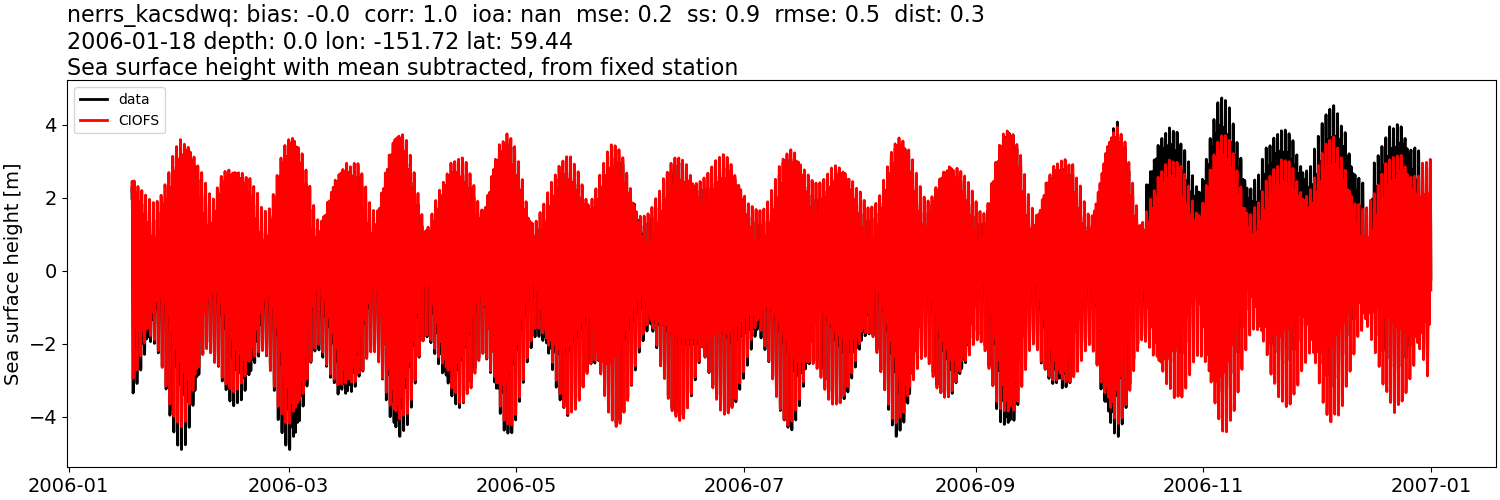
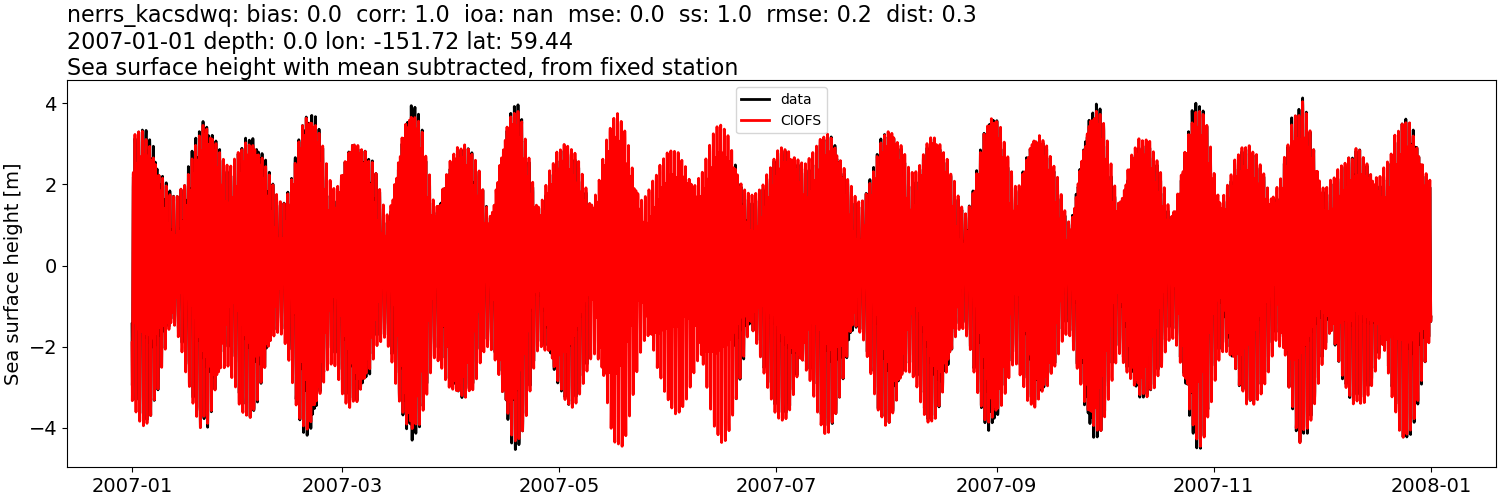
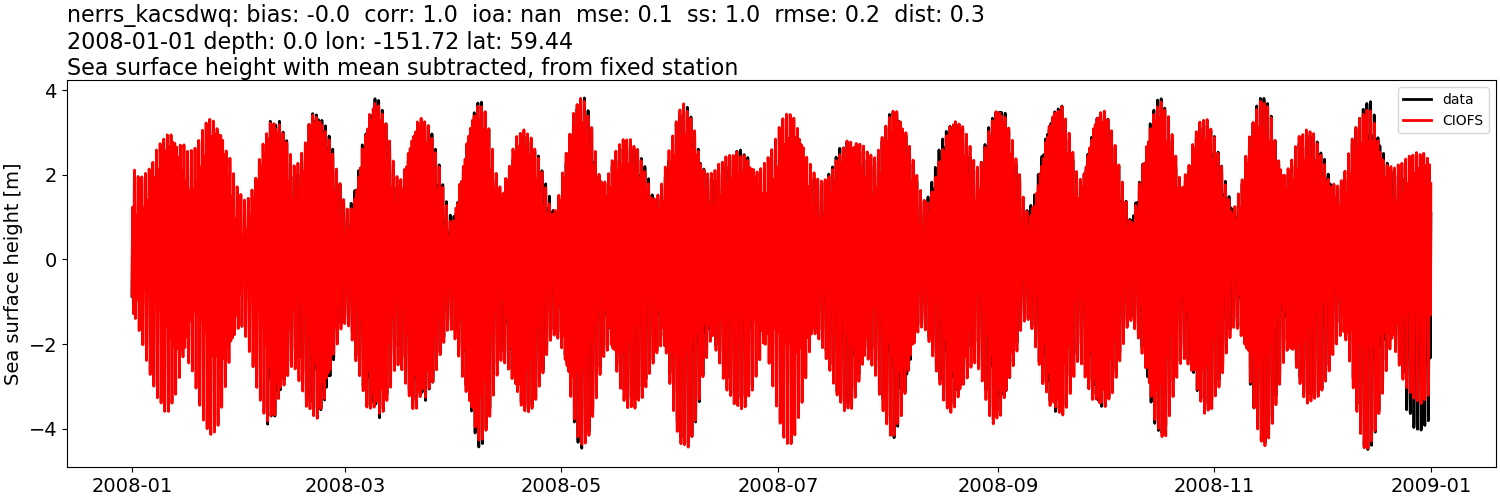
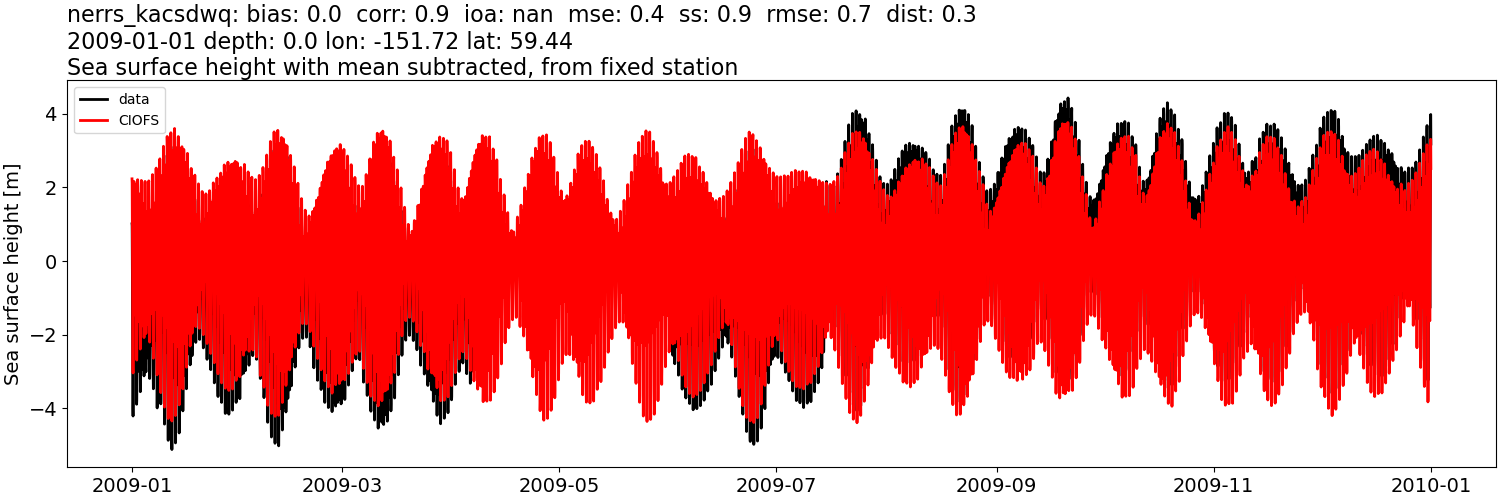
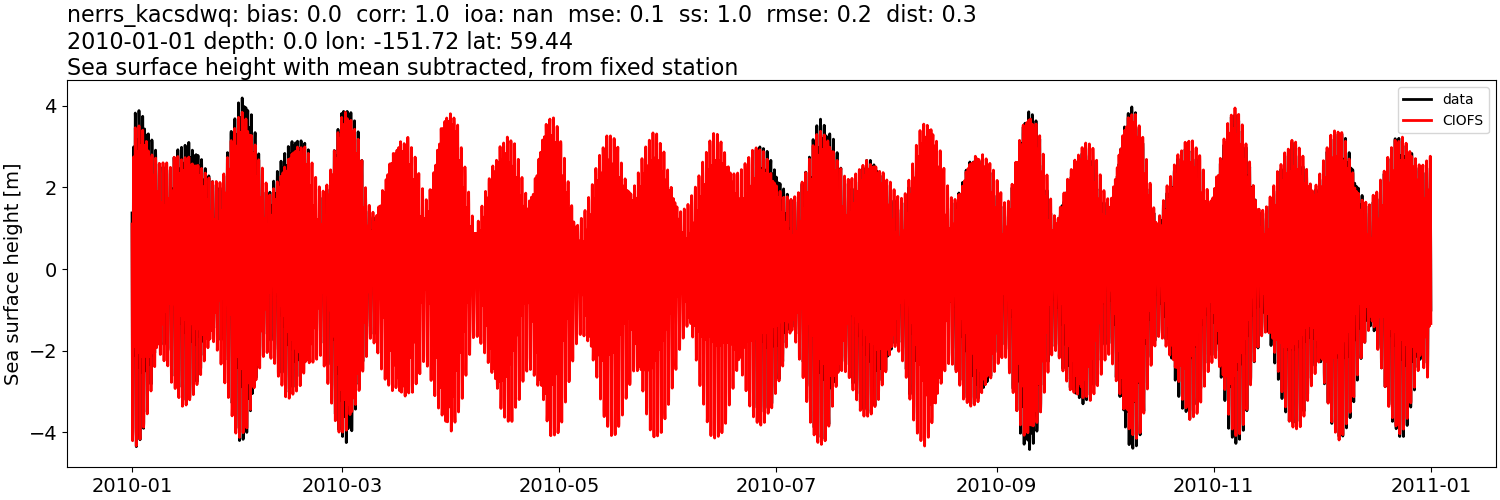
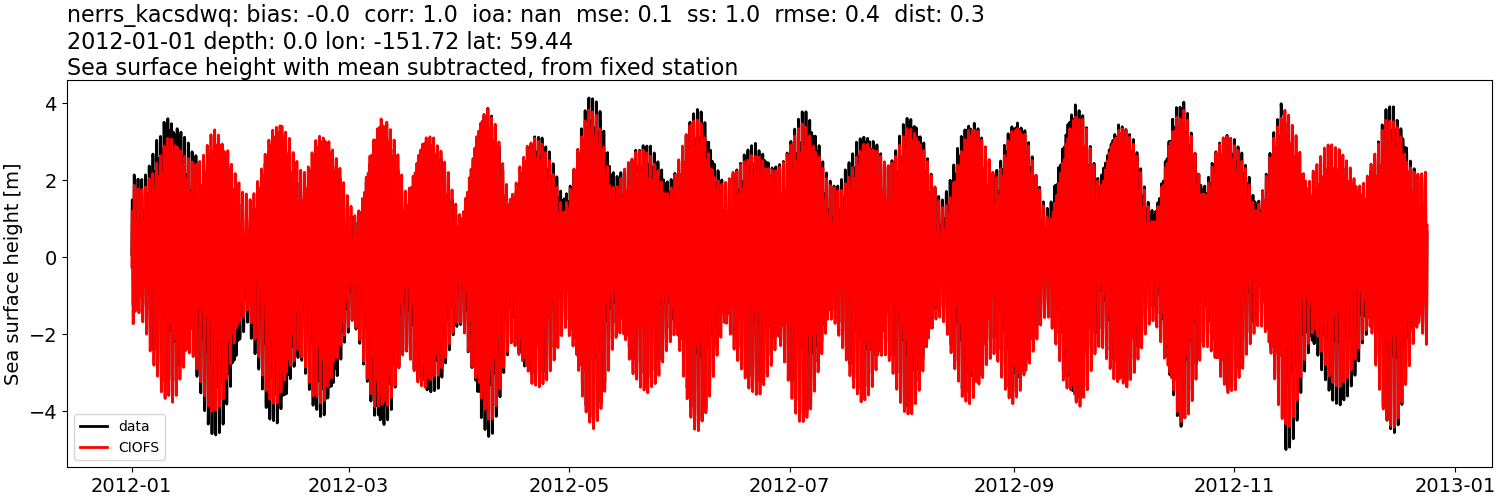
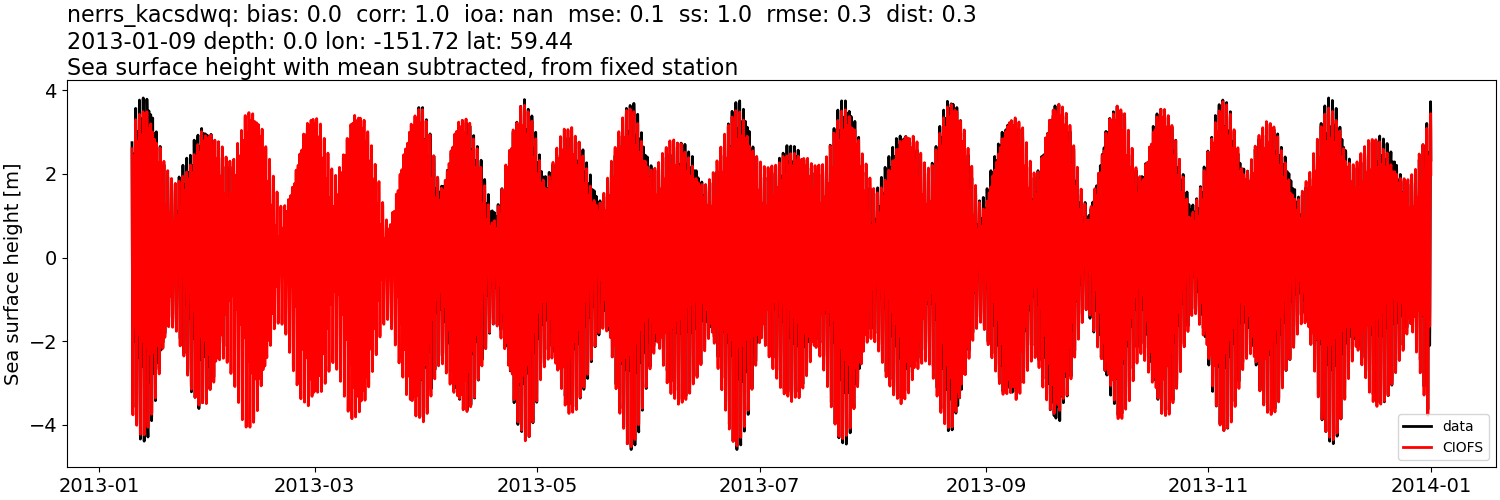
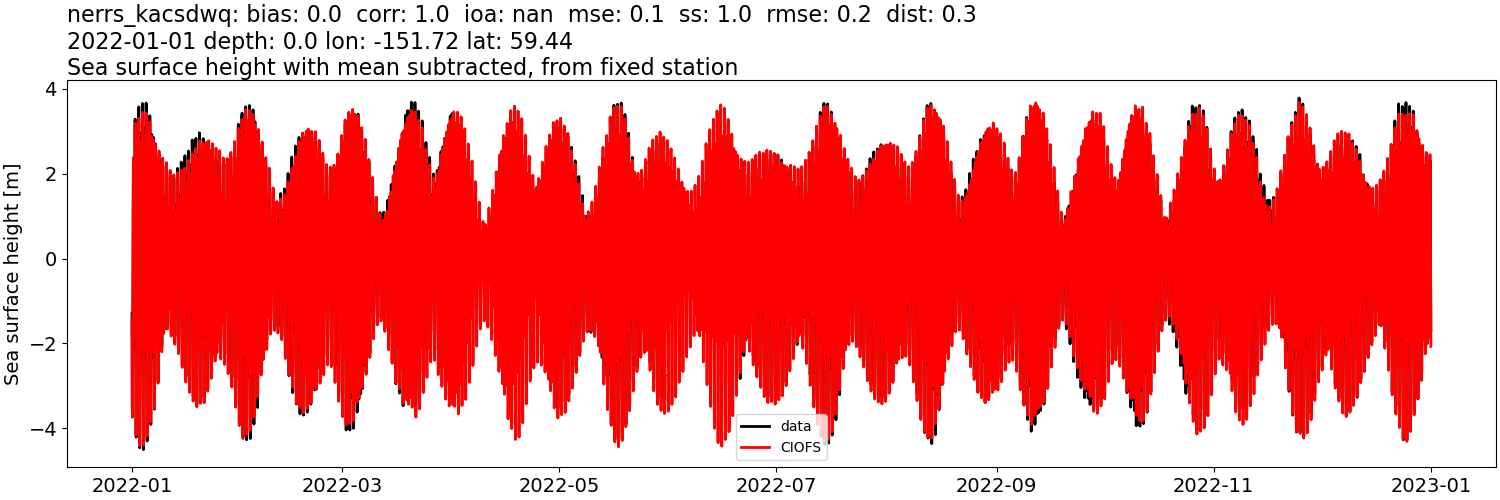
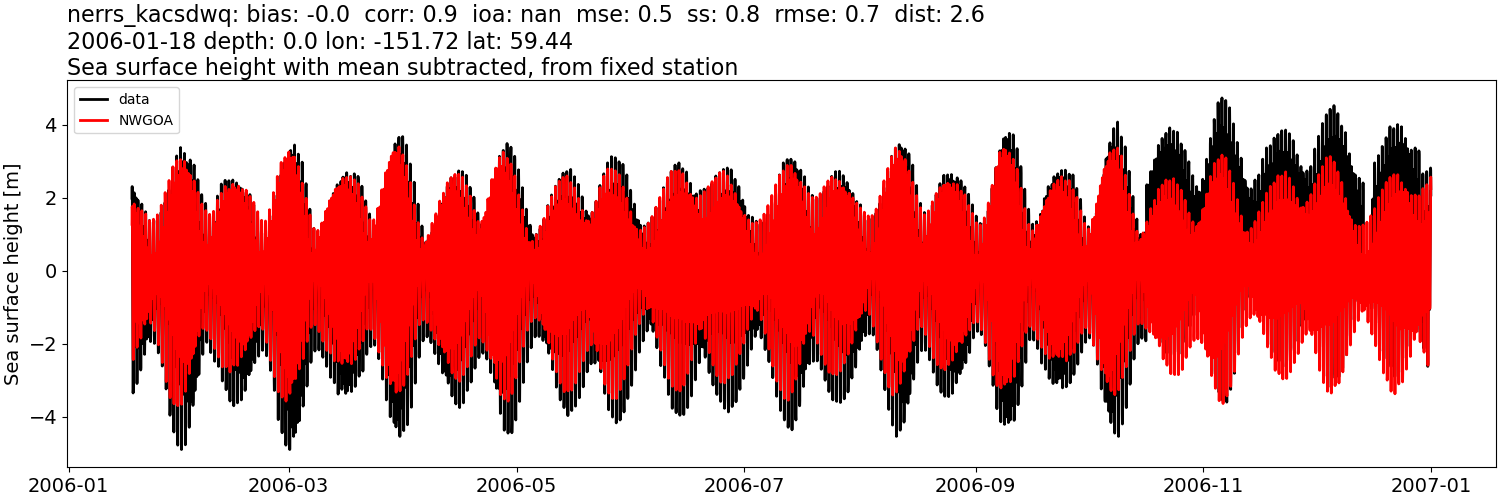
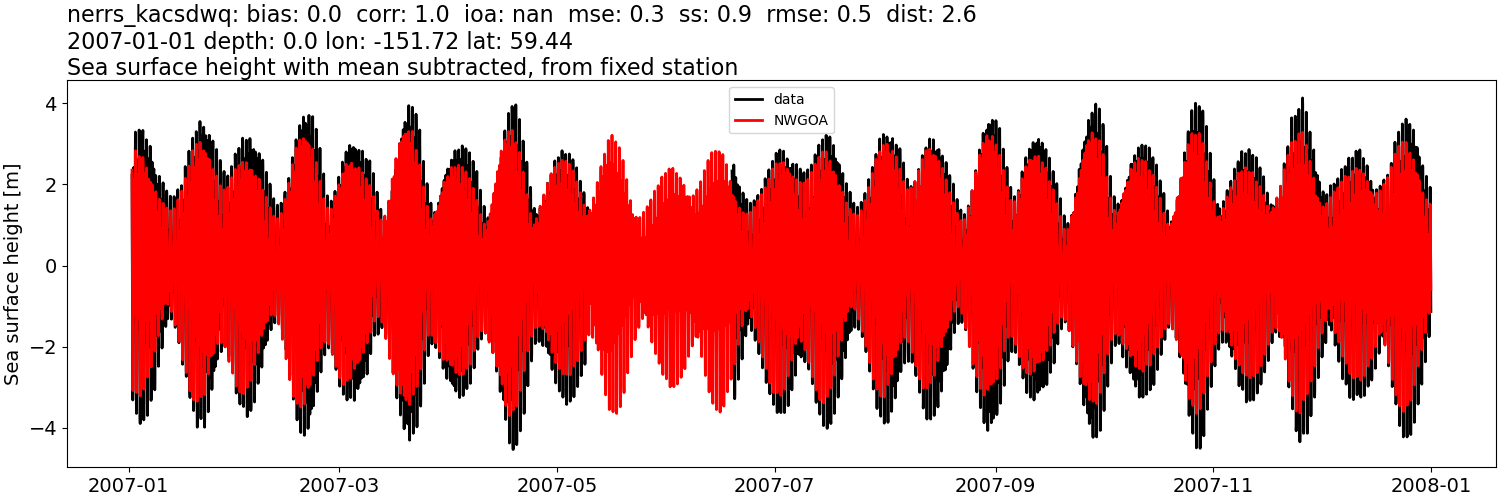
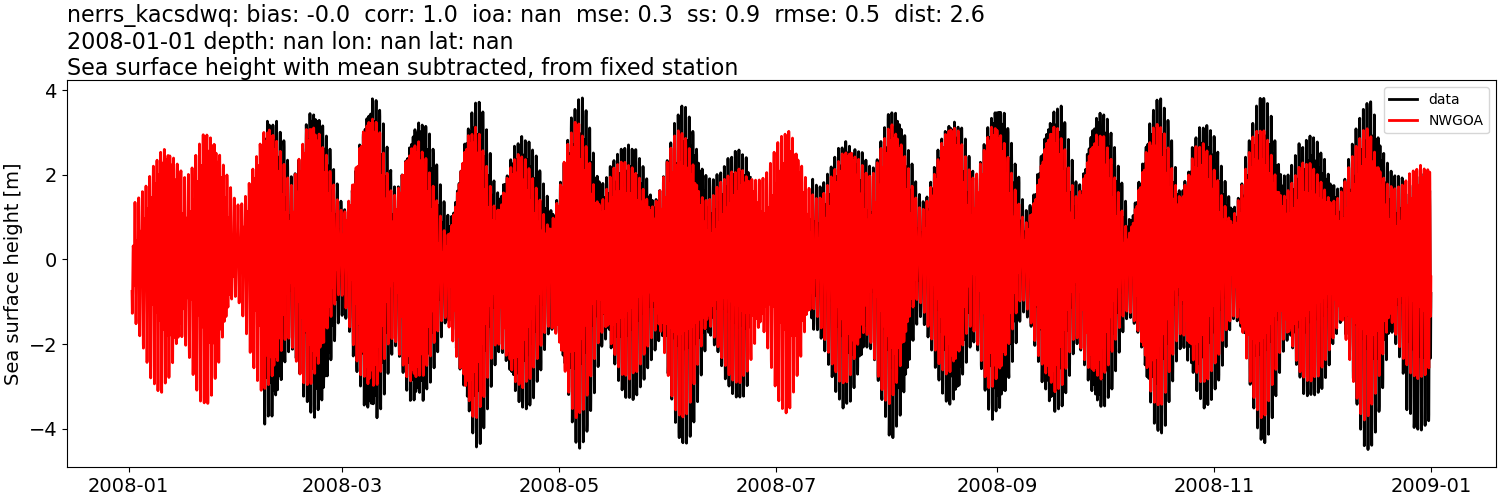
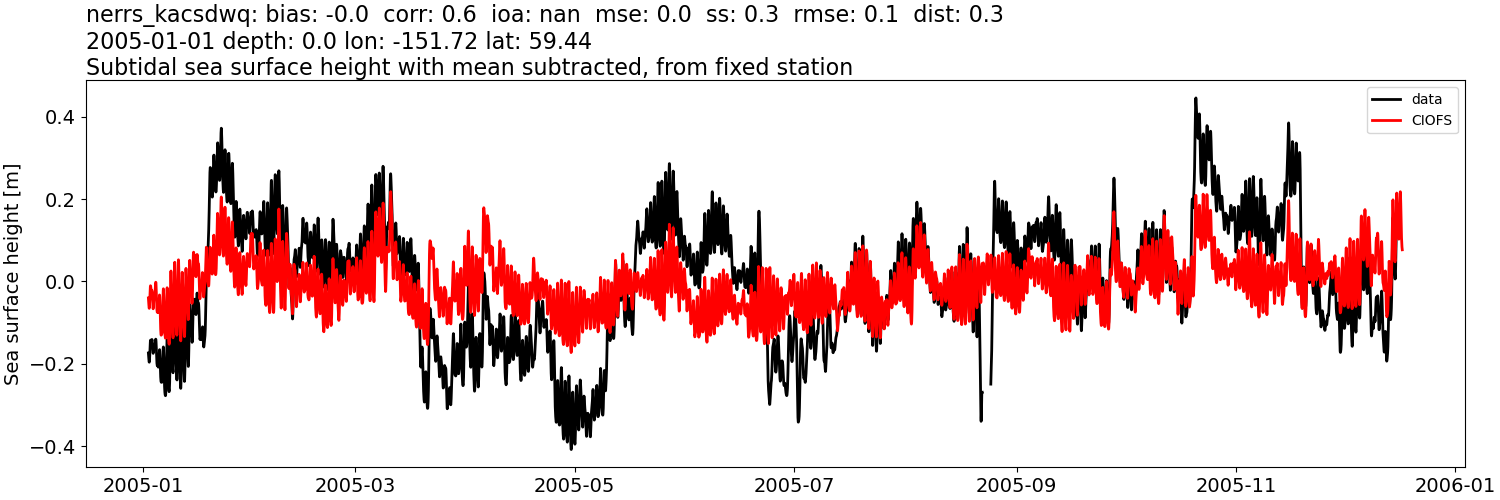
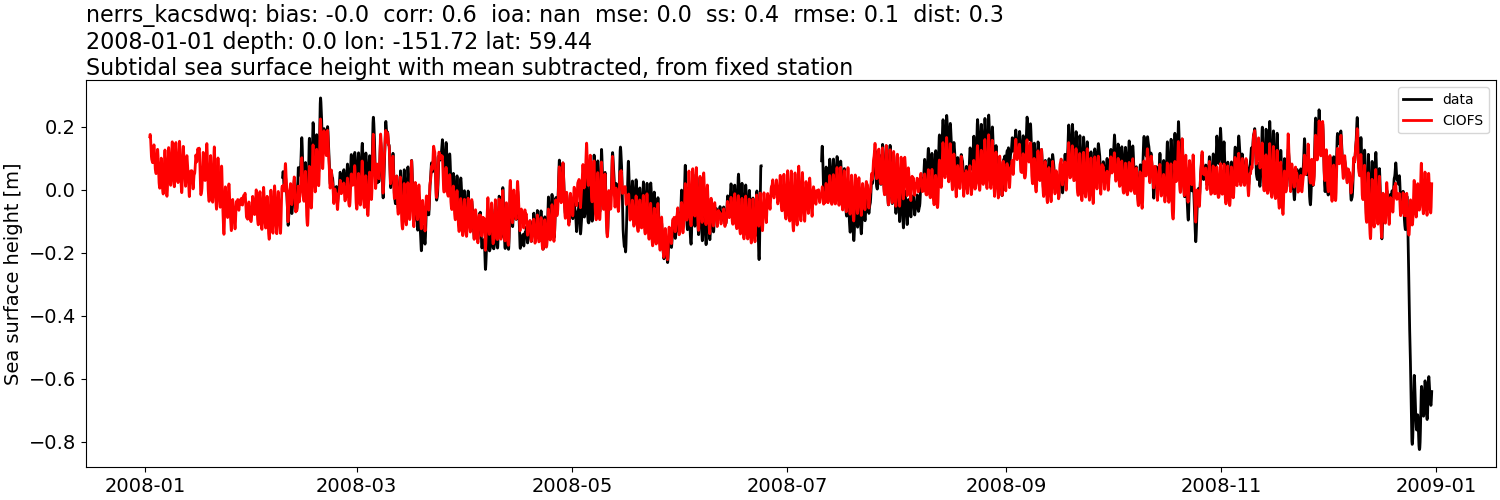
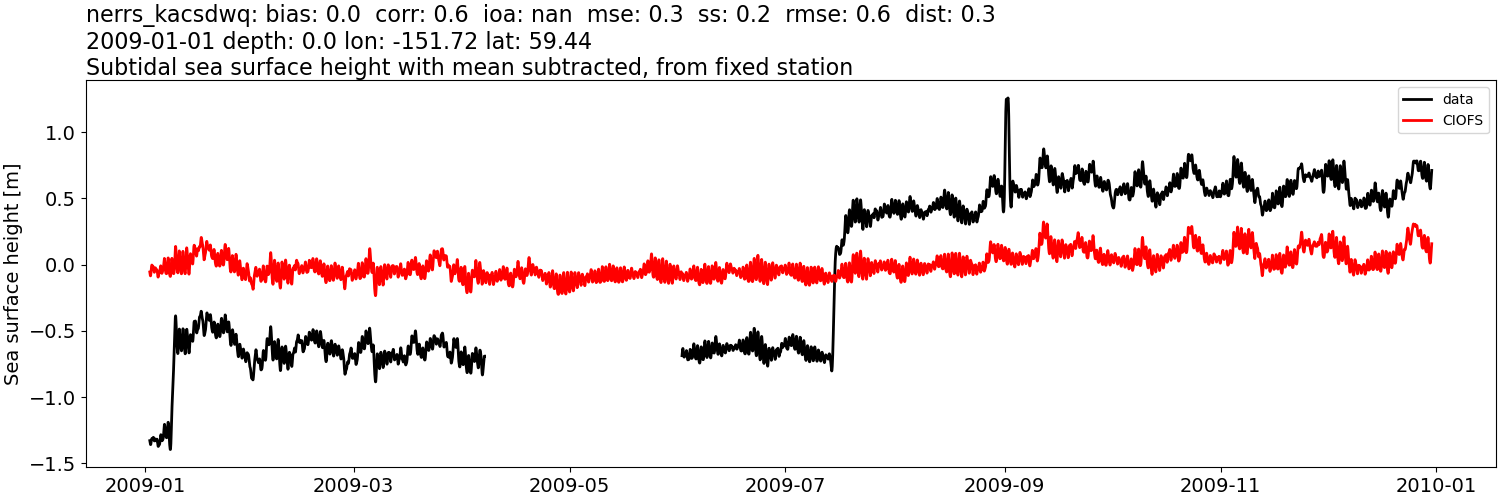
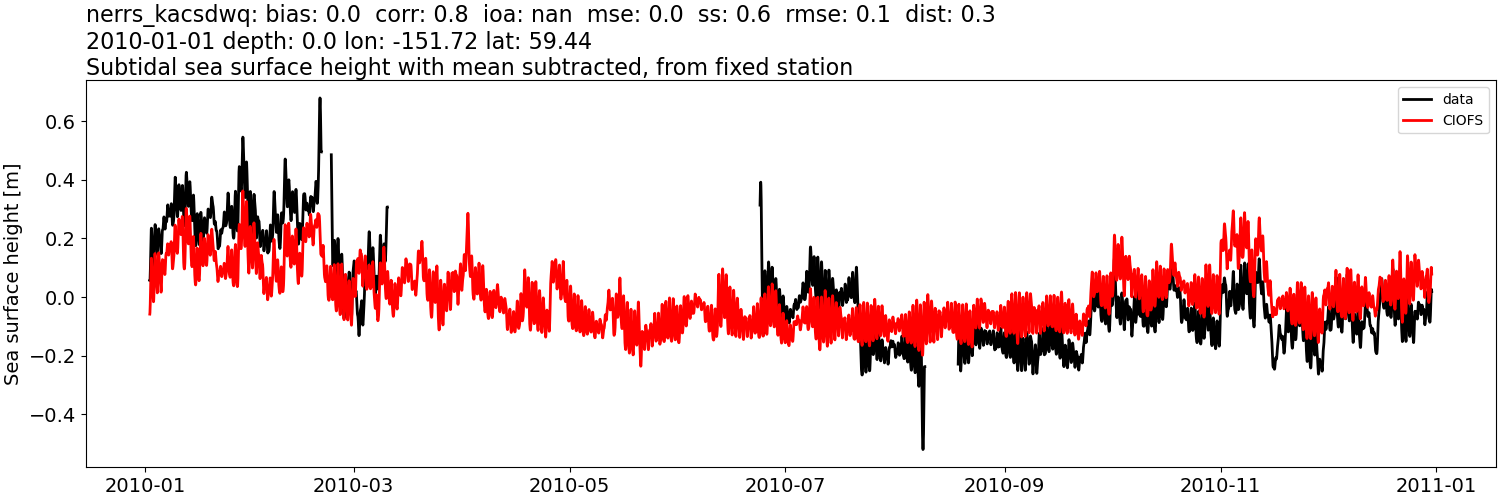
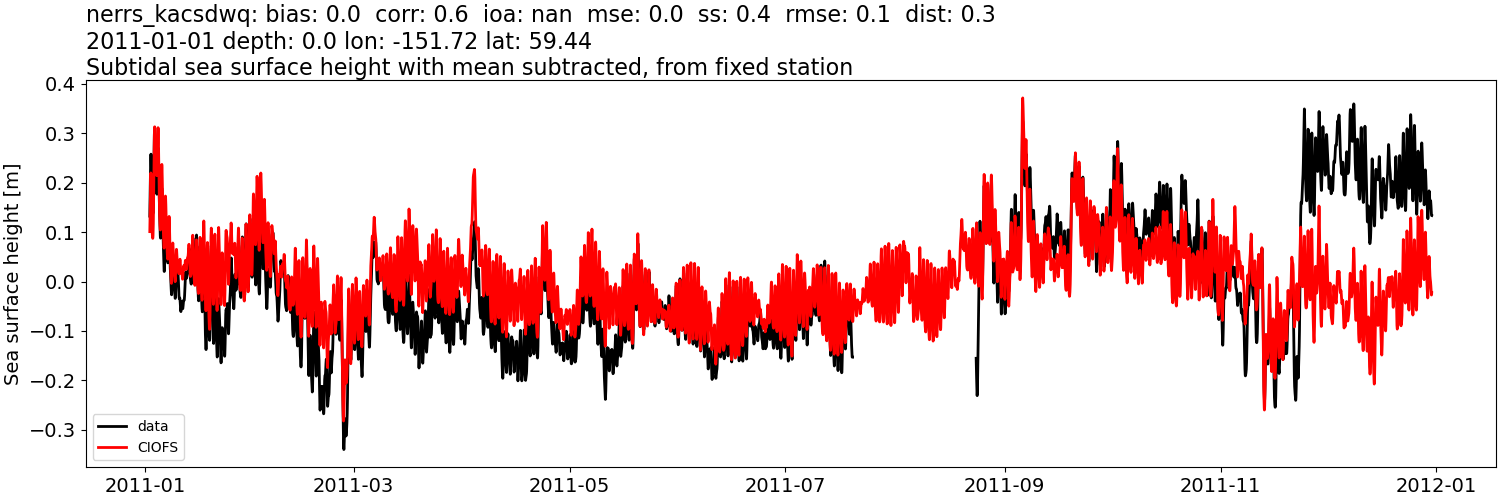
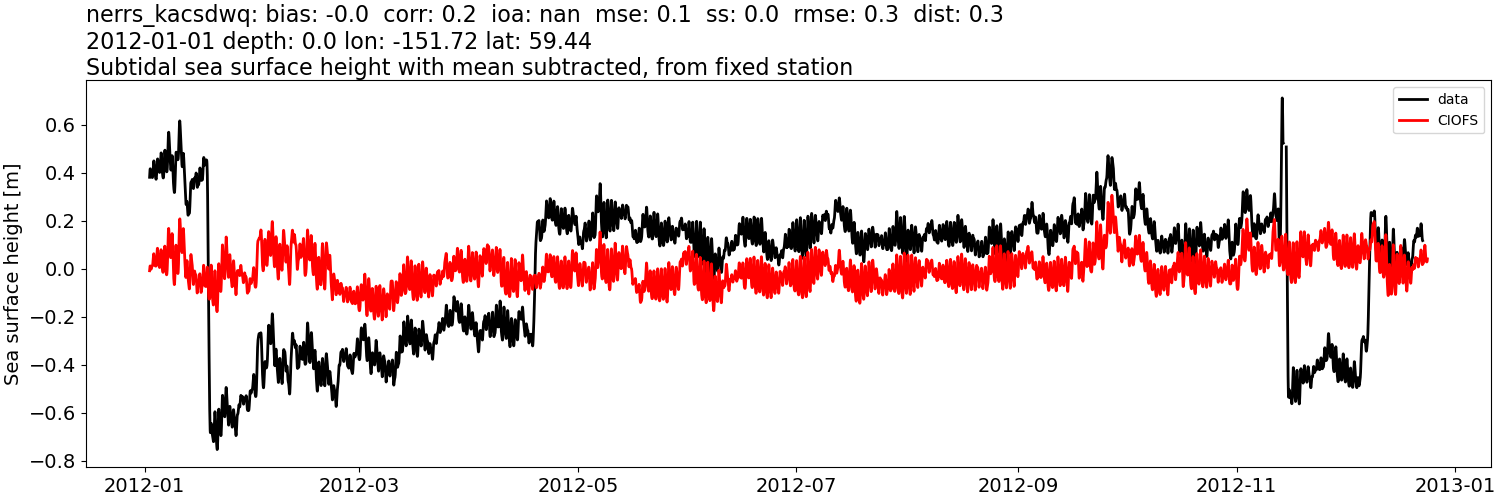
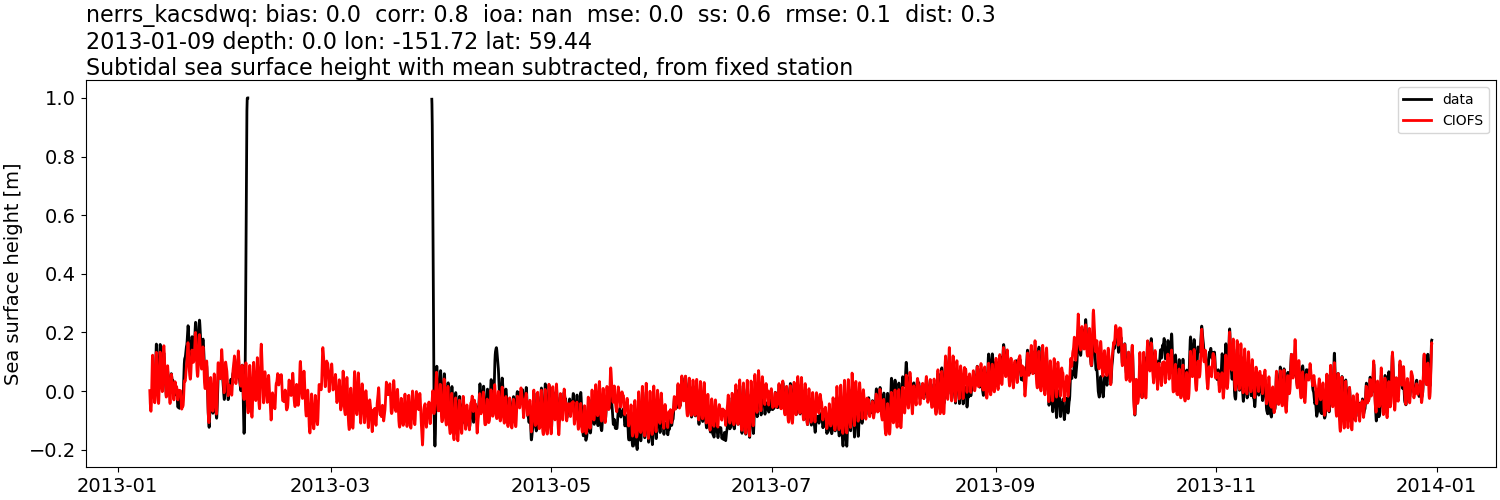
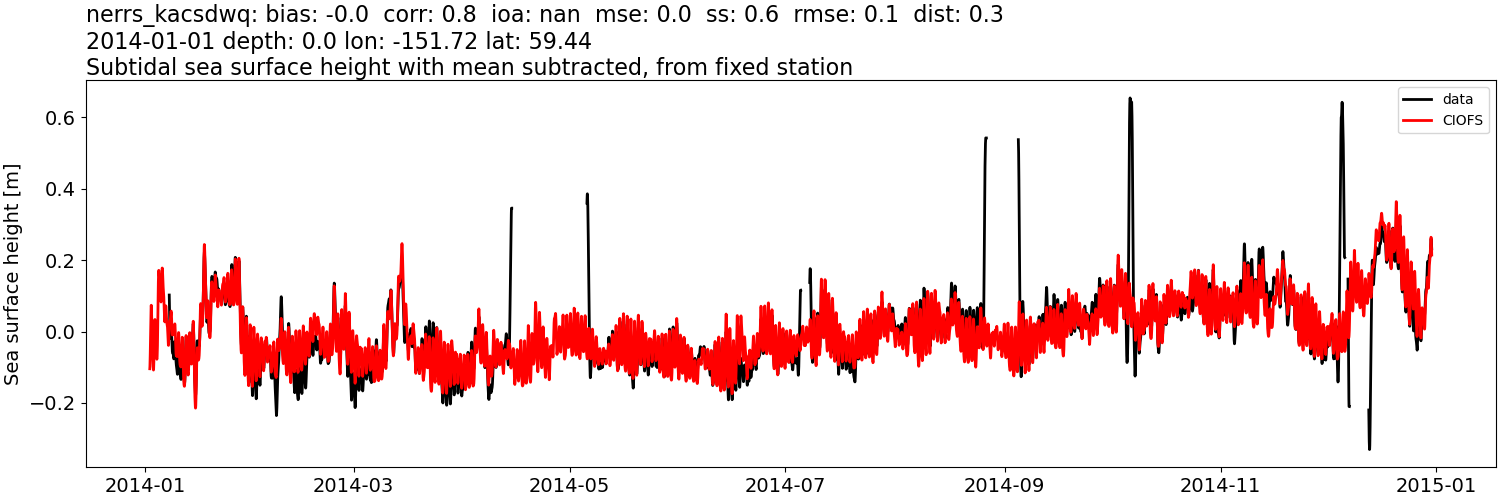
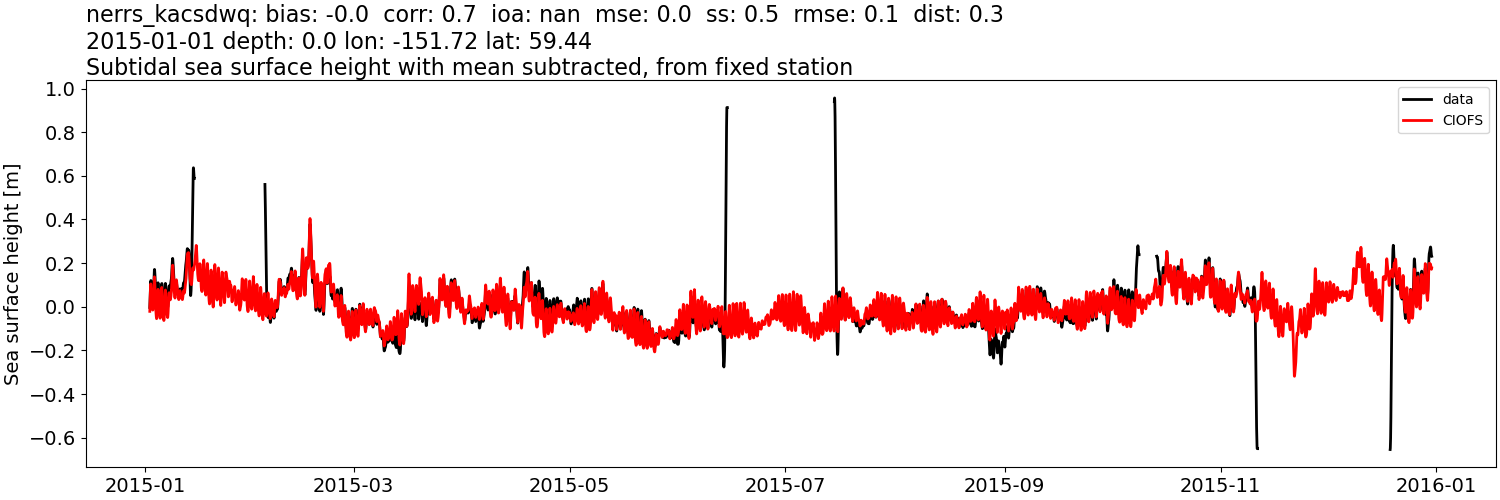
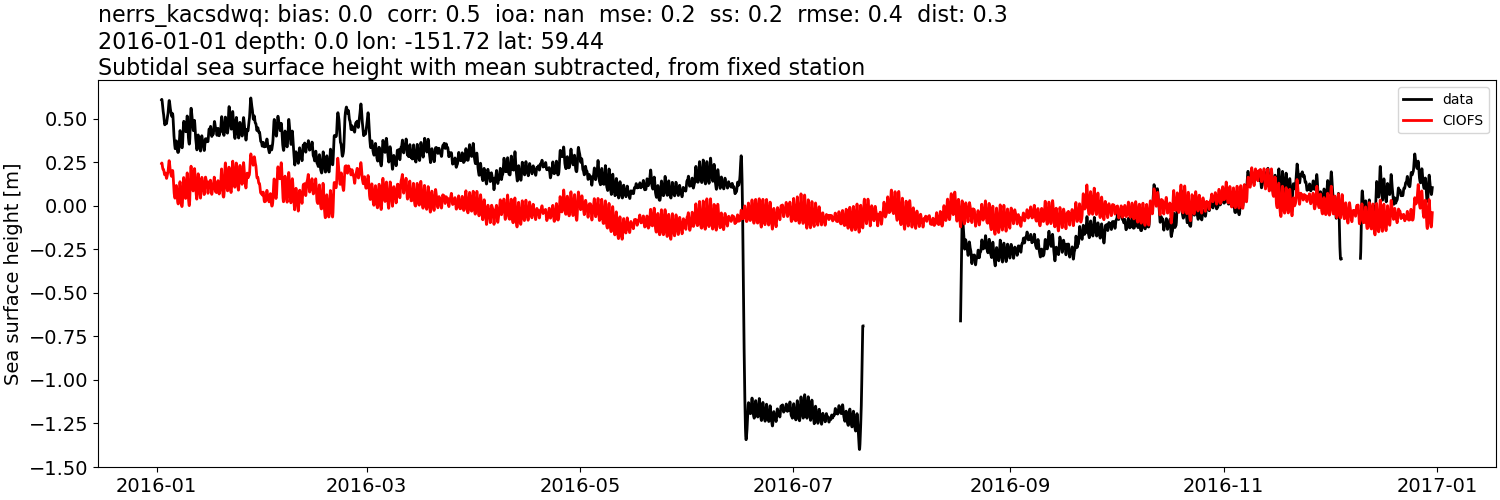
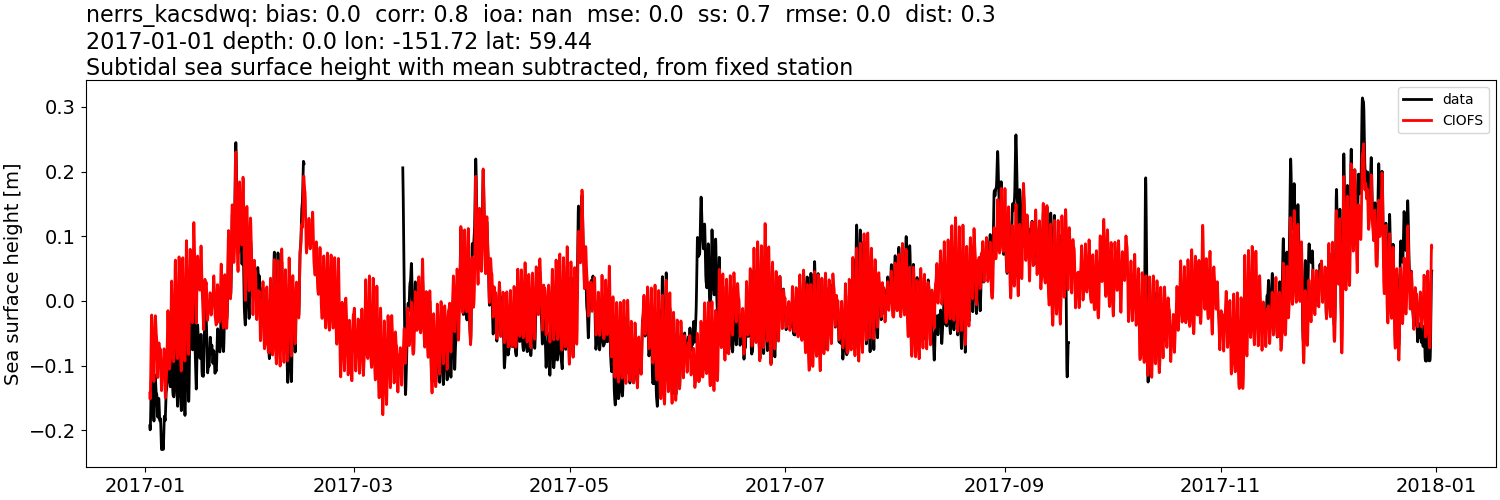
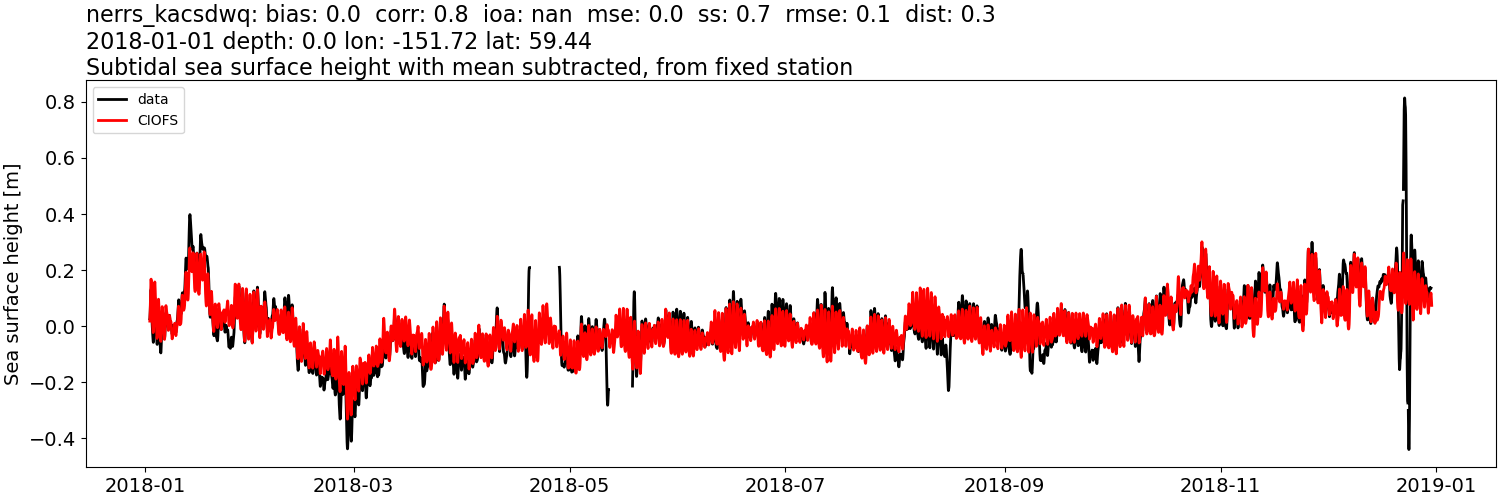
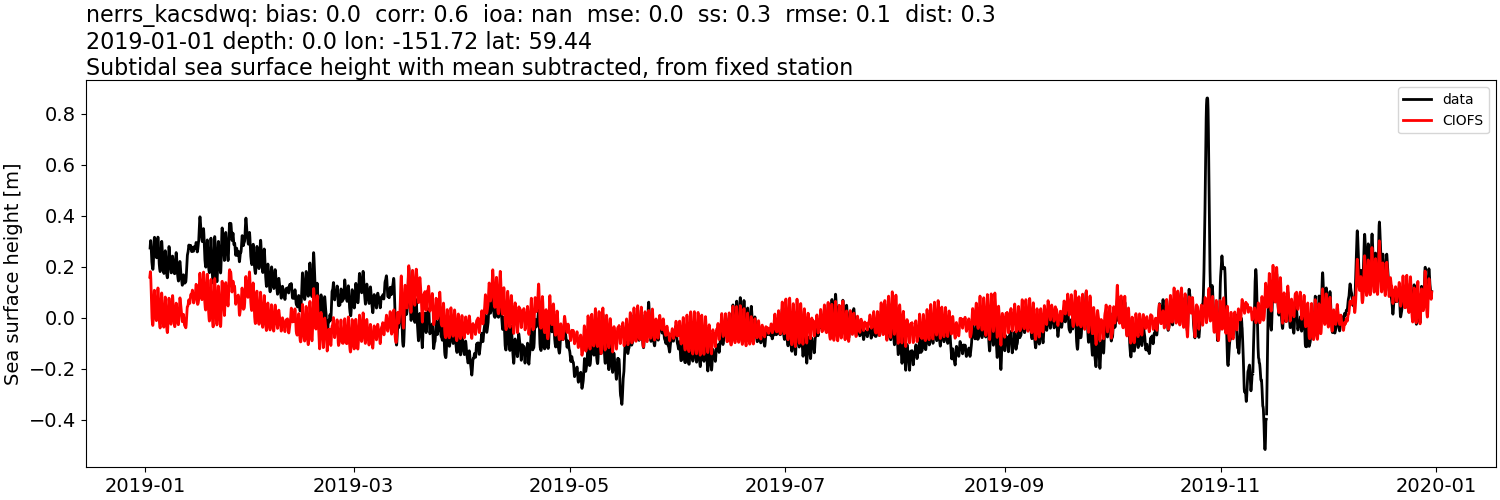
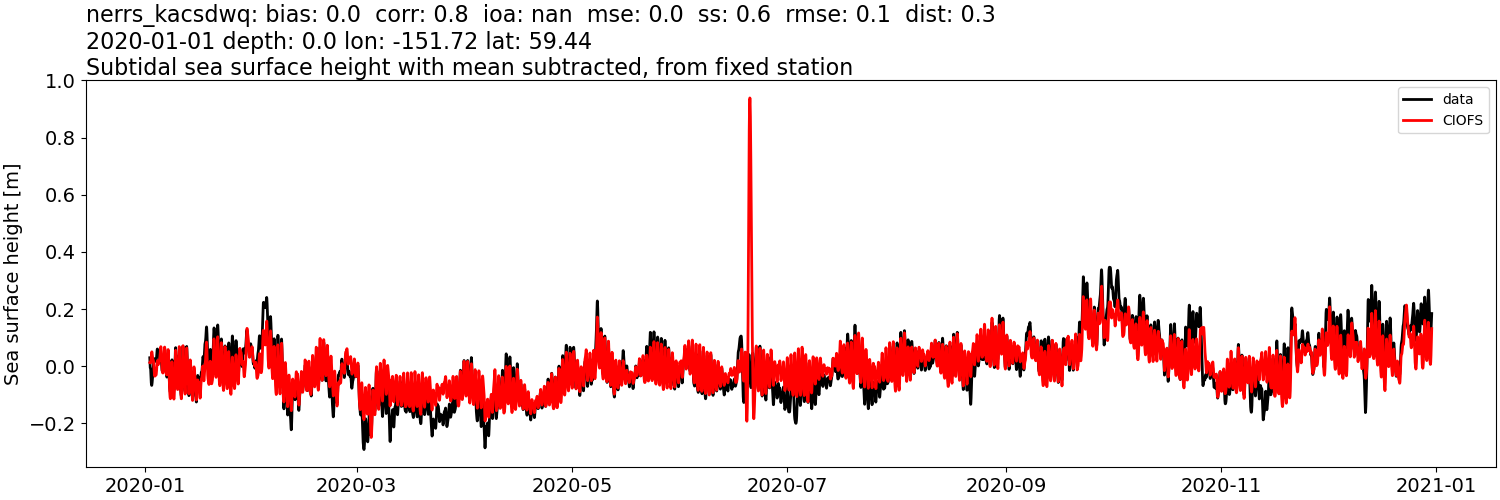
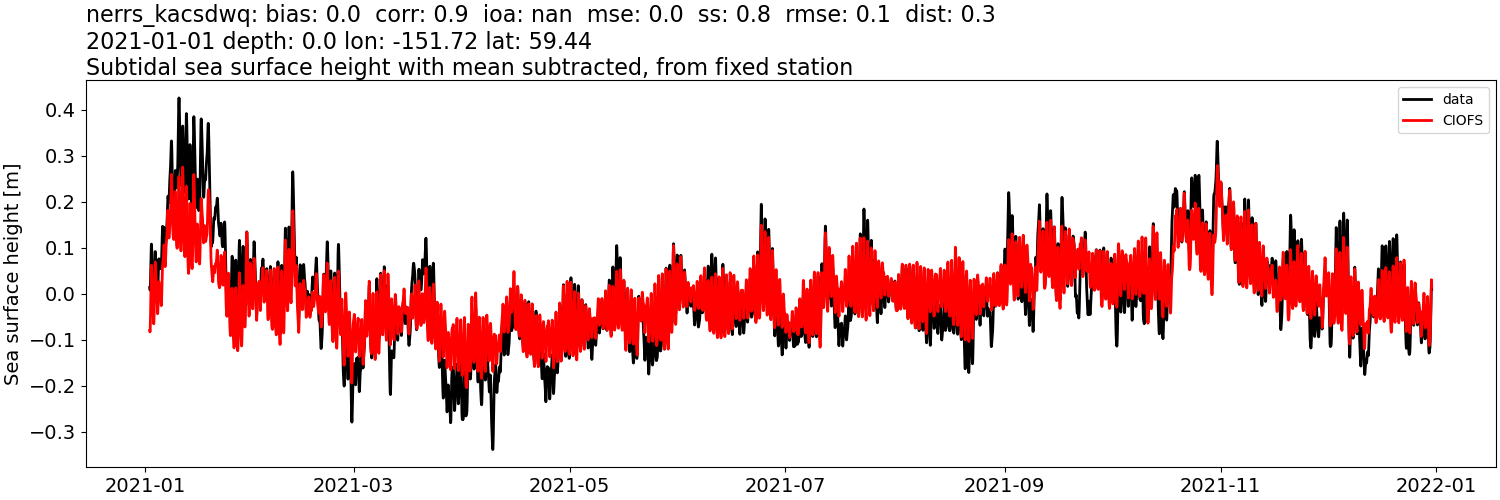
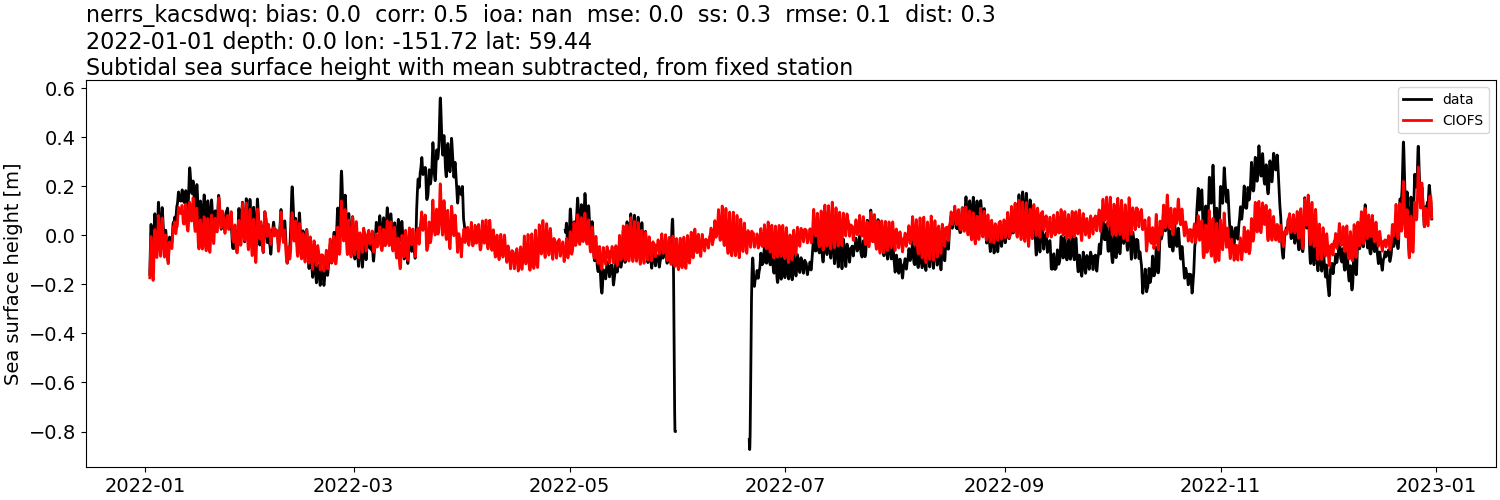
Sea surface height: mean subtracted#
CIOFS#
Comparison plots by year
2004
2005
2006
2007
2008
2009
2010
2011

2012
2013
2014
2015

2016
2017

2018

2019
2020
2021
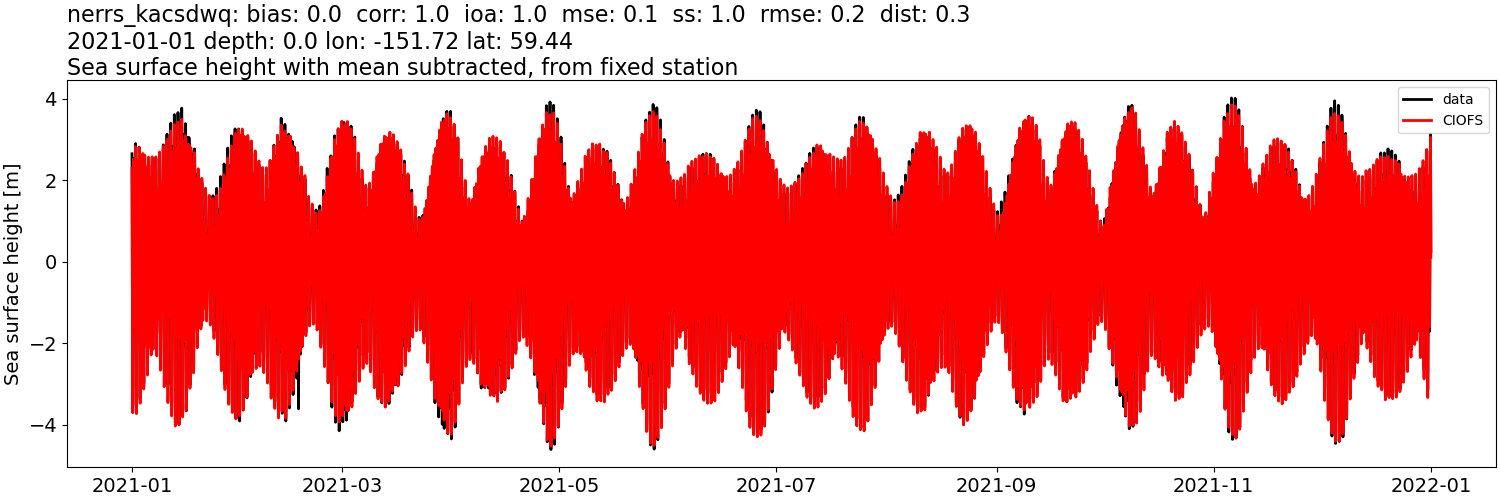
2022
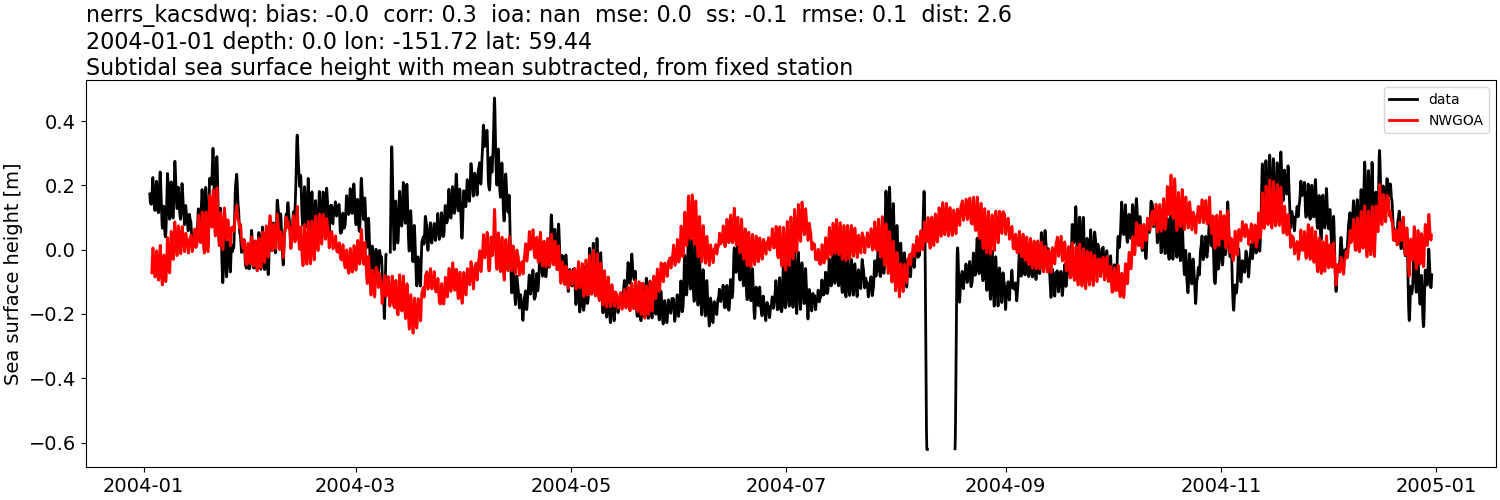
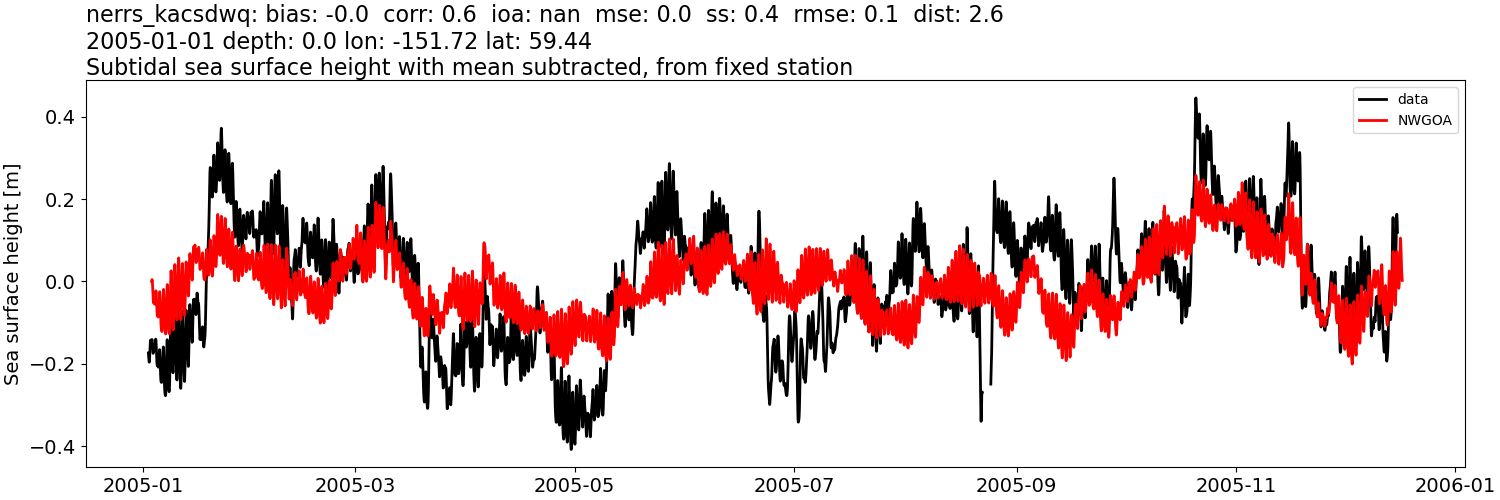
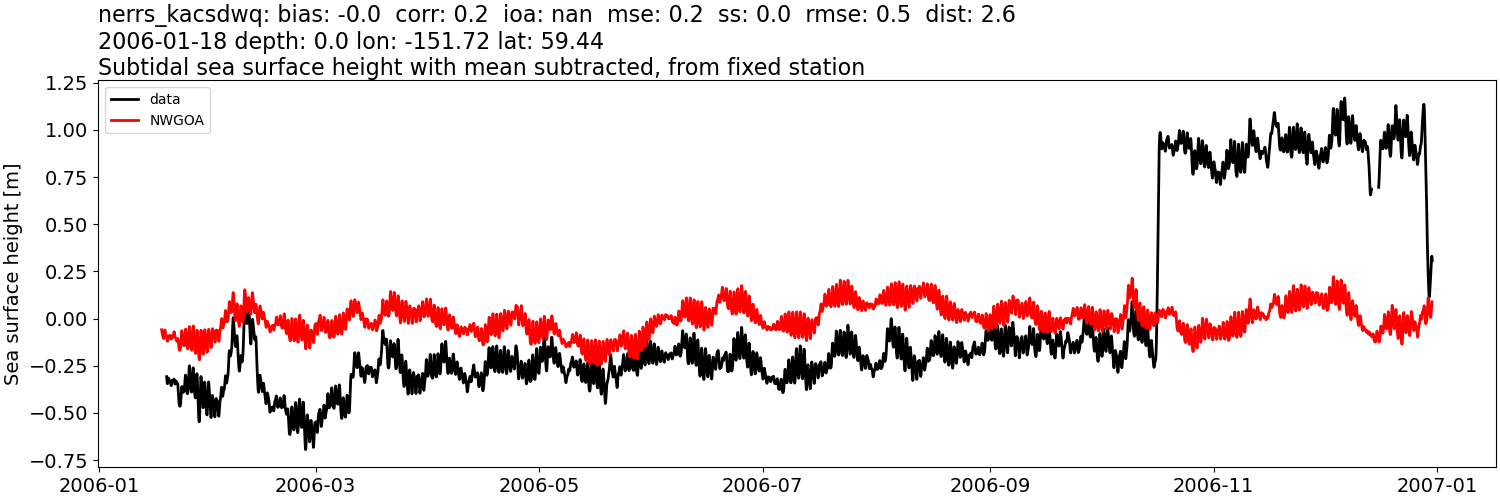
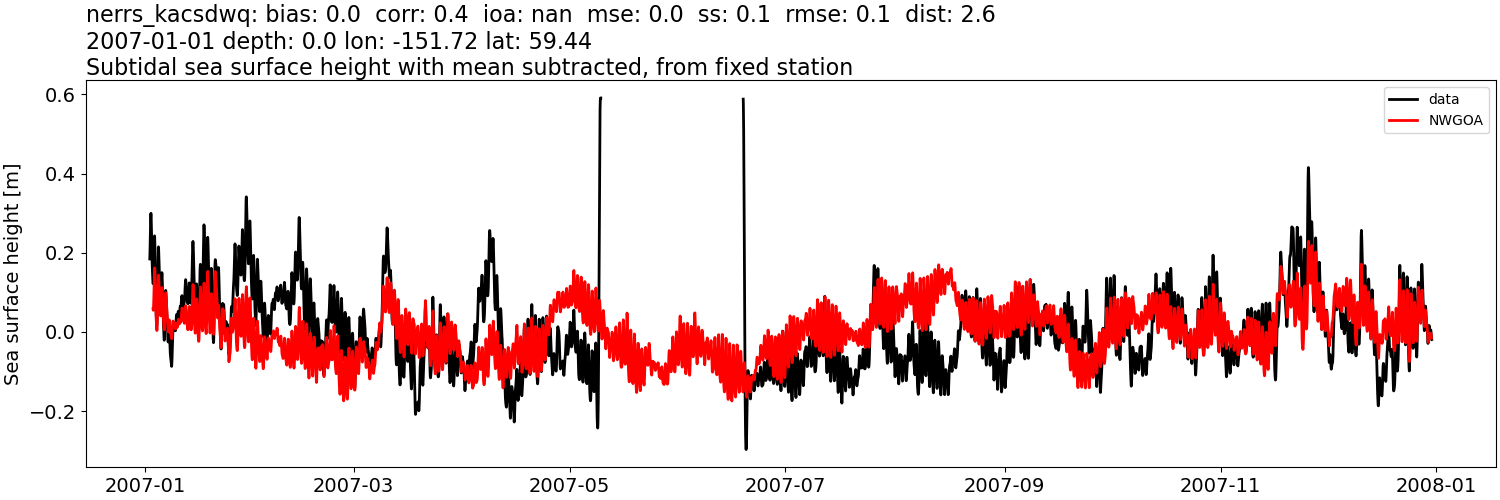
NWGOA#
Comparison plots by year
2004
2005
2006
2007
2008
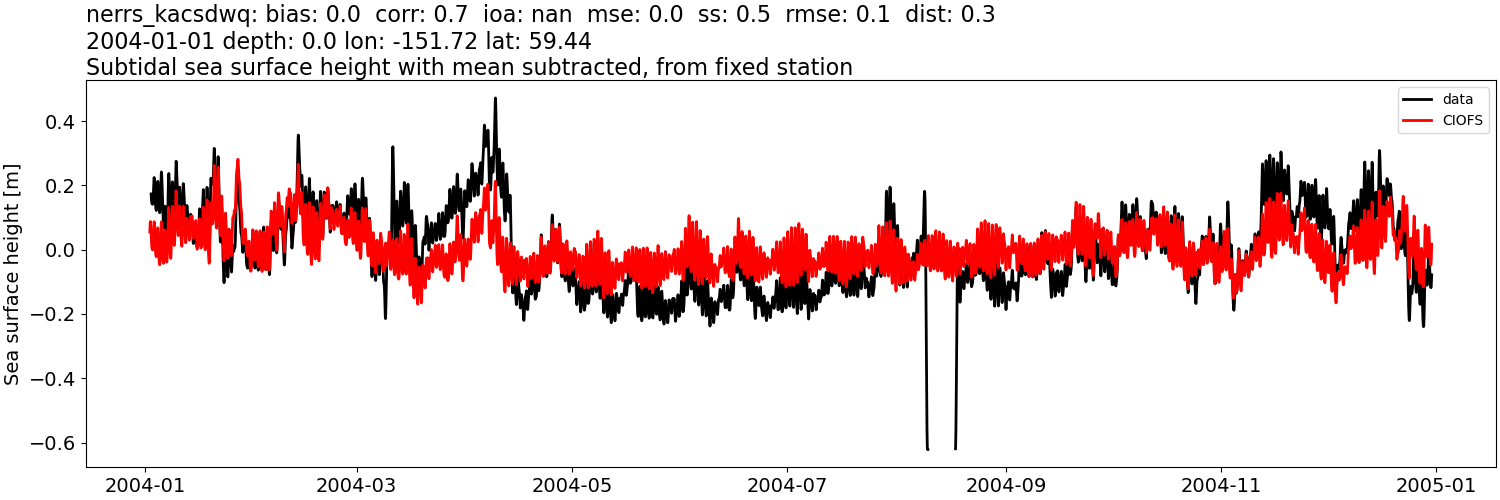
Sea surface height: mean subtracted, then tidally-filtered#
CIOFS#
Comparison plots by year
2004
2005
2006

2007

2008
2009
2010
2011
2012
2013
2014
2015
2016
2017
2018
2019
2020
2021
2022
NWGOA#
Comparison plots by year
2004
2005
2006
2007
2008

Sea water temperature:#
CIOFS#
Comparison plots by year
2004
2005
2006
2007
2008
2009
2010
2011
2012
2013
2014
2015
2016
2017
2018
2019
2020
2021
2022
NWGOA#
Comparison plots by year
2004
2005
2006
2007
2008
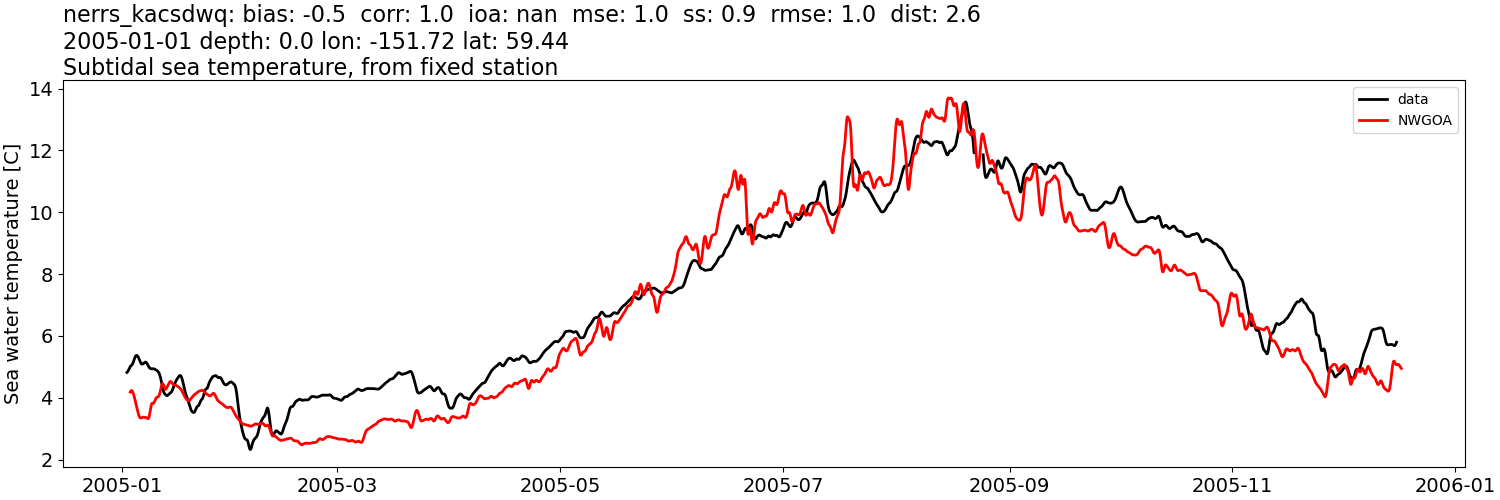
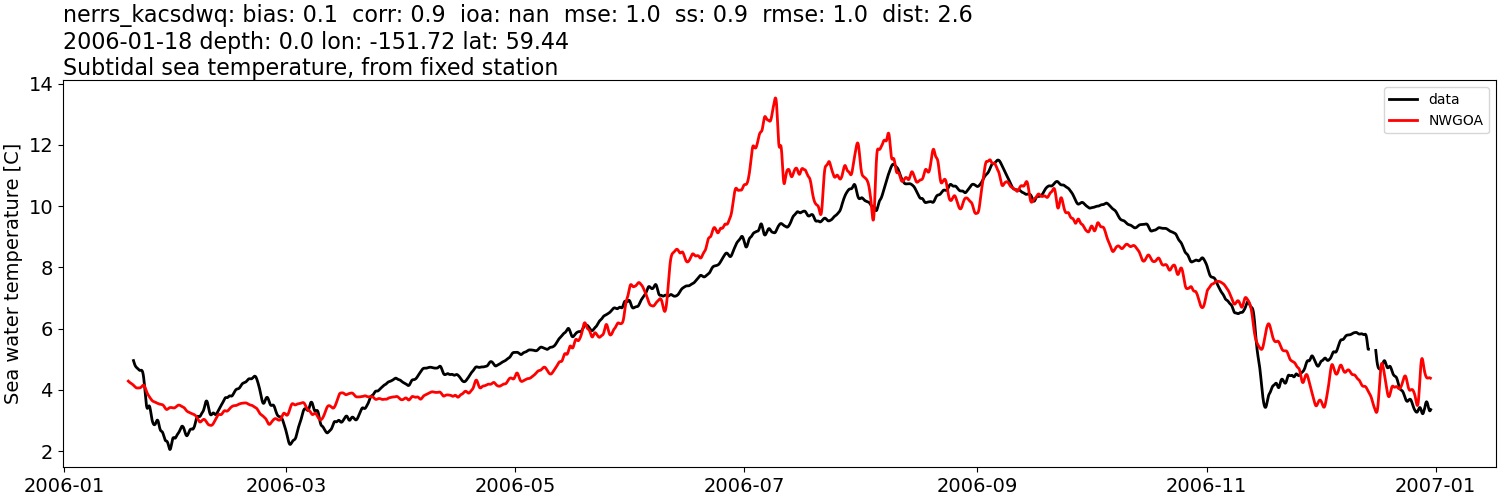
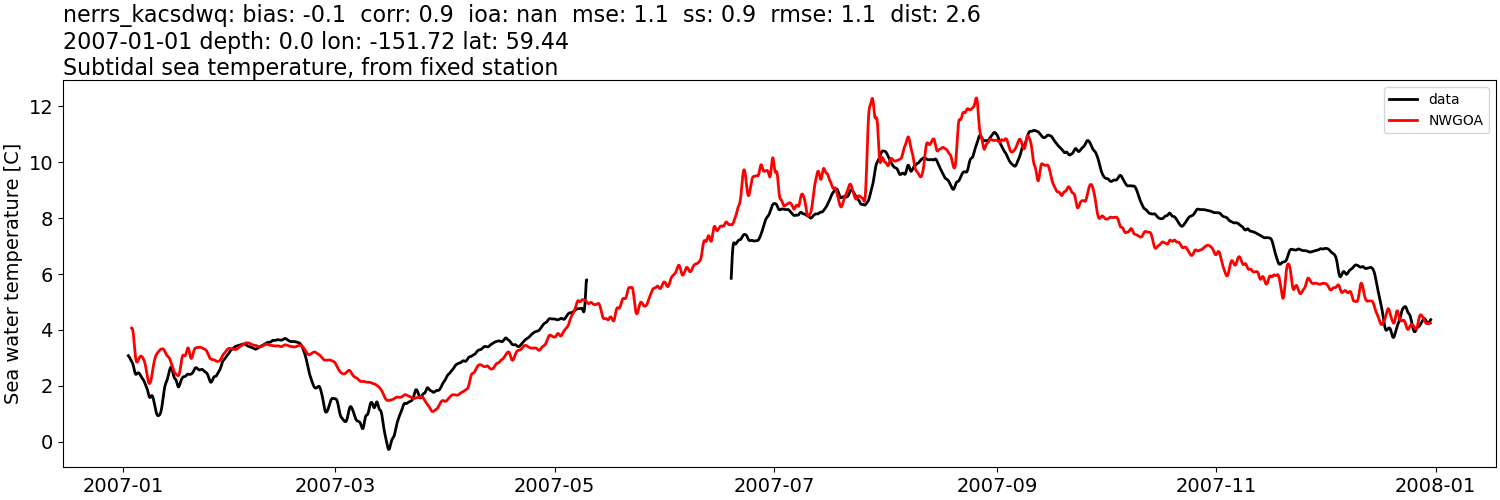
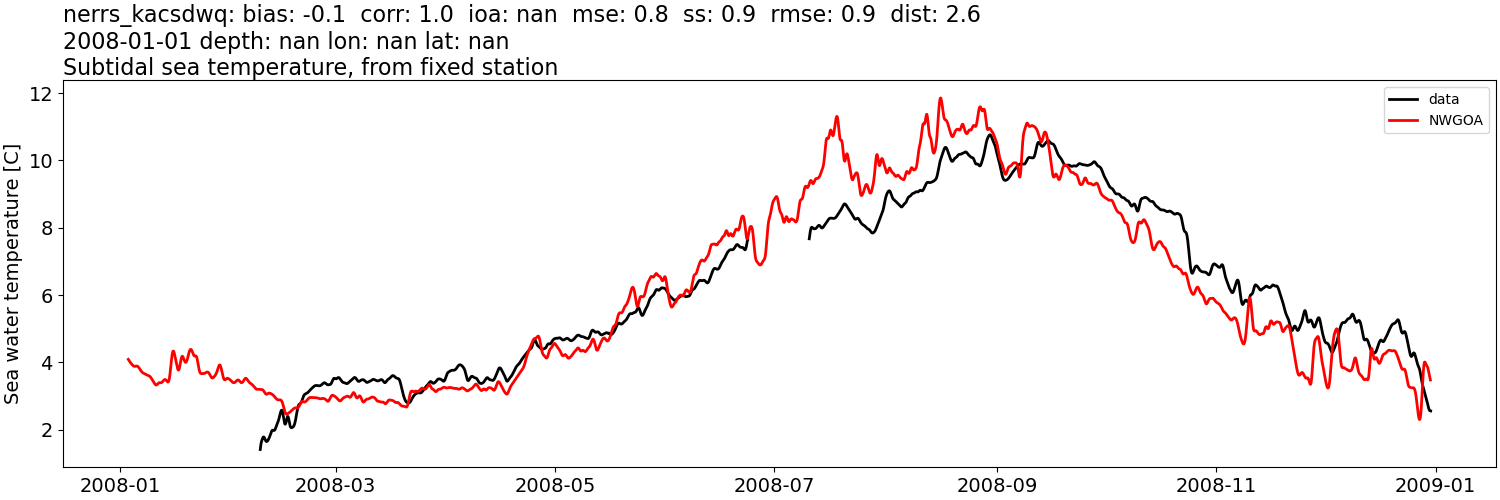
Sea water temperature: tidally-filtered#
CIOFS#
Comparison plots by year
2004
2005
2006
2007
2008
2009
2010
2011
2012
2013
2014
2015
2016
2017
2018
2019
2020
2021
2022
NWGOA#
Comparison plots by year
2004
2005
2006
2007
2008
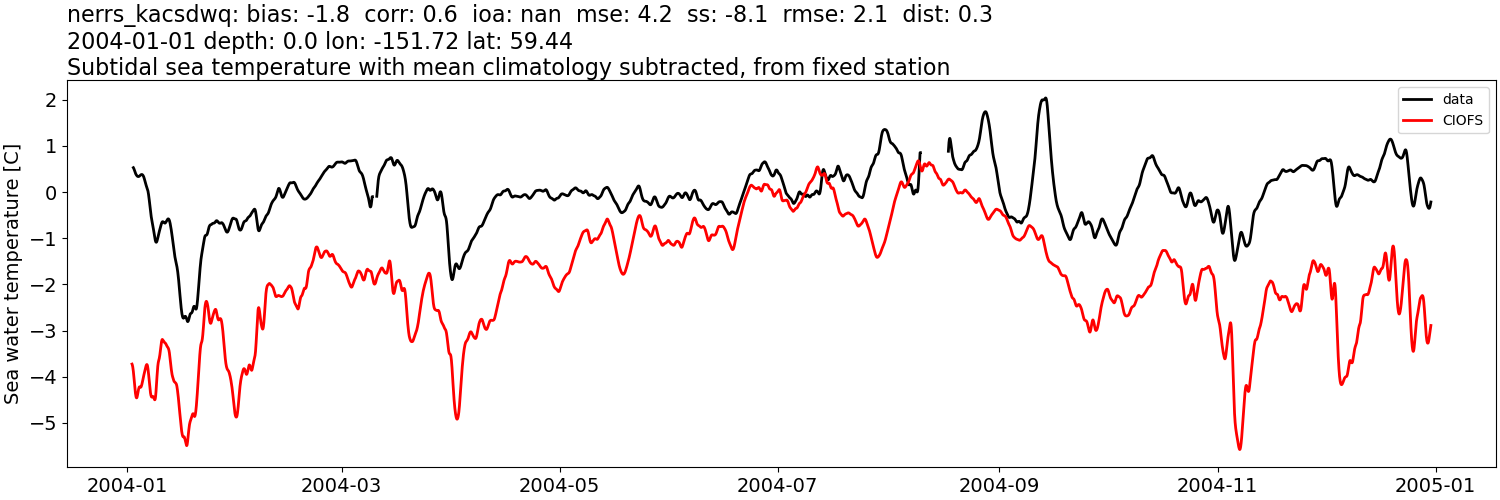
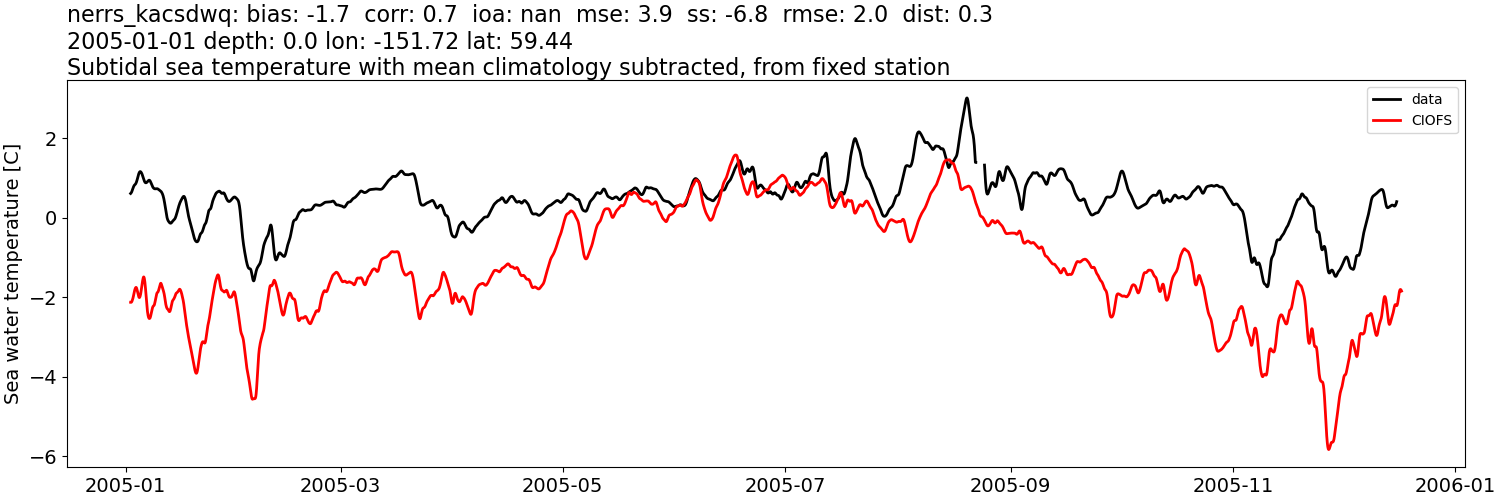
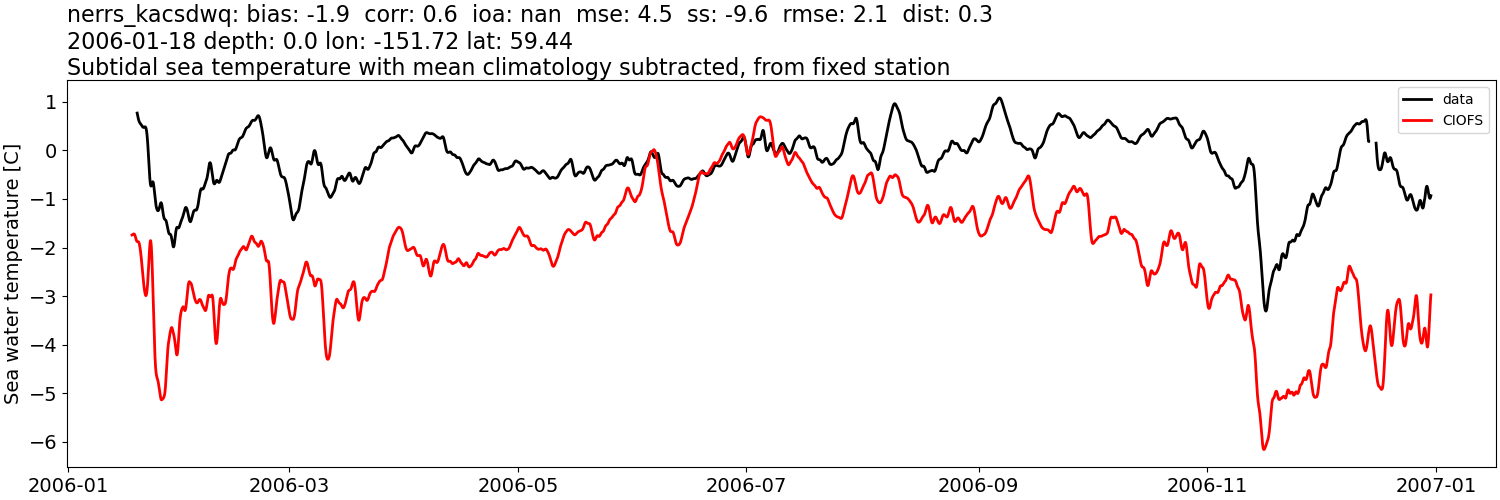
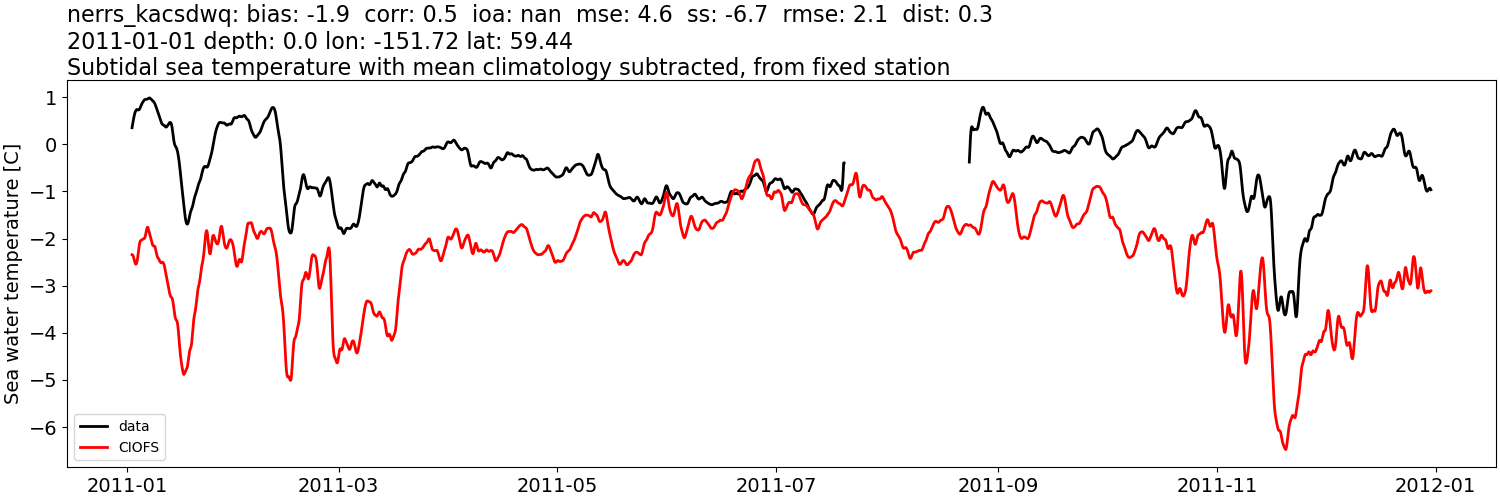
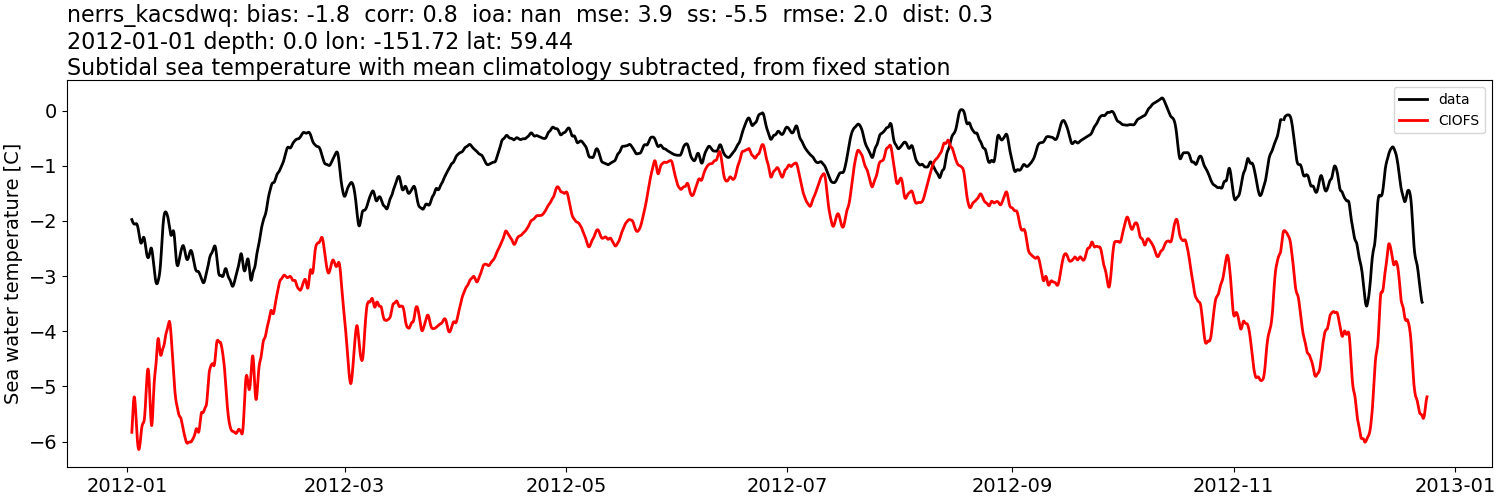
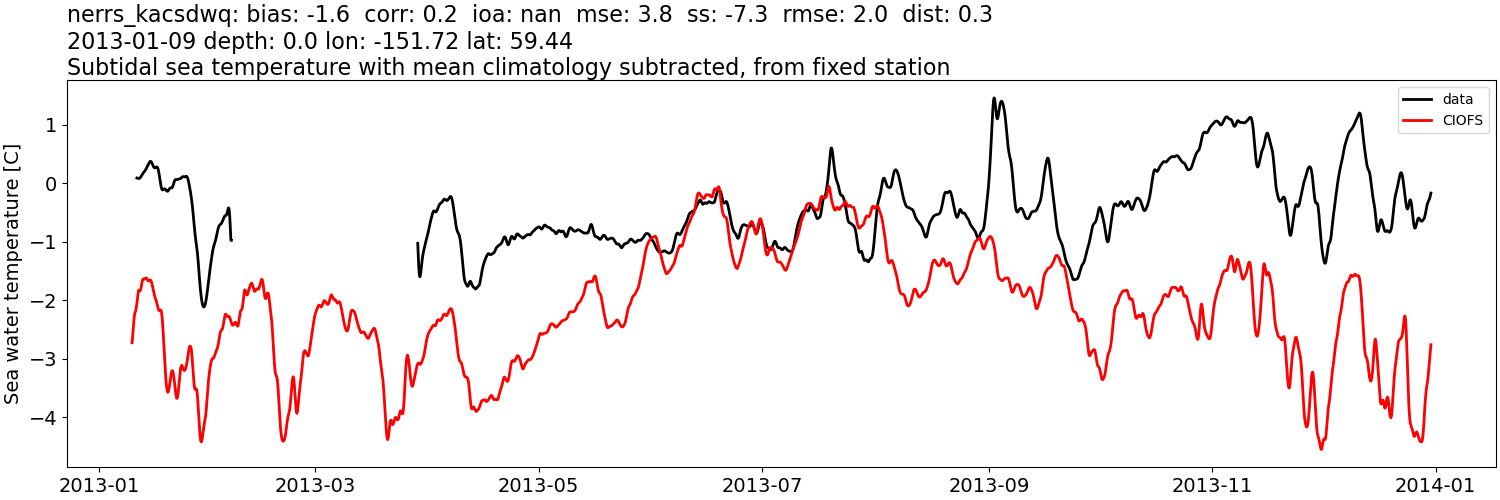
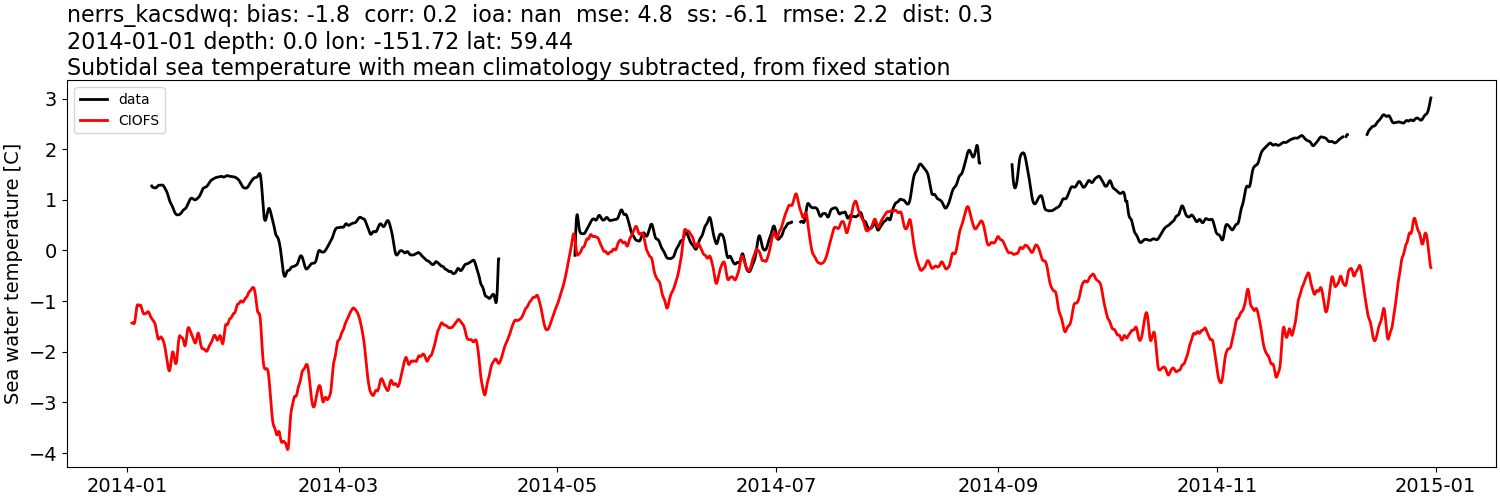
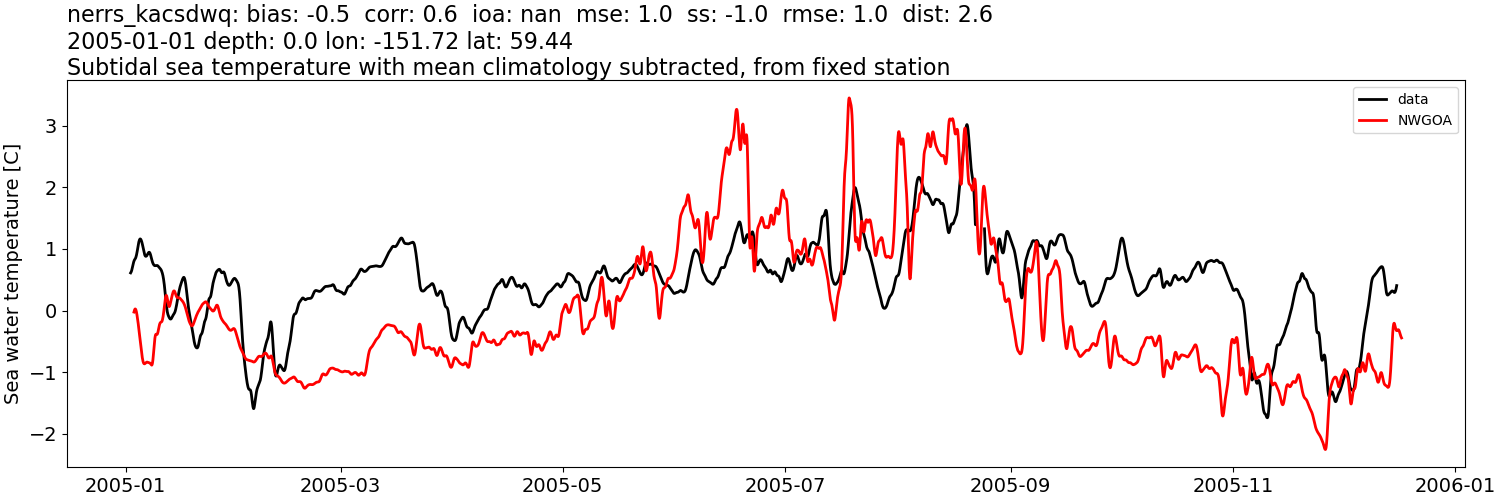
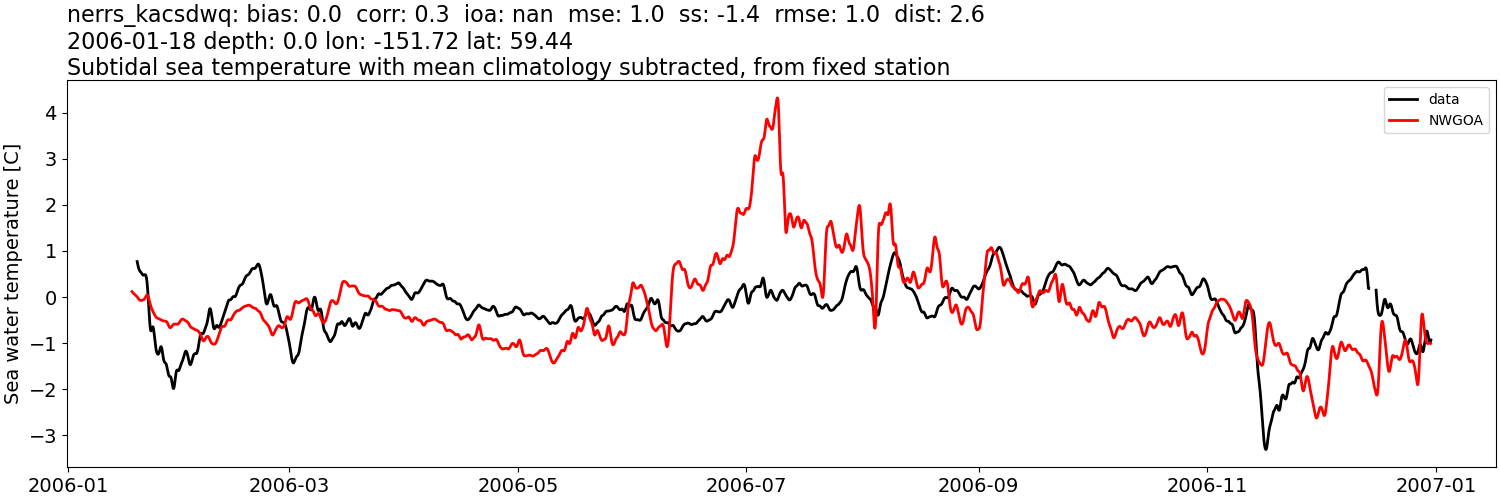
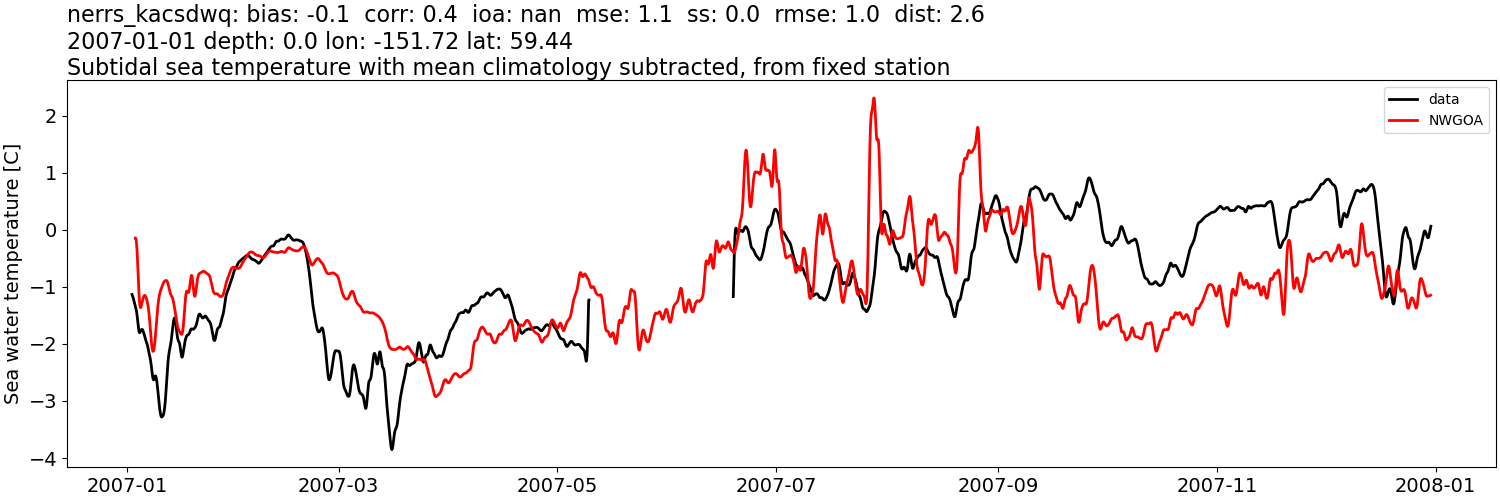
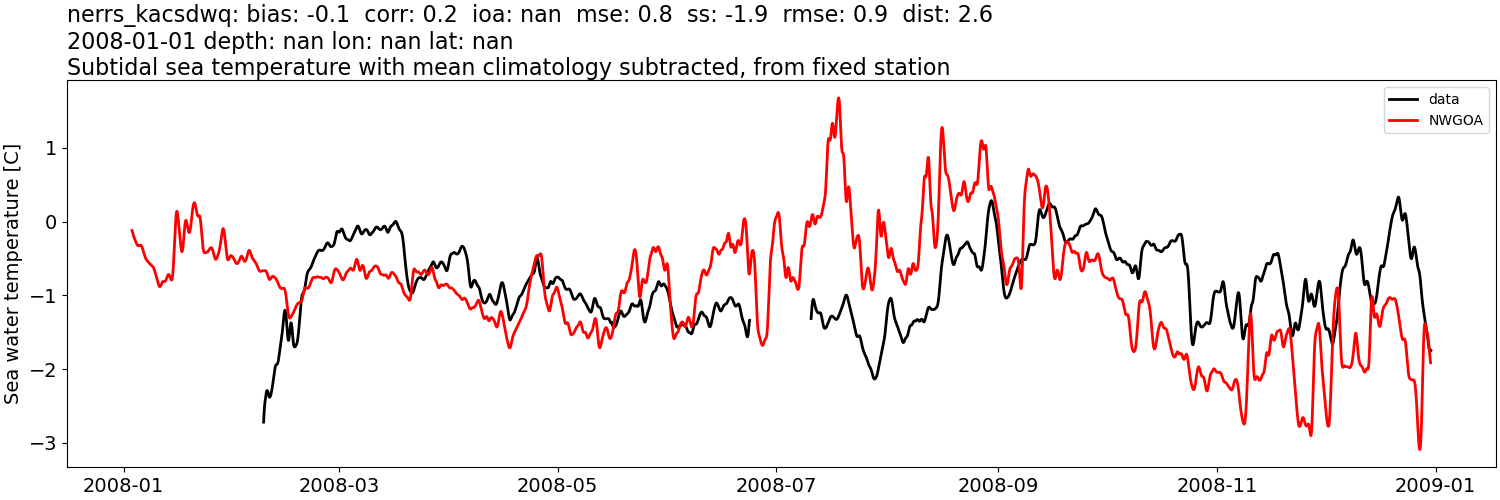
Sea water temperature: tidally-filtered, then monthly mean from data subtracted#
CIOFS#
Comparison plots by year
2004
2005
2006
2007
2008
2009
2010
2011
2012
2013
2014
2015
2016

2017
2018
2019
2020
2021
2022
NWGOA#
Comparison plots by year
2004
2005
2006
2007
2008
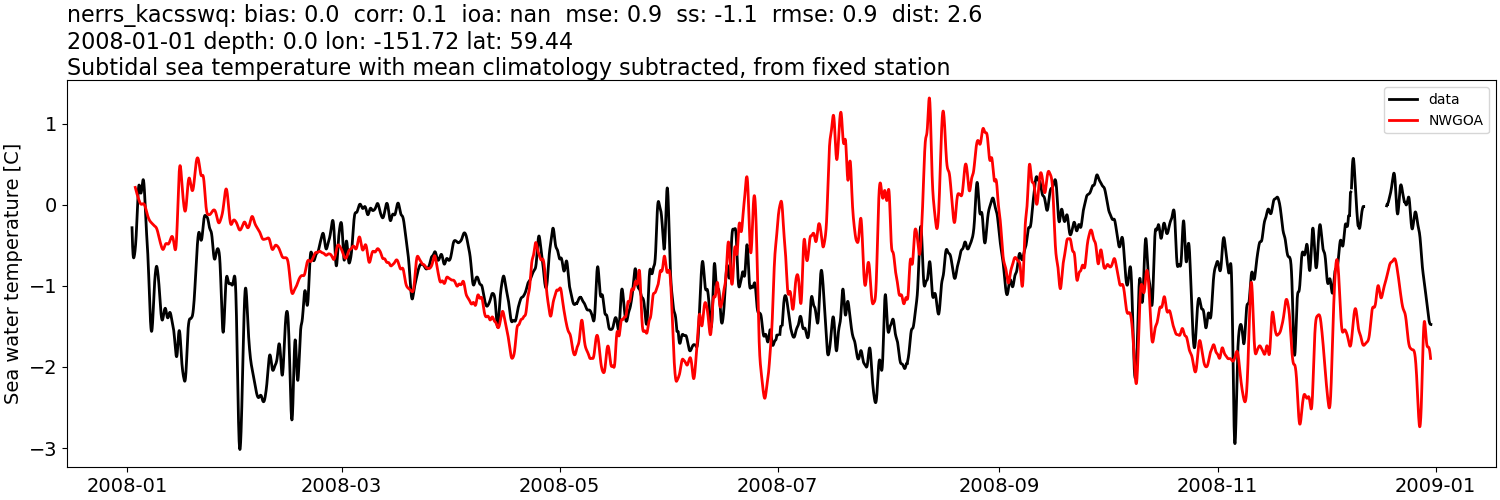
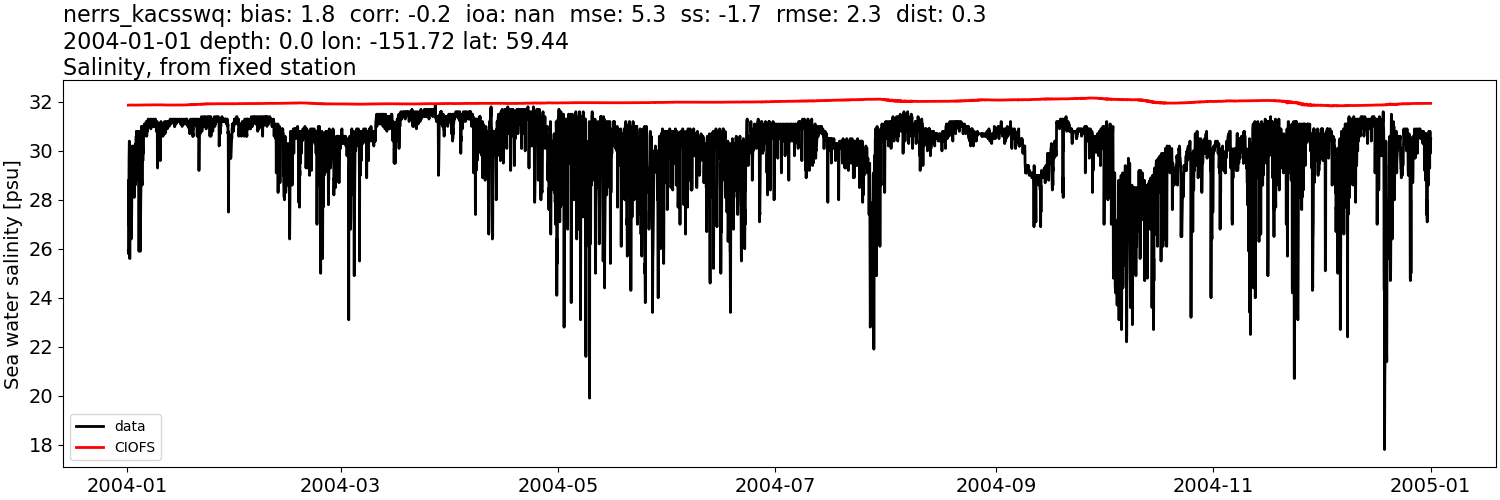
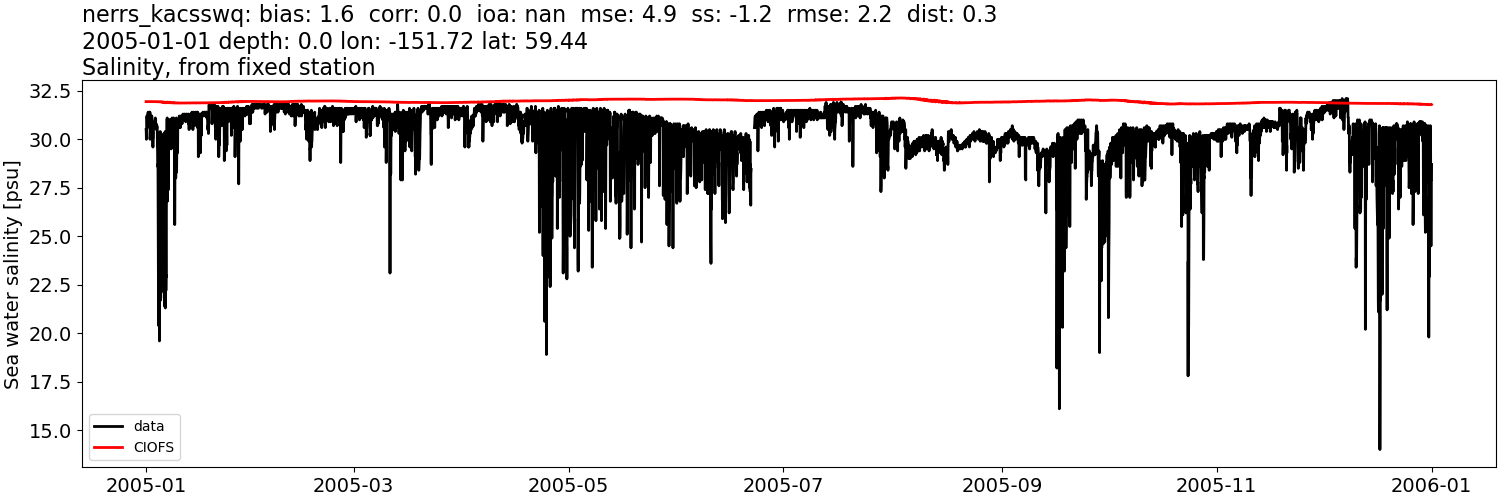
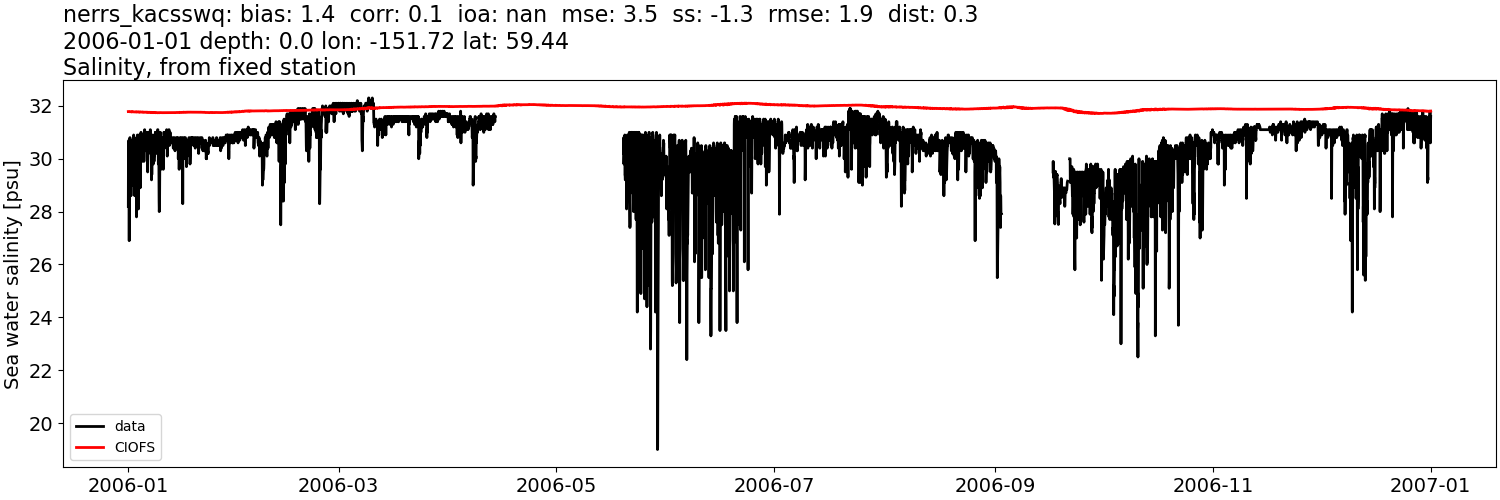
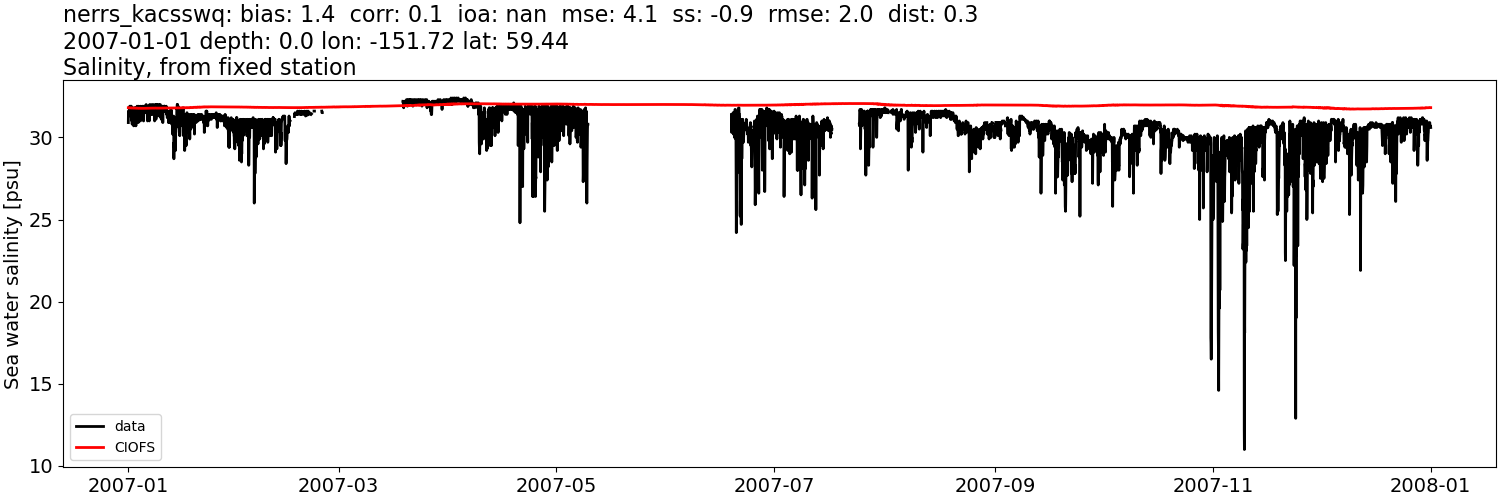
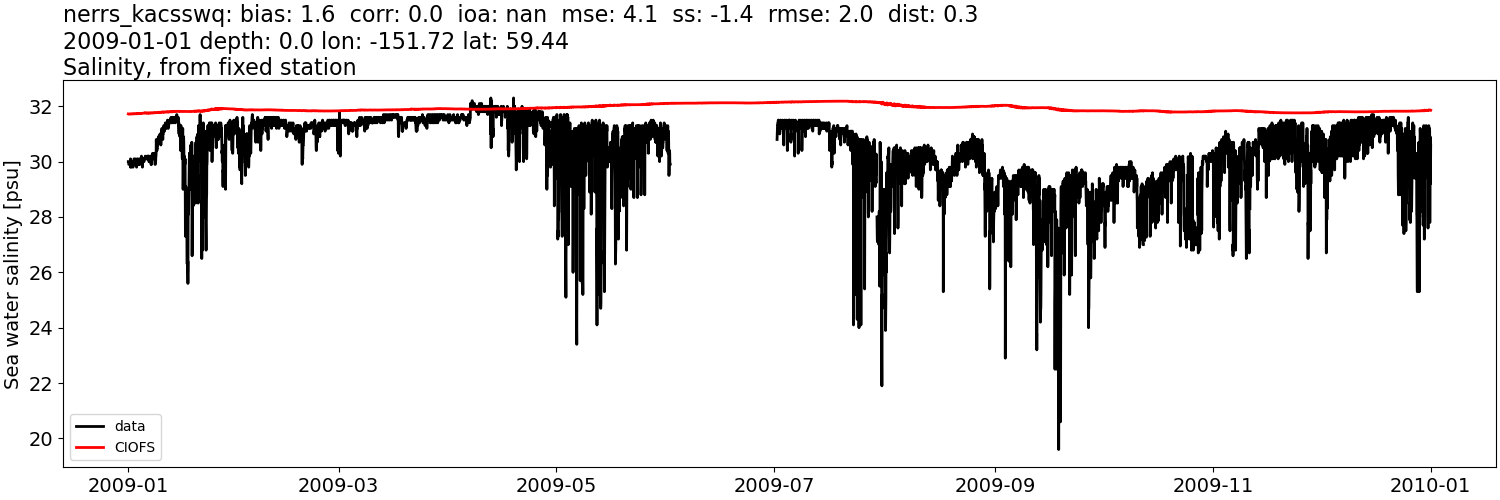
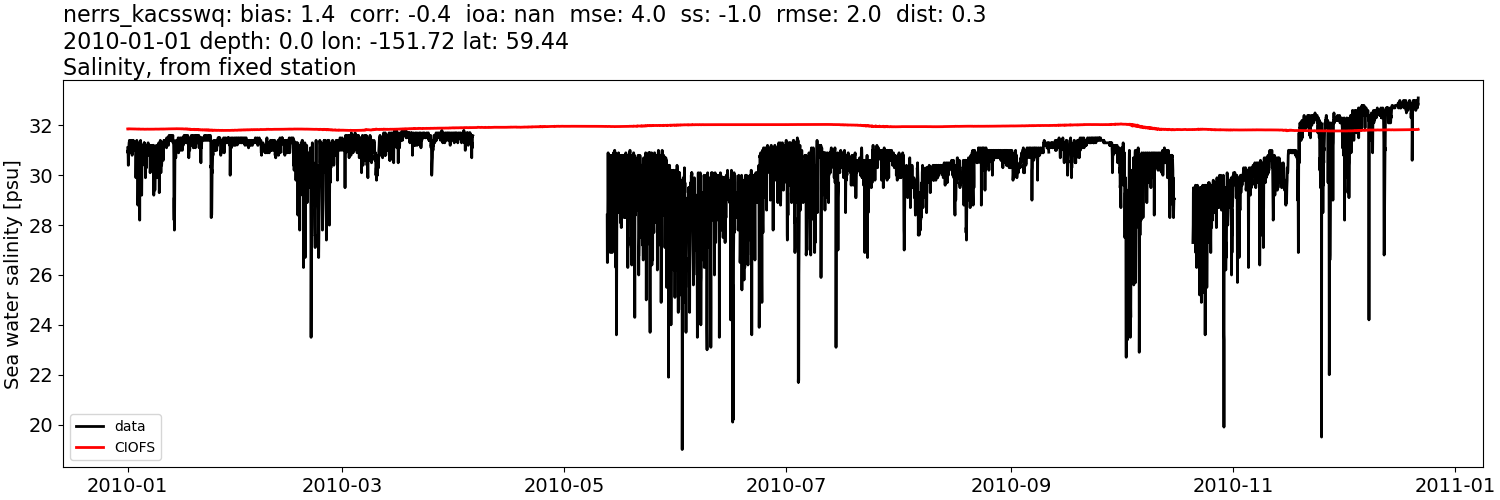
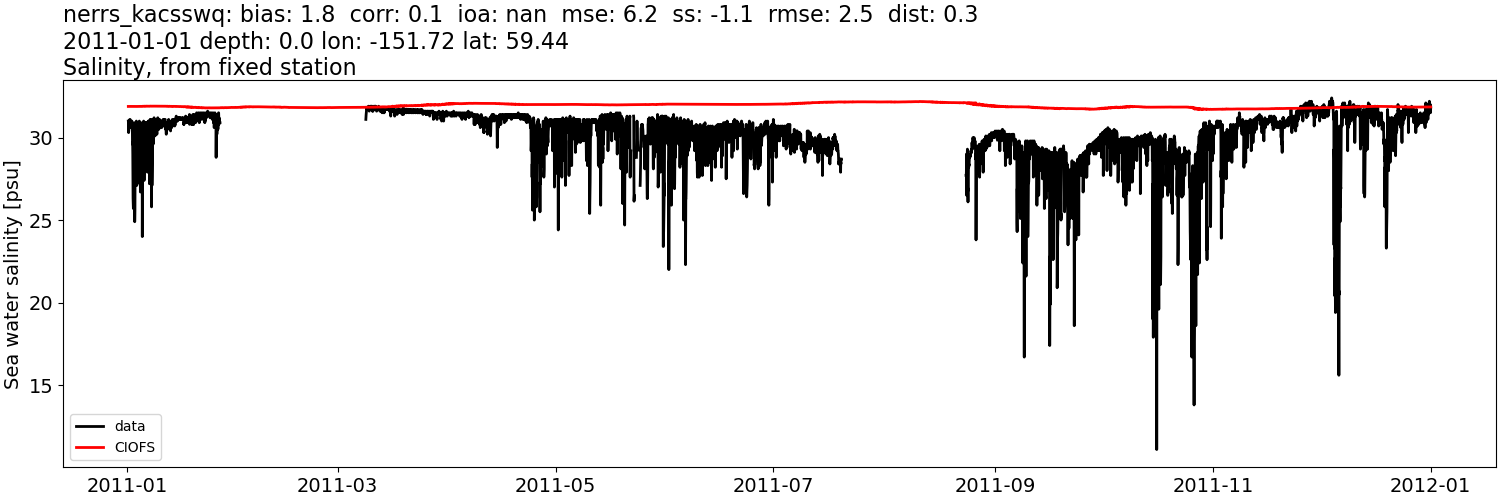
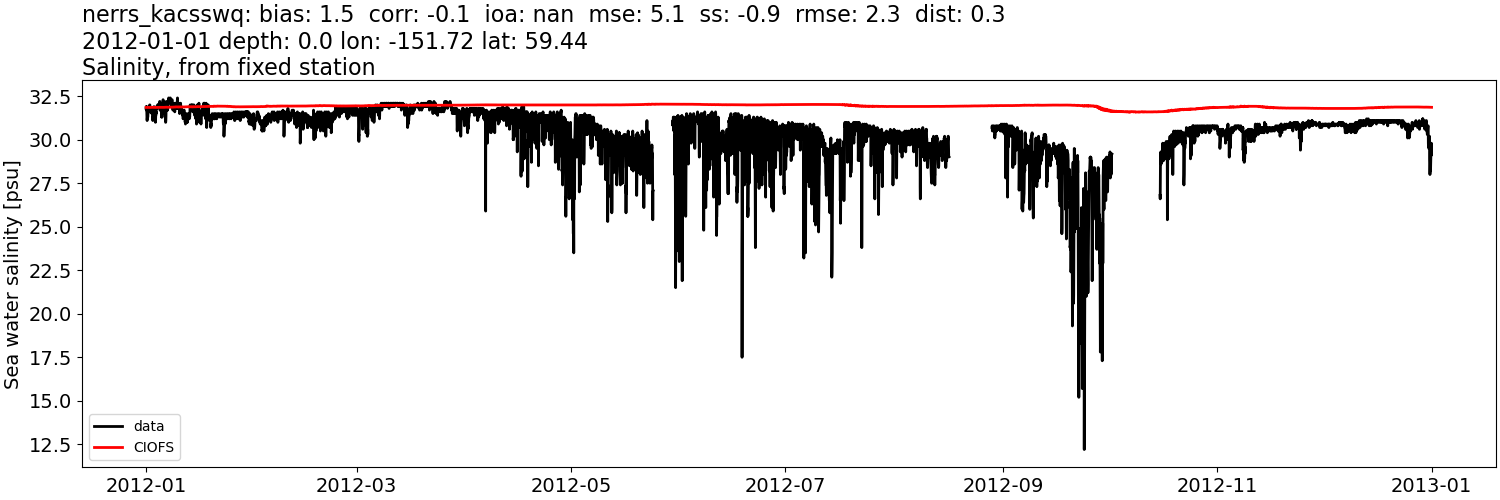
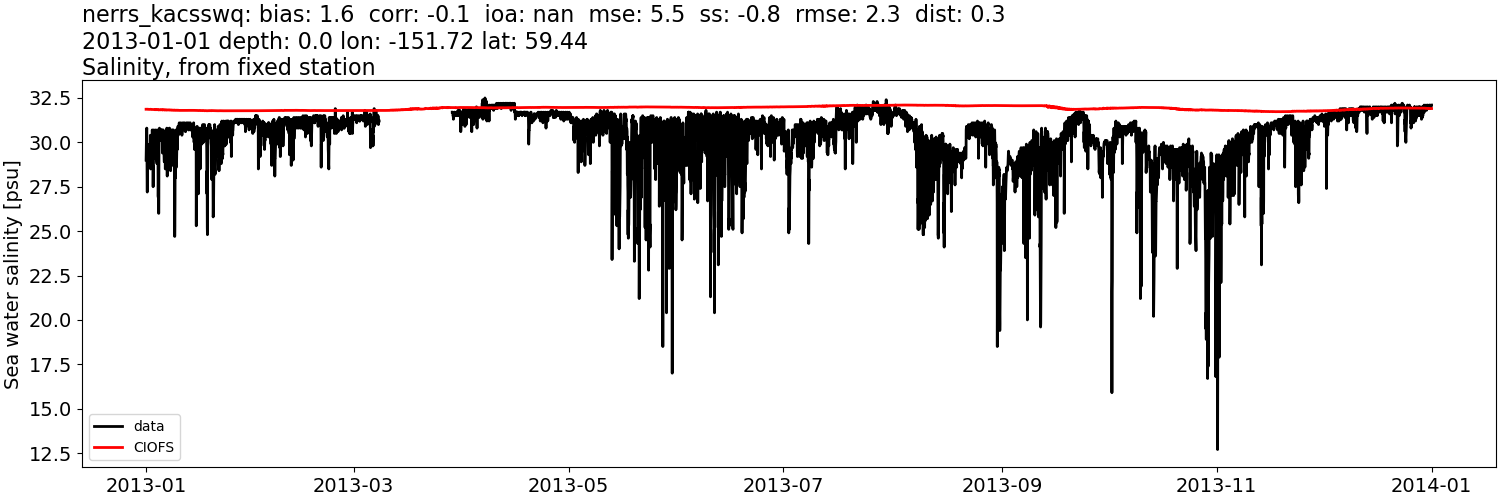
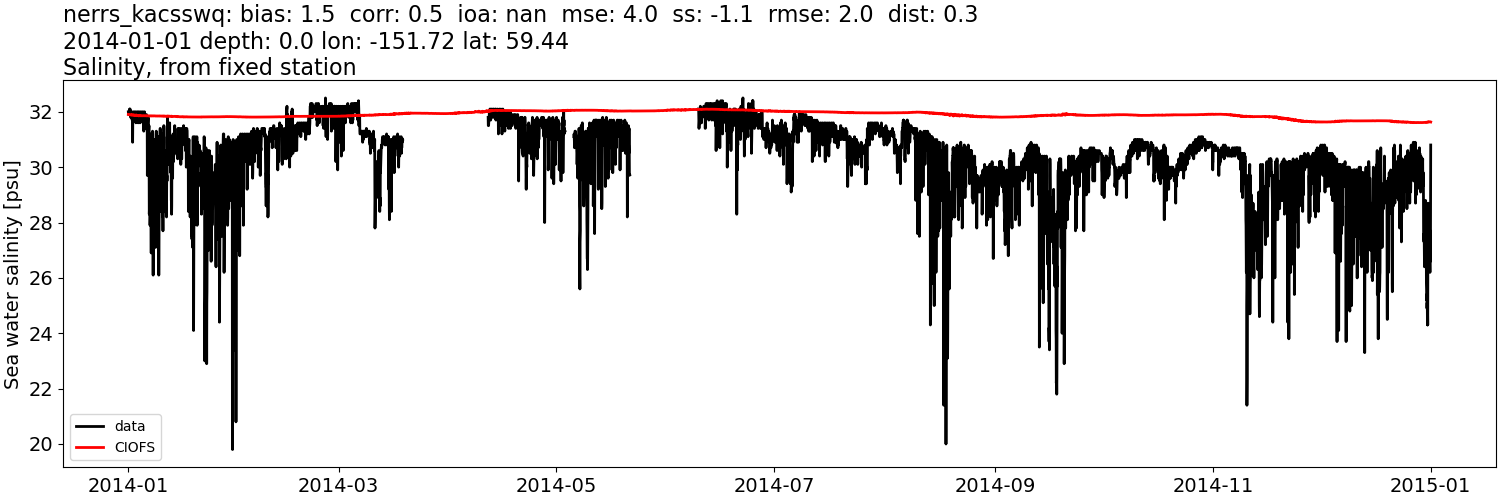
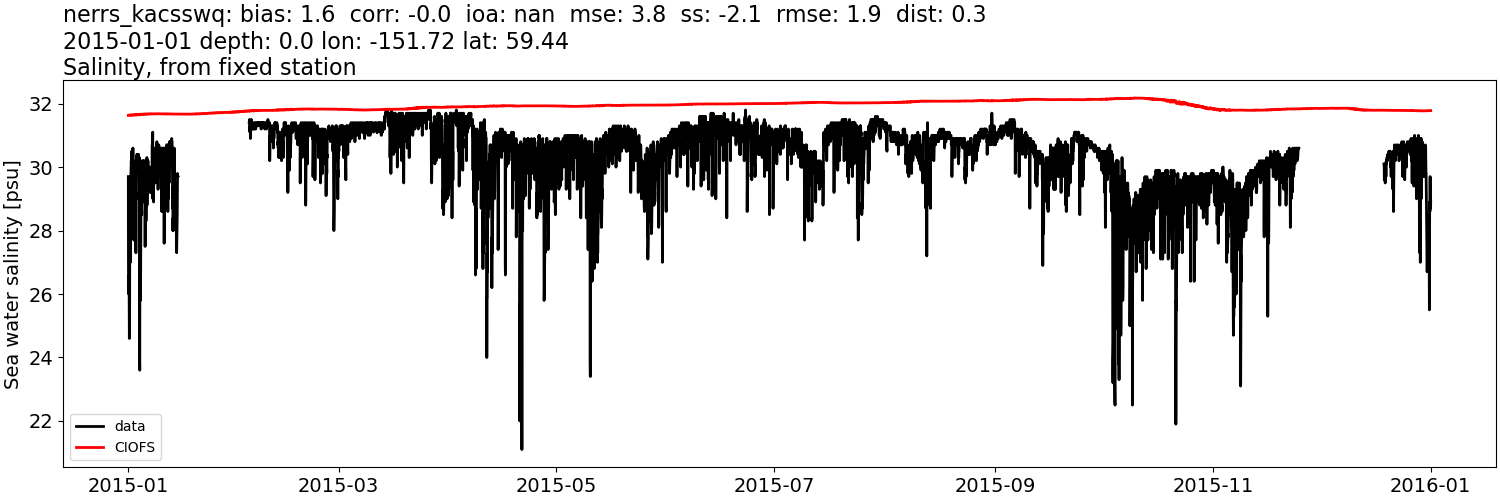
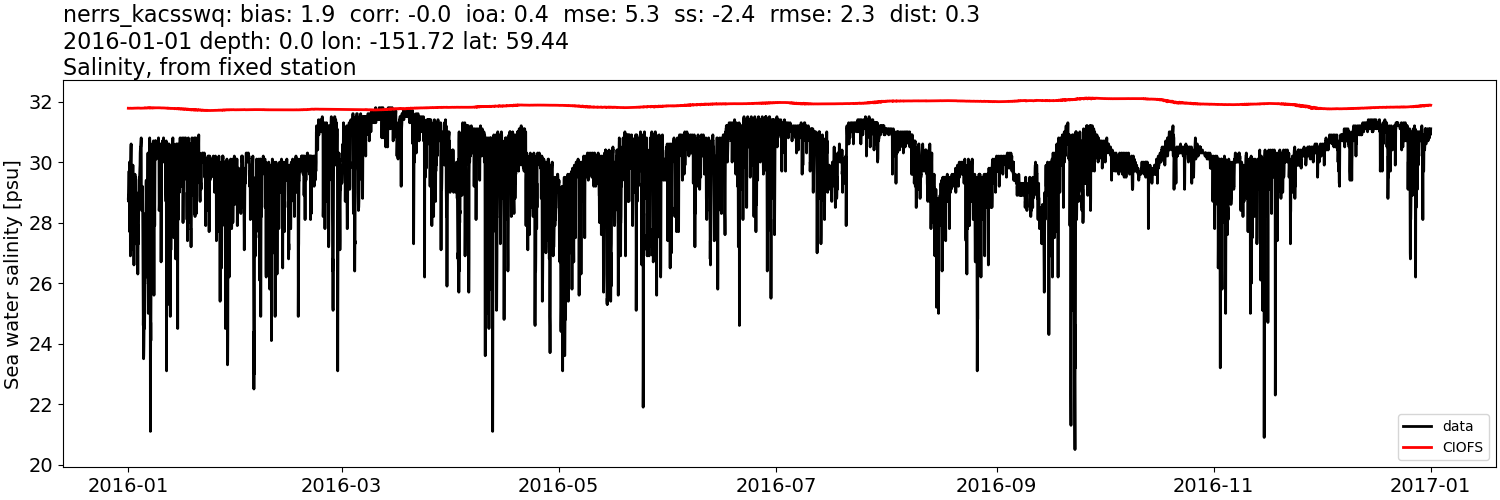
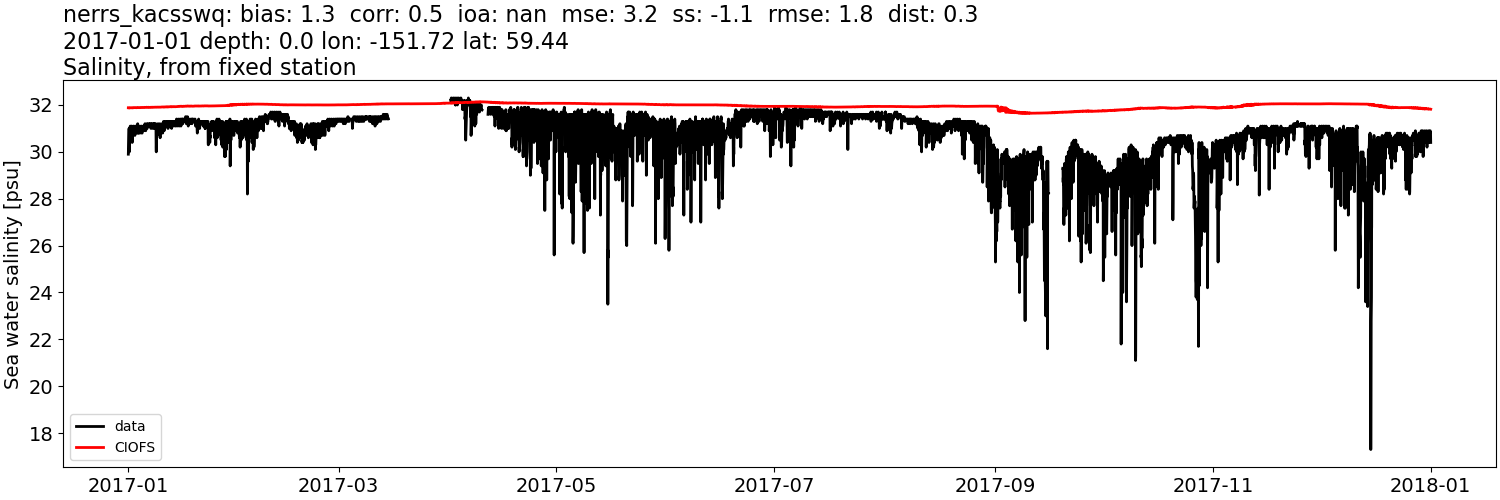
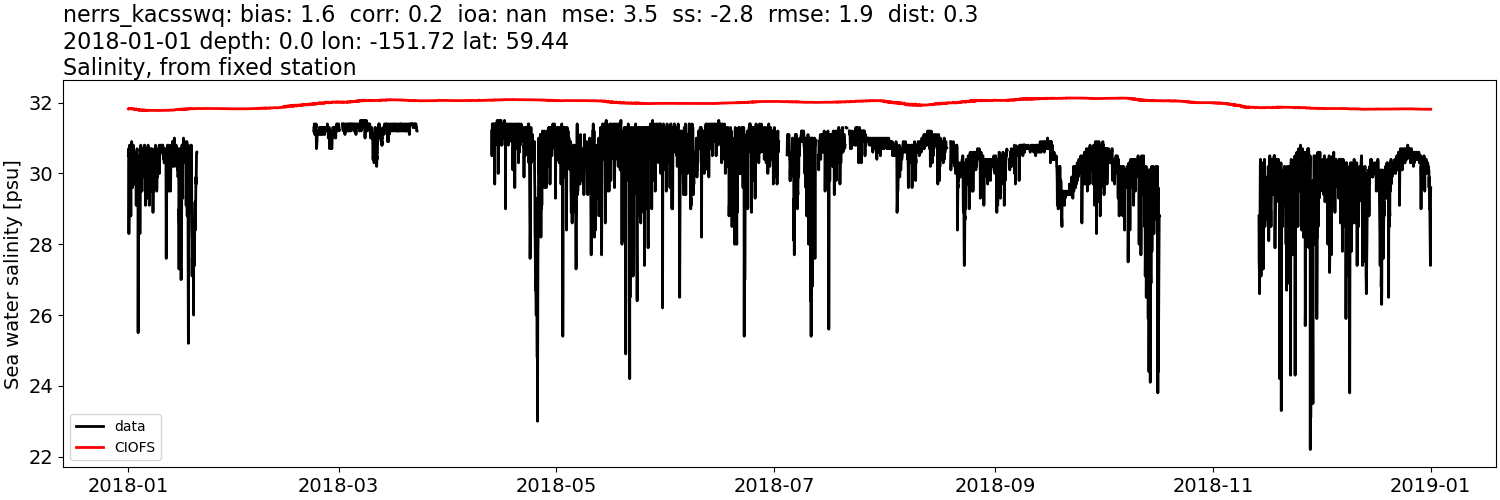
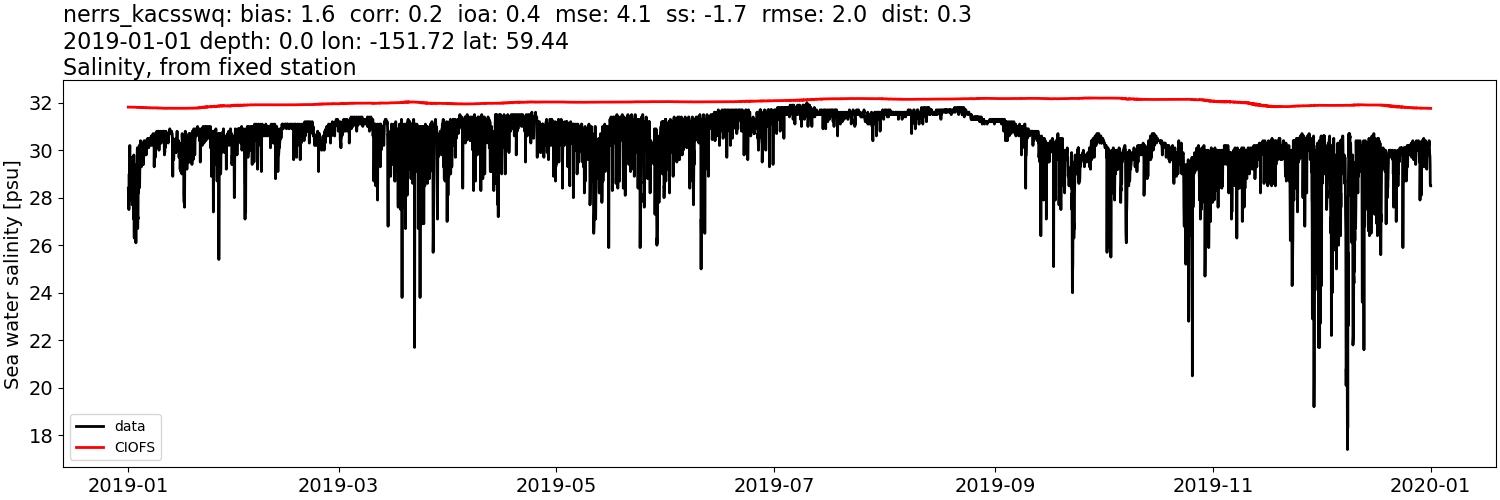
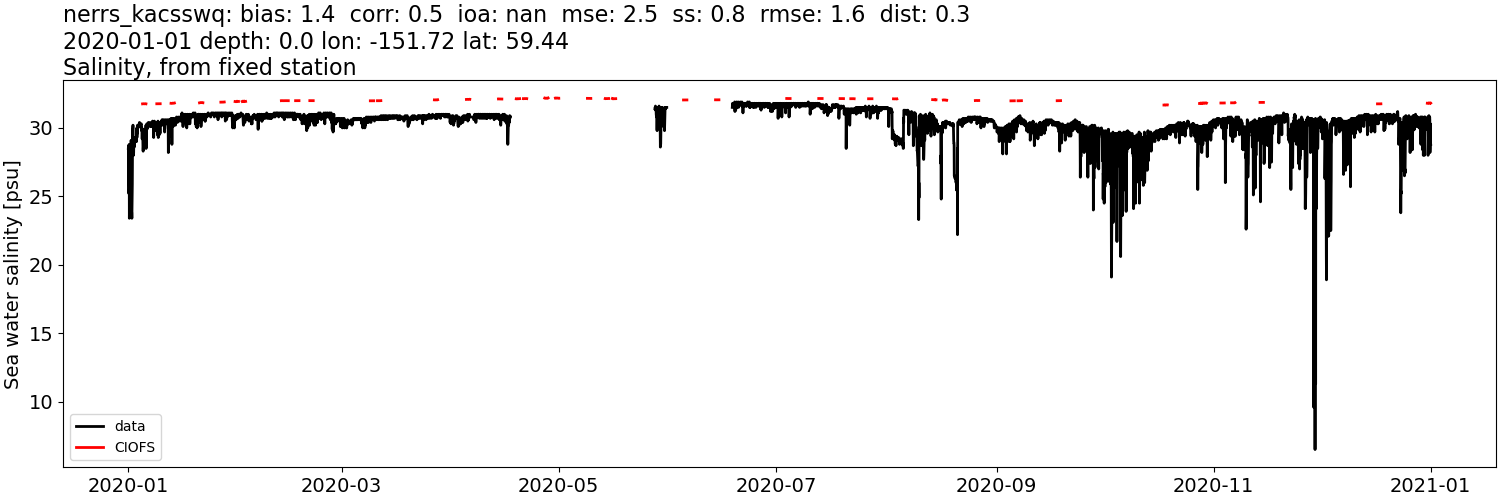
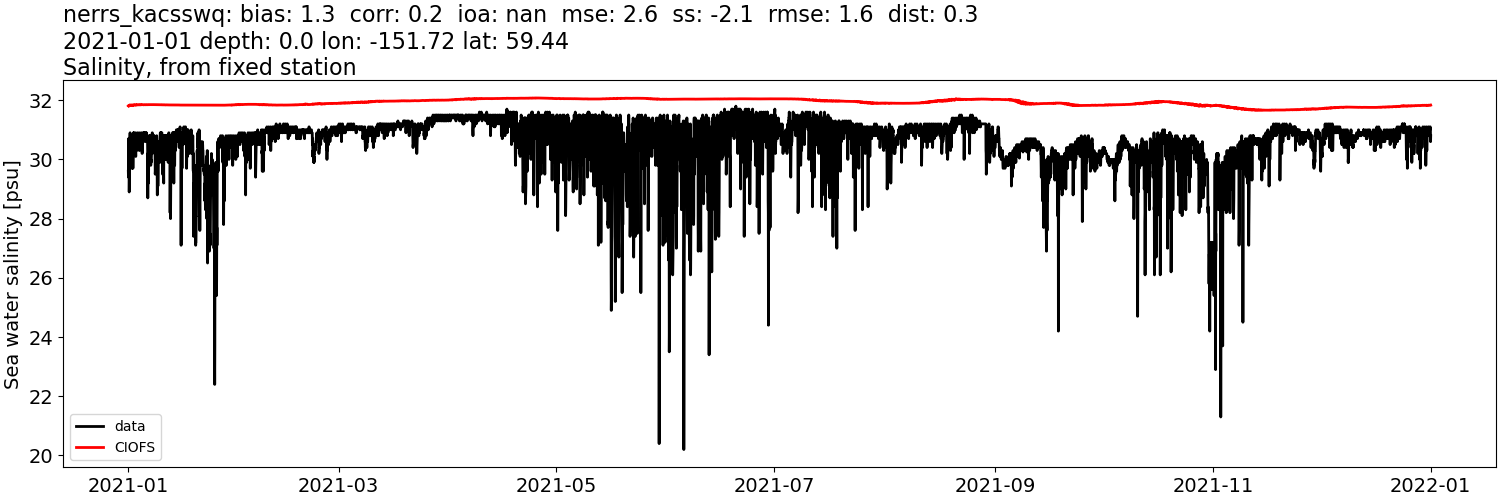
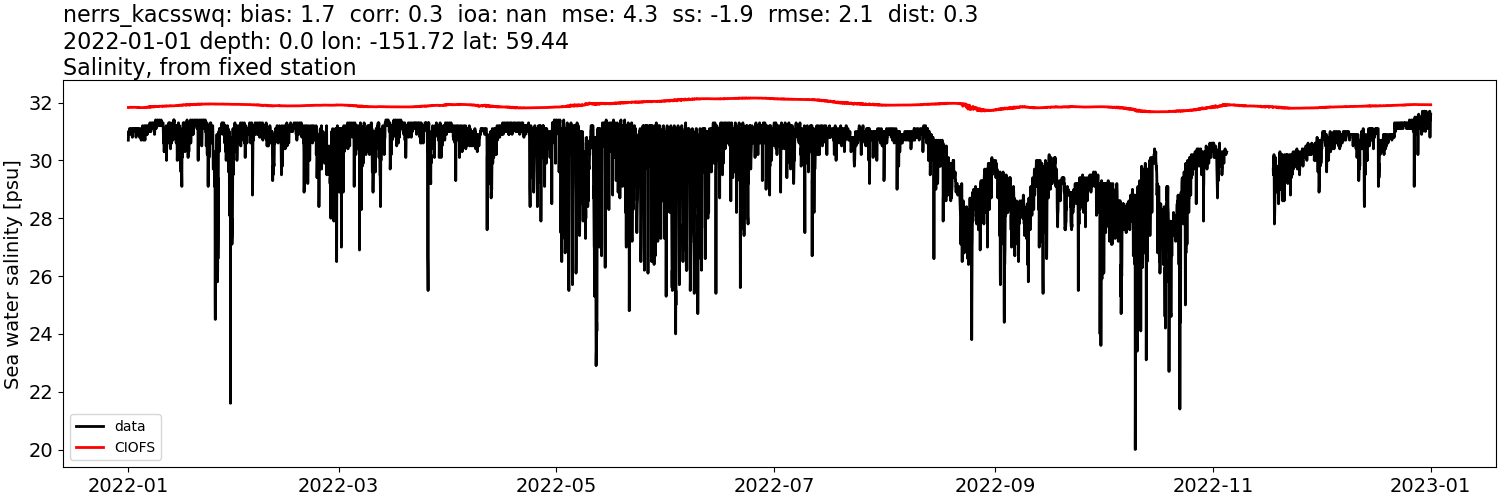
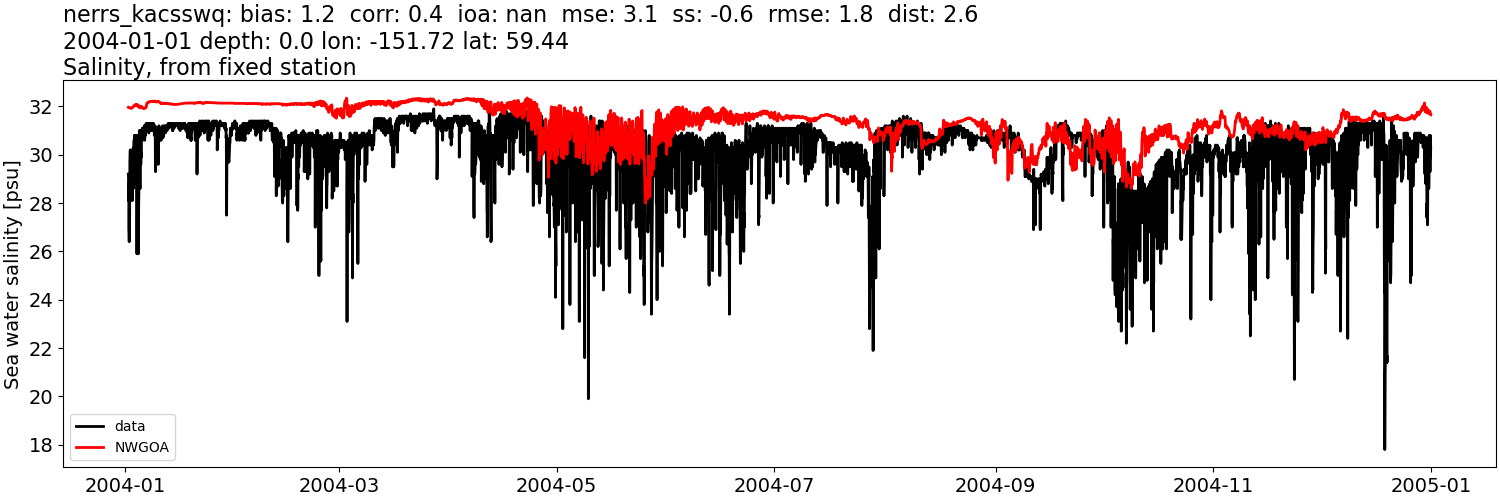
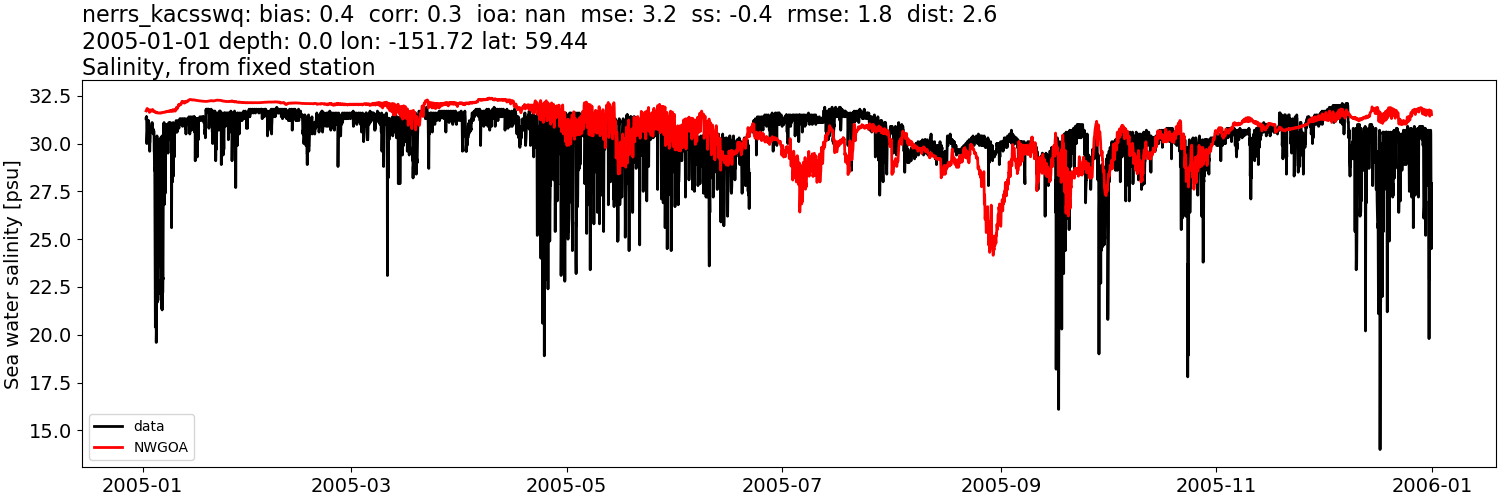
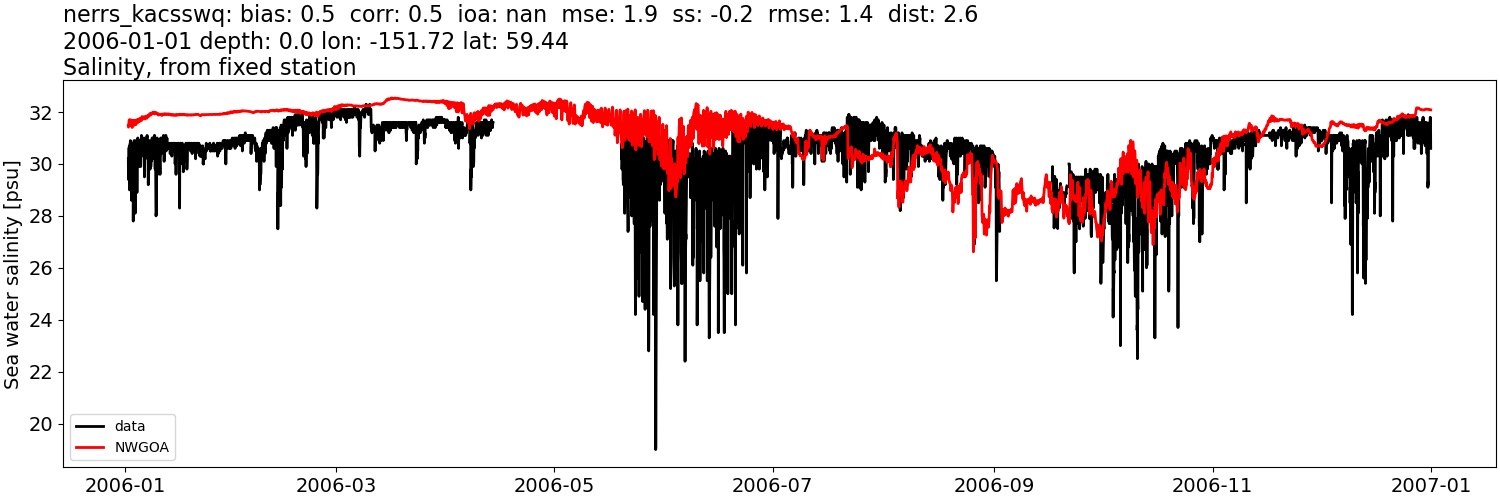
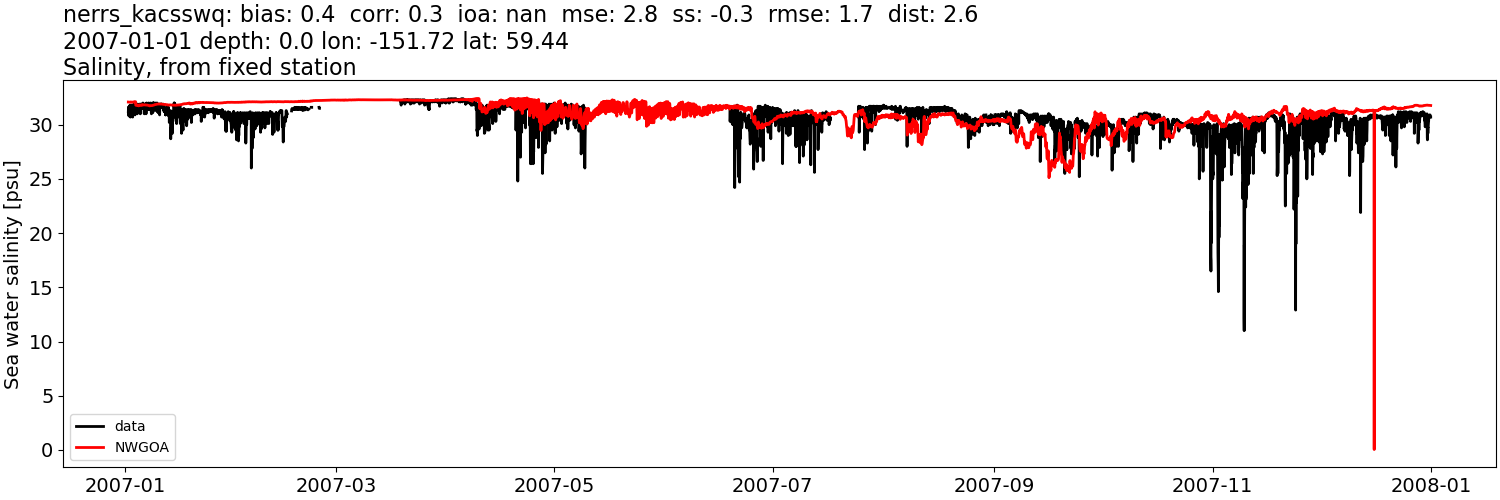
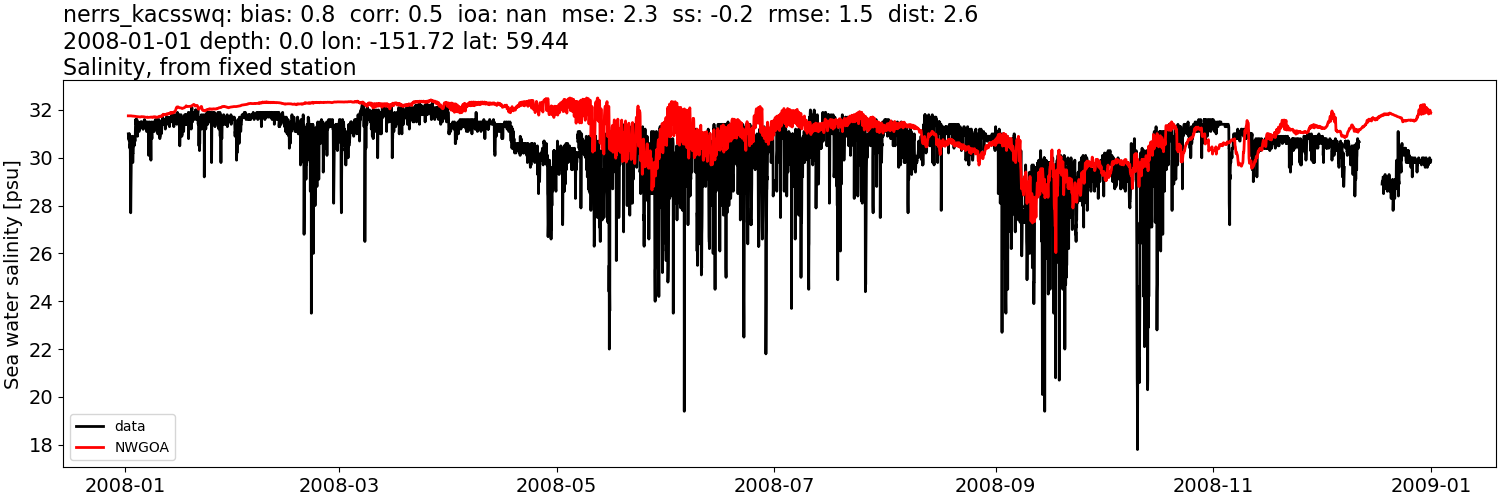
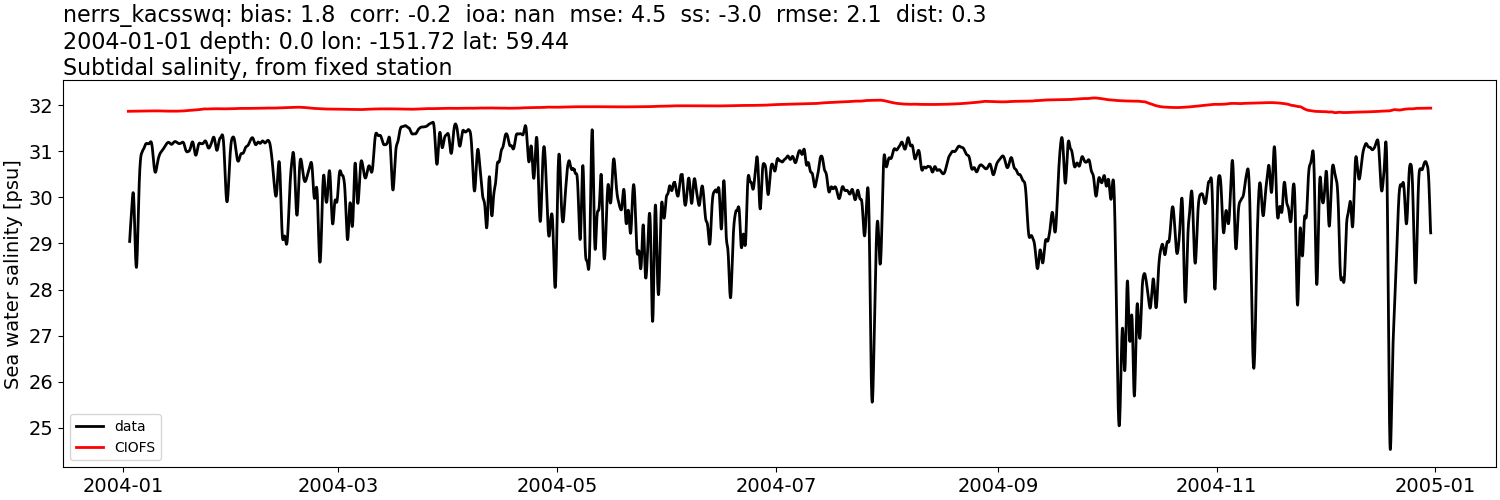
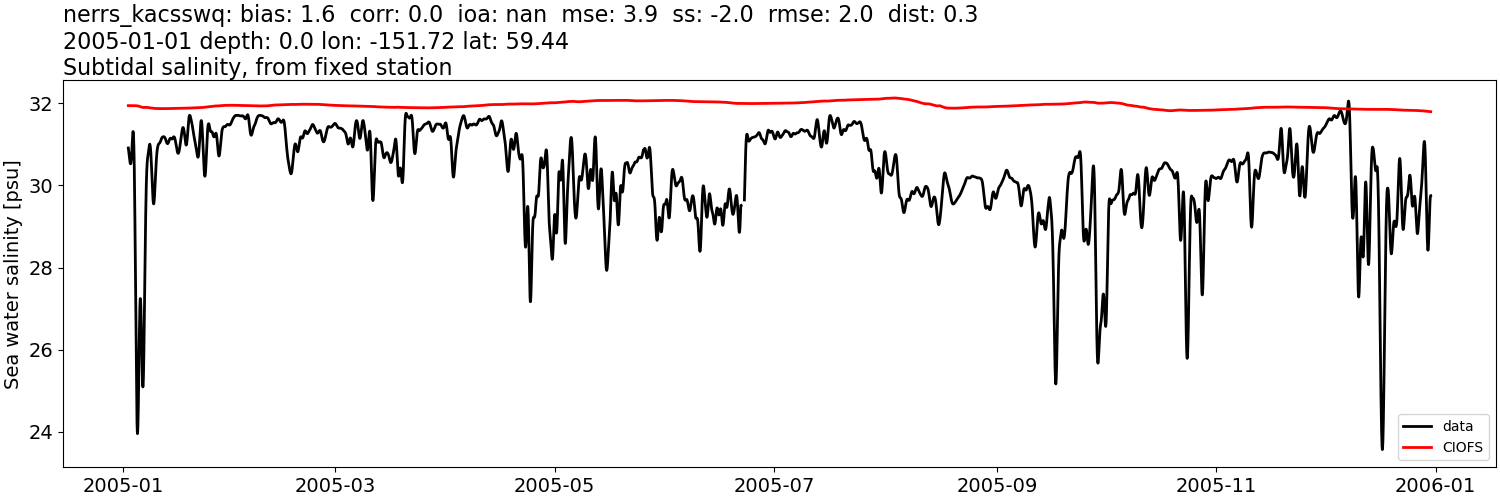
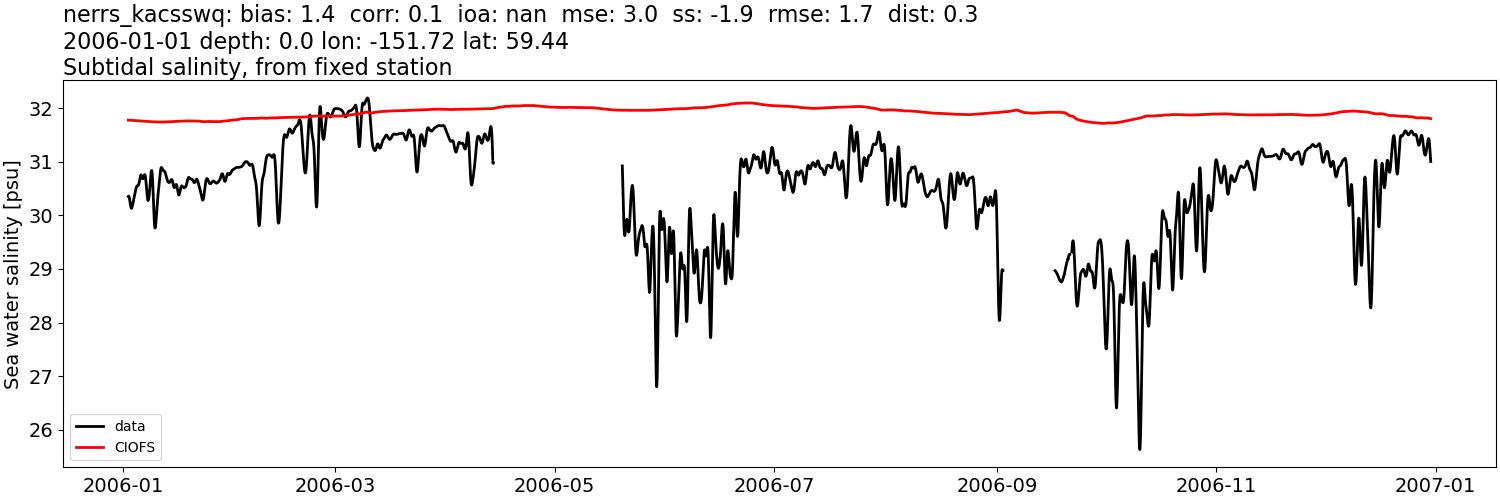
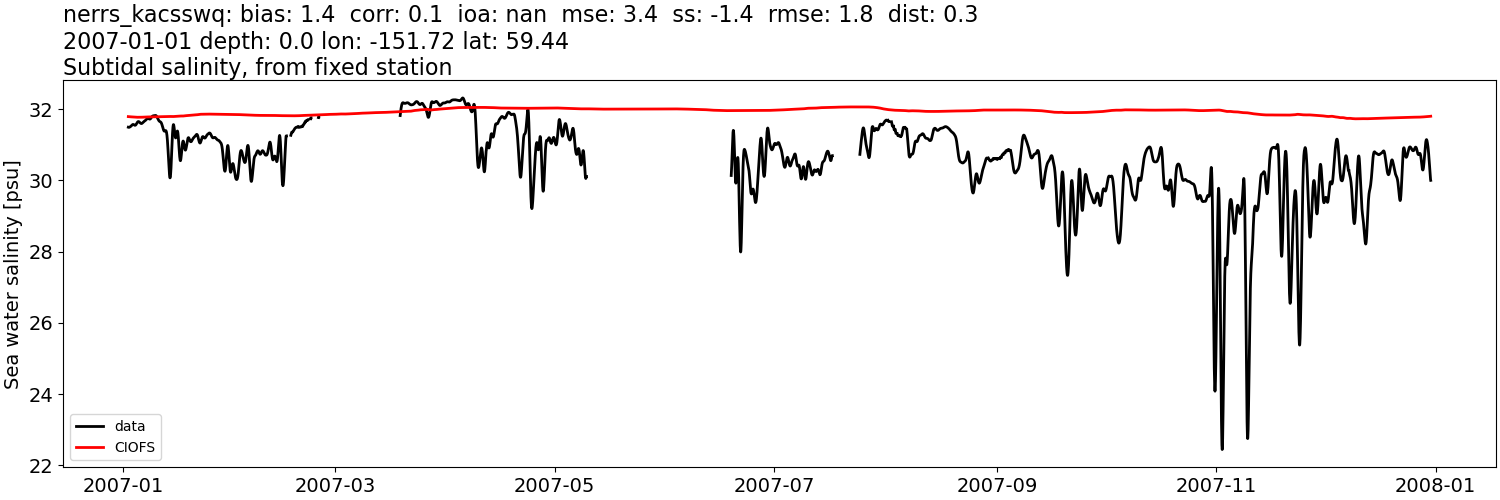
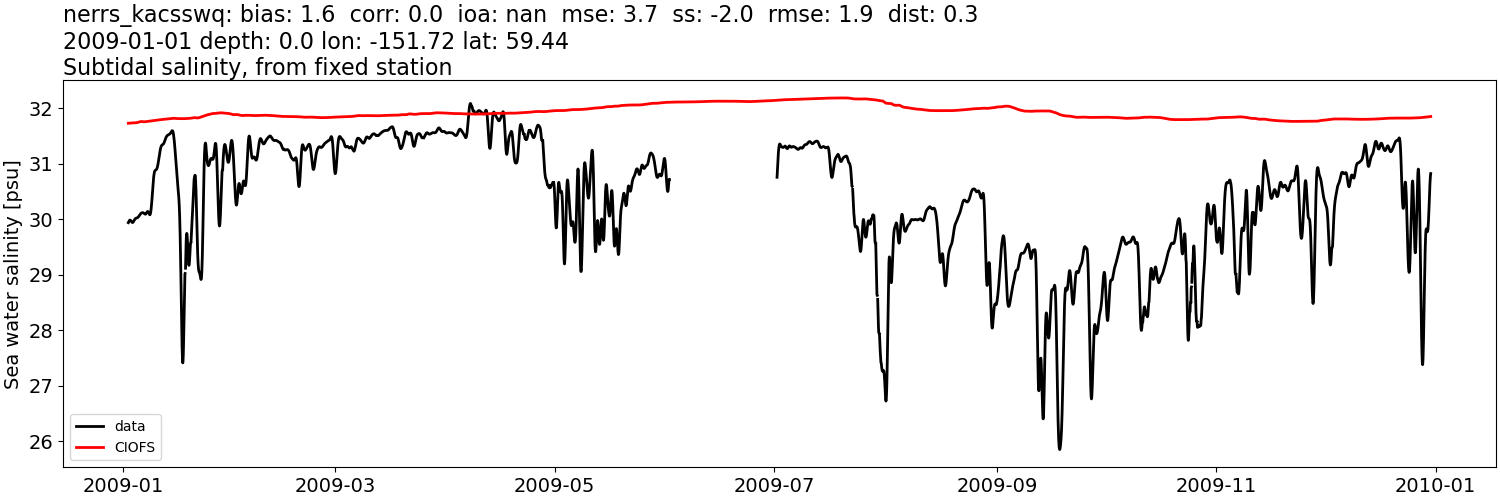
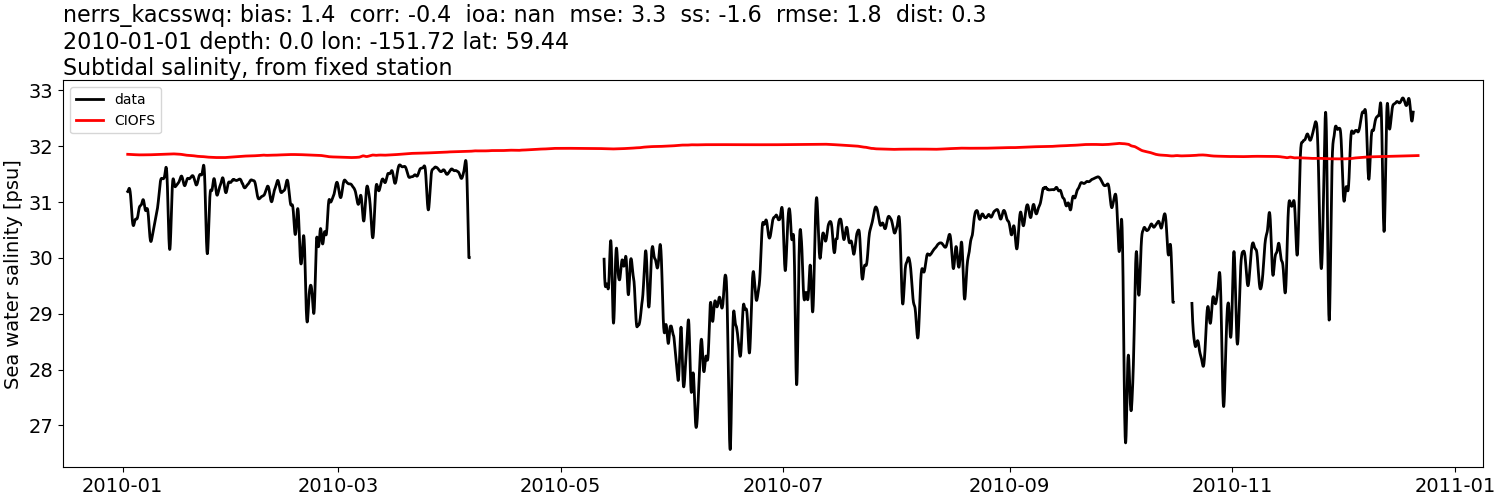
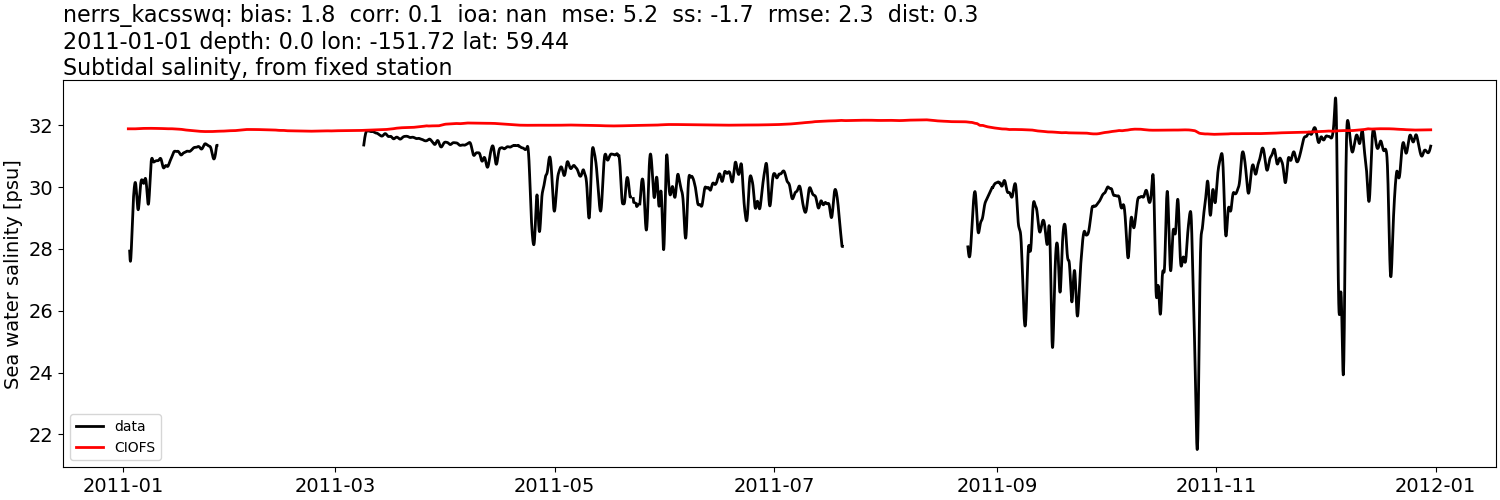
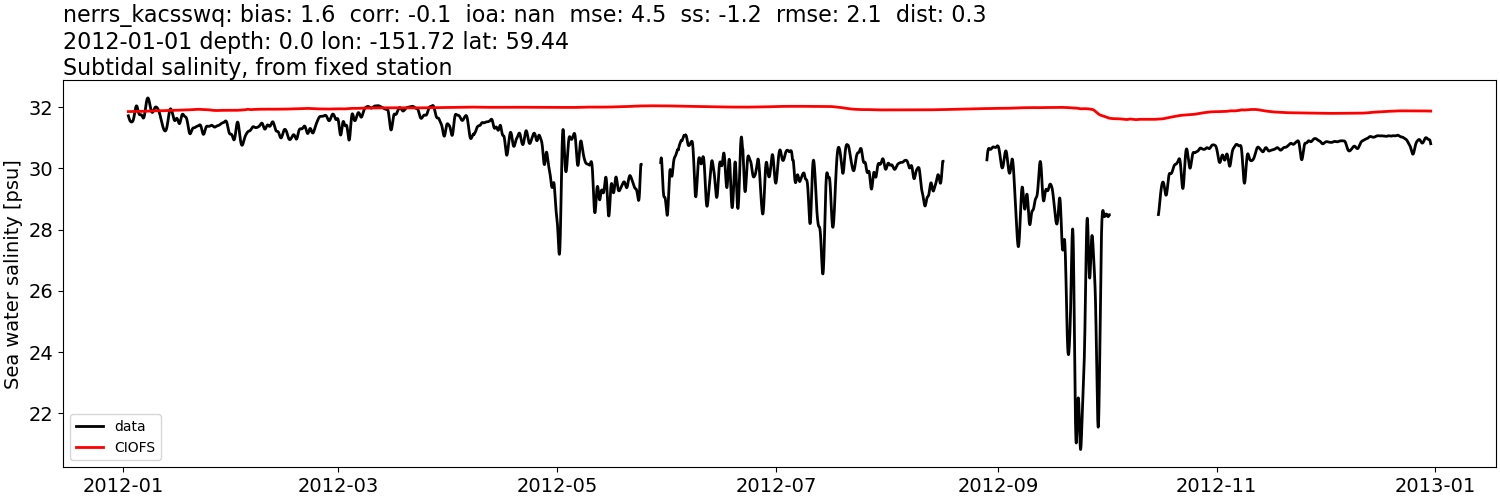
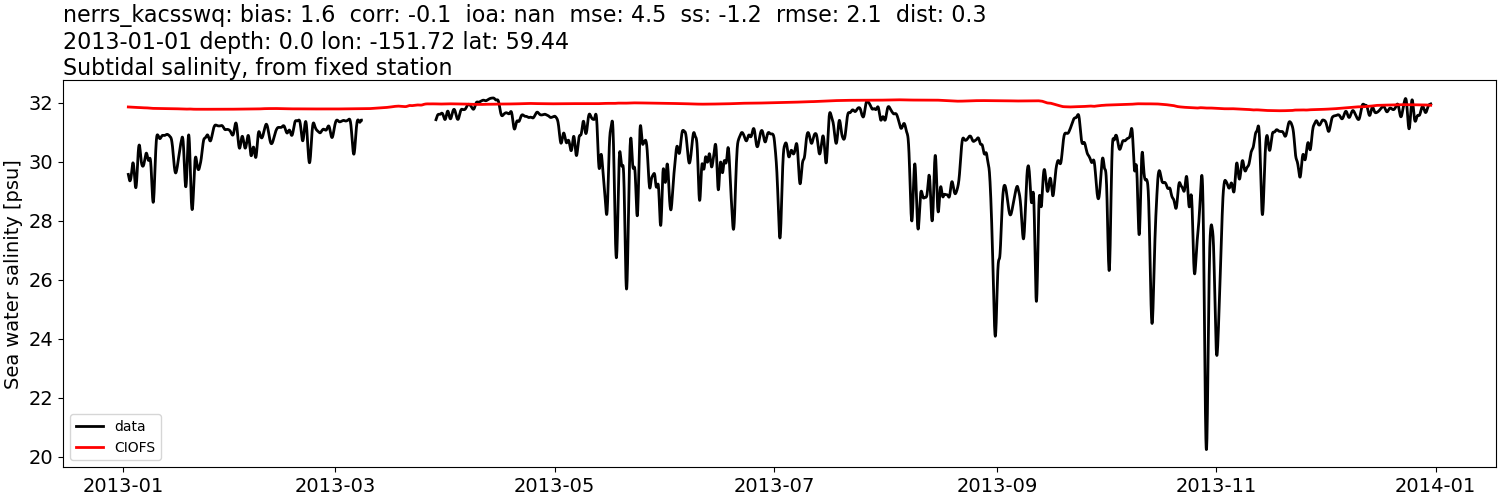
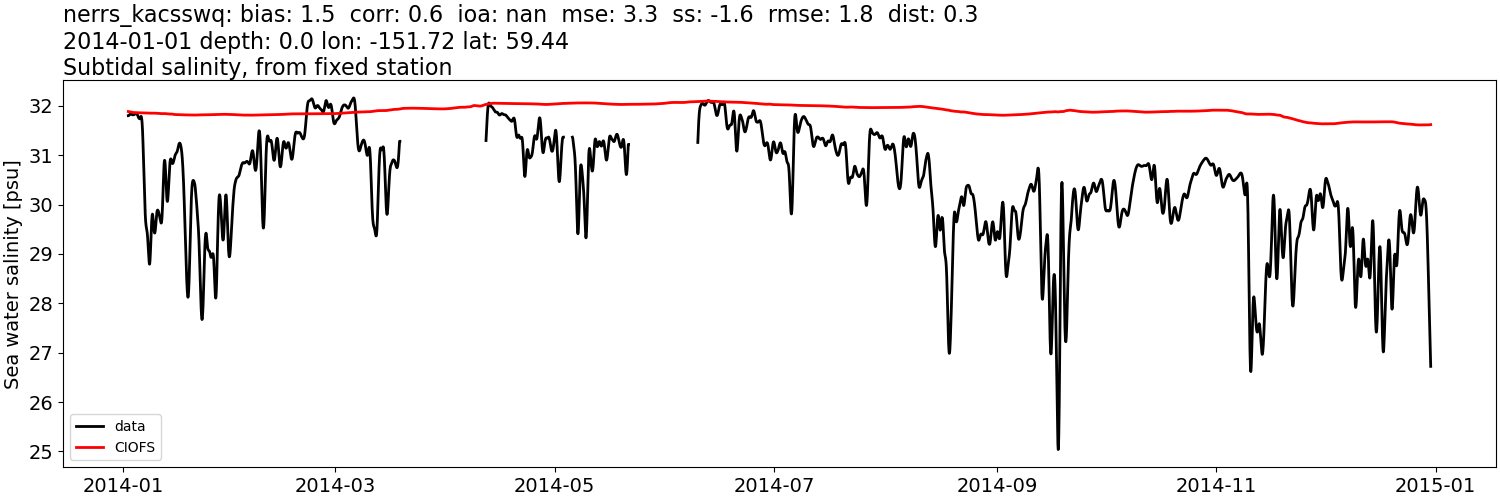
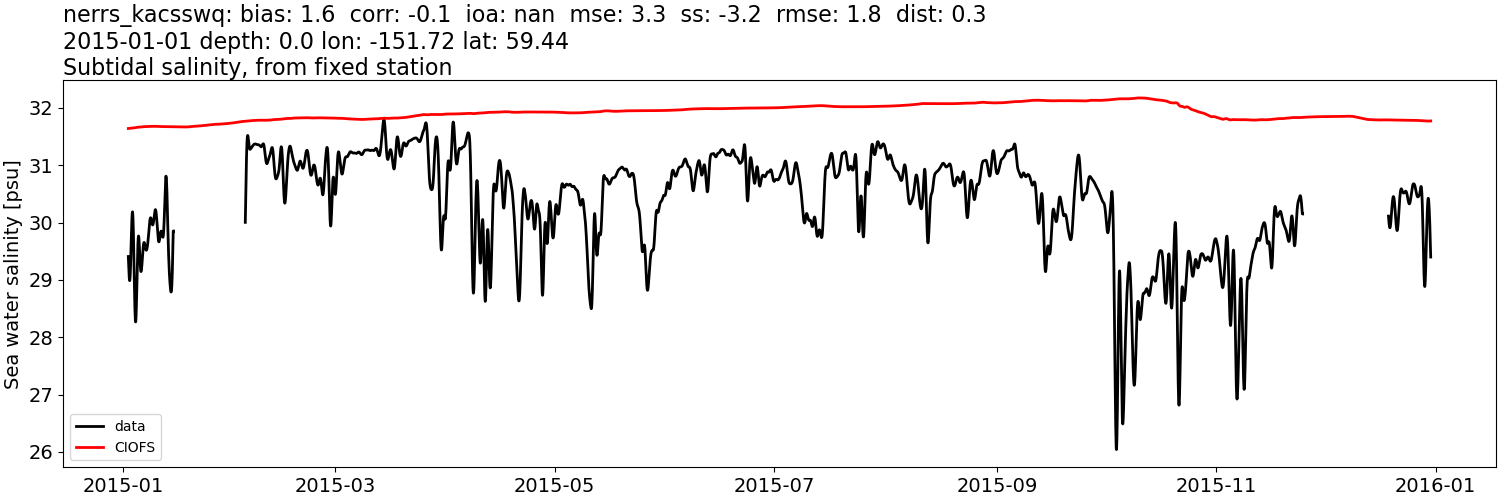
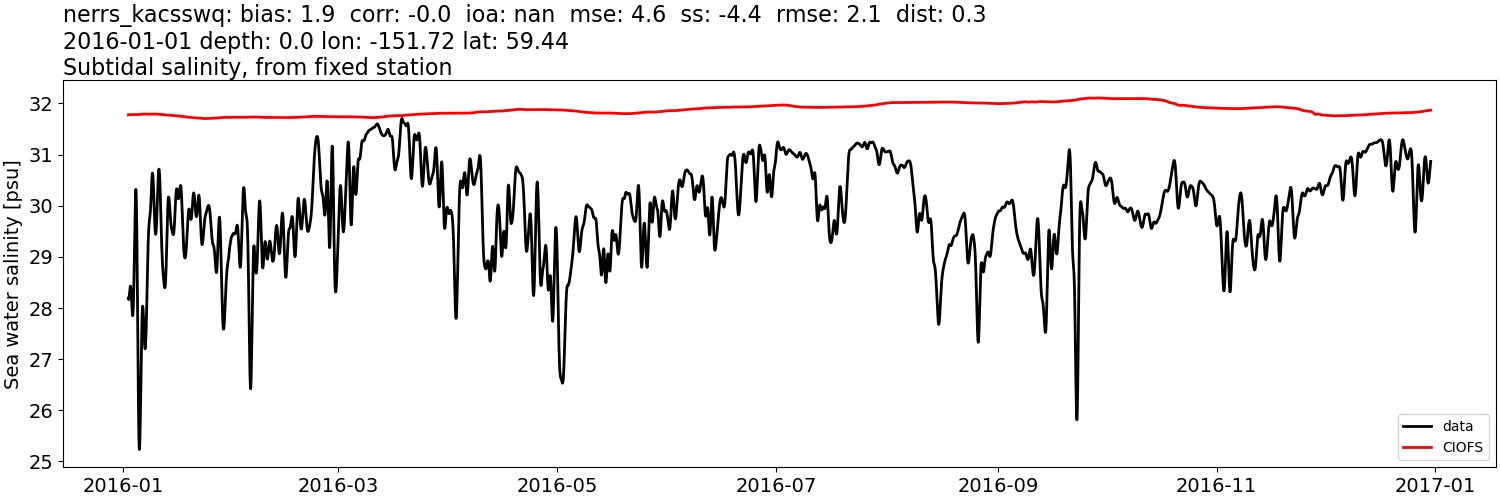
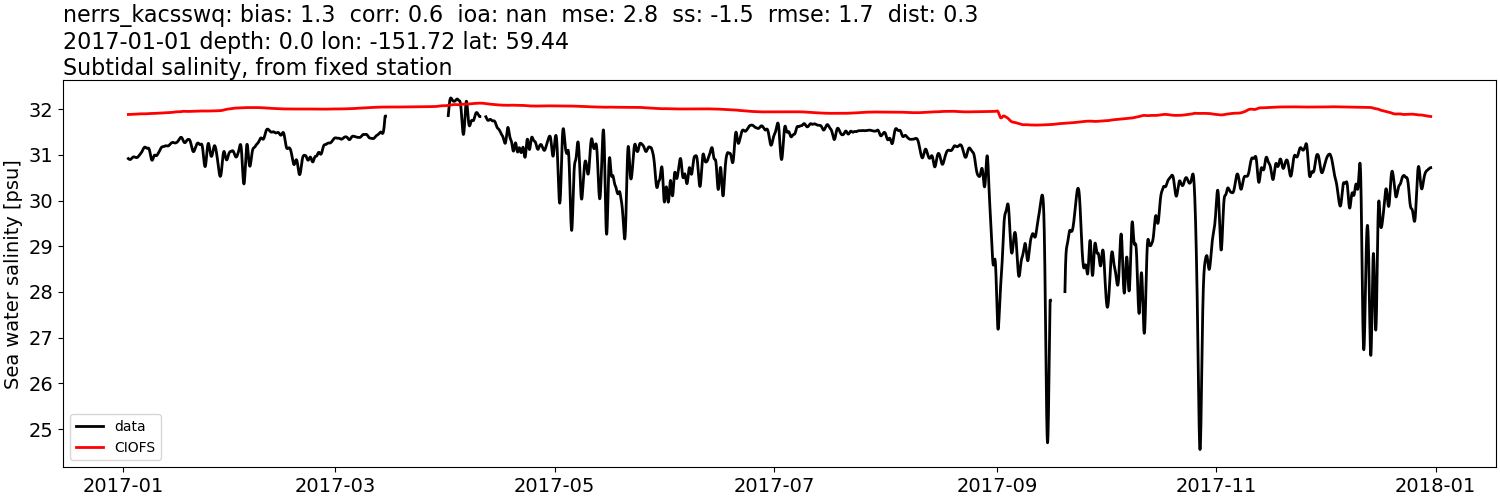
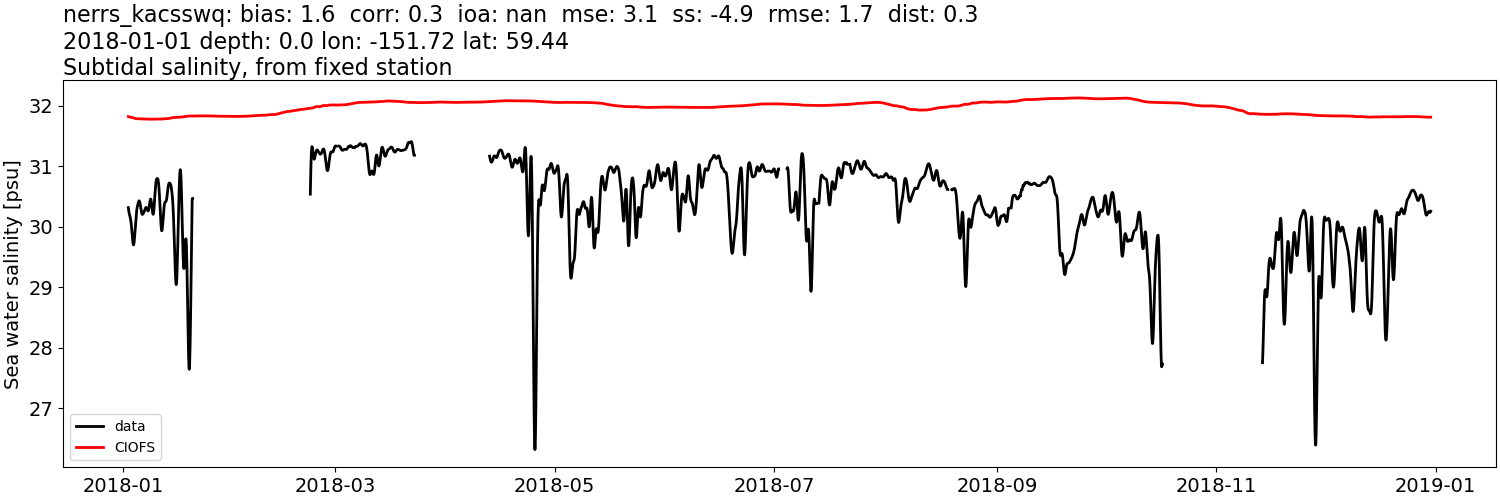
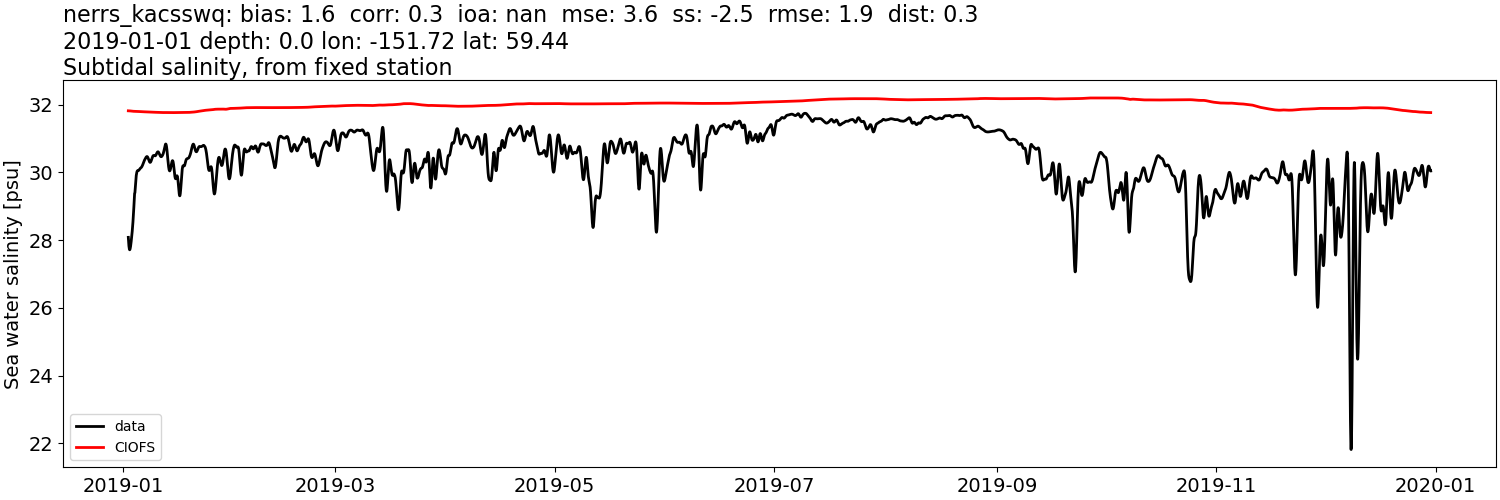
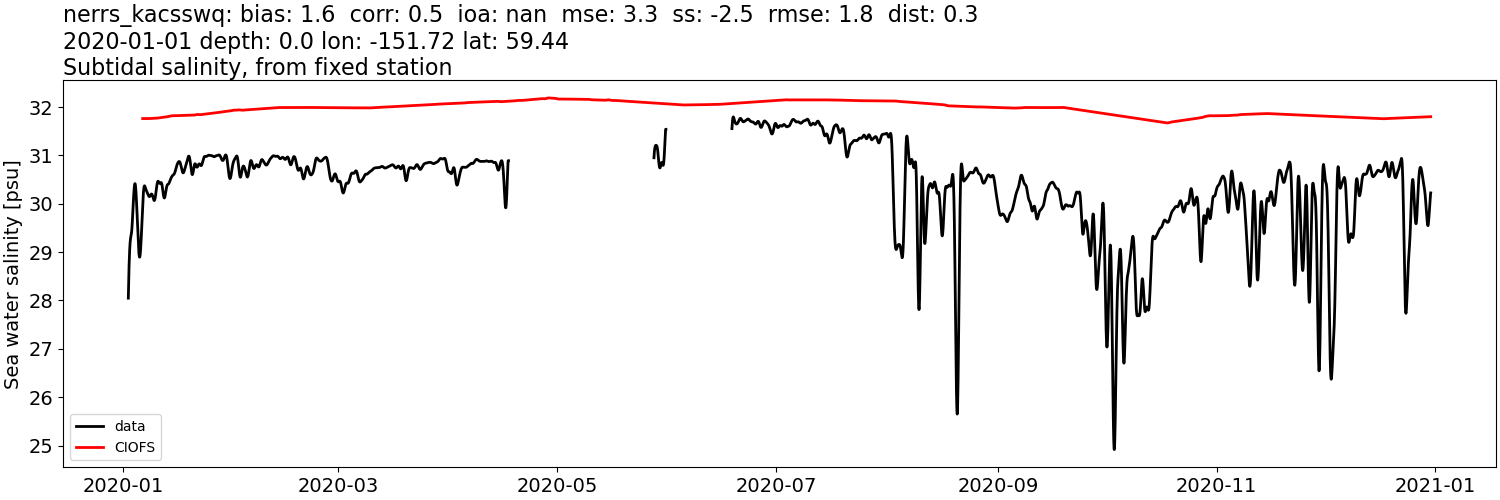
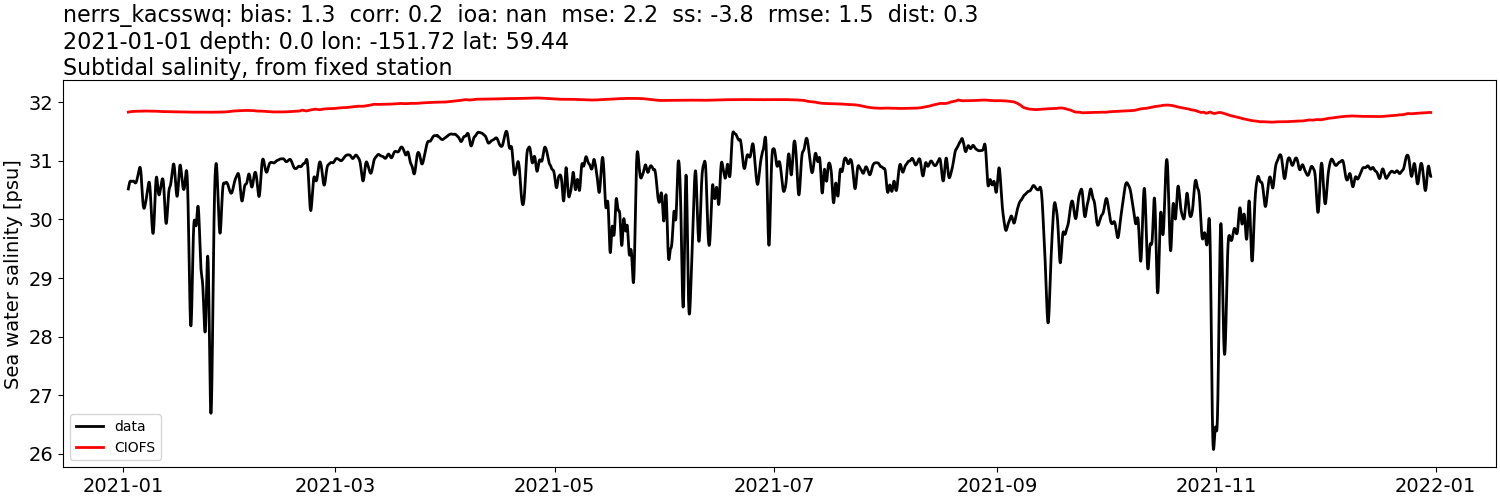
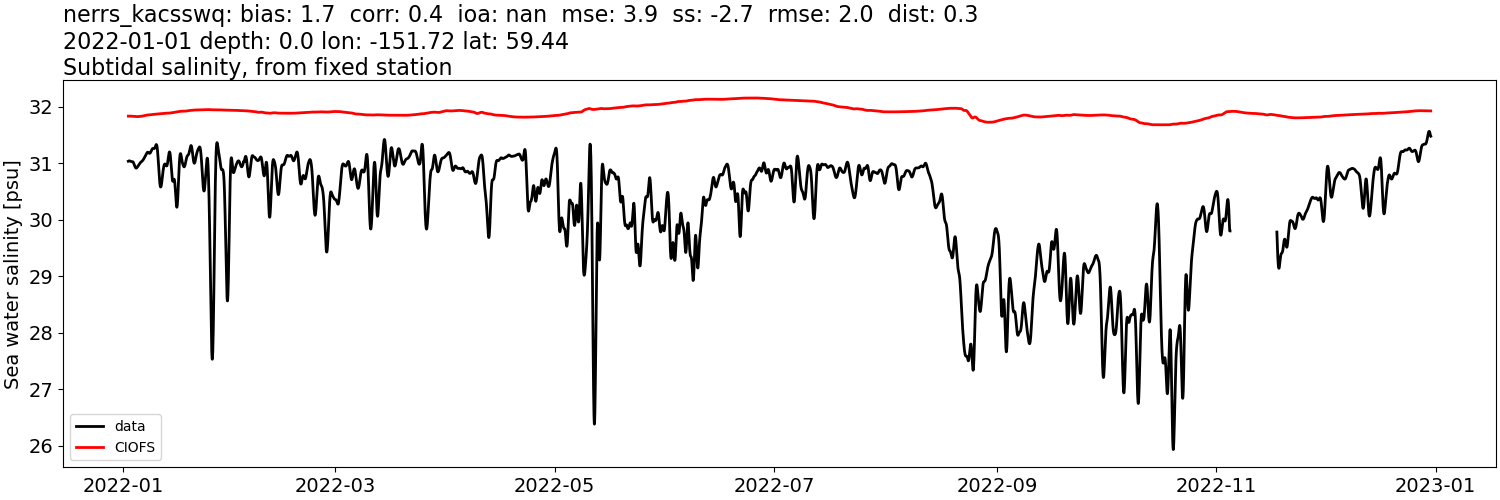
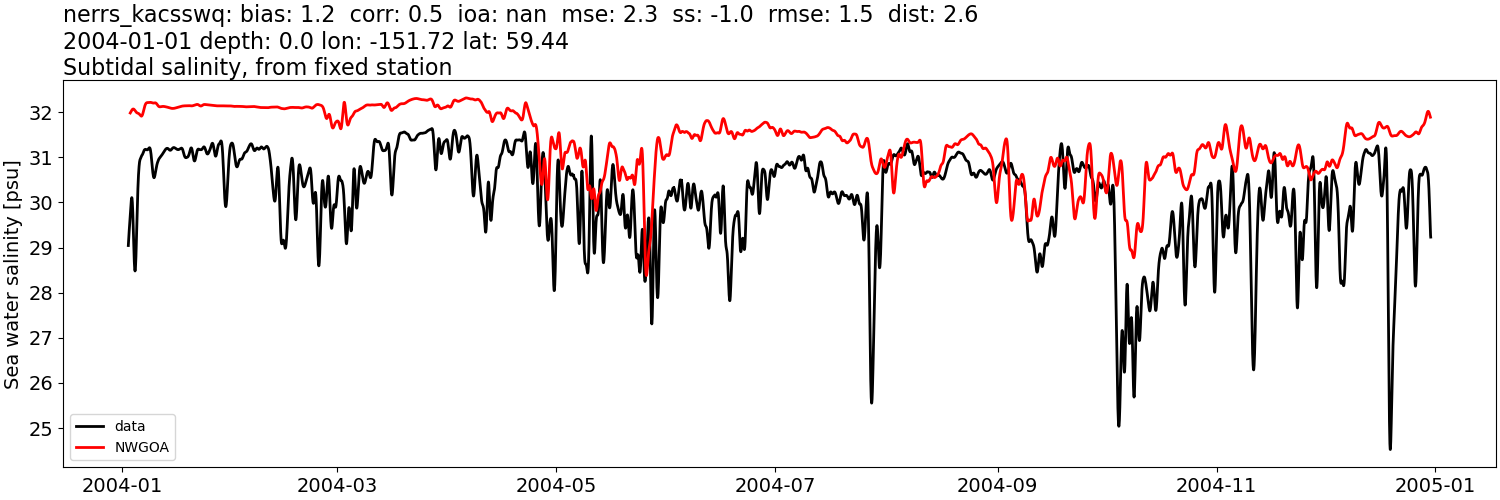
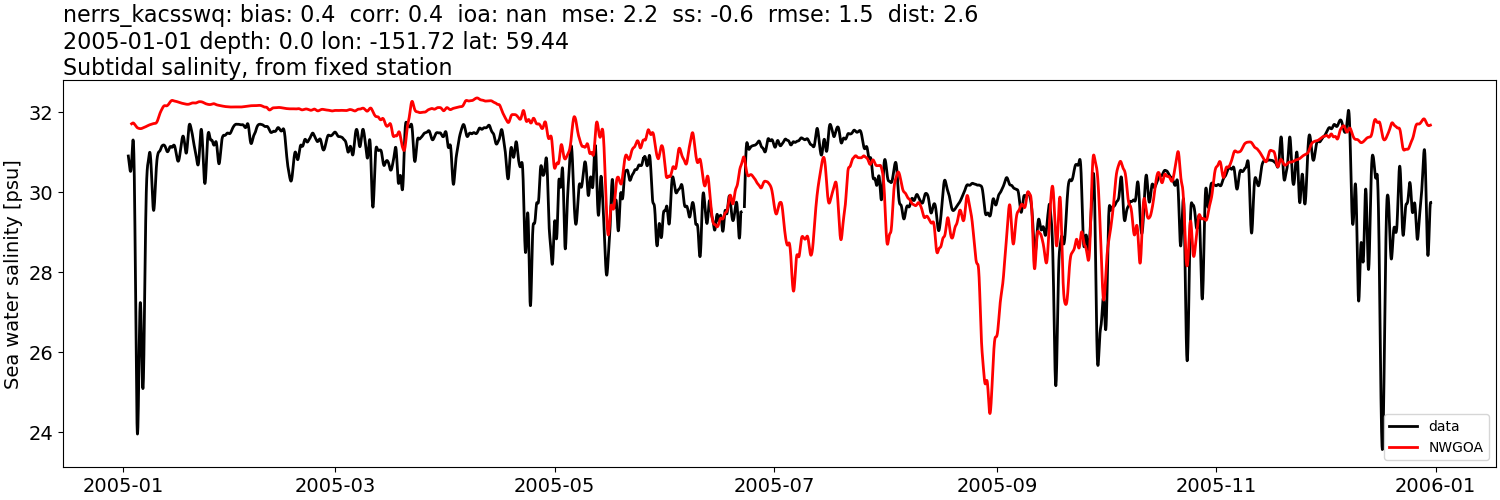
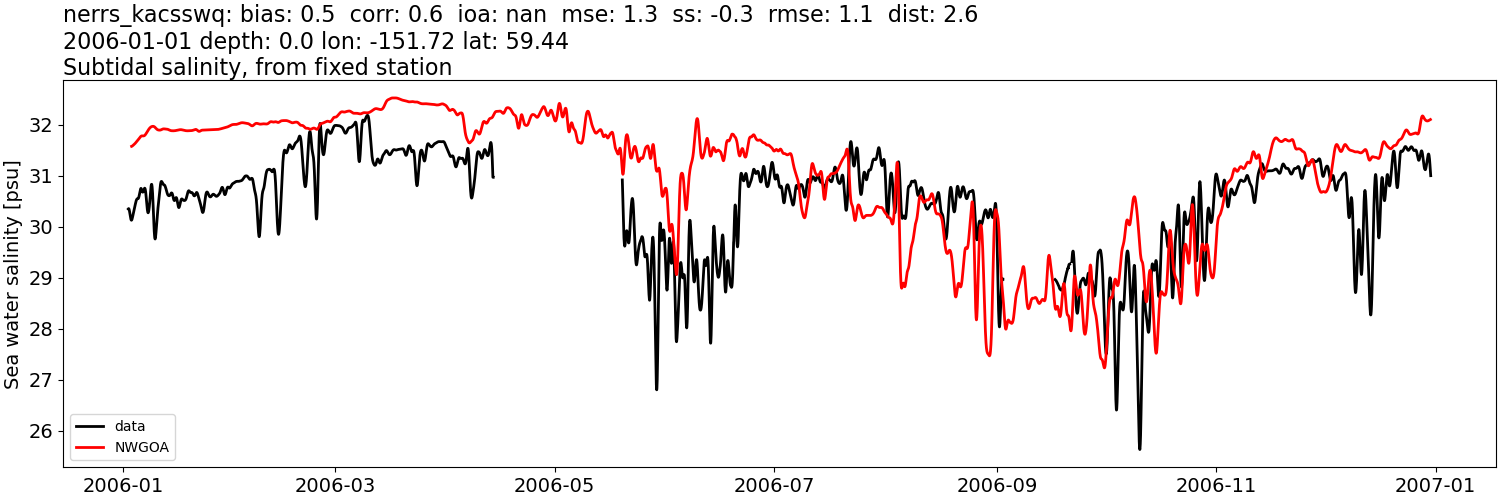
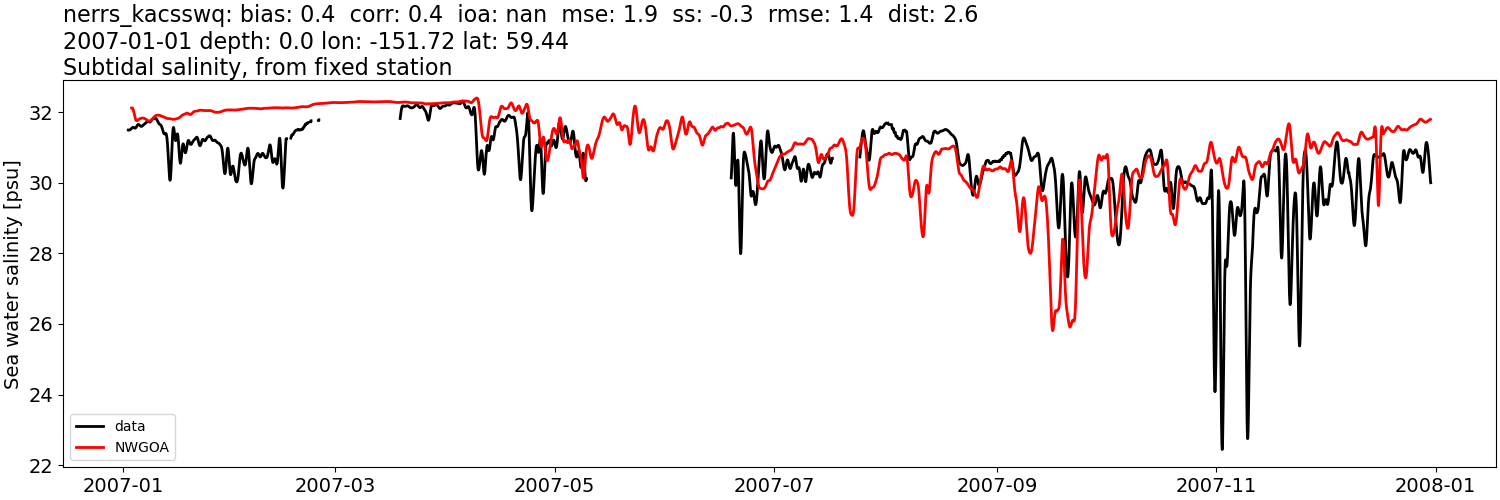
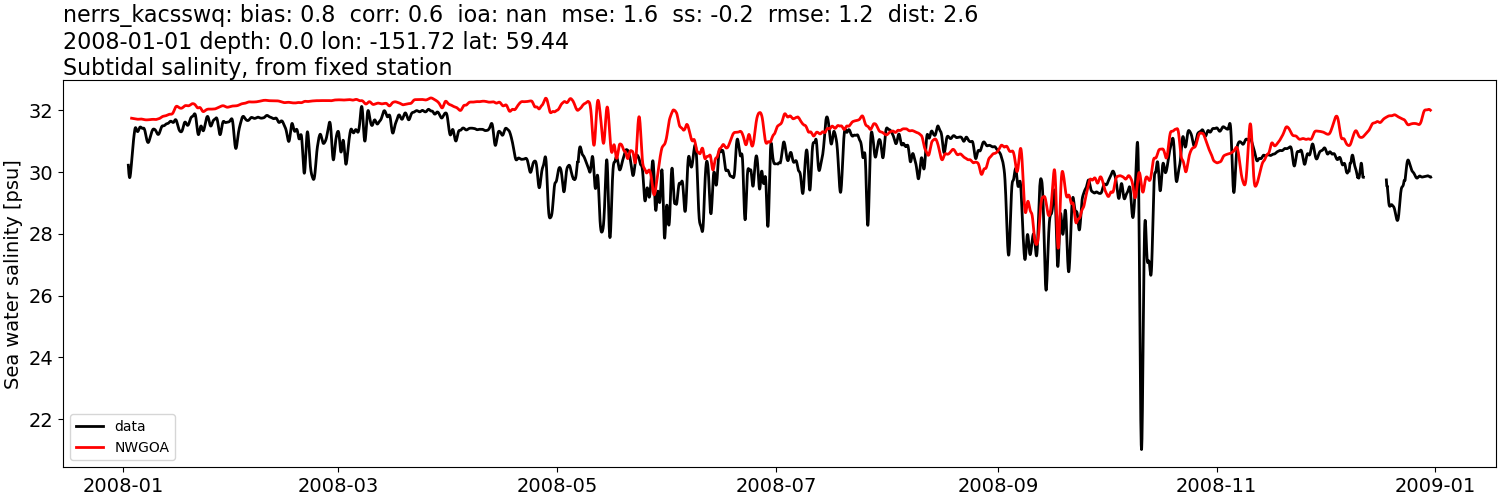
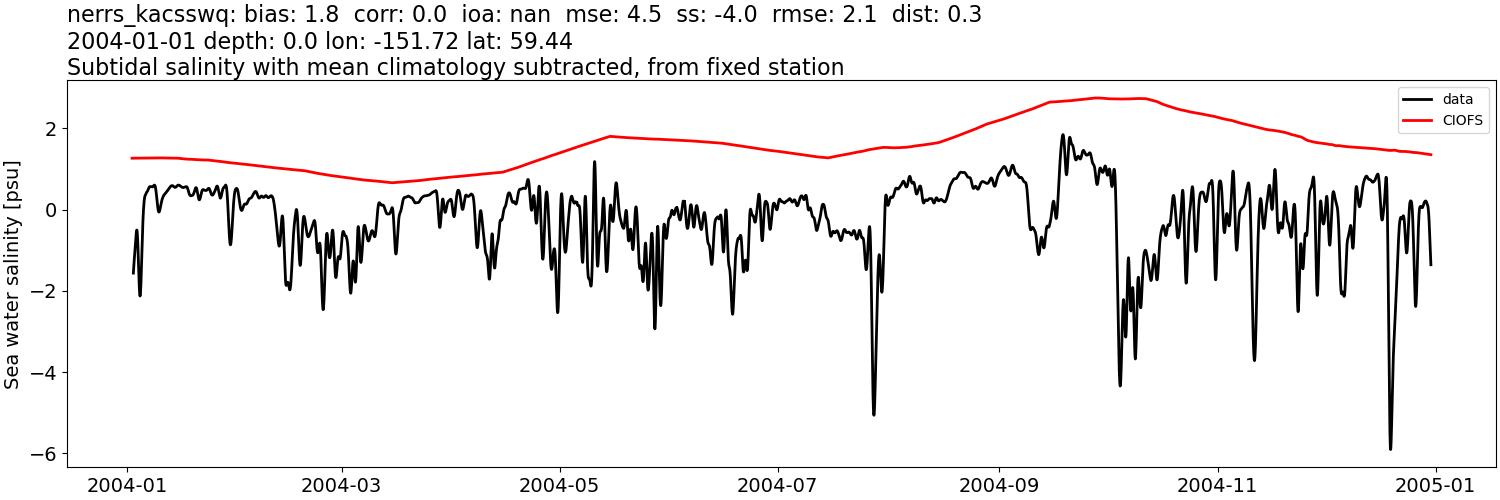
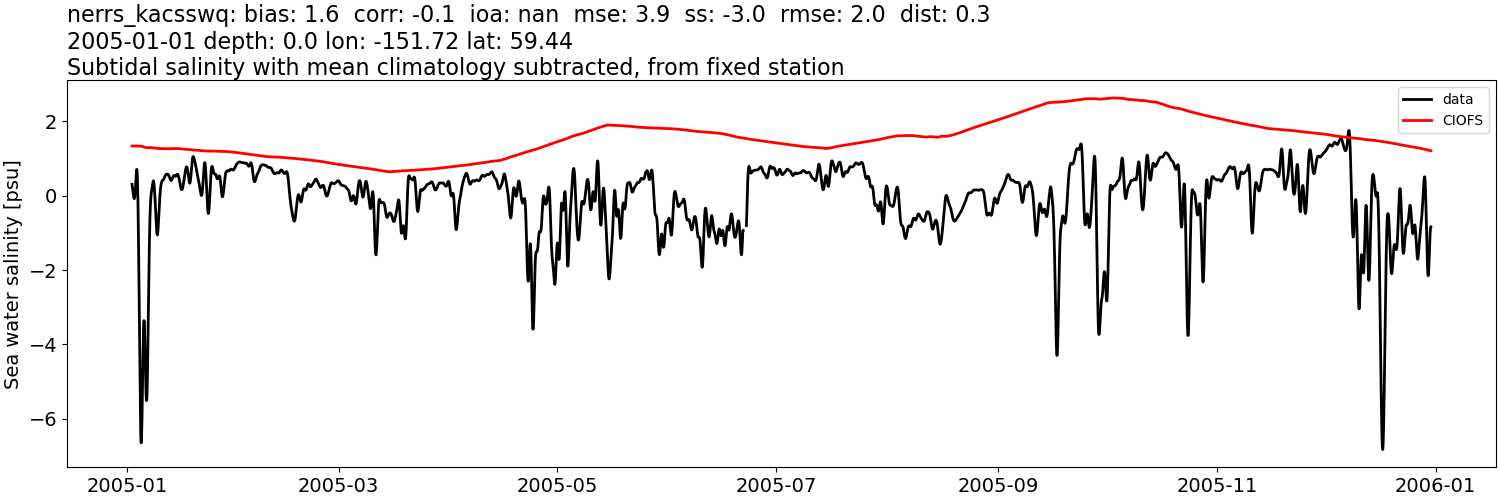
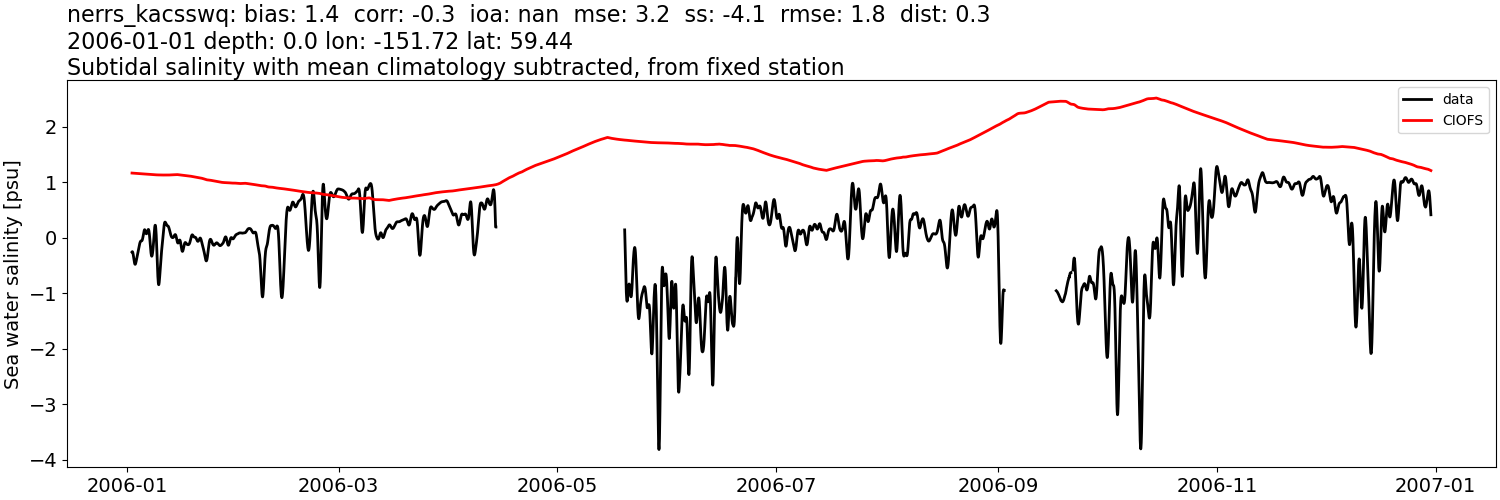
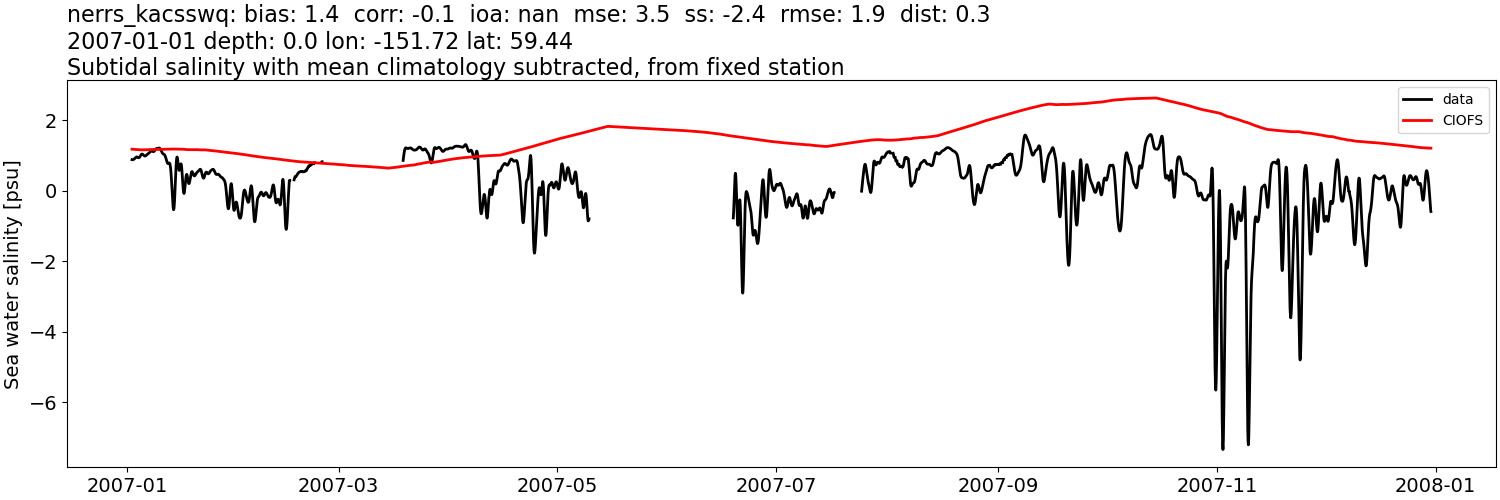
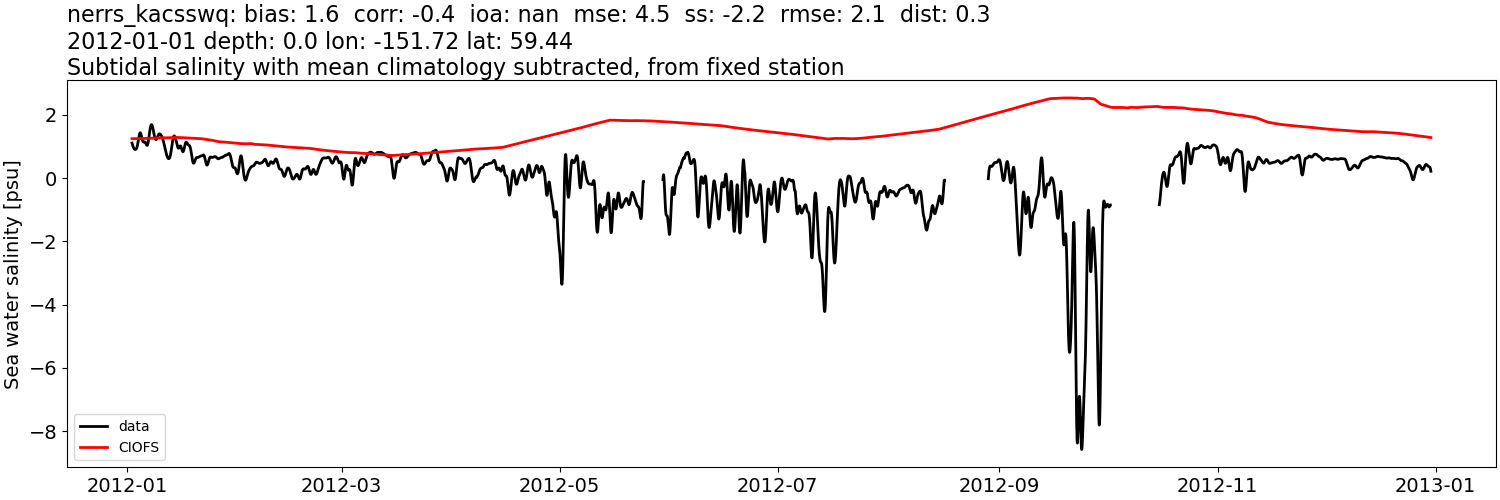
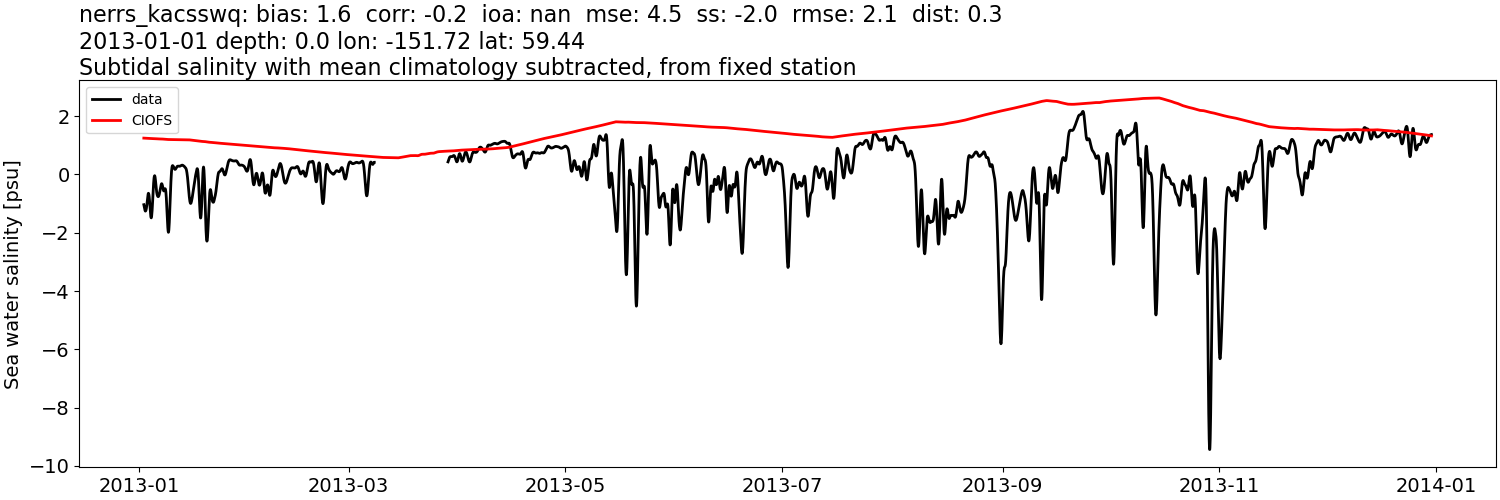
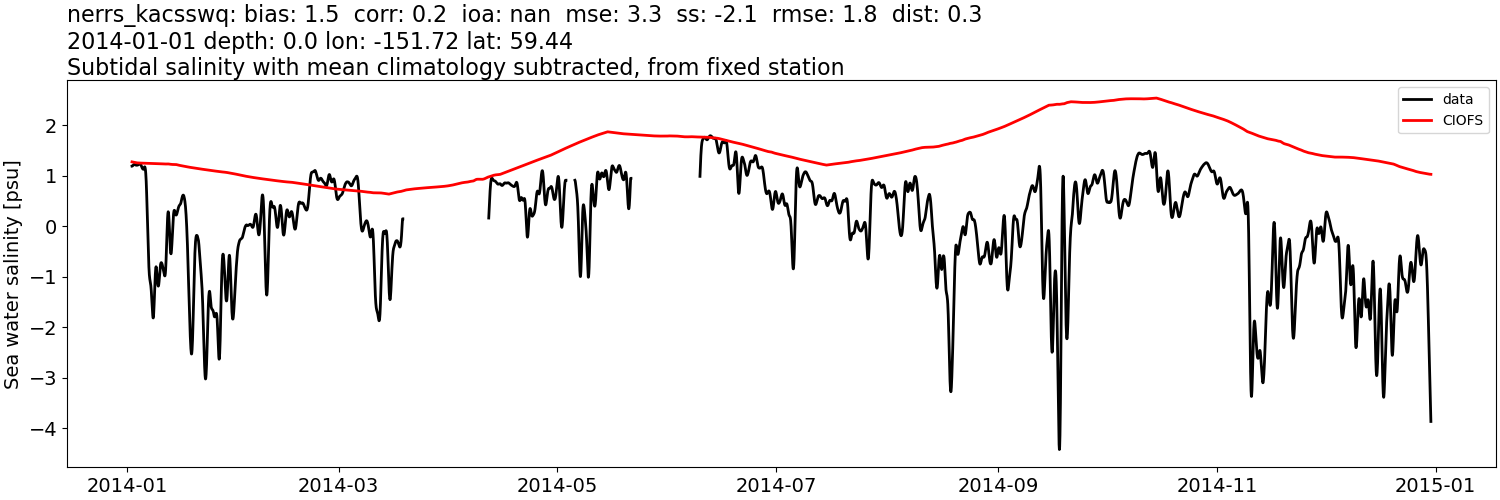
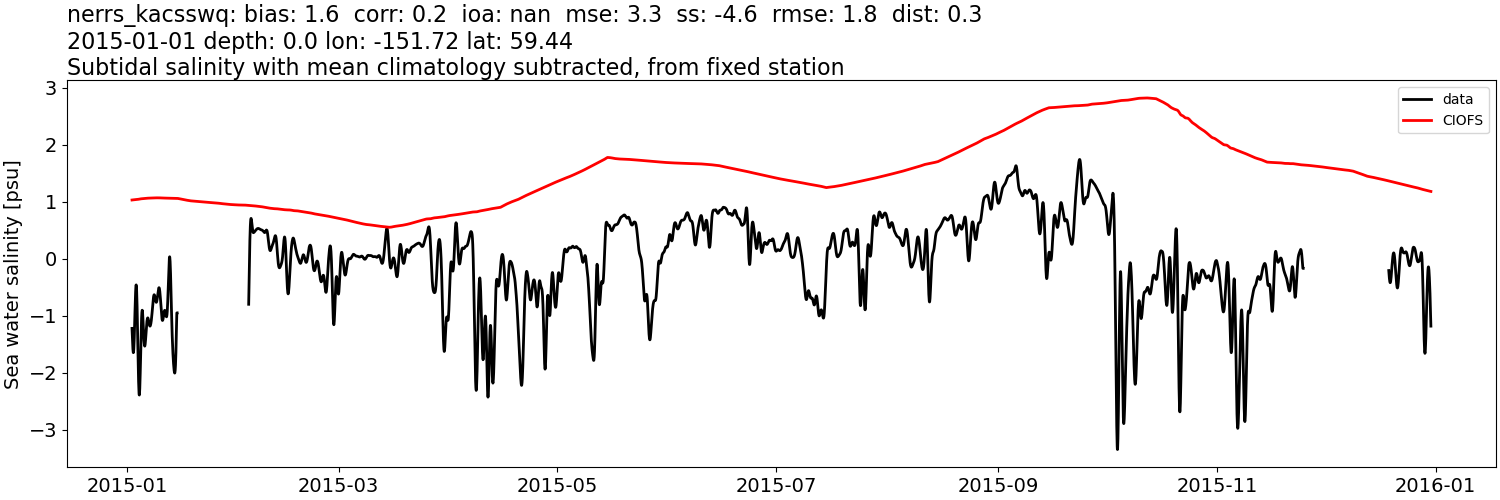
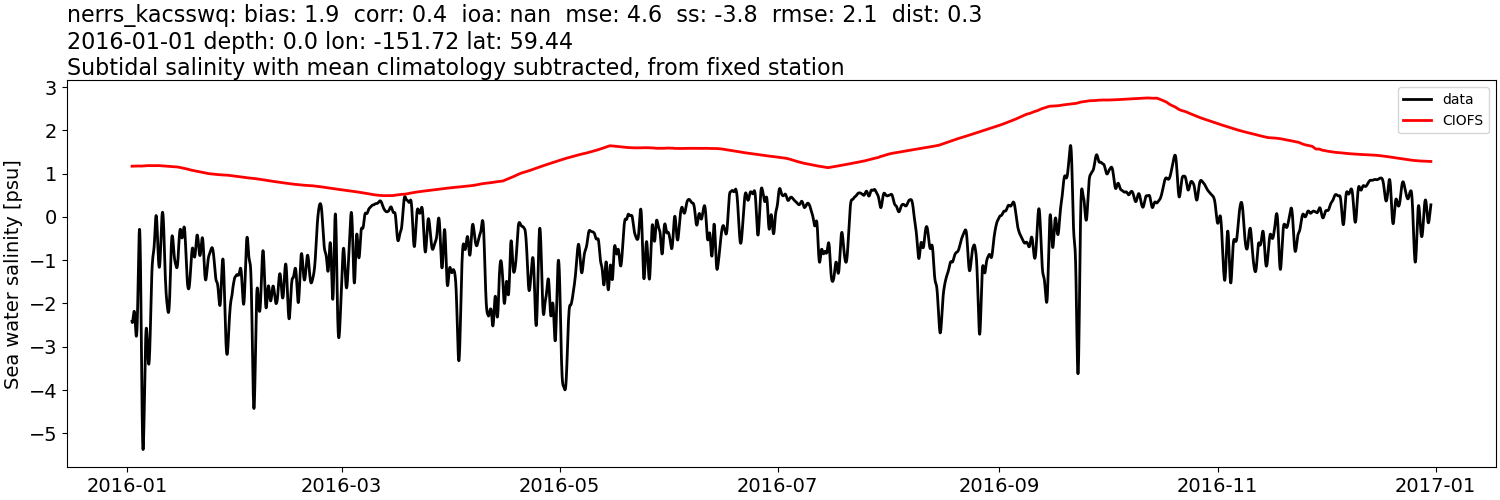
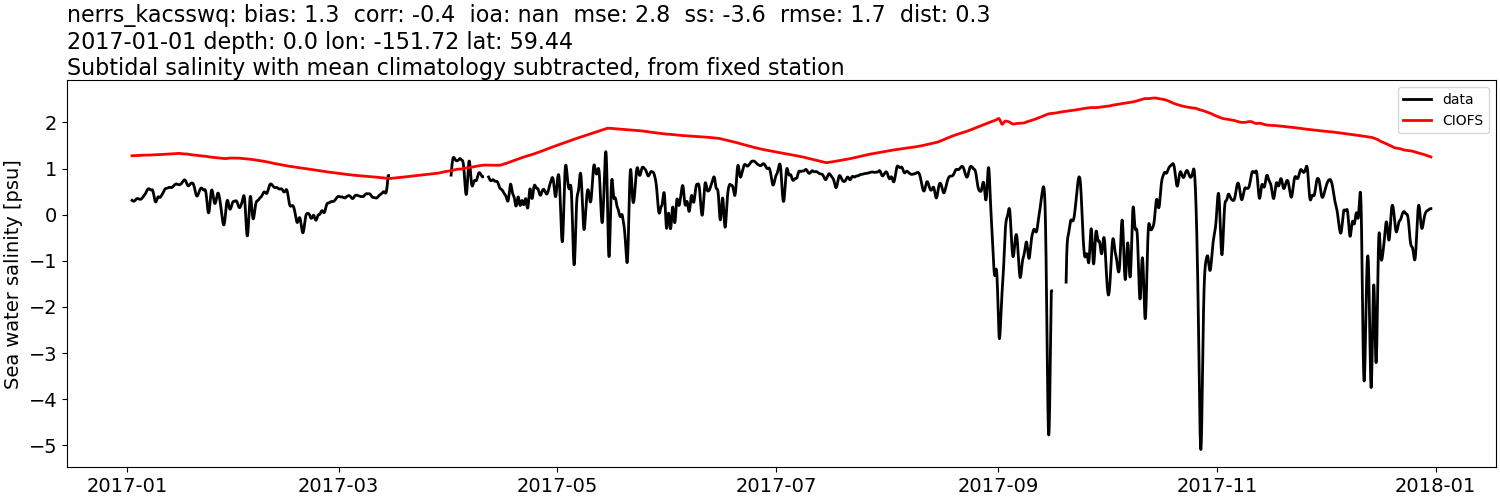
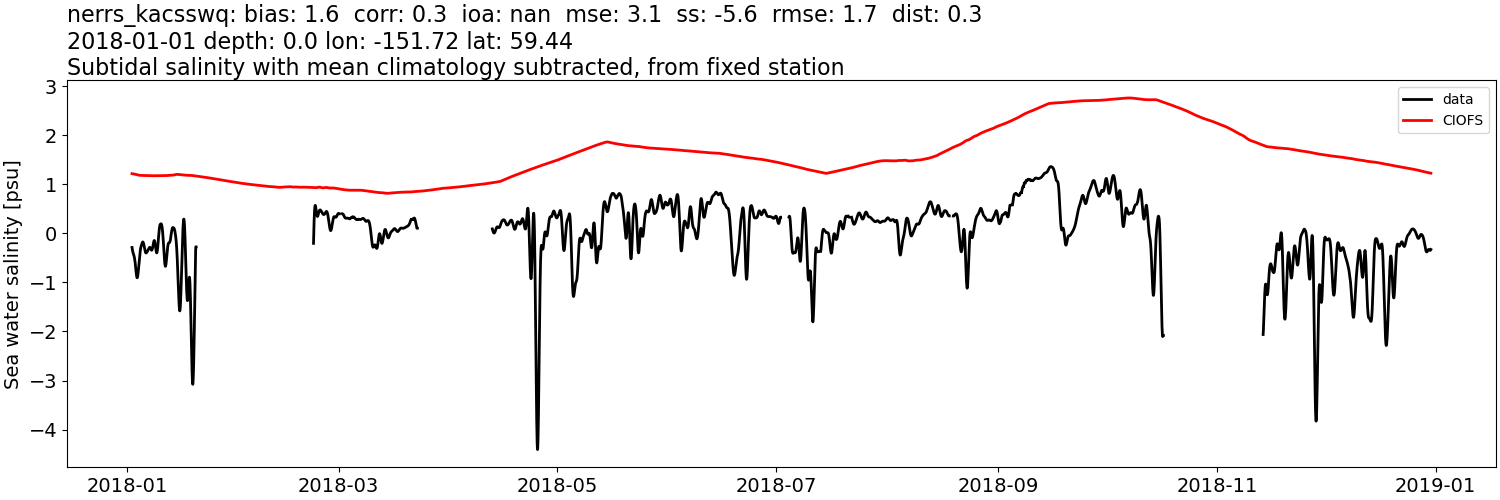
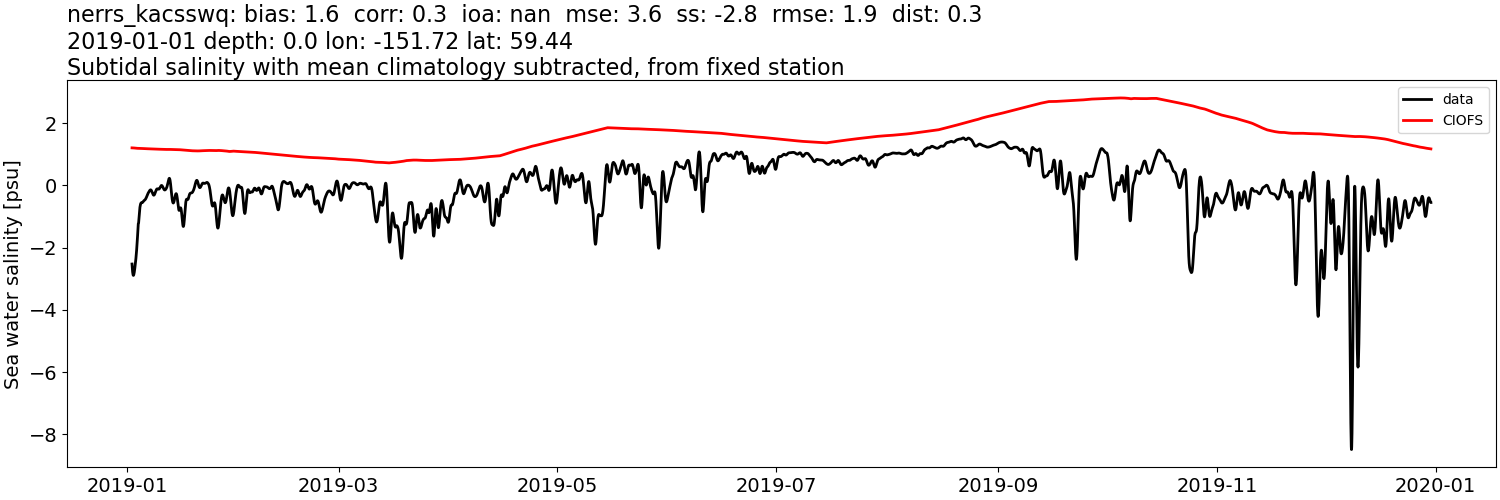
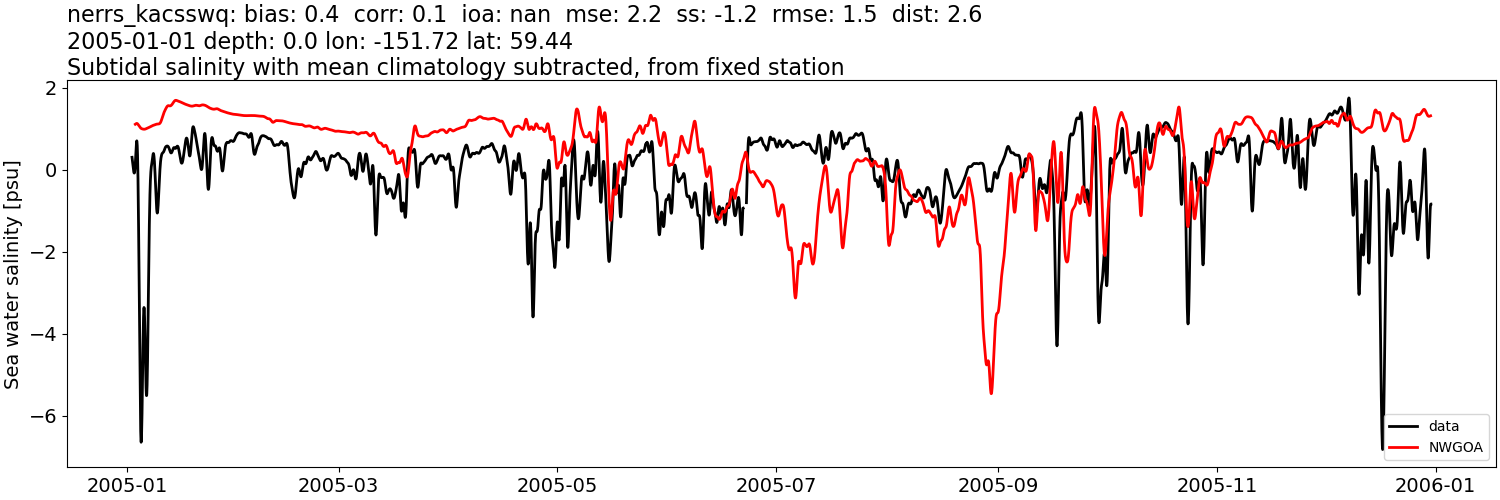
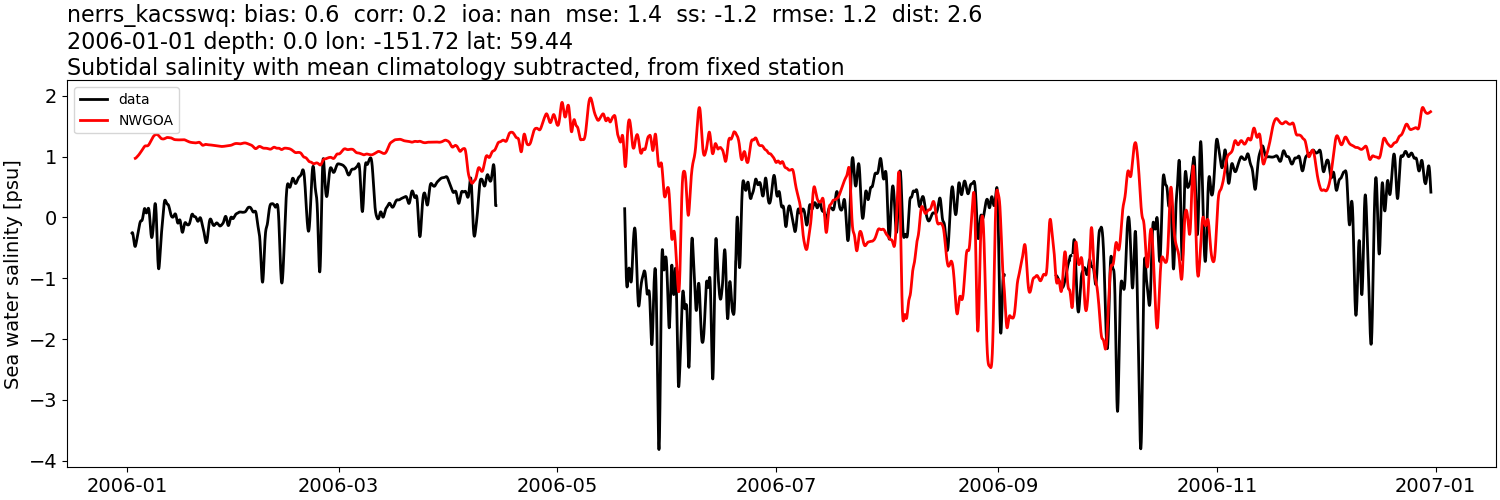
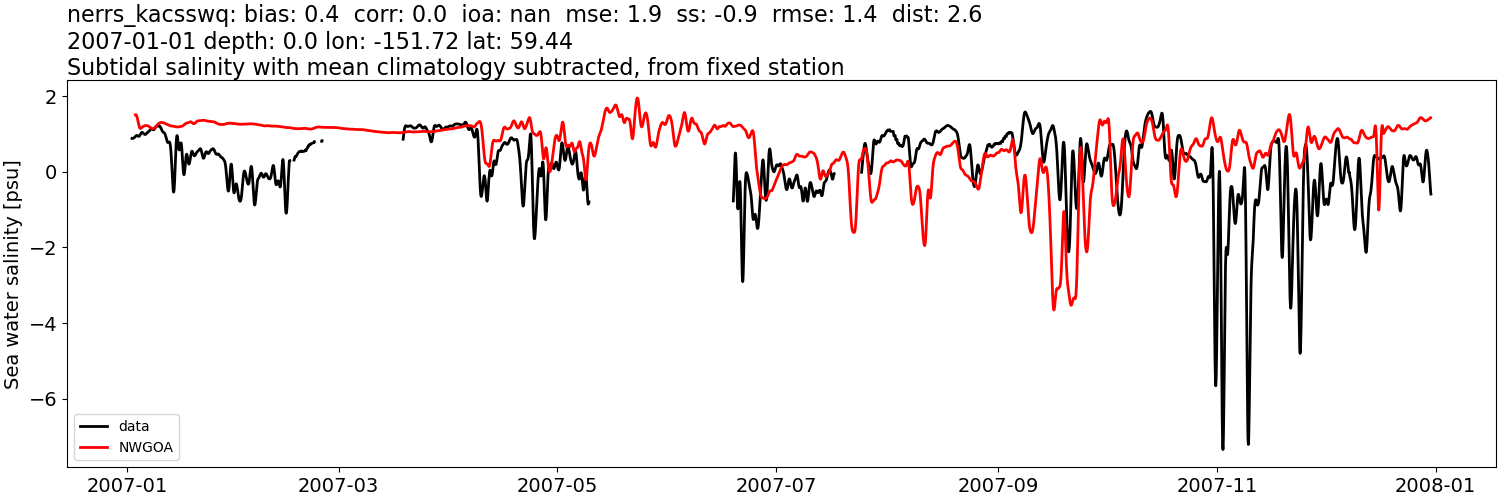
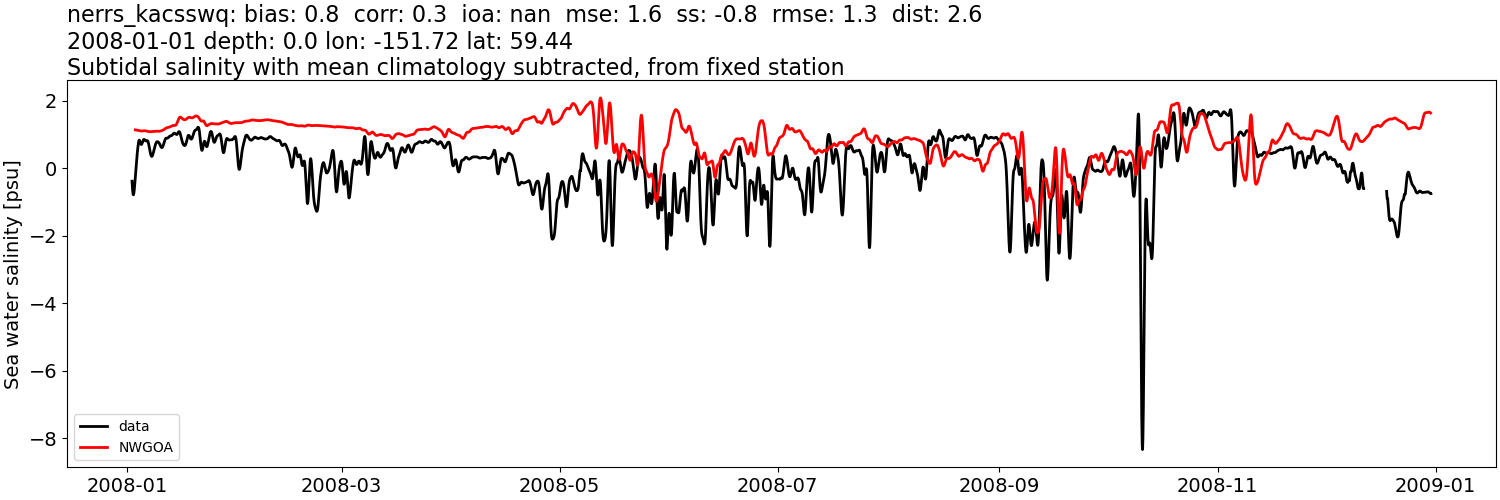
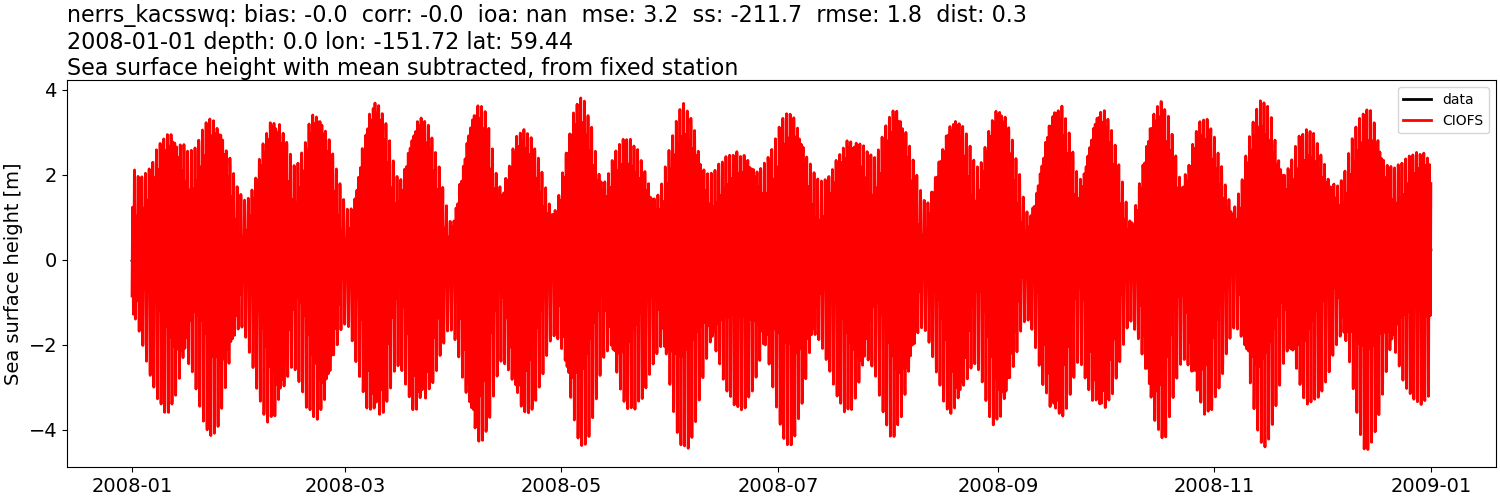
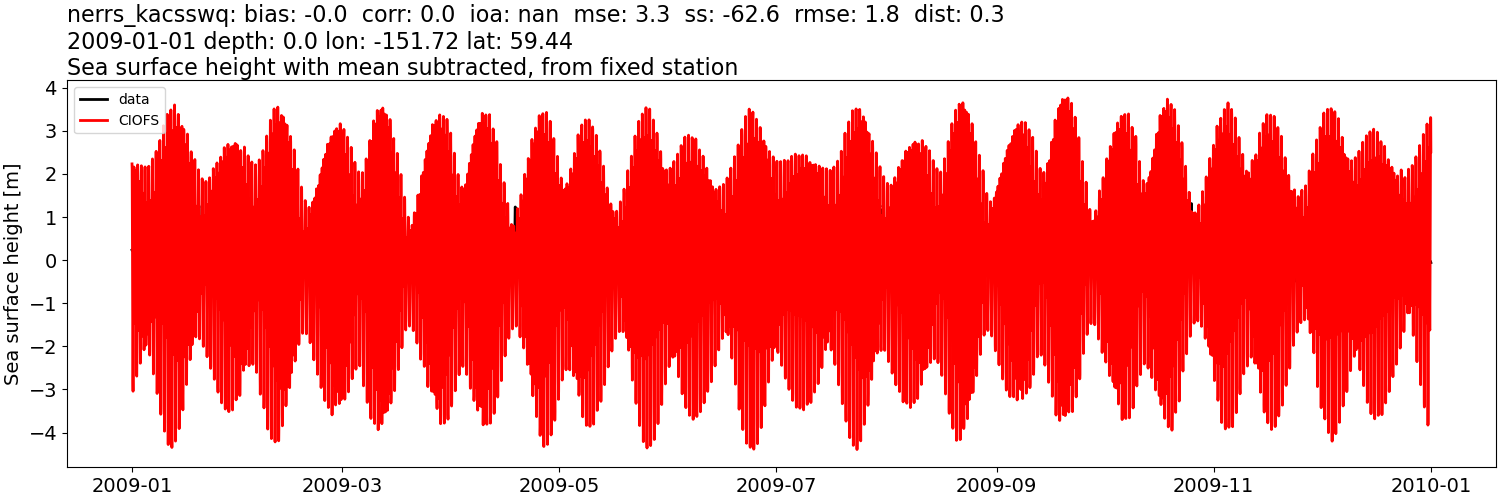
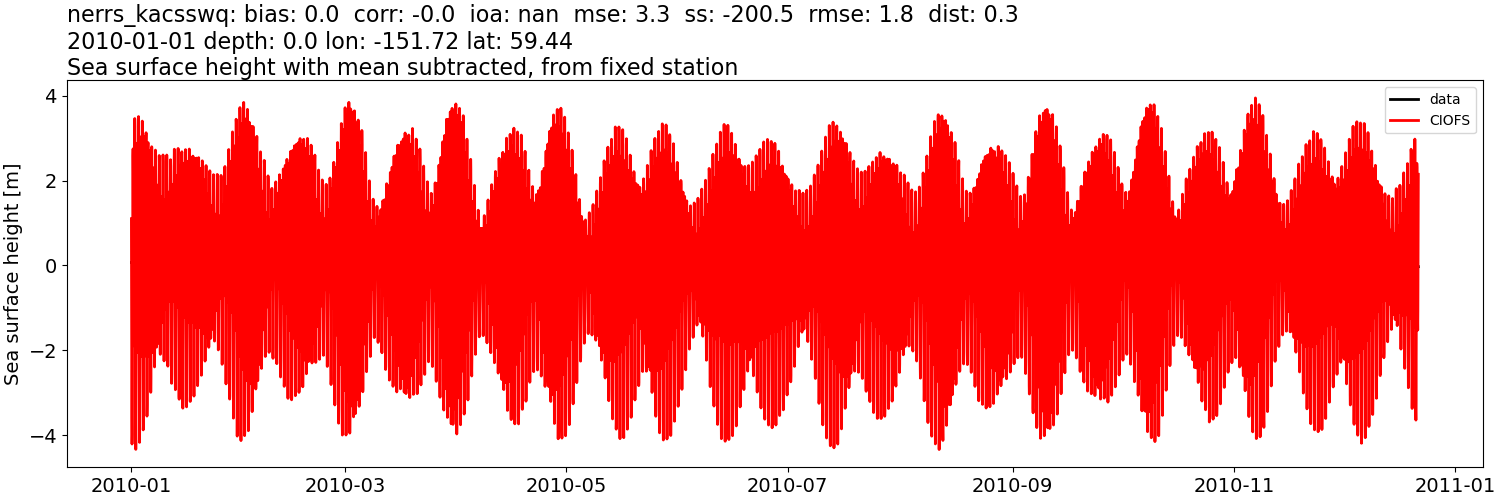
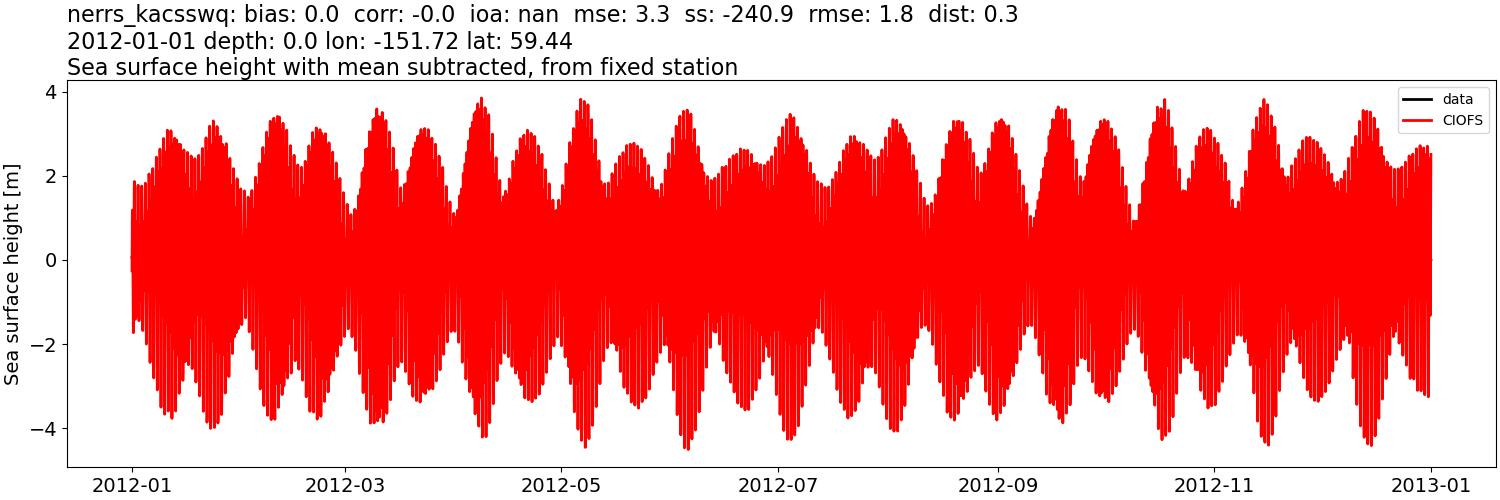
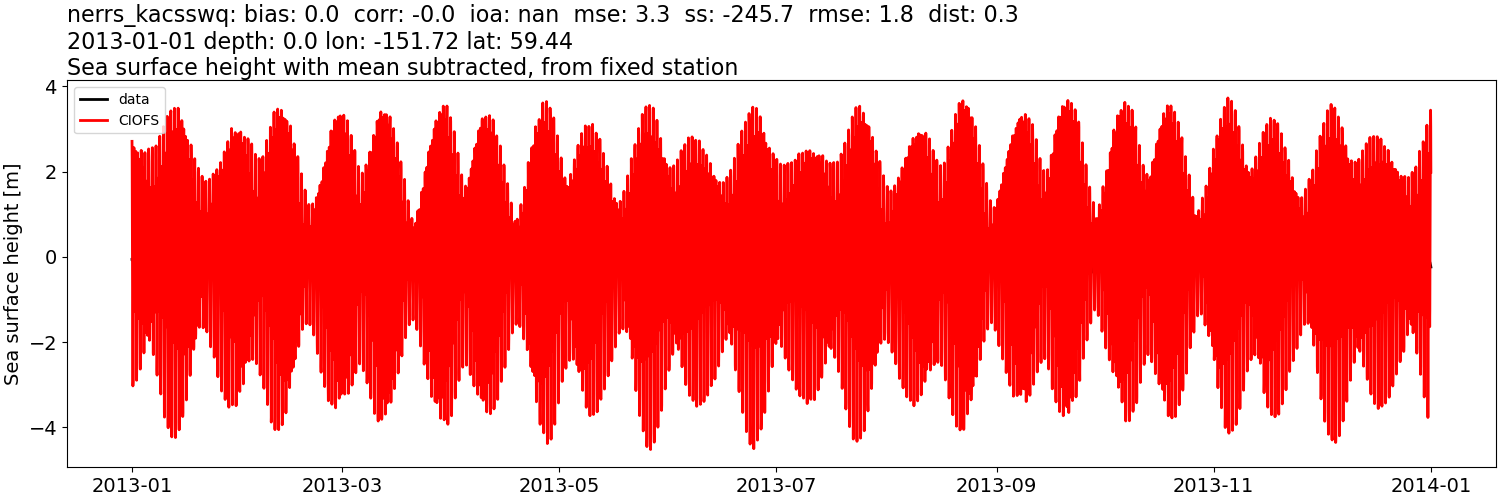
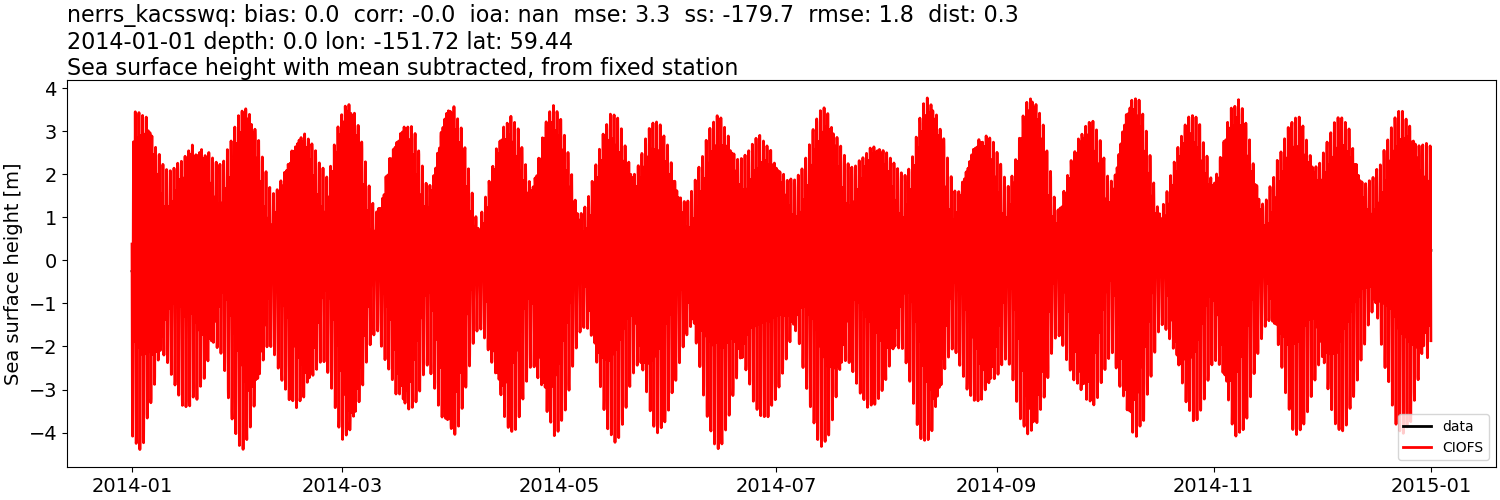
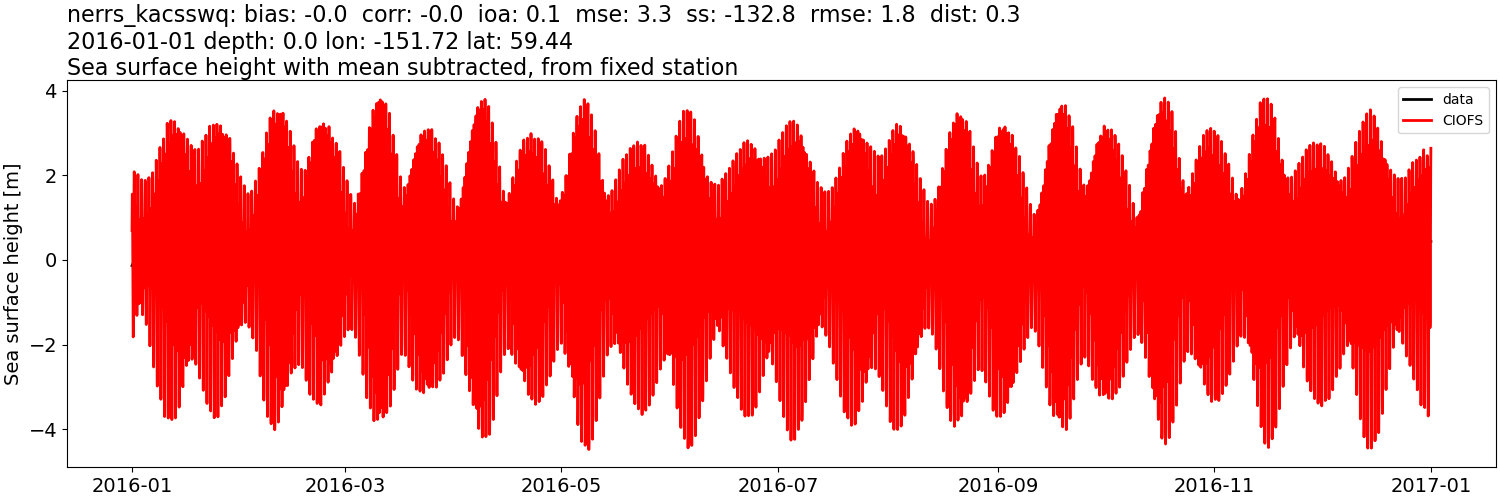
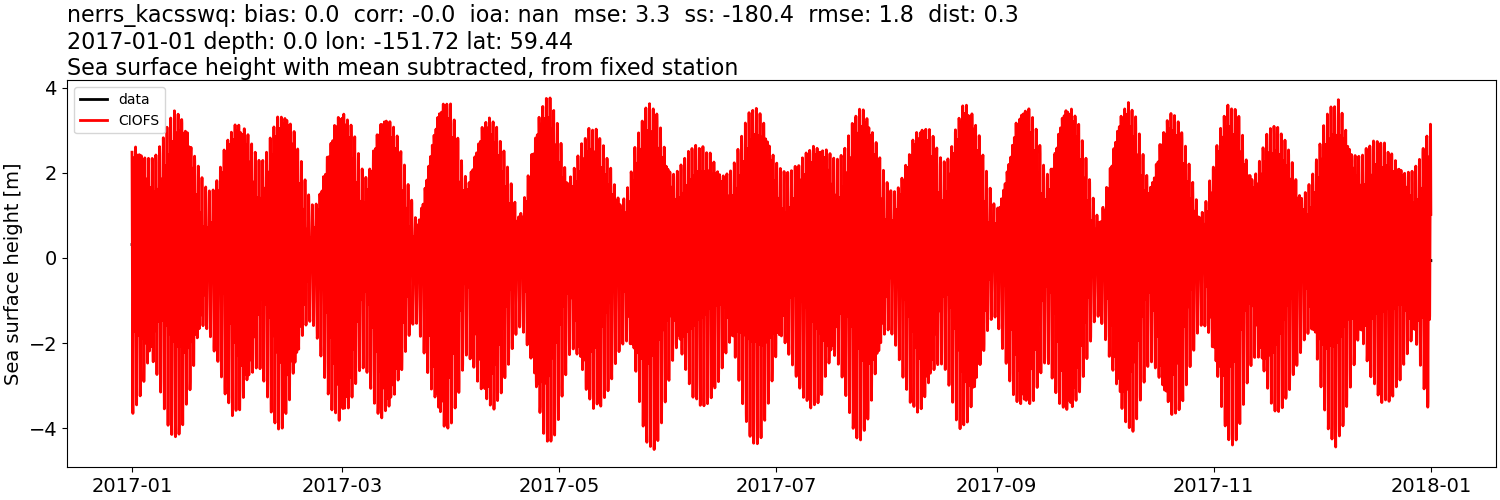
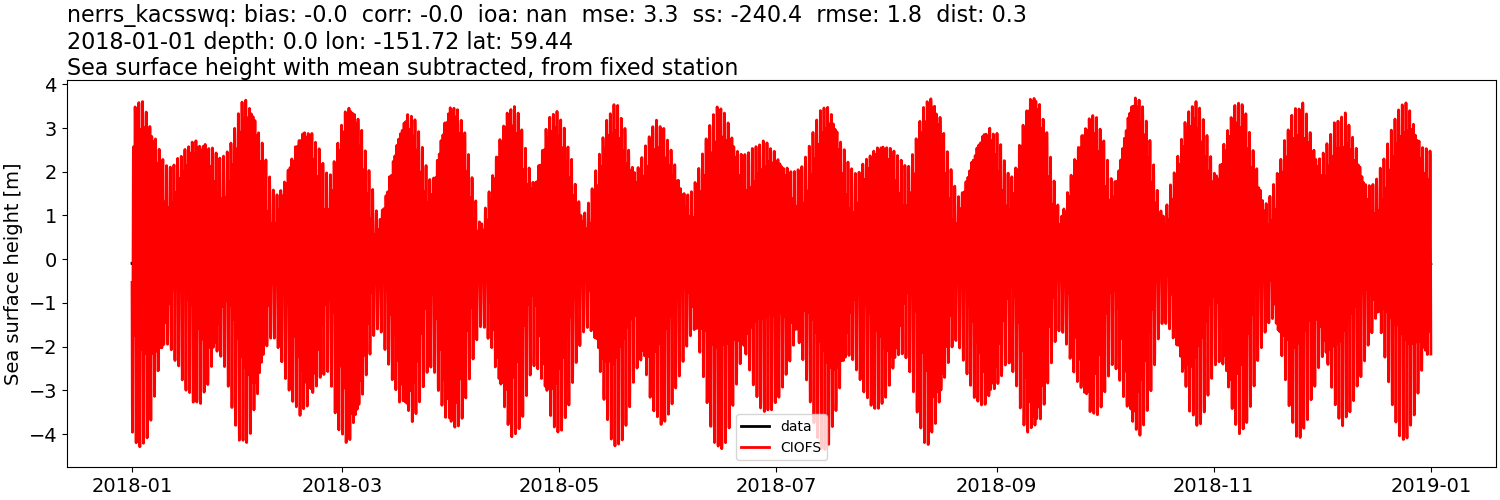
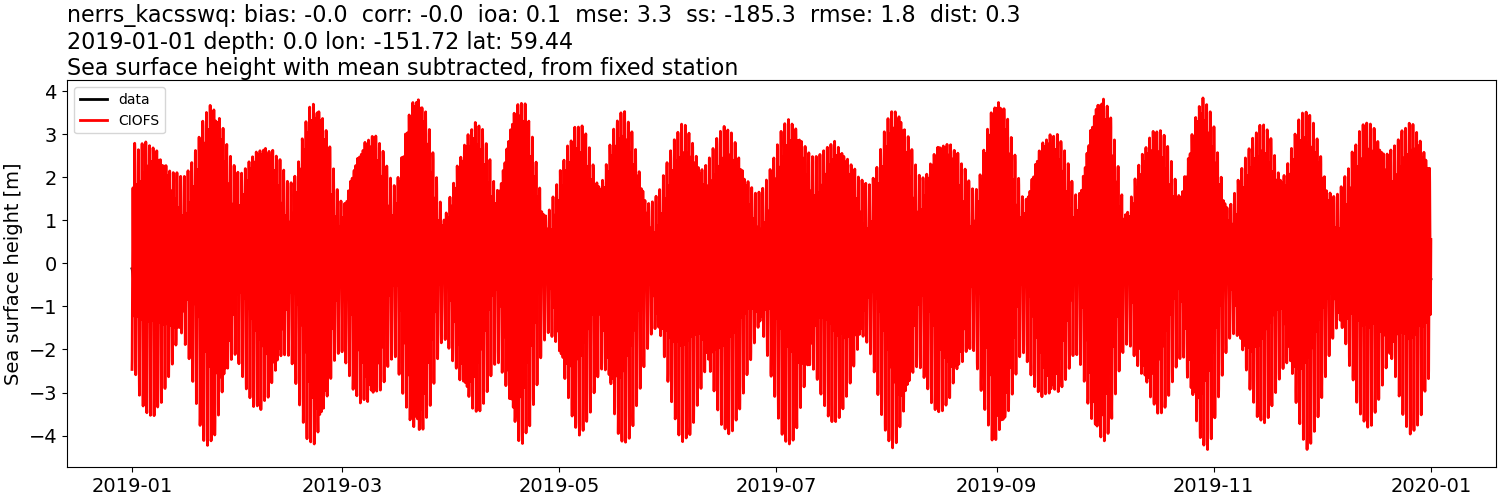
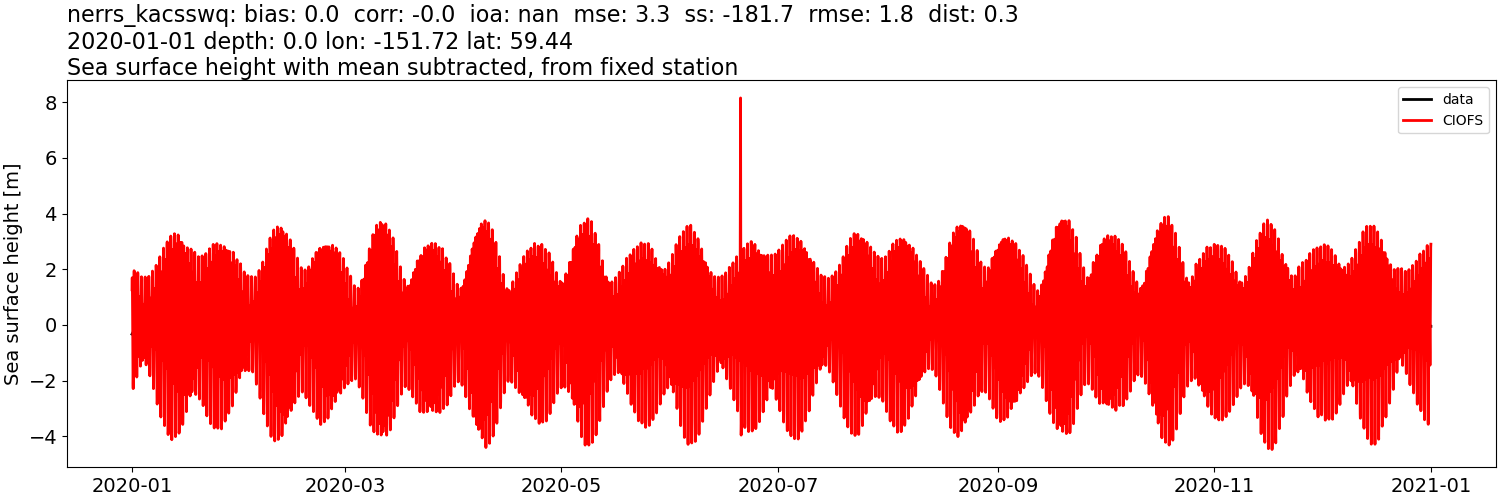
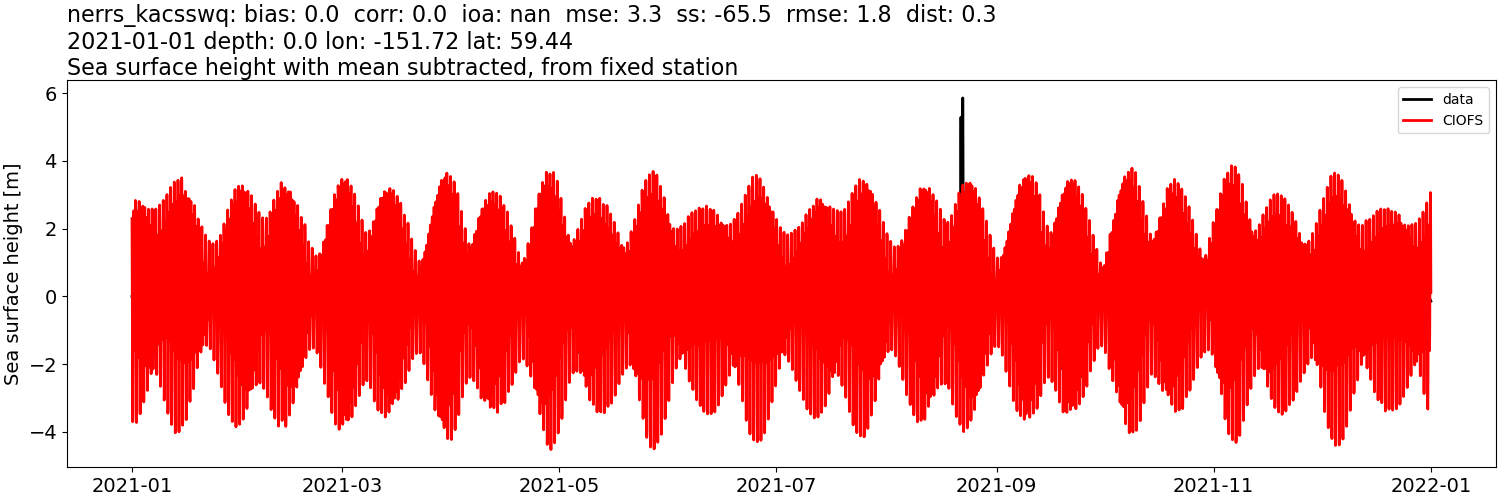
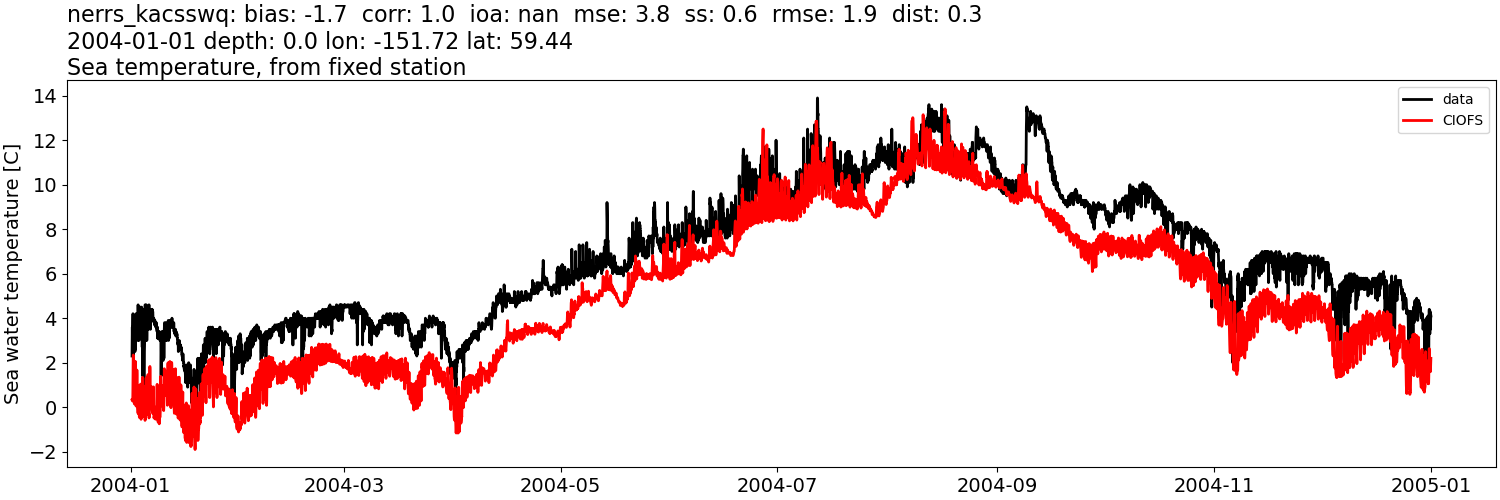
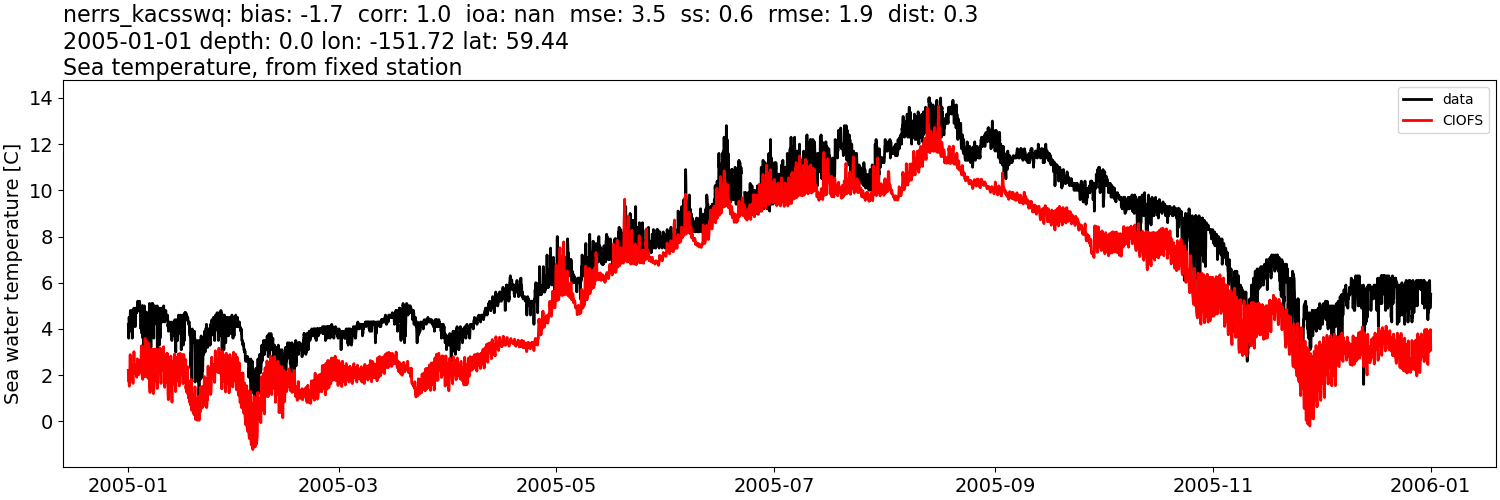
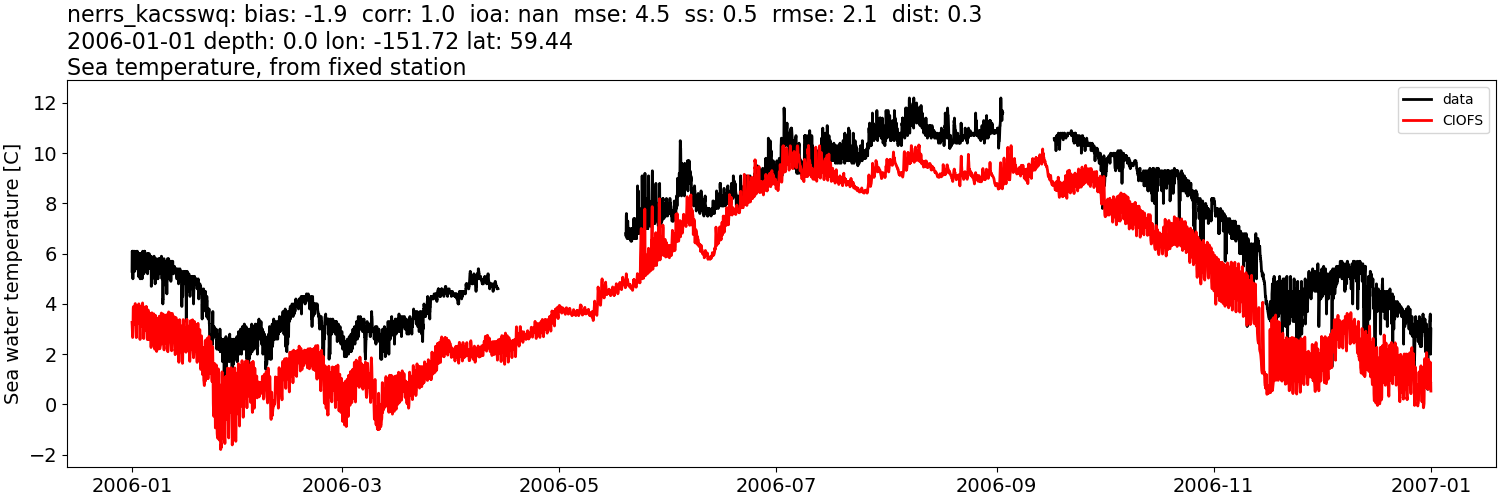
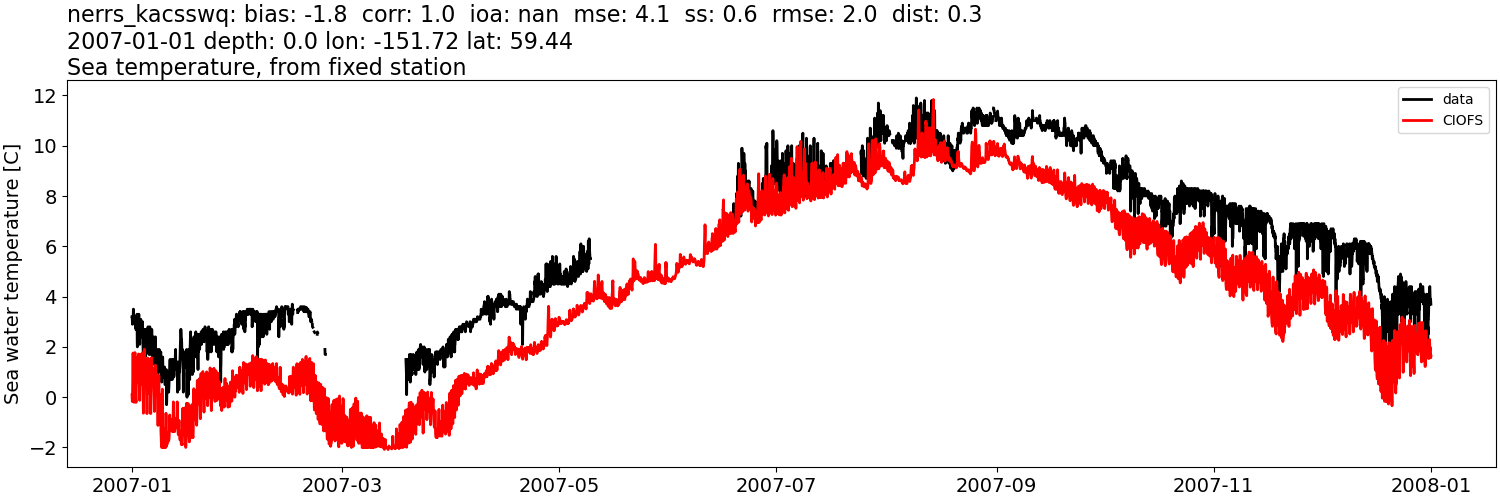
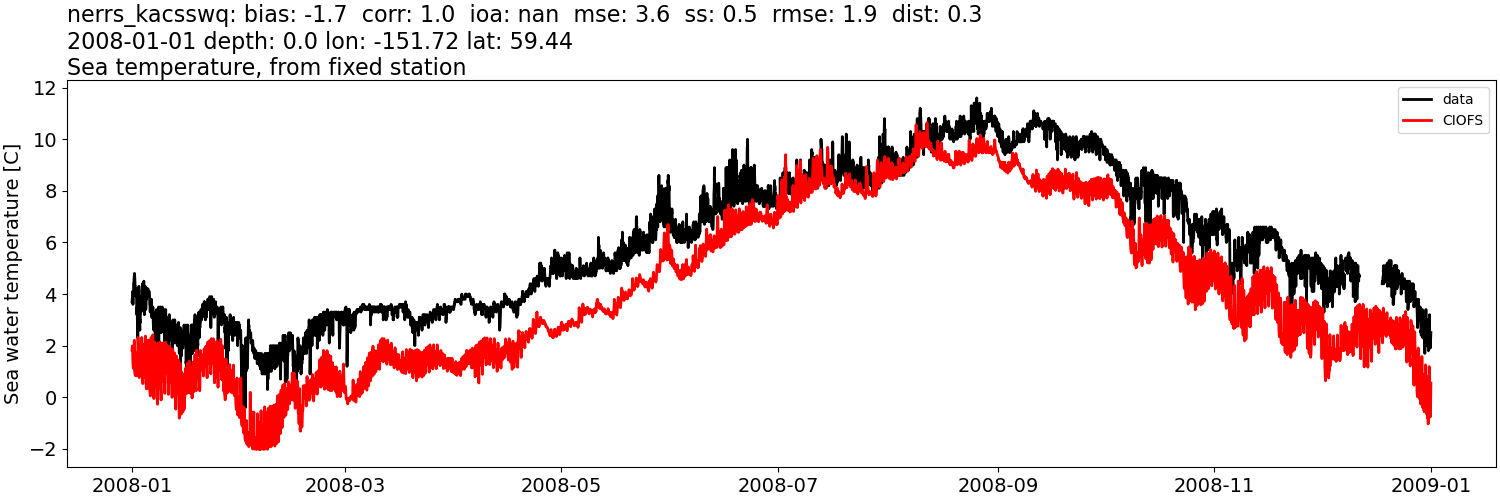
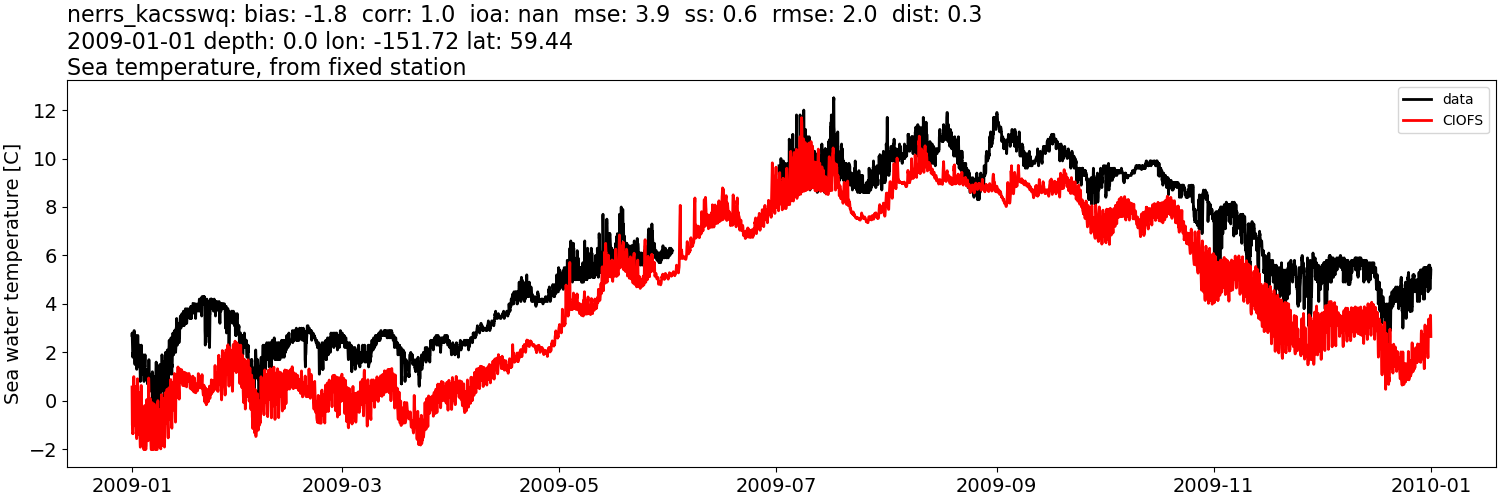
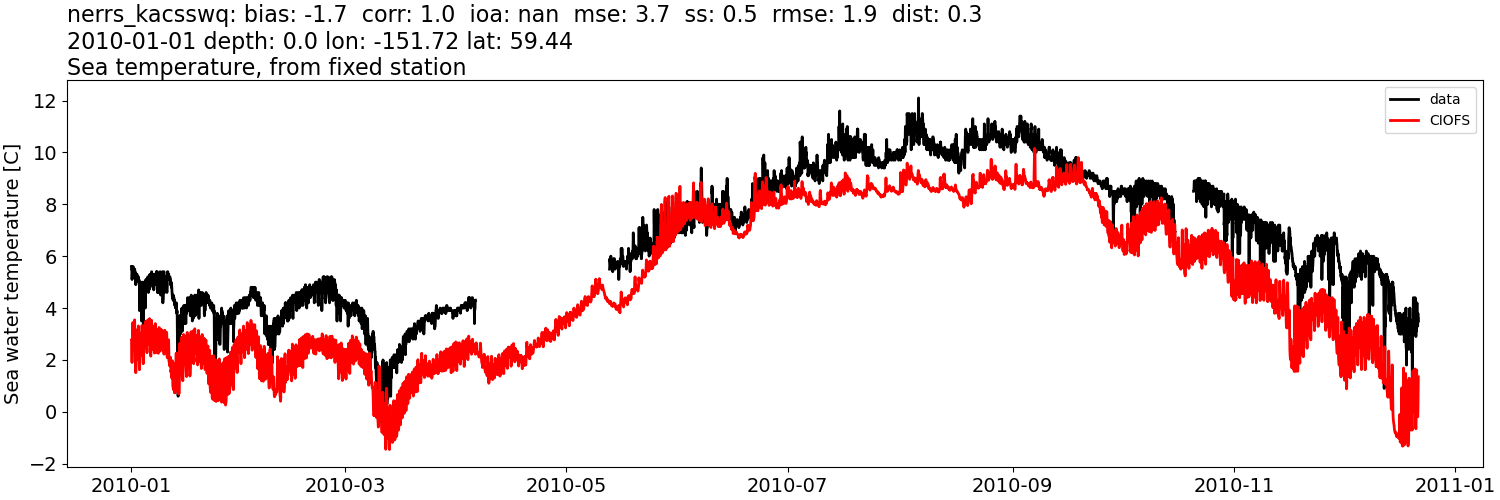
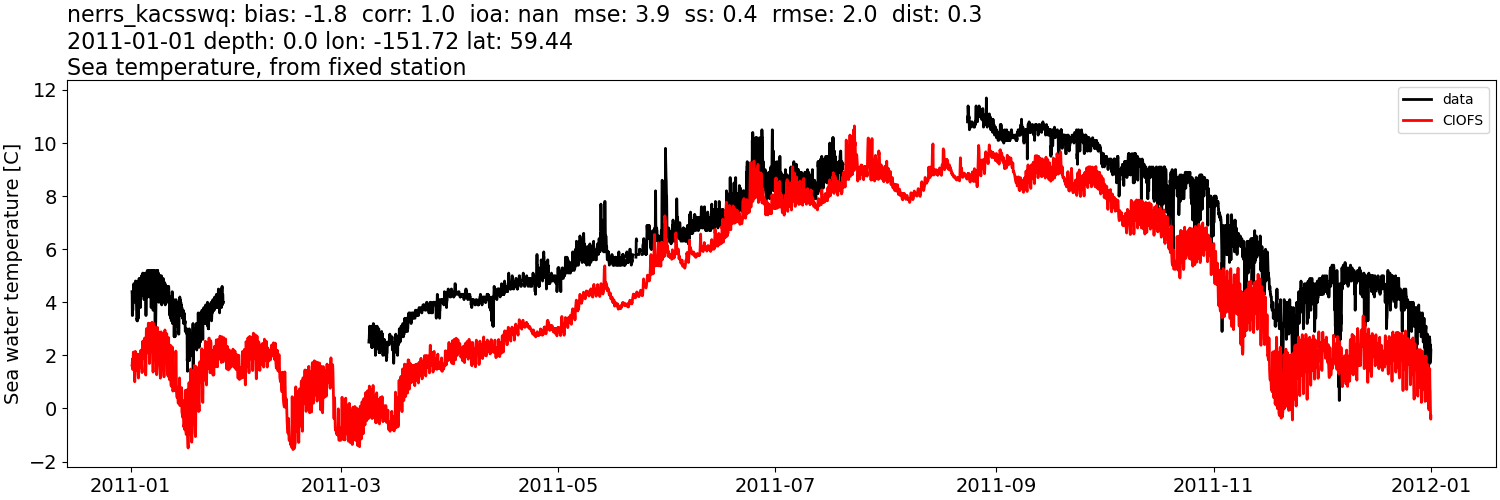
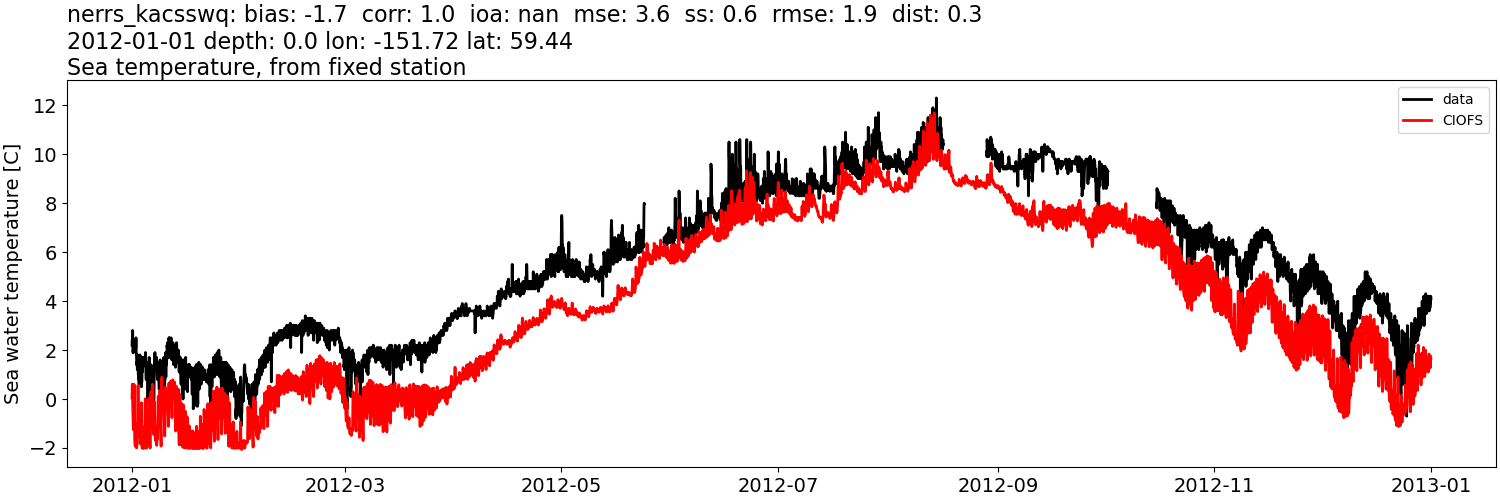
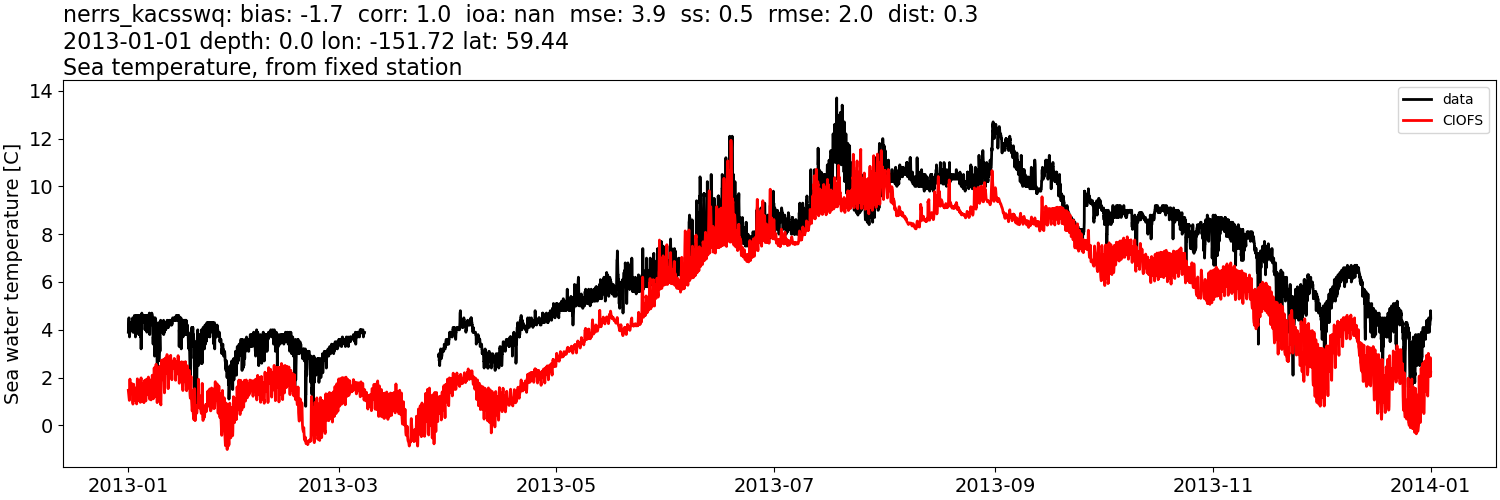
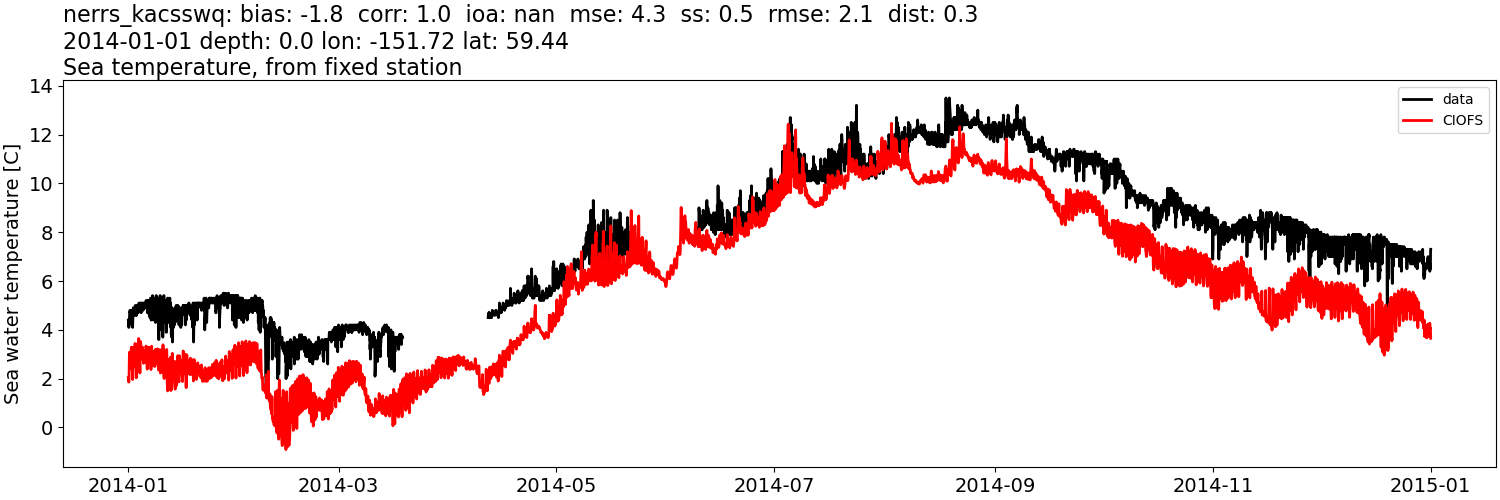
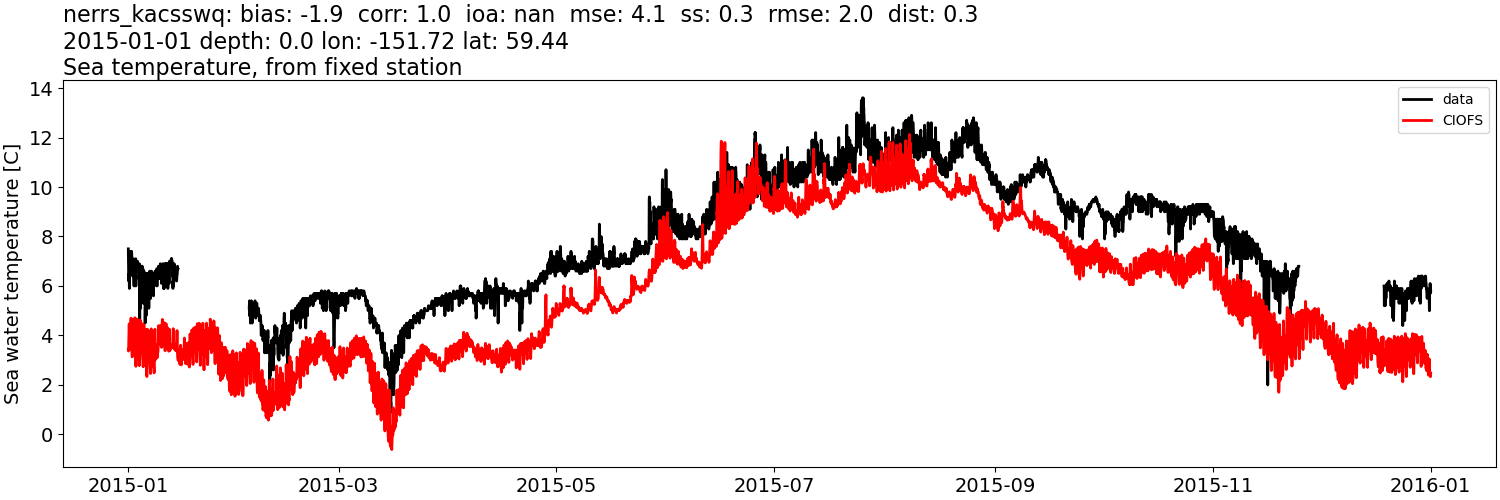
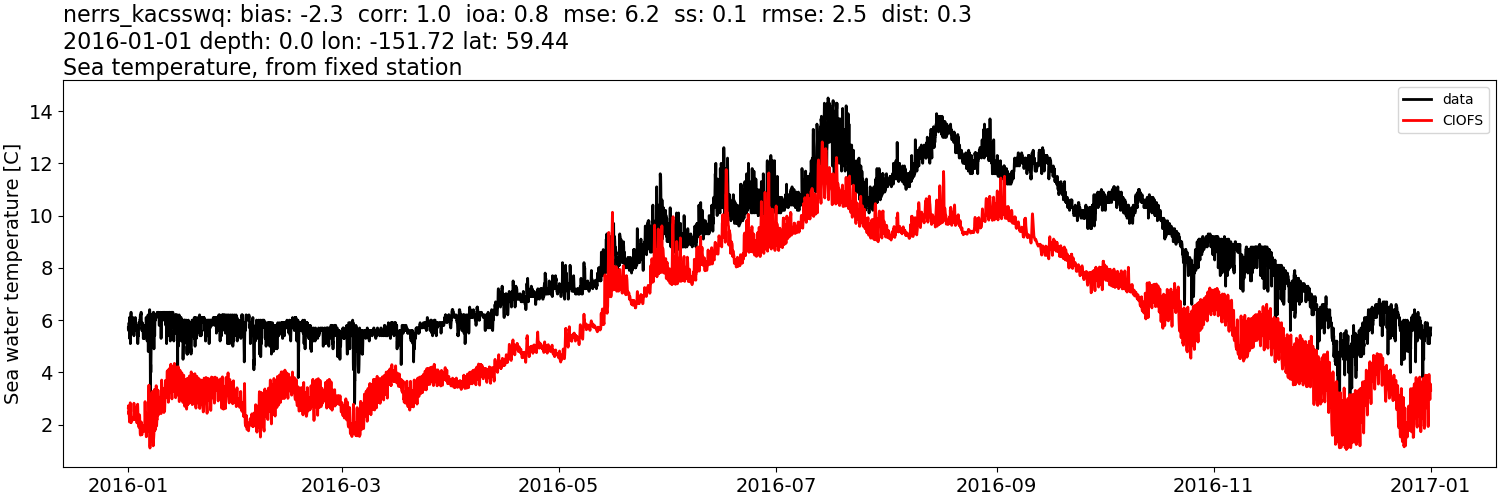
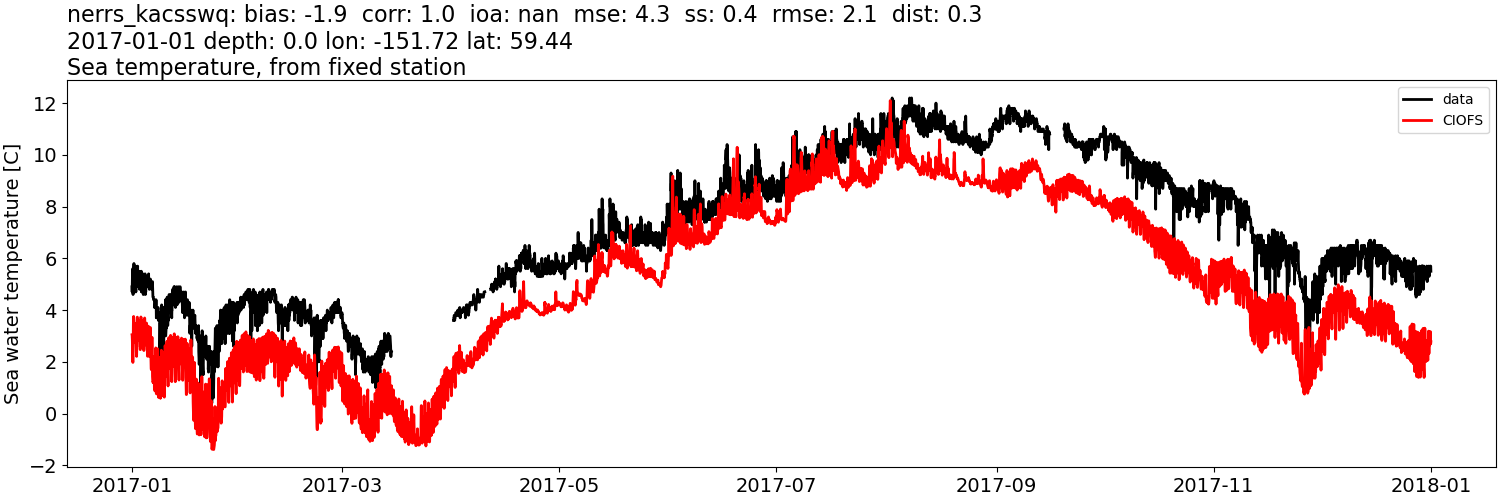
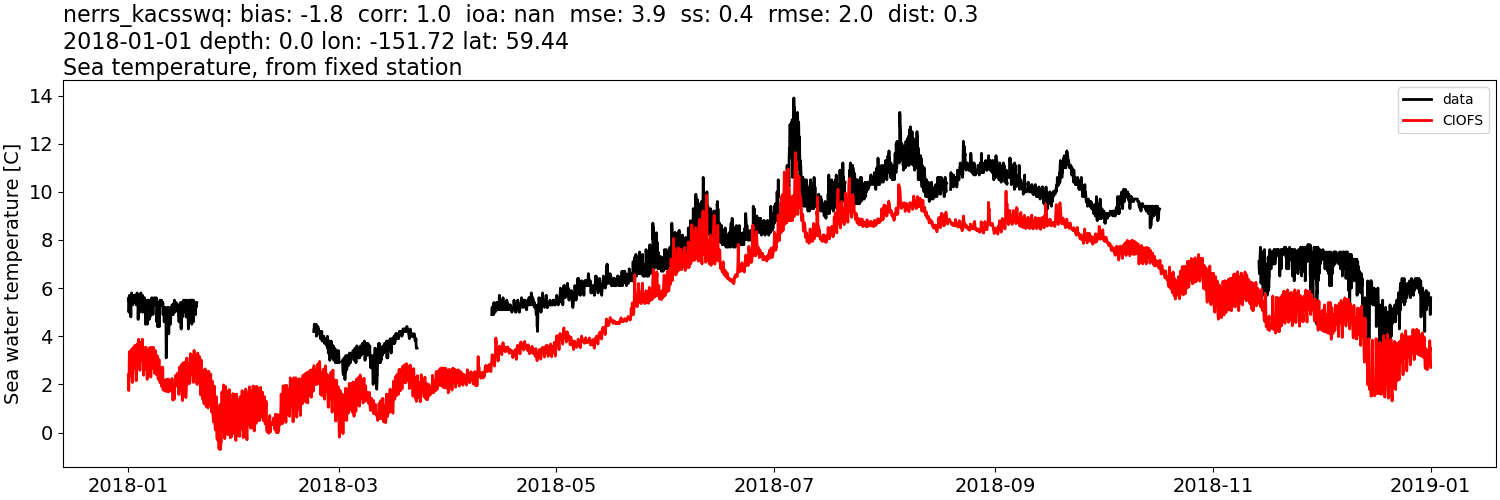
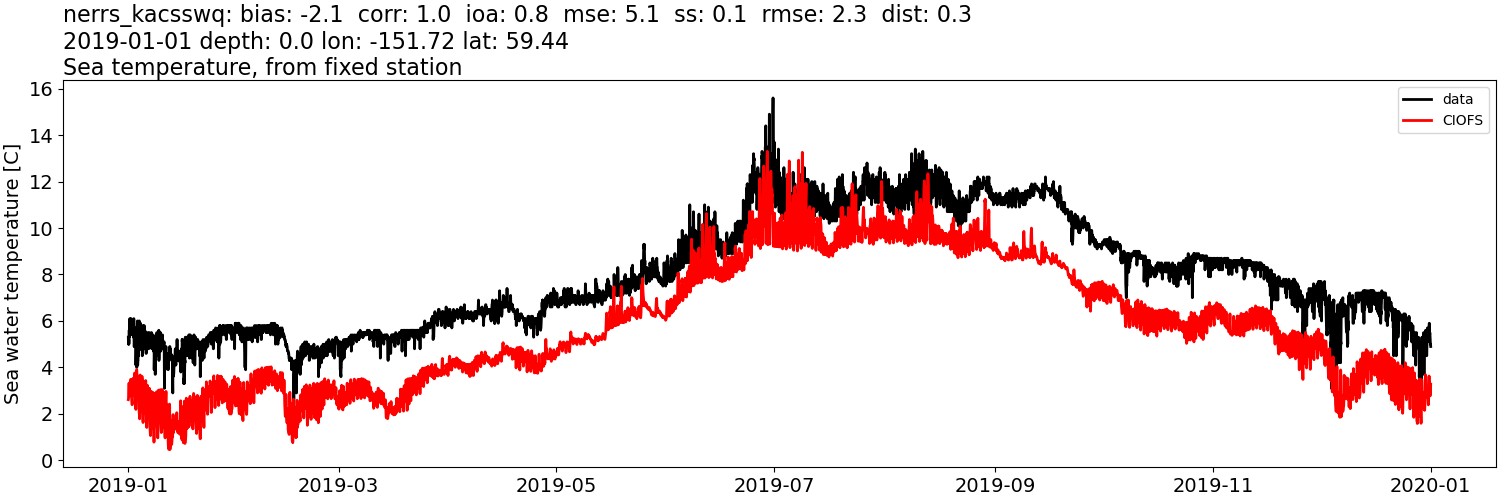
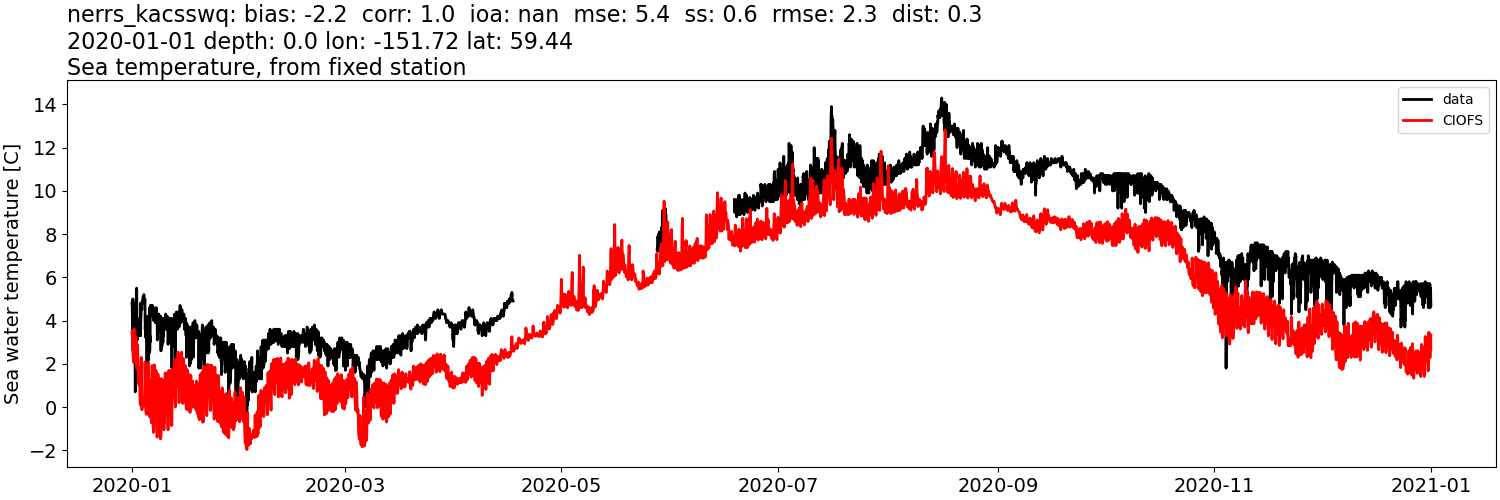
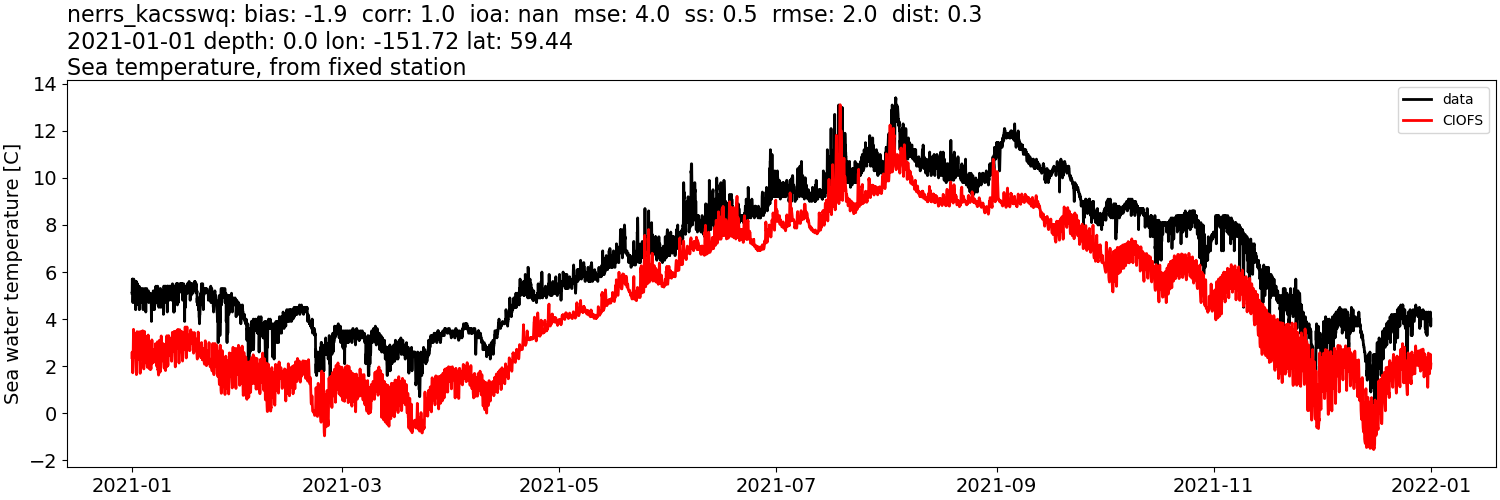
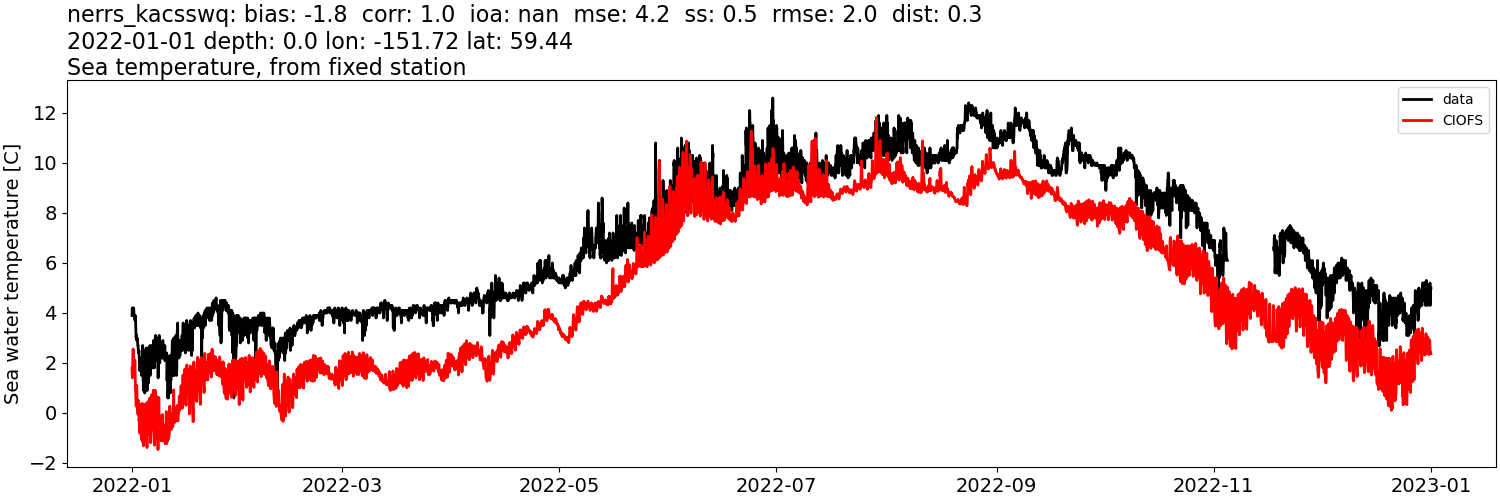
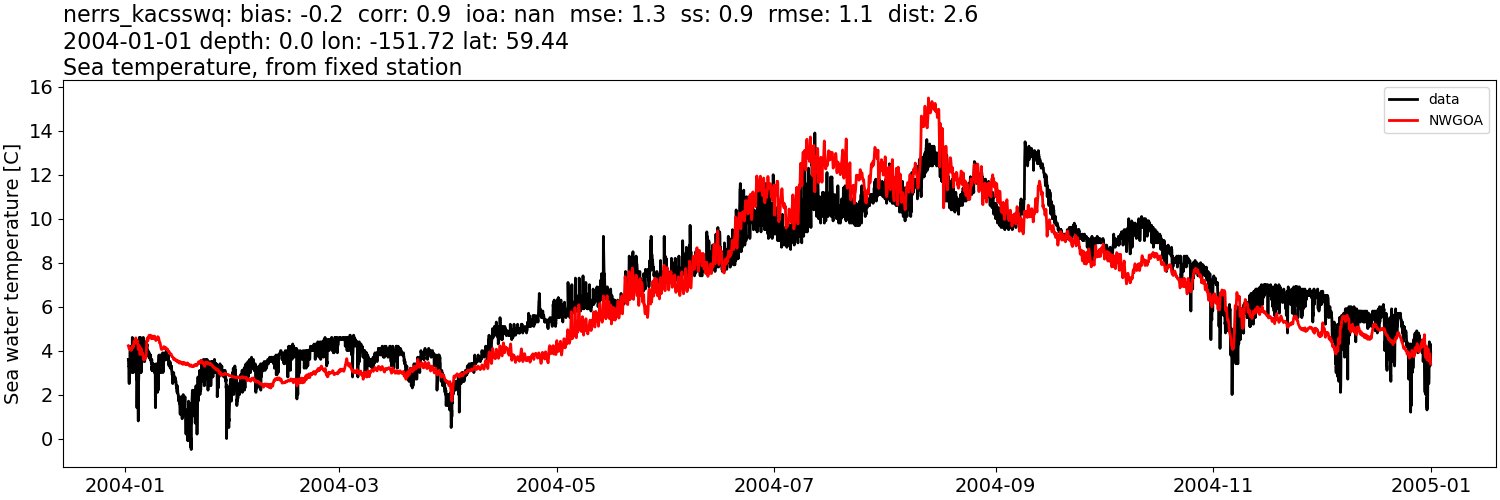
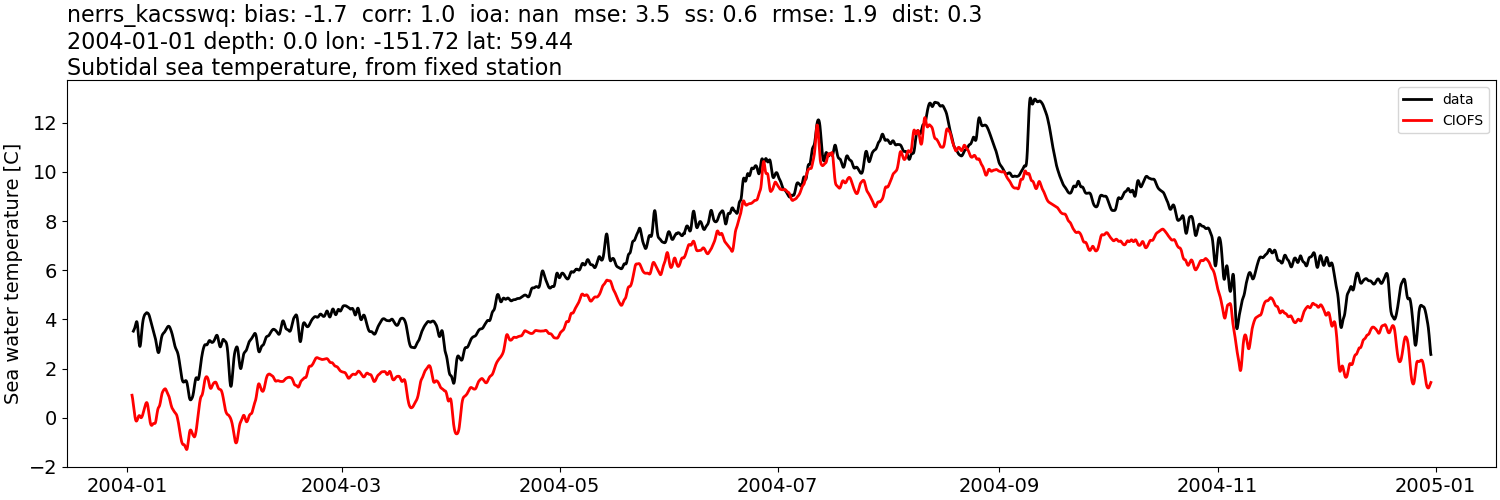
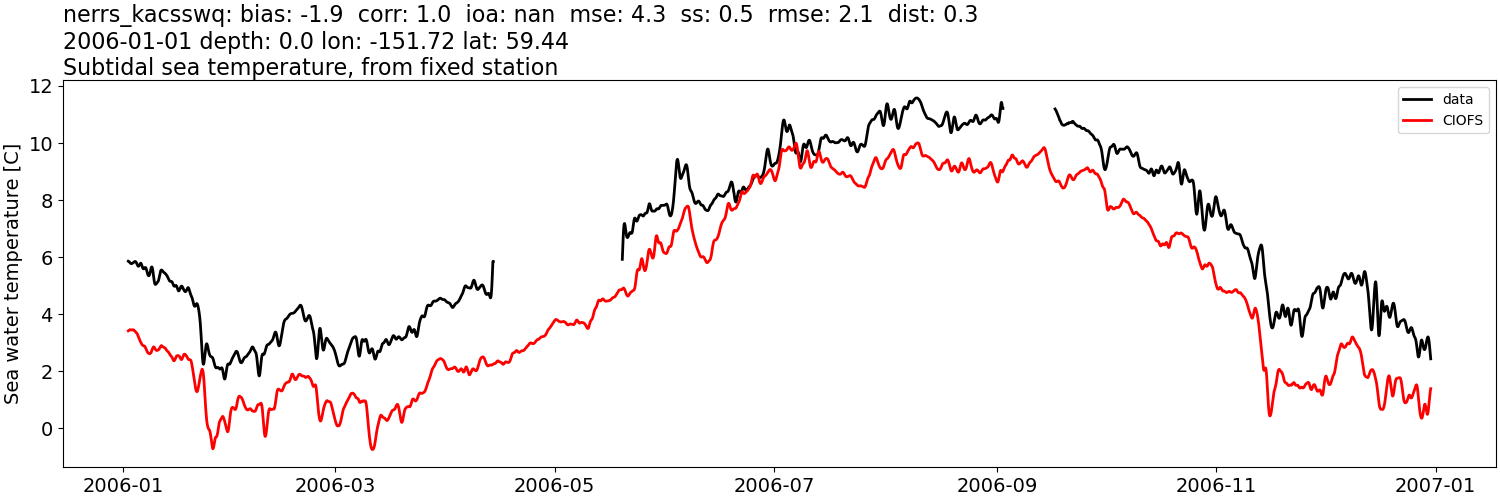
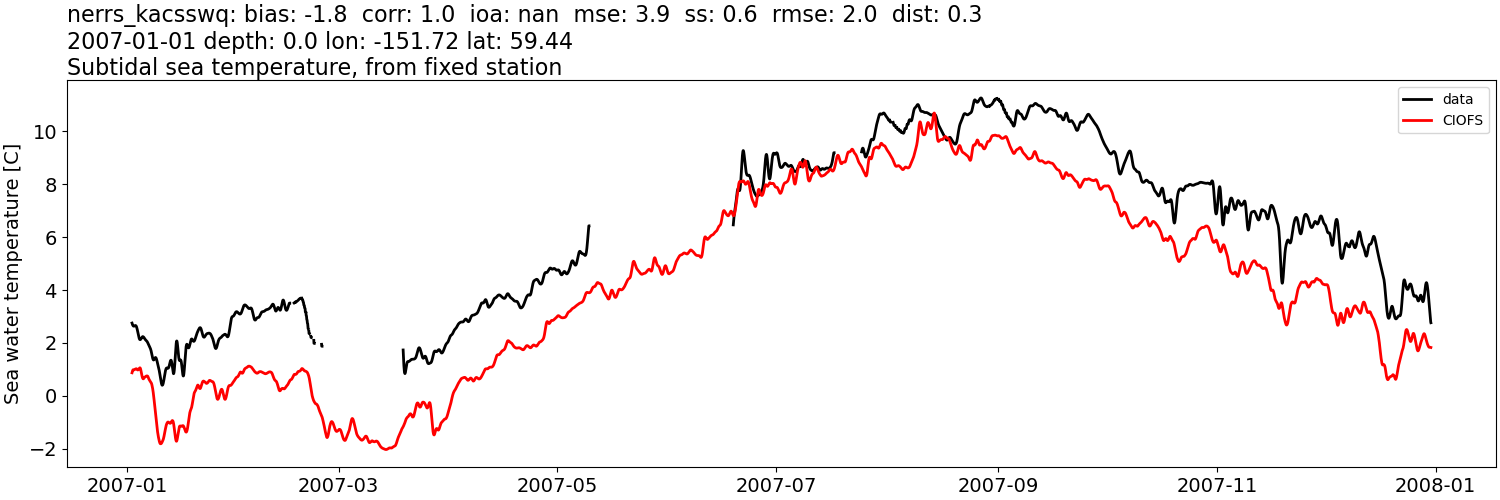
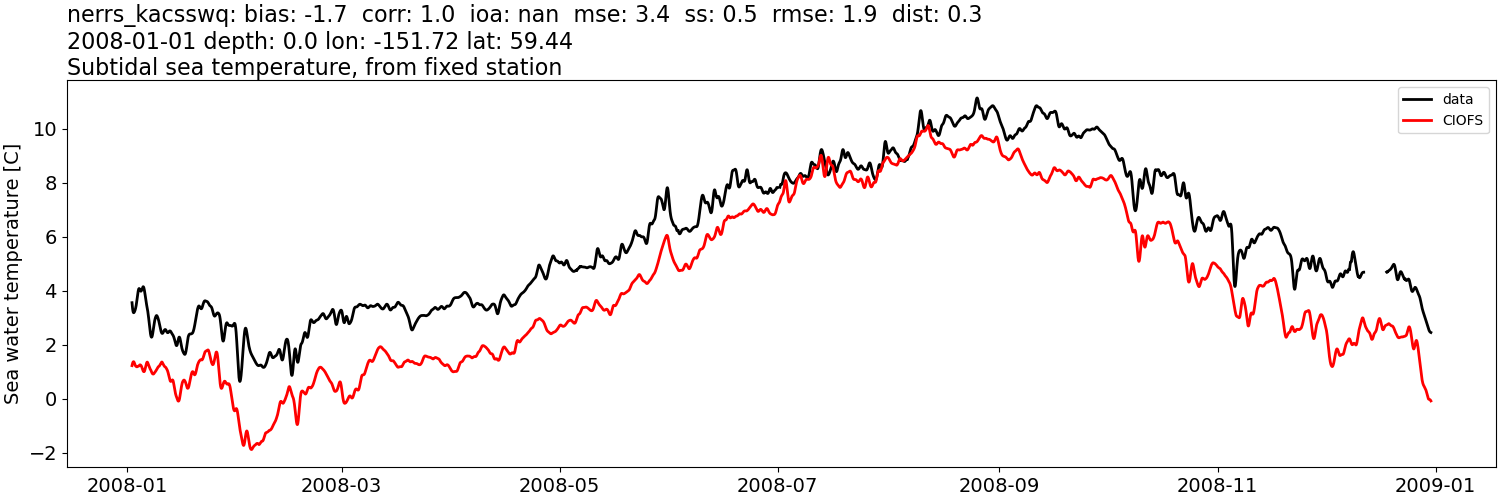
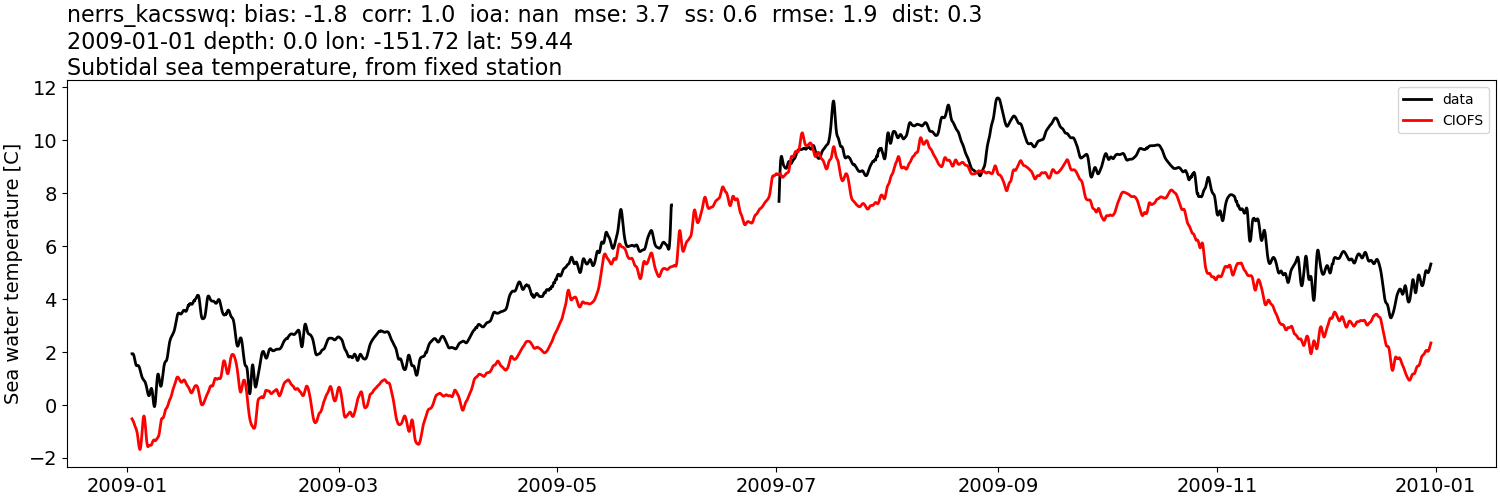
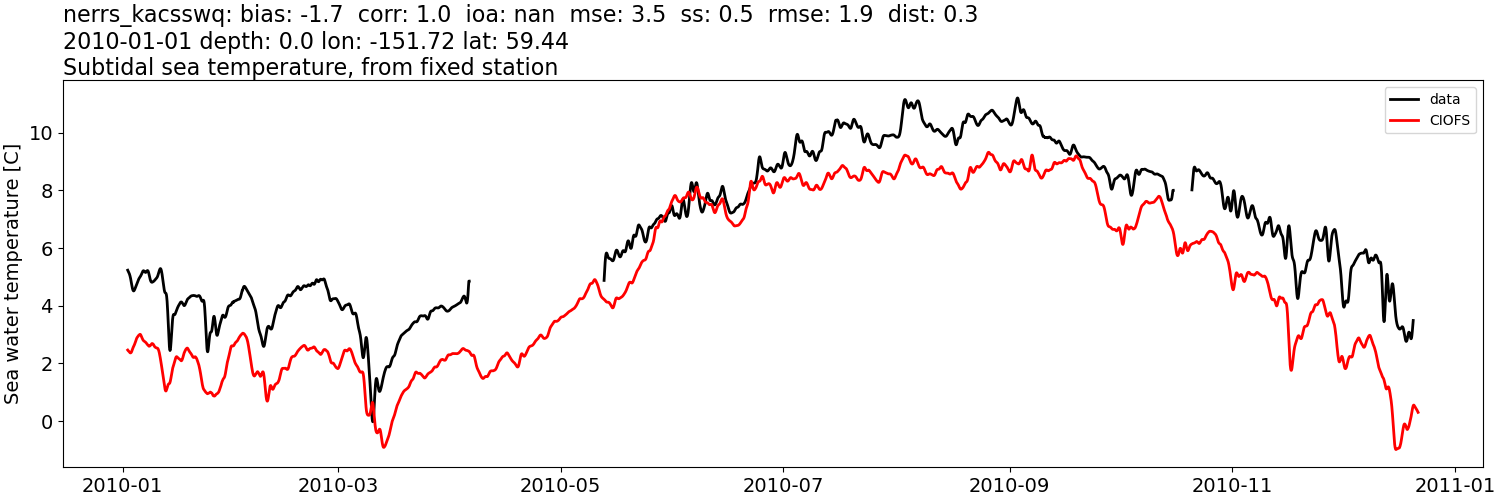
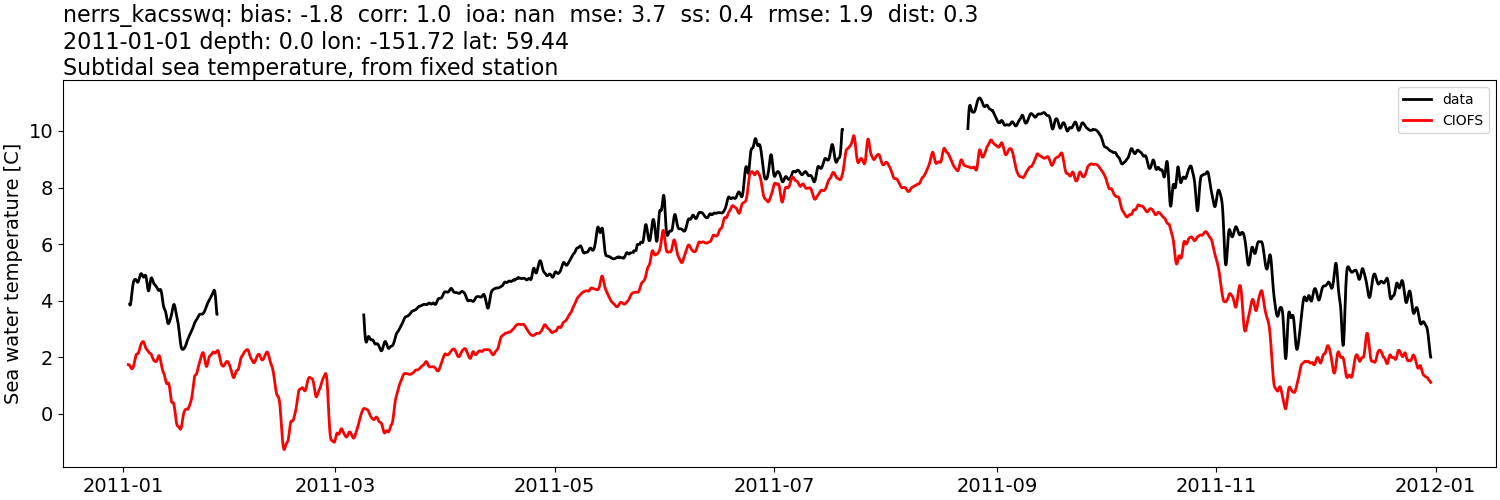
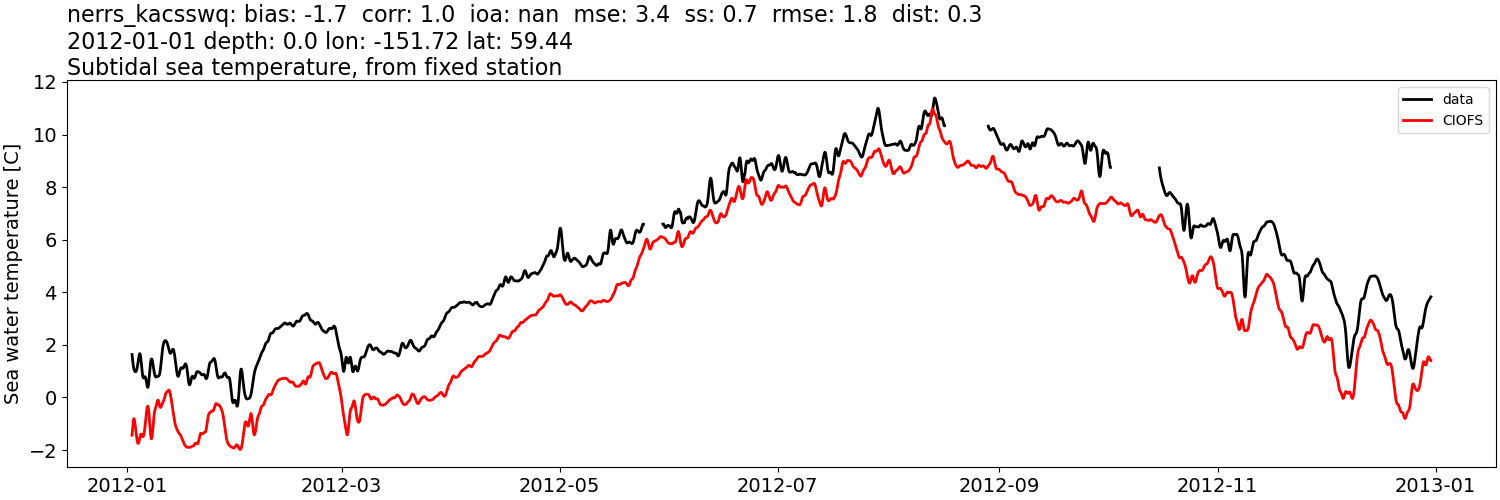
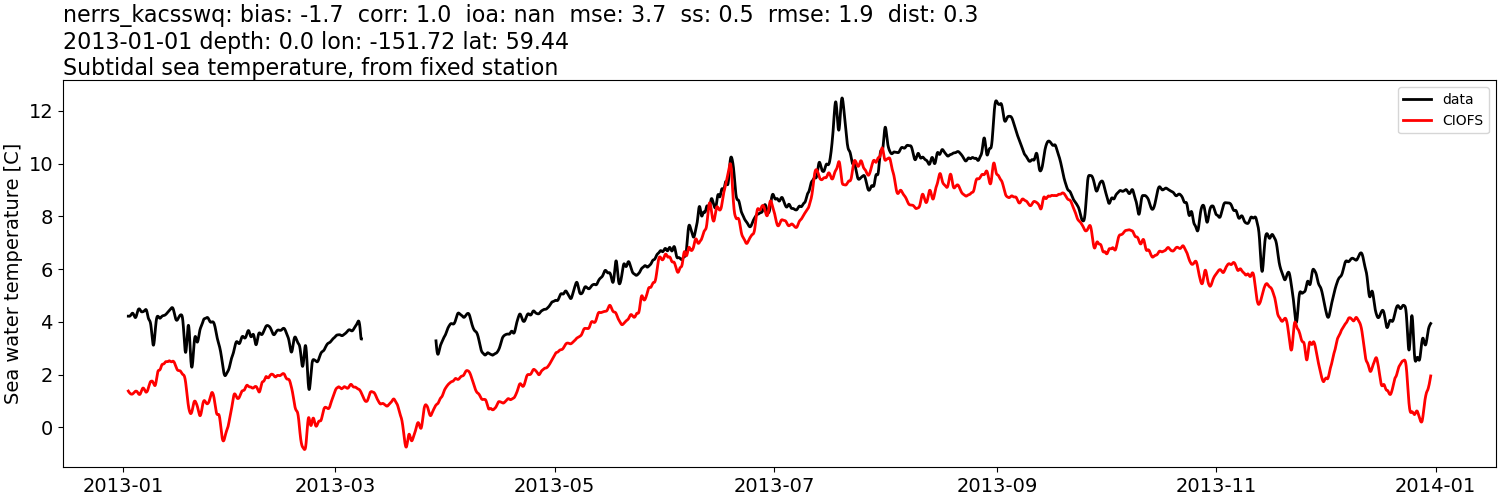
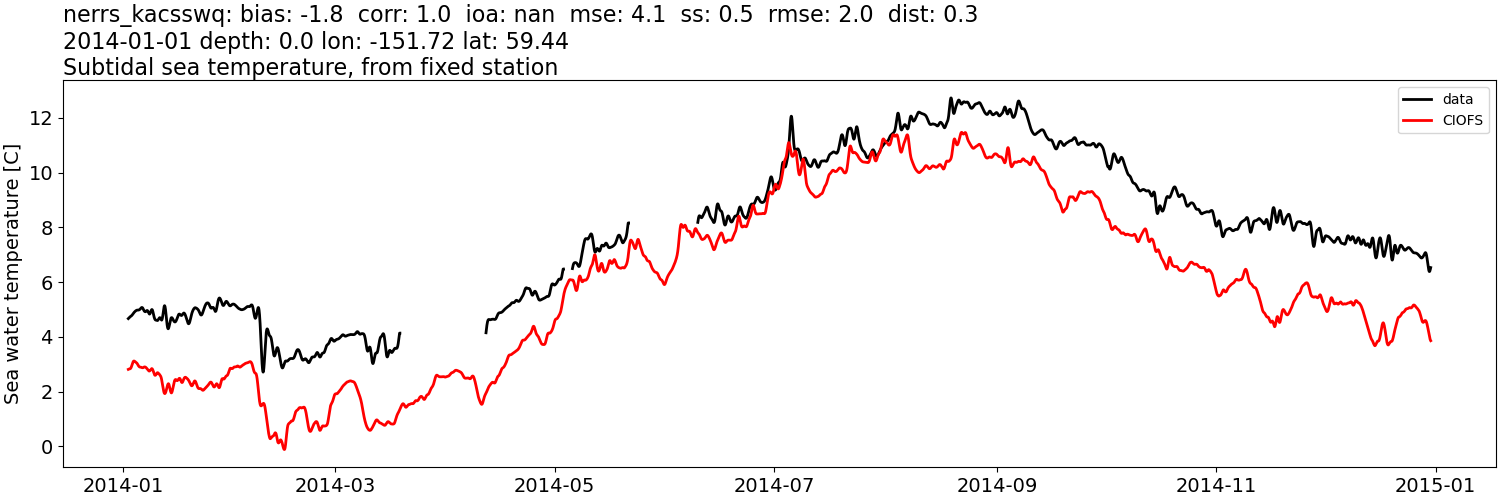
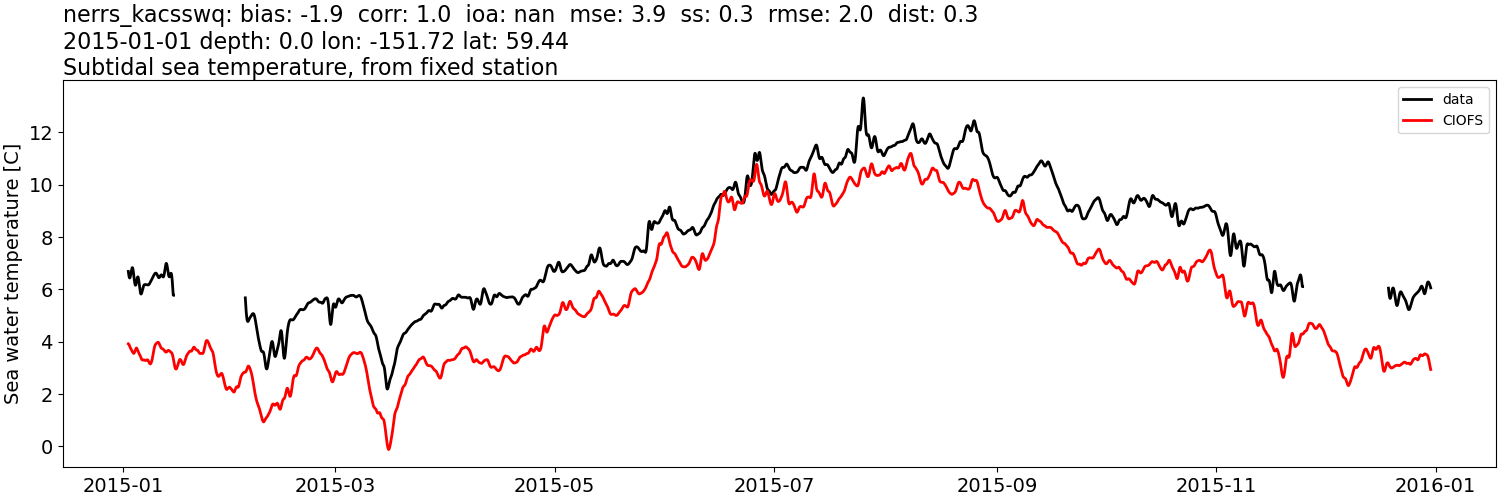
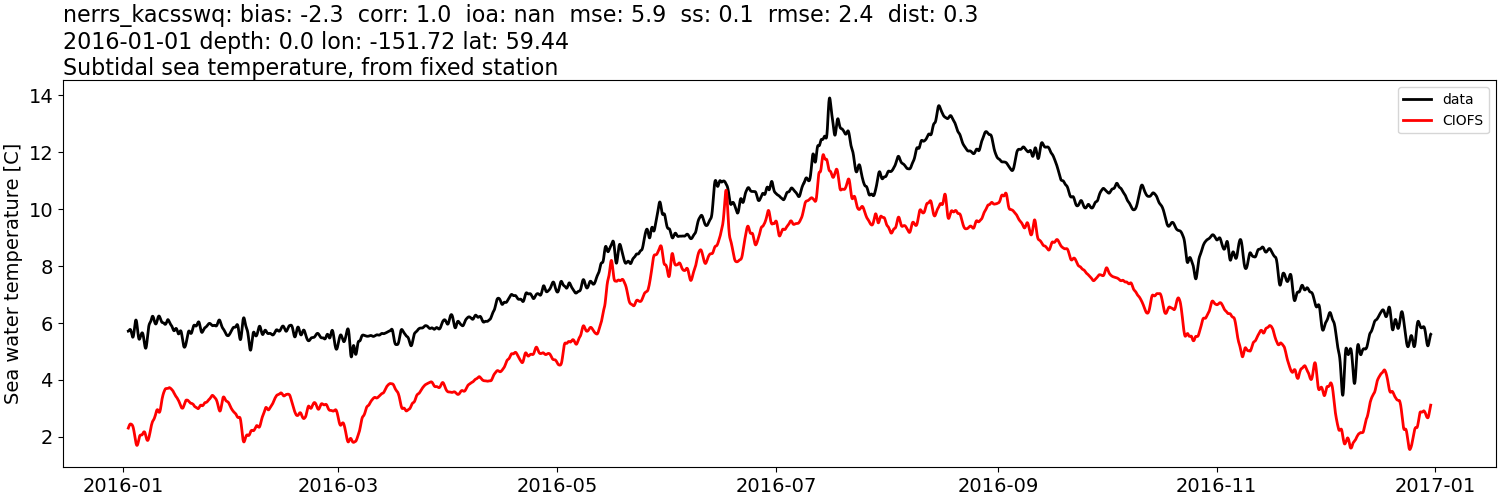
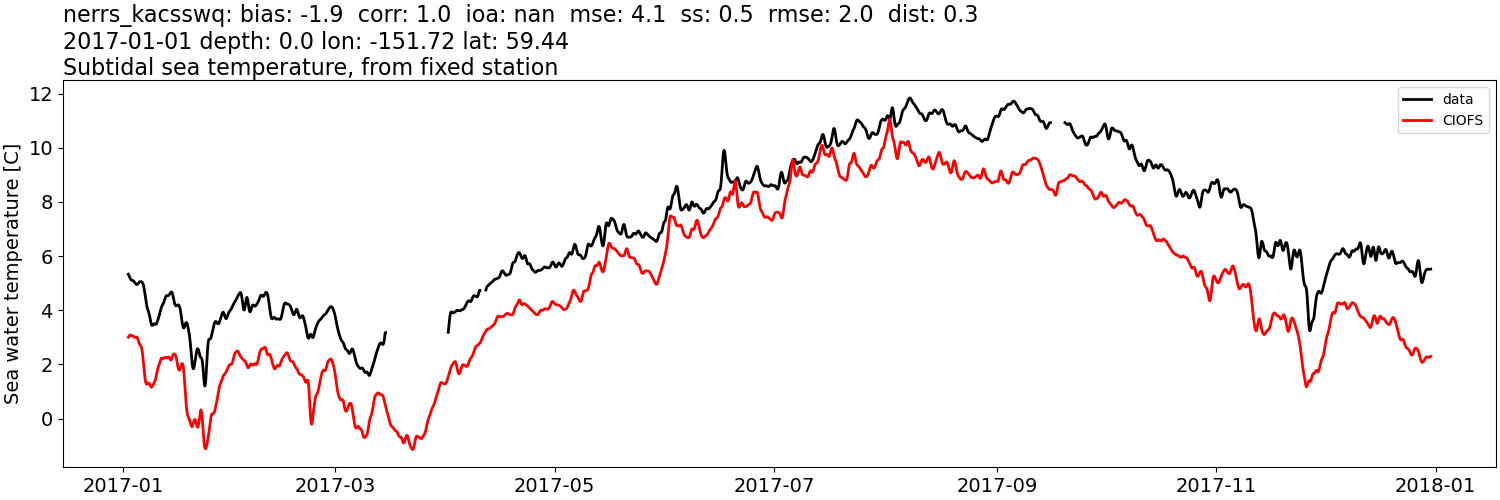
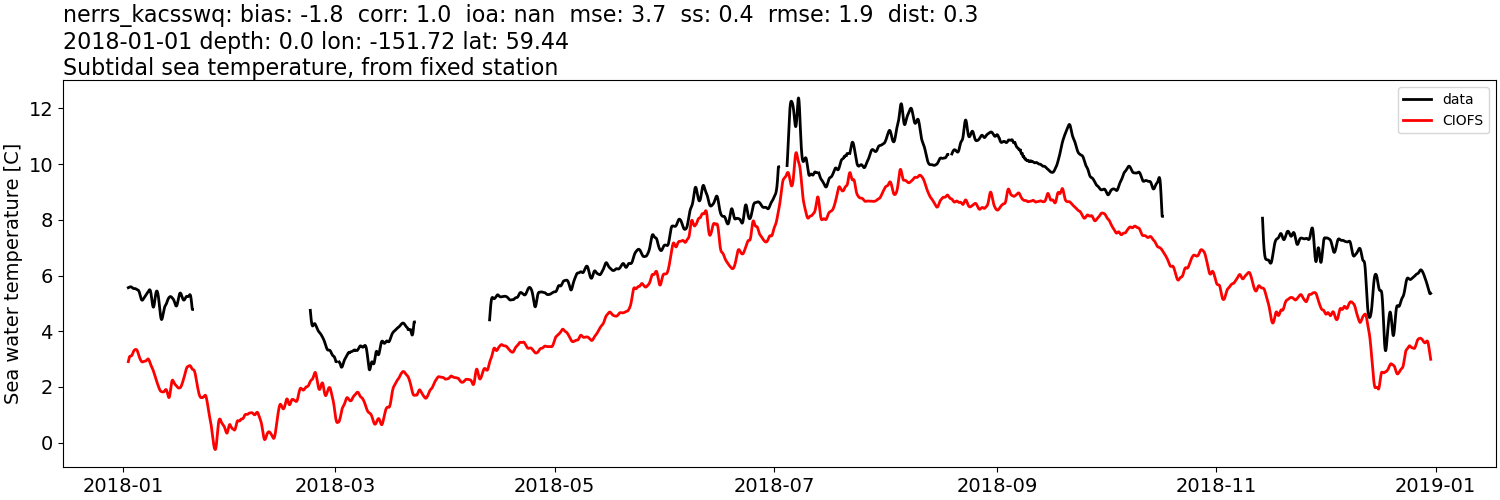
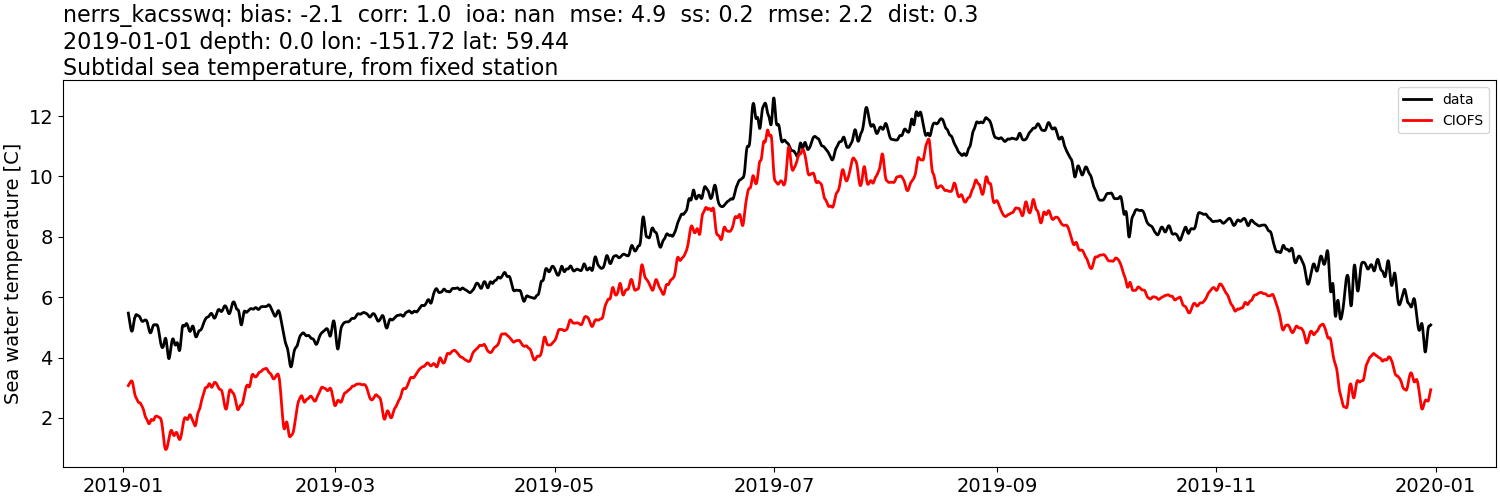
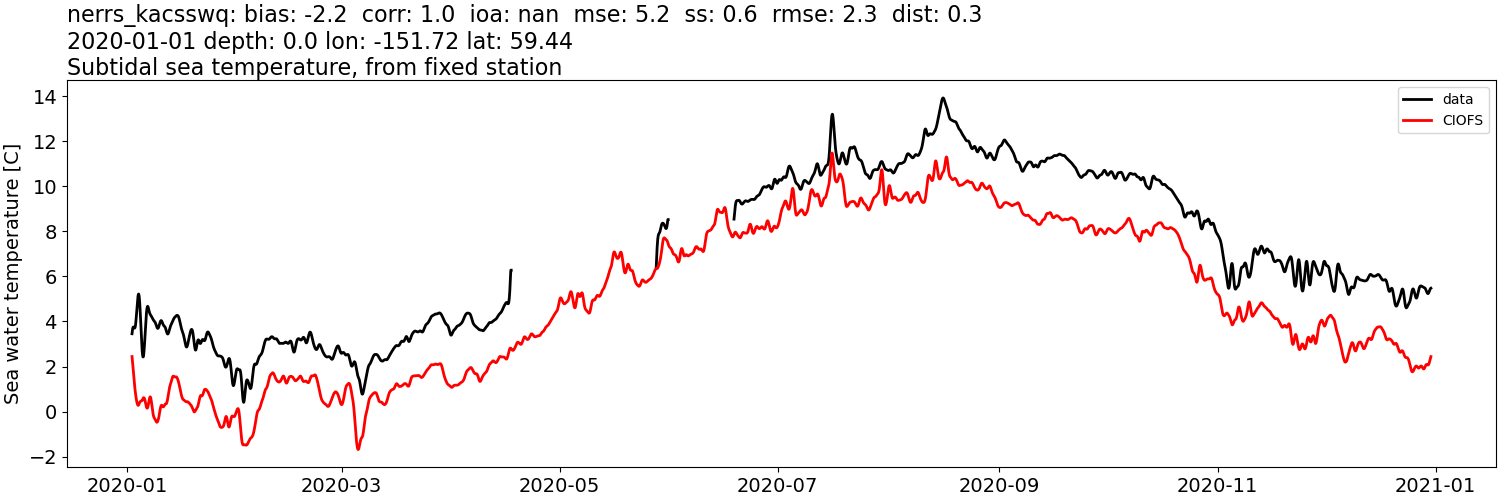
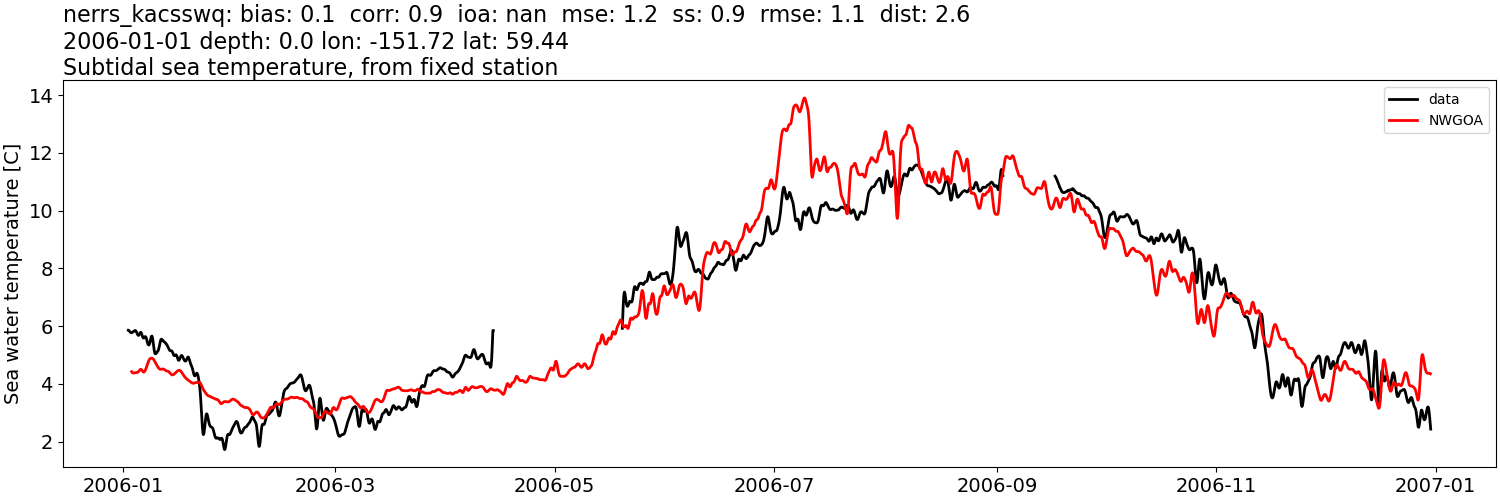
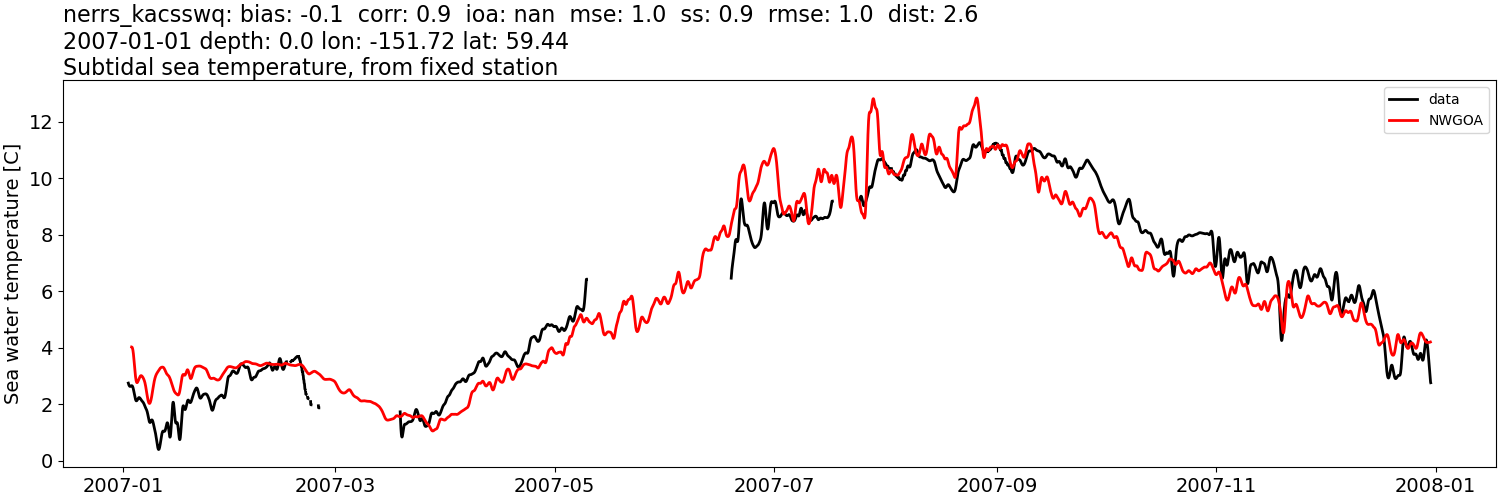
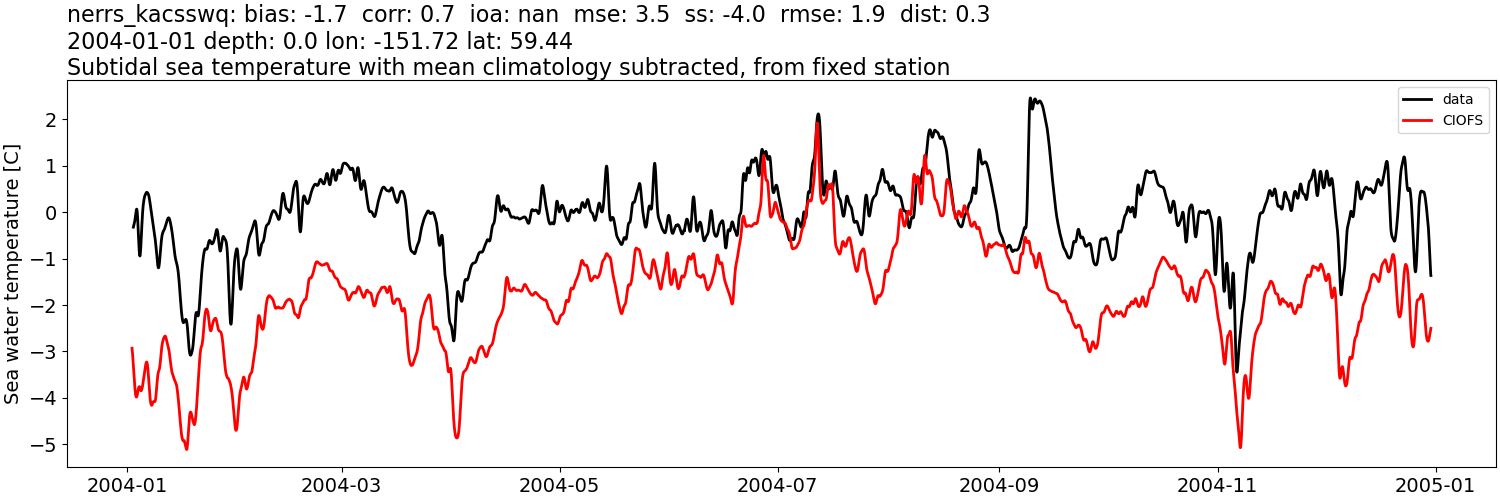
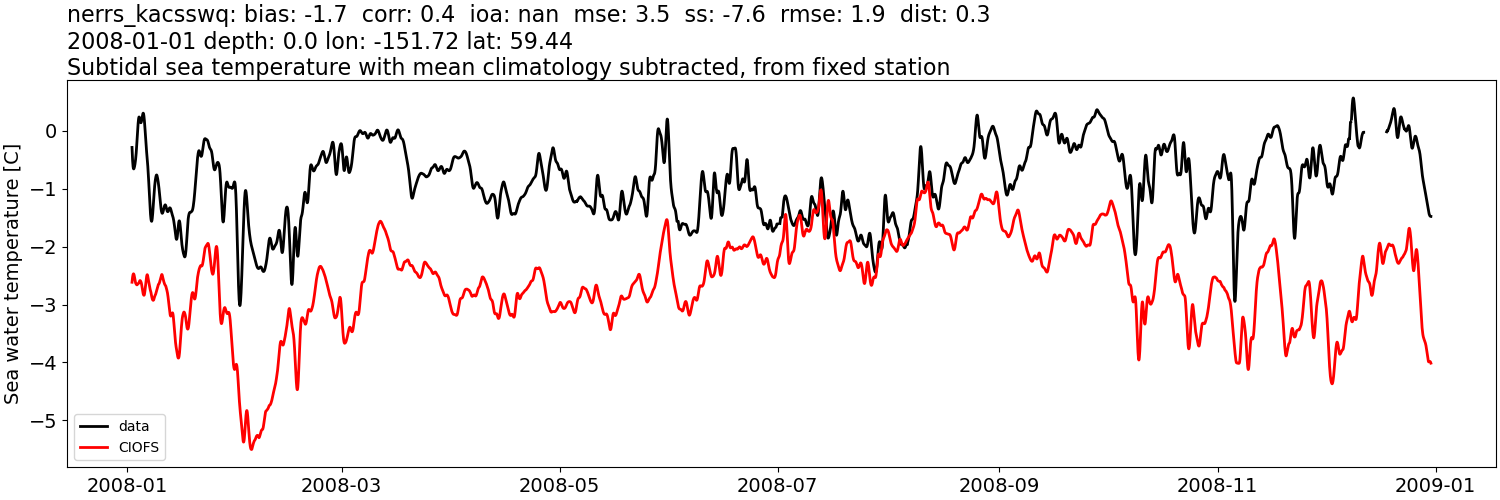
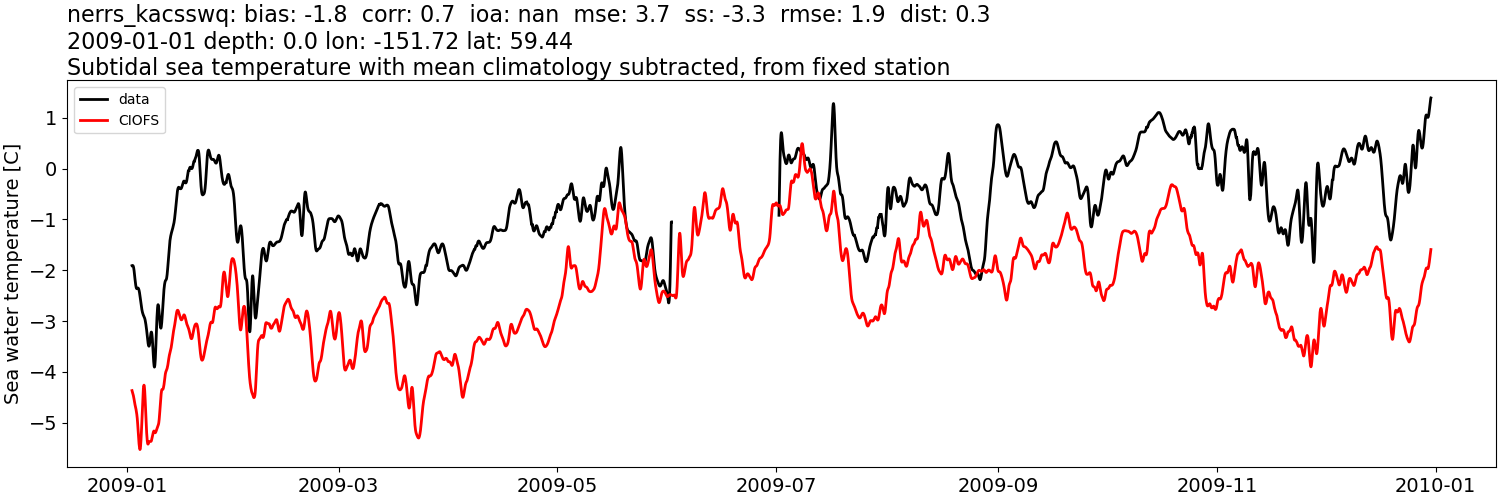
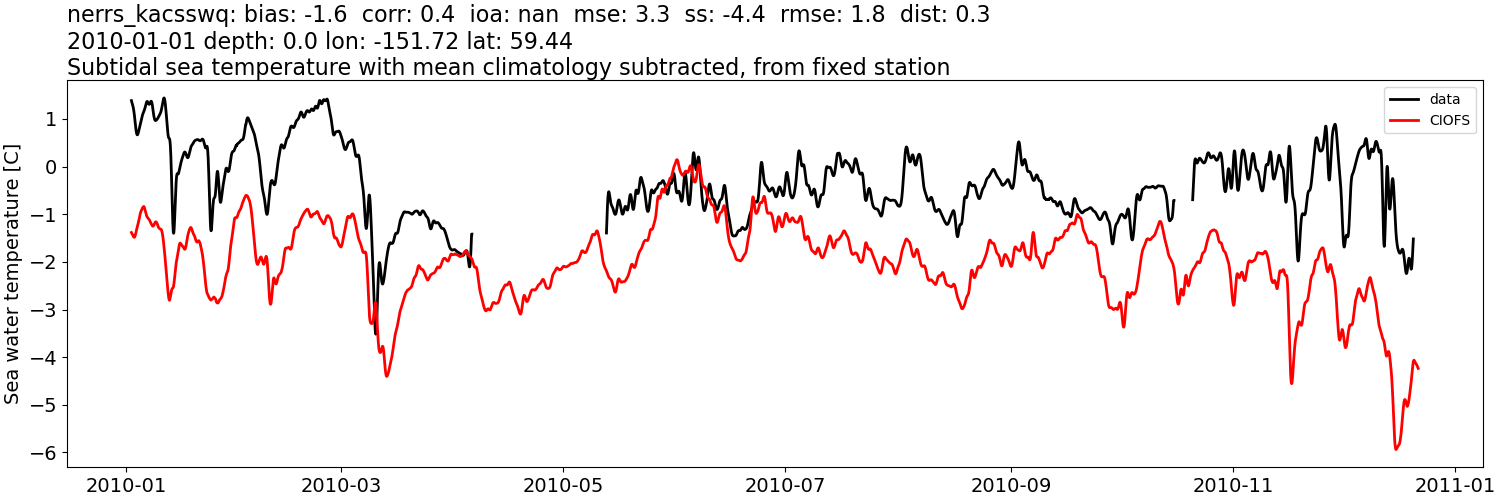
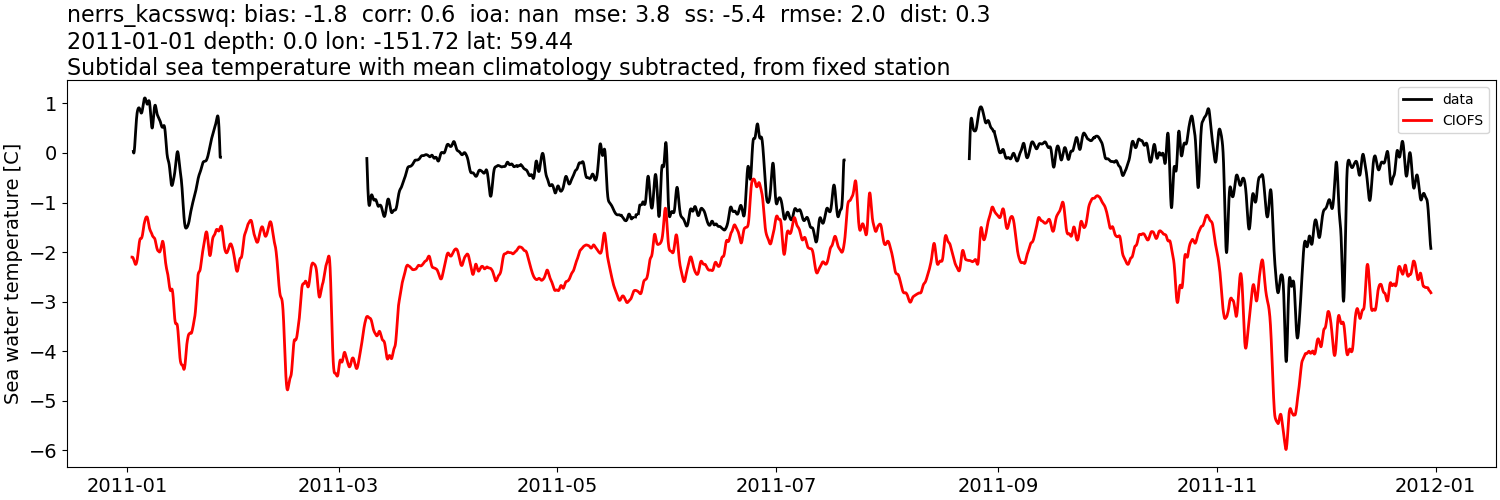
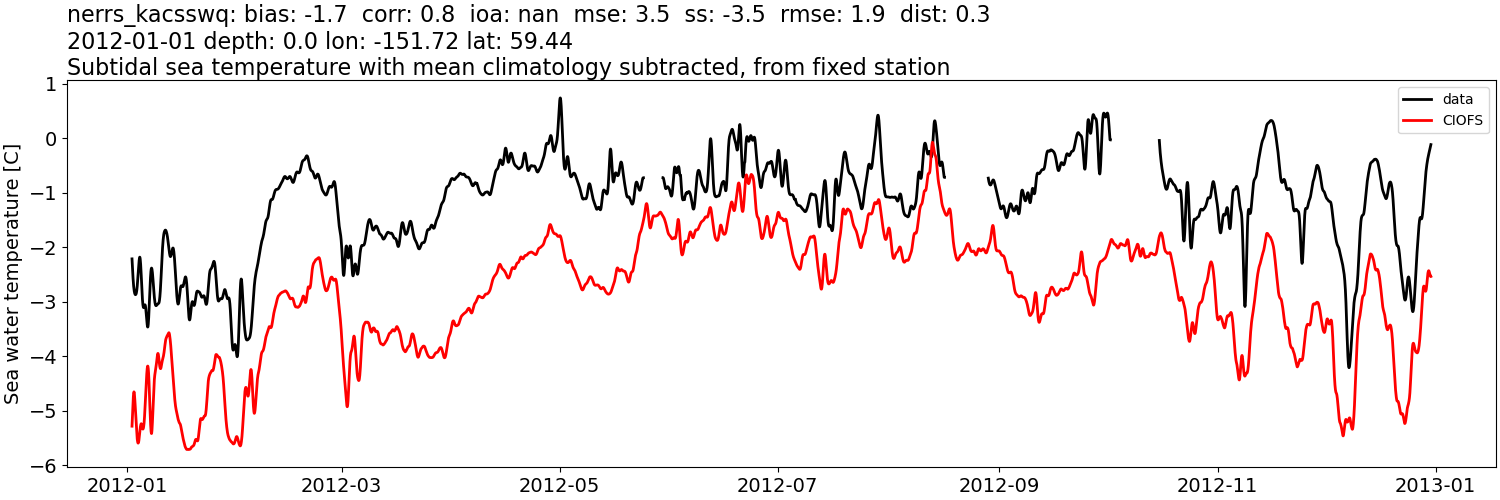
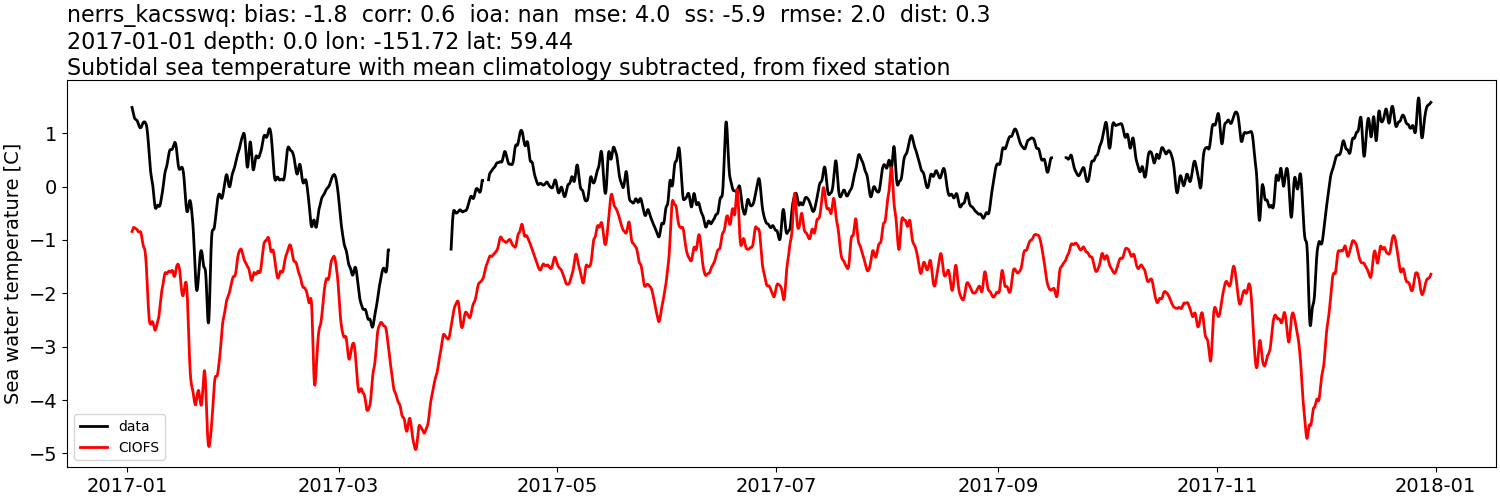
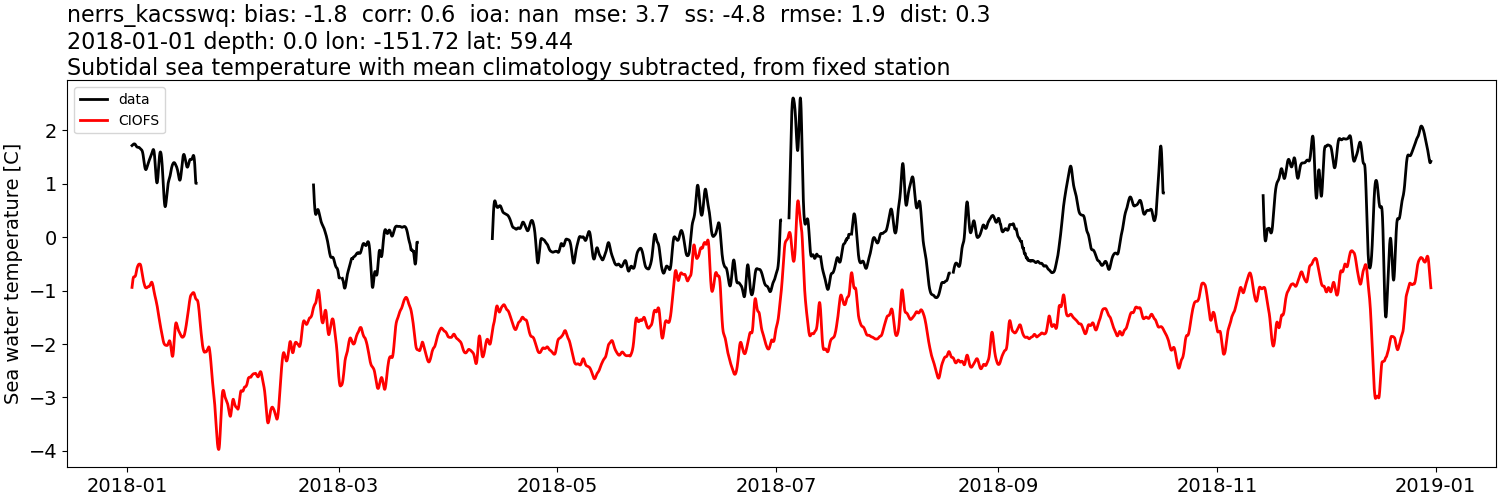
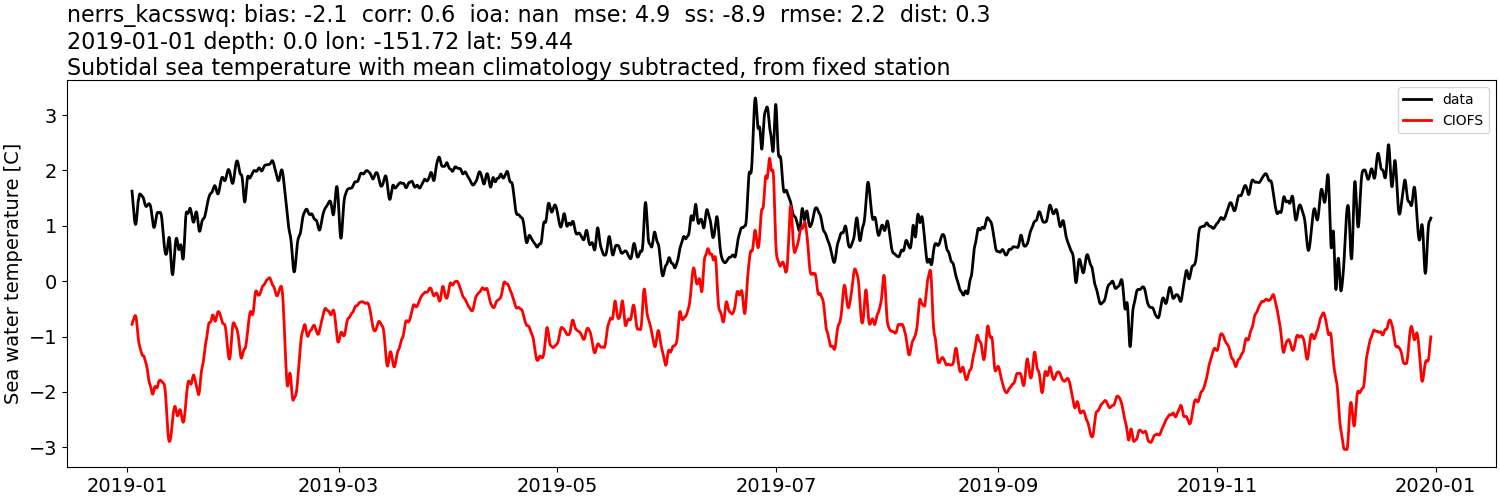
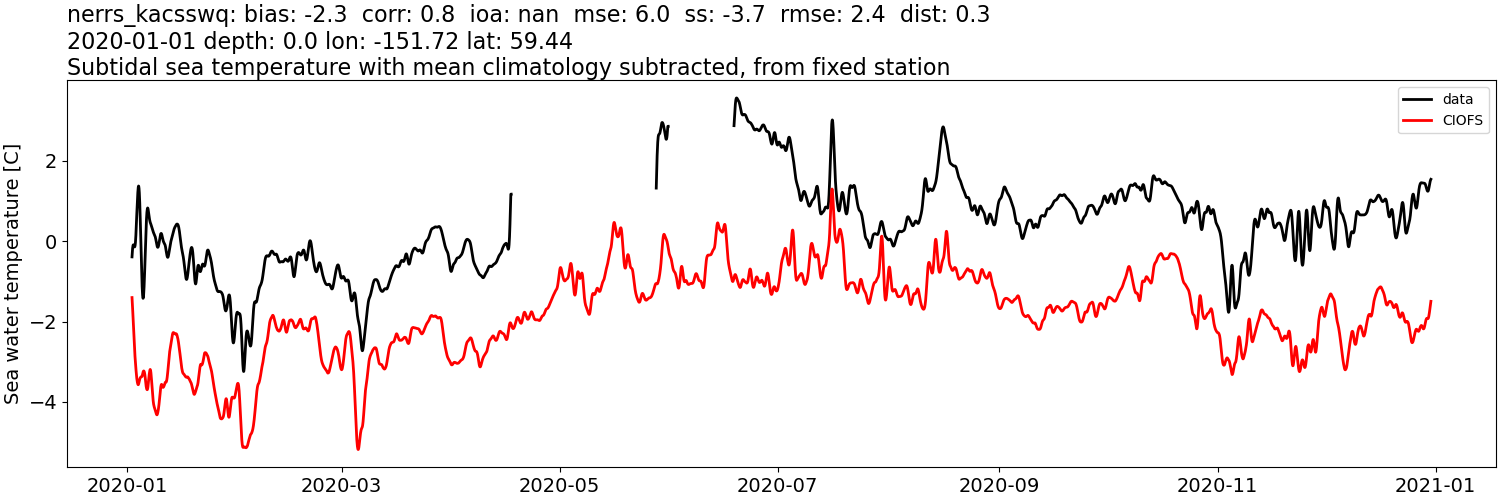
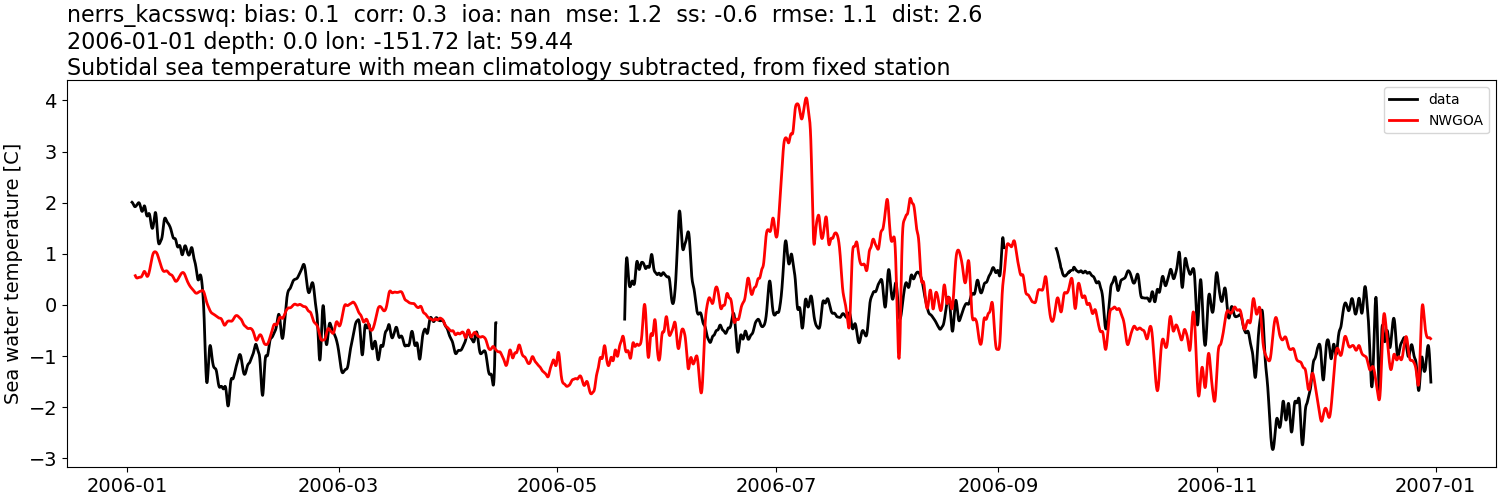
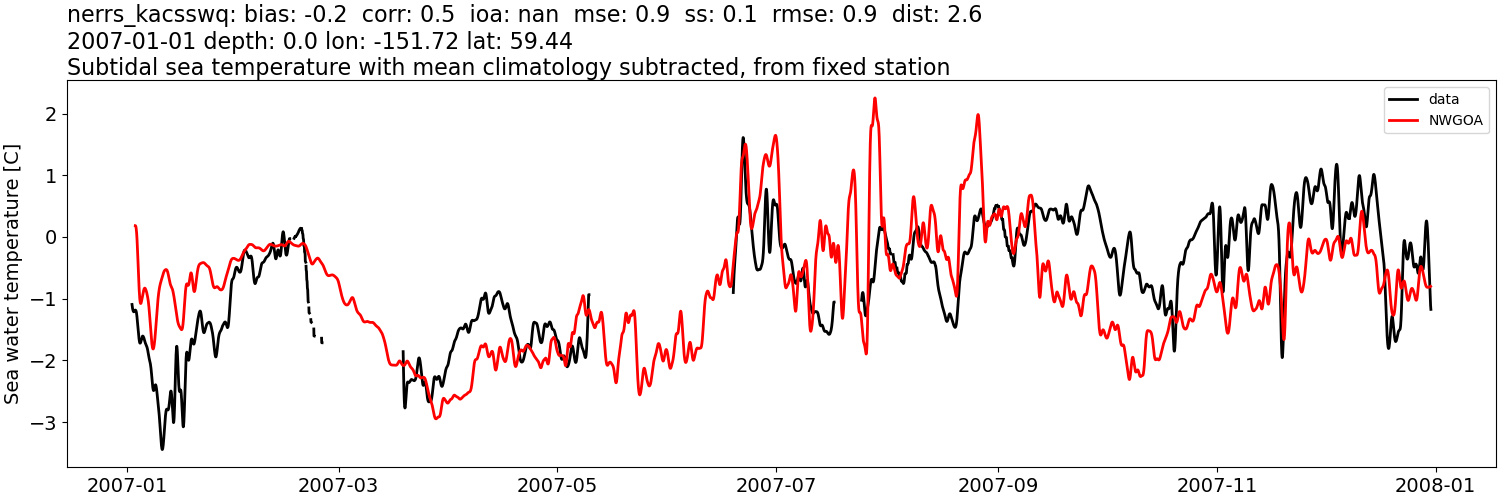
nerrs_kacsswq#
Sea water salinity:#
CIOFS#
Comparison plots by year
2004
2005
2006
2007
2008
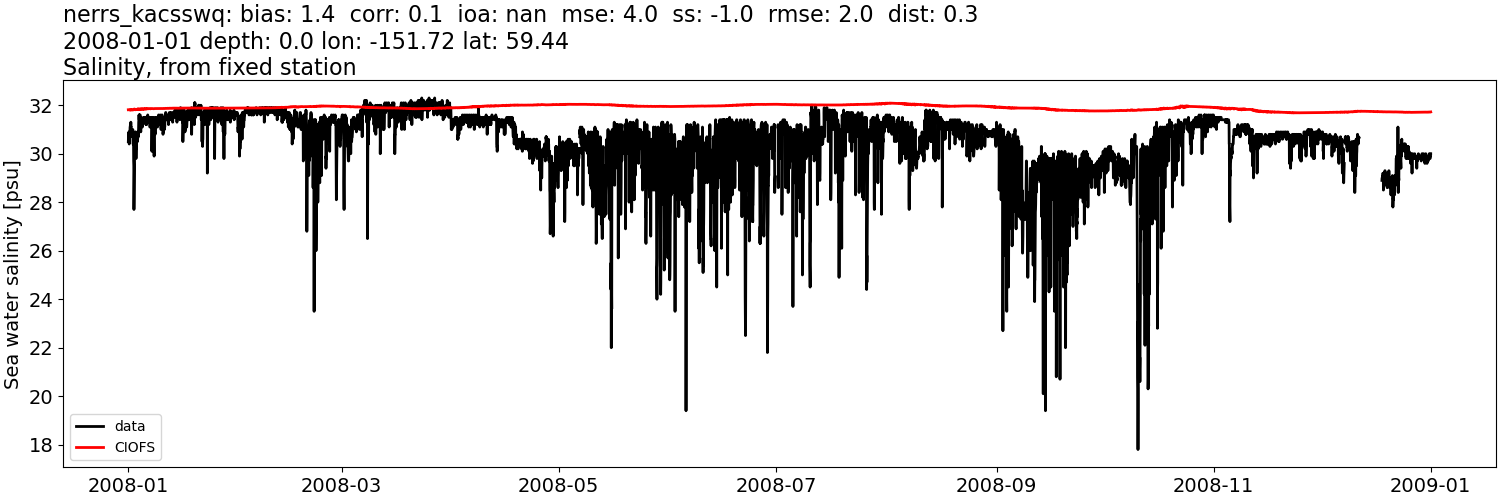
2009
2010
2011
2012
2013
2014
2015
2016
2017
2018
2019
2020
2021
2022
NWGOA#
Comparison plots by year
2004
2005
2006
2007
2008
Sea water salinity: tidally-filtered#
CIOFS#
Comparison plots by year
2004
2005
2006
2007
2008

2009
2010
2011
2012
2013
2014
2015
2016
2017
2018
2019
2020
2021
2022
NWGOA#
Comparison plots by year
2004
2005
2006
2007
2008
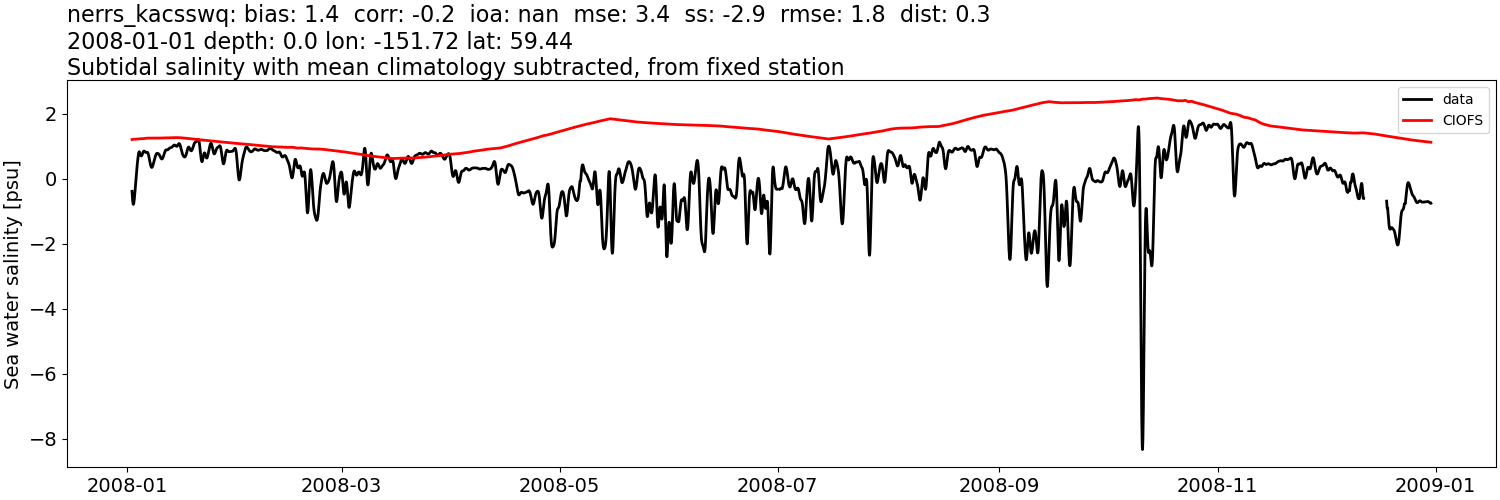
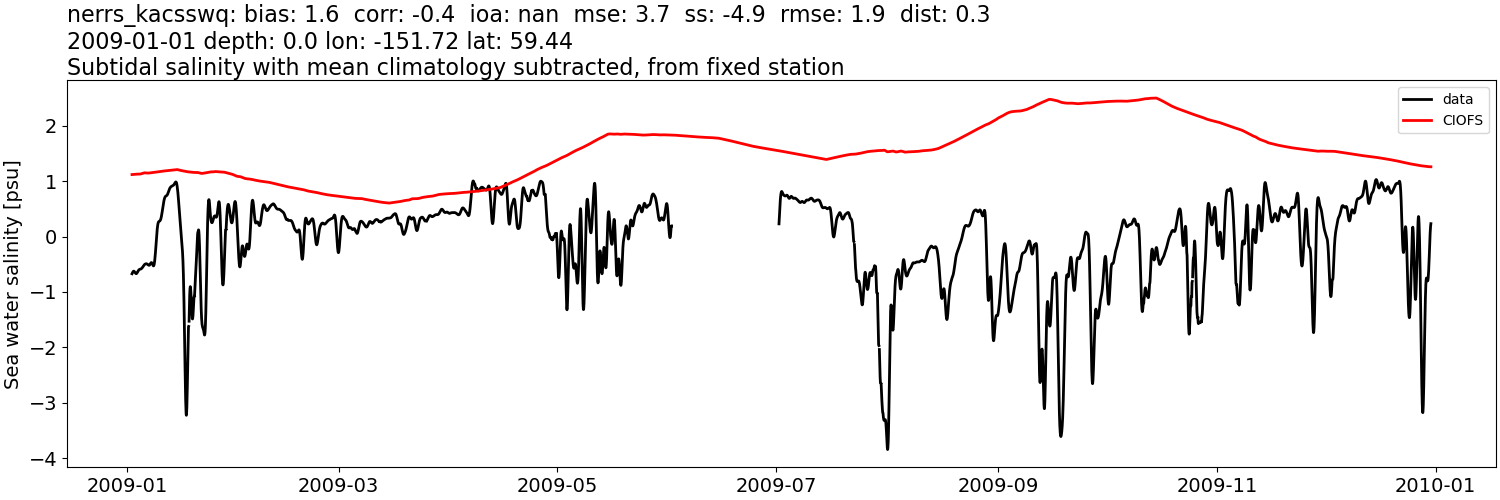
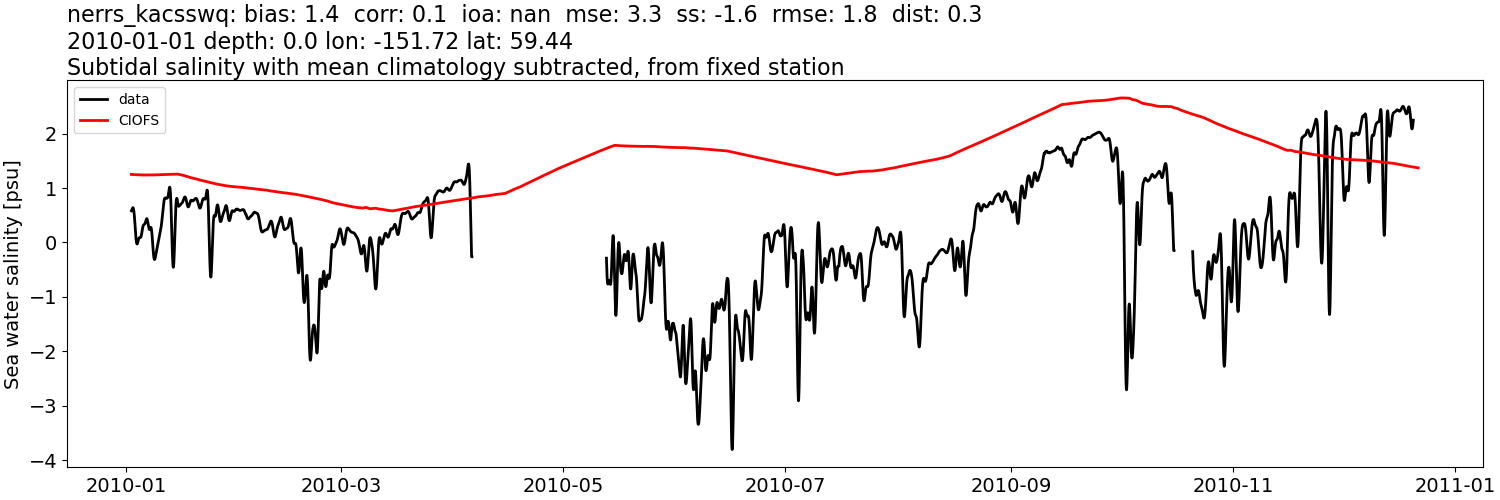
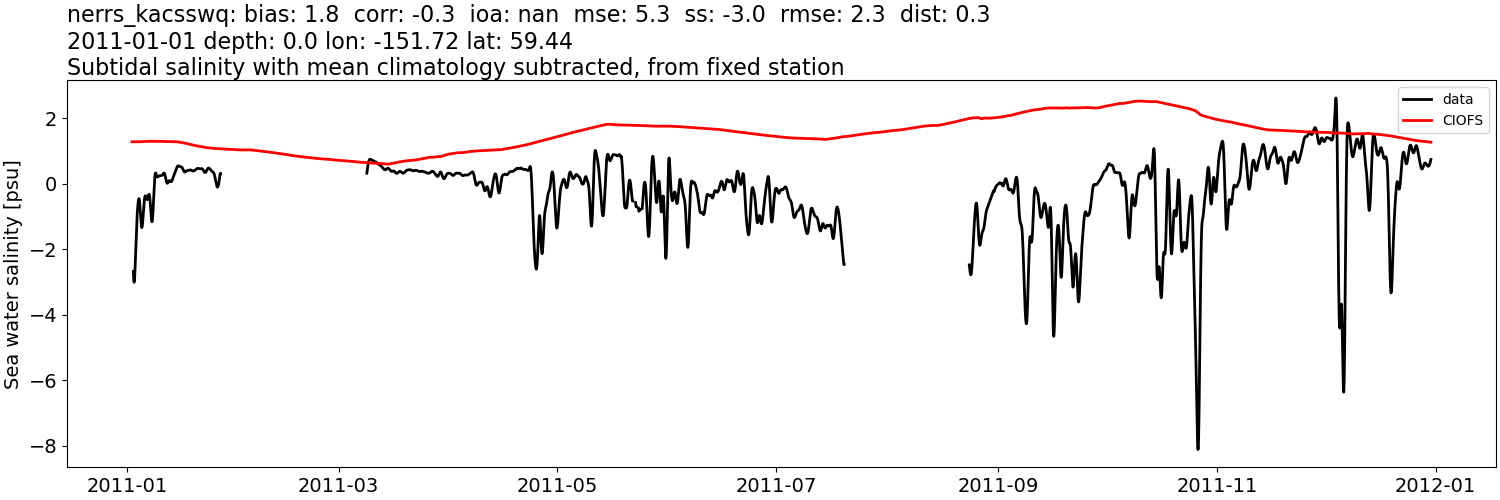
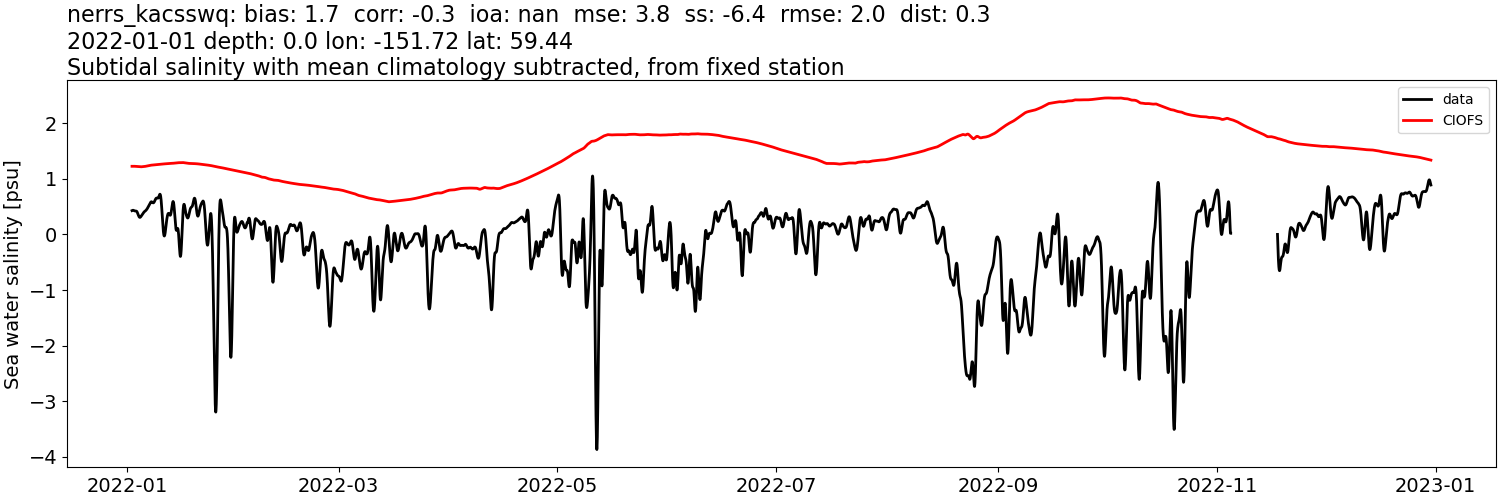
Sea water salinity: tidally-filtered, then monthly mean from data subtracted#
CIOFS#
Comparison plots by year
2004
2005
2006
2007
2008
2009
2010
2011
2012
2013
2014
2015
2016
2017
2018
2019
2020
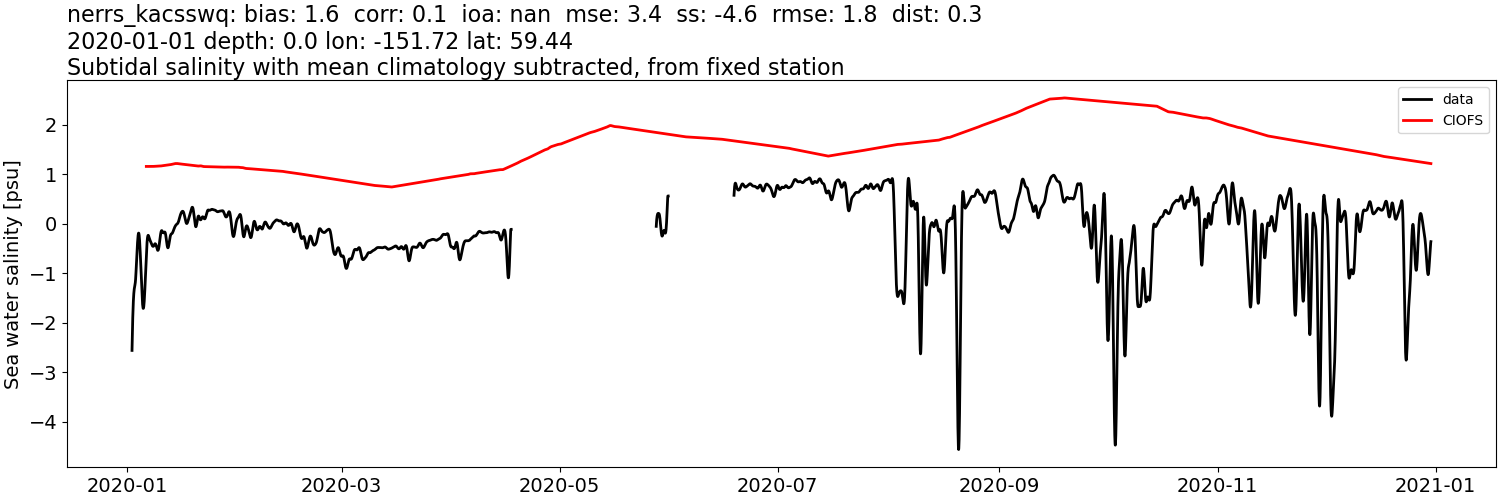
2021
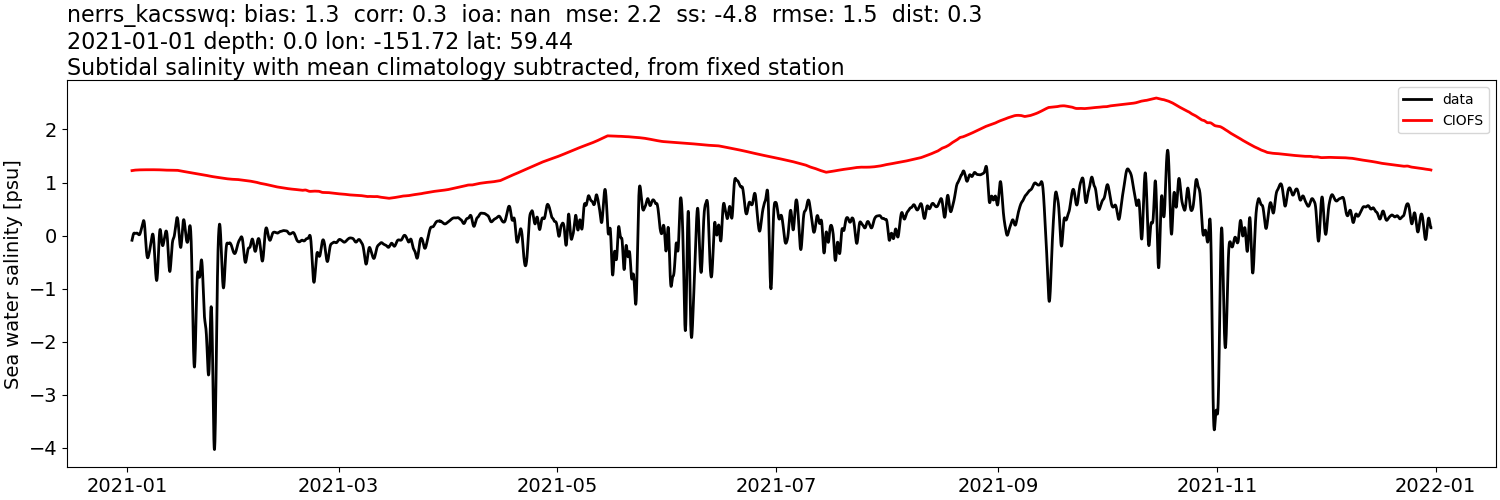
2022
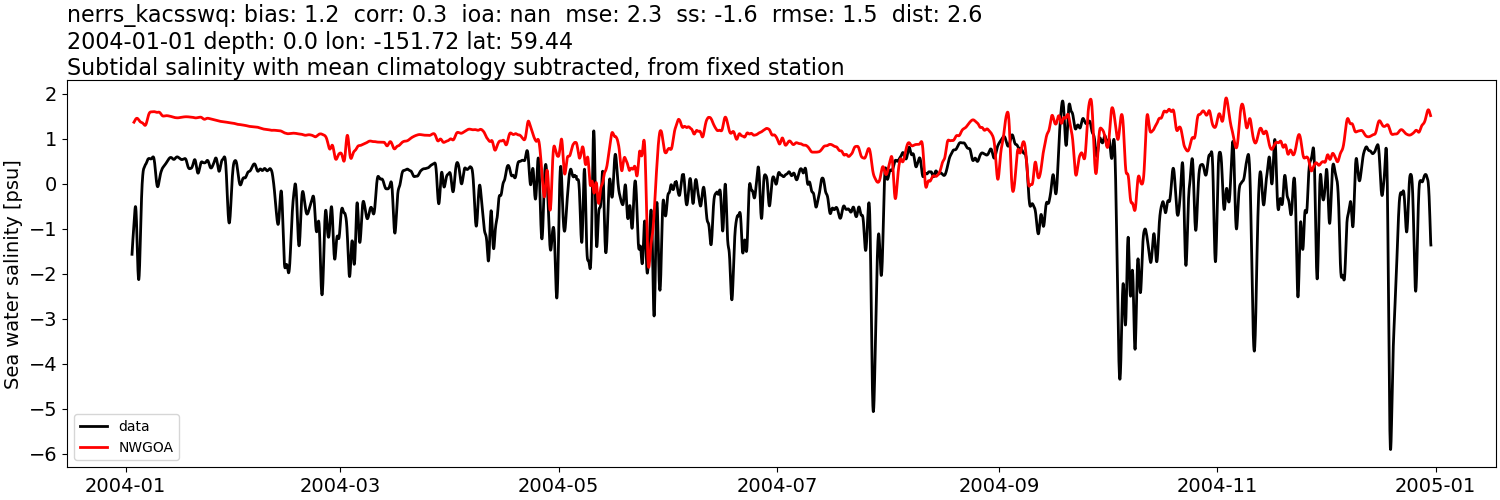
NWGOA#
Comparison plots by year
2004
2005
2006
2007
2008
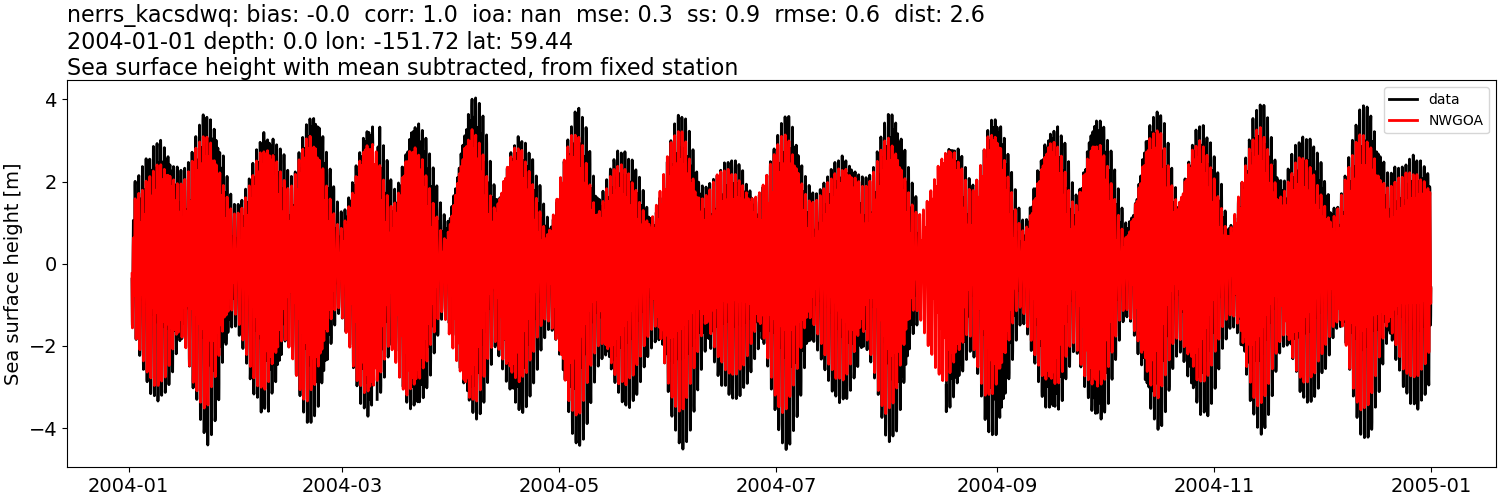
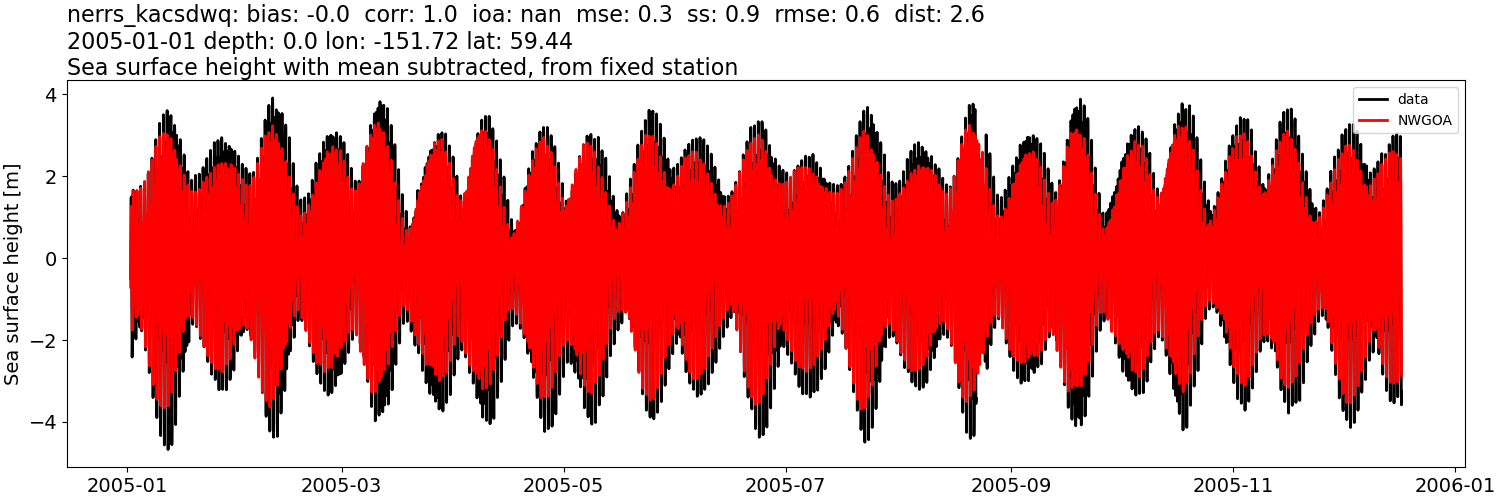
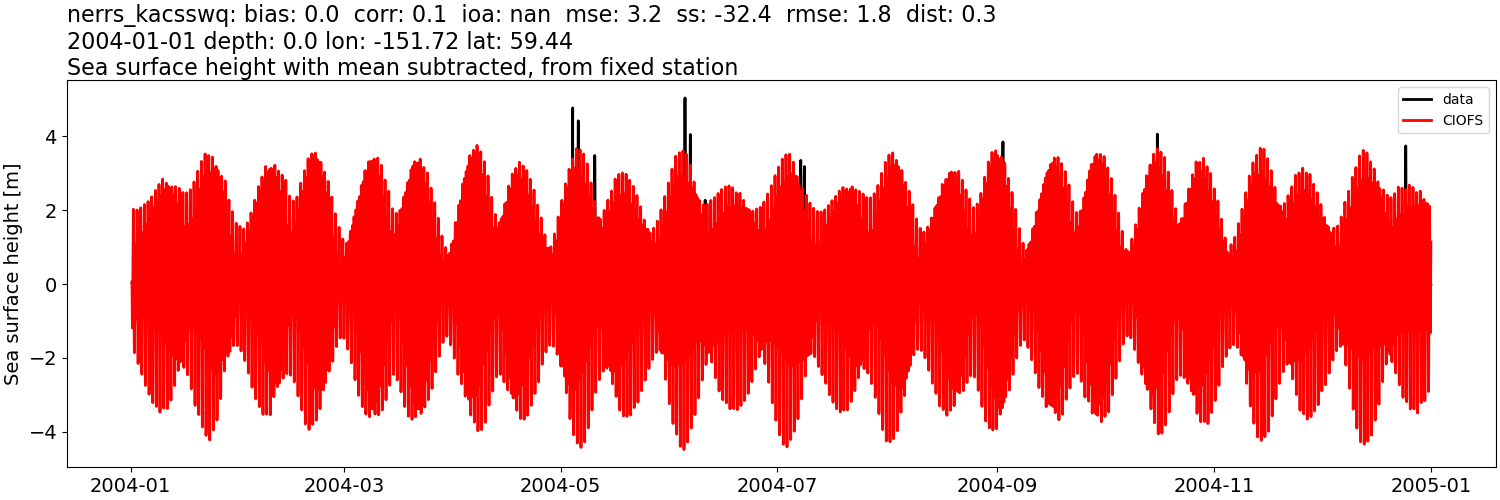
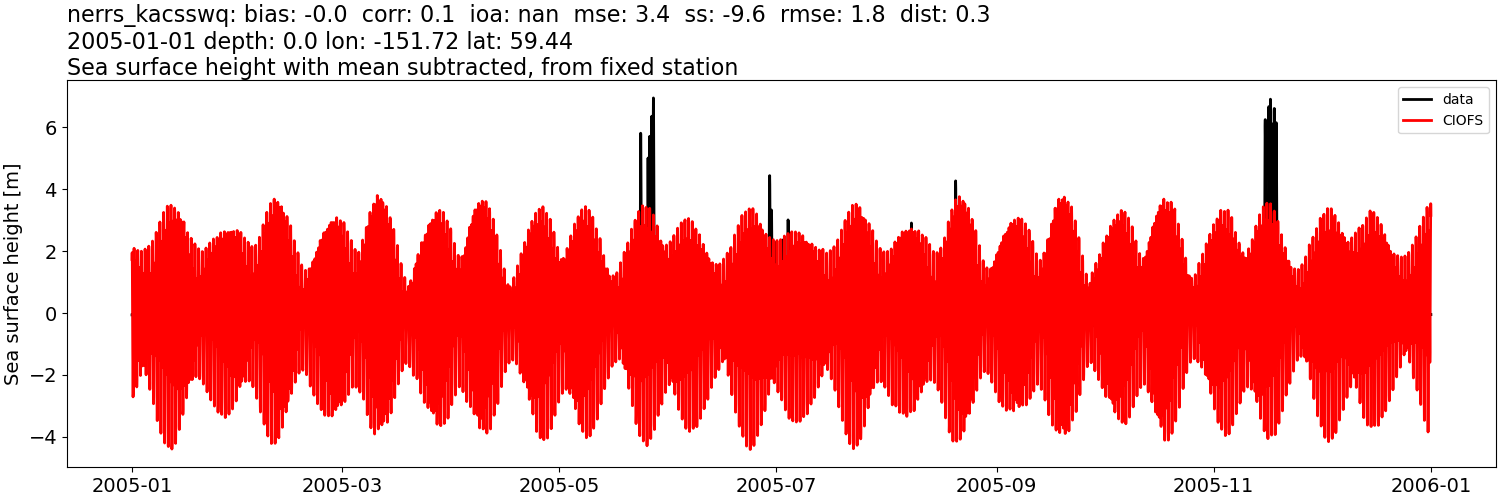
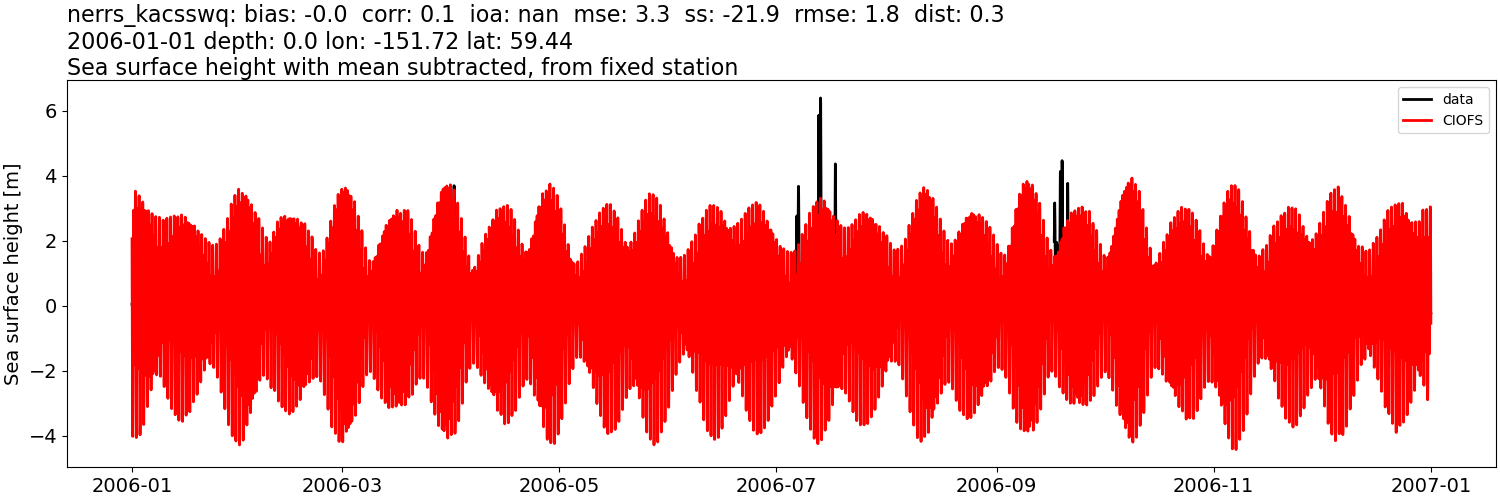
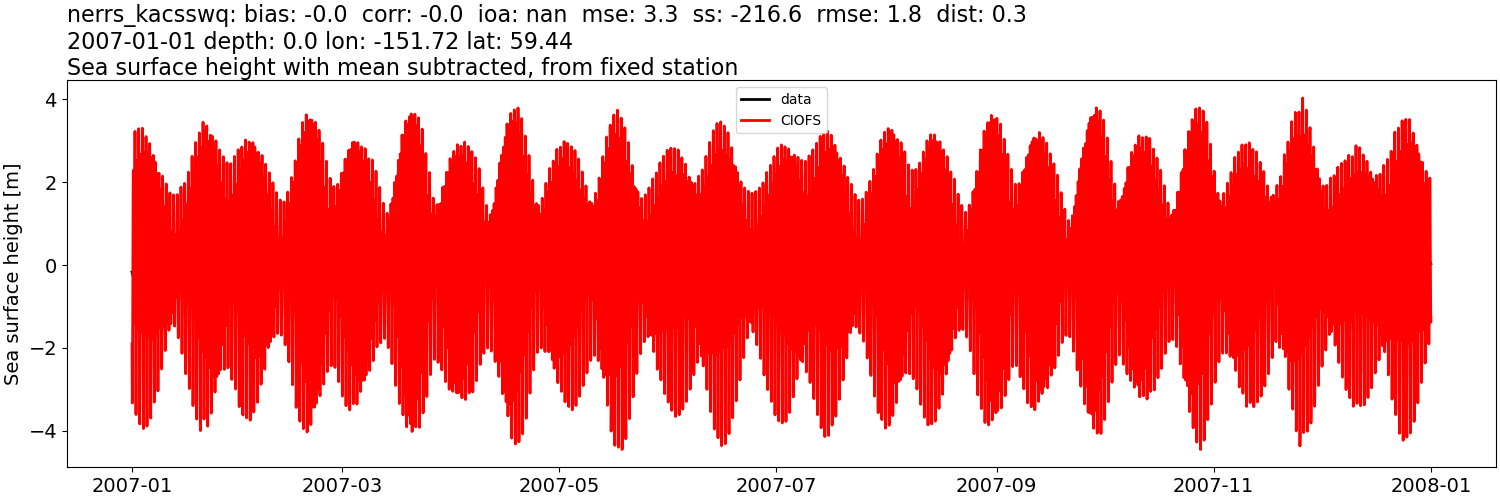
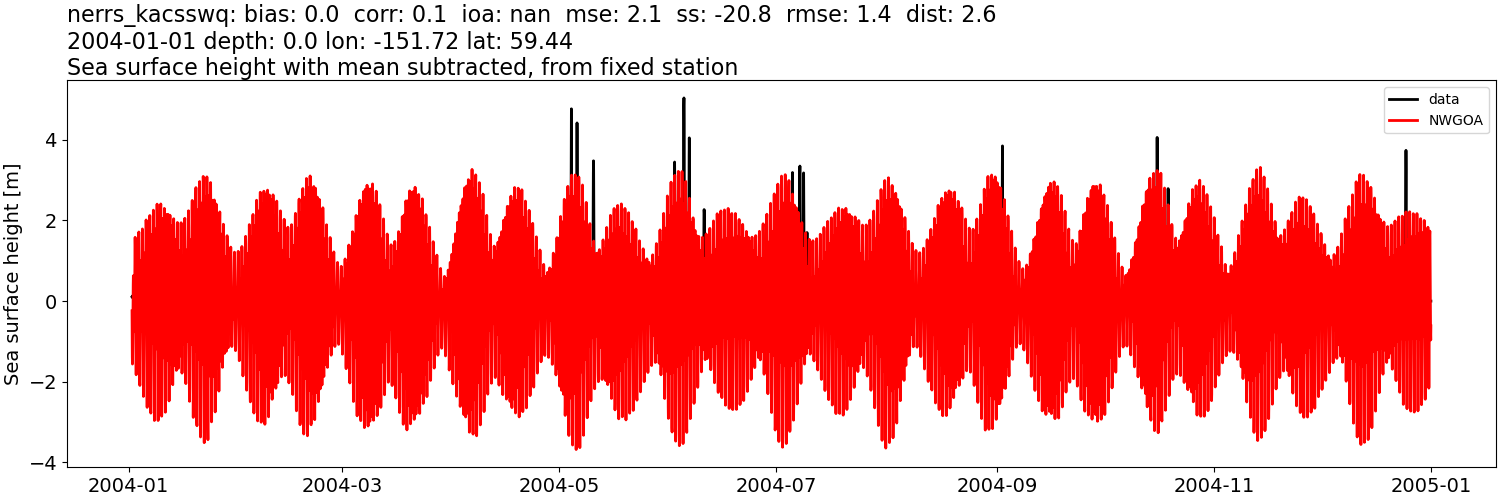
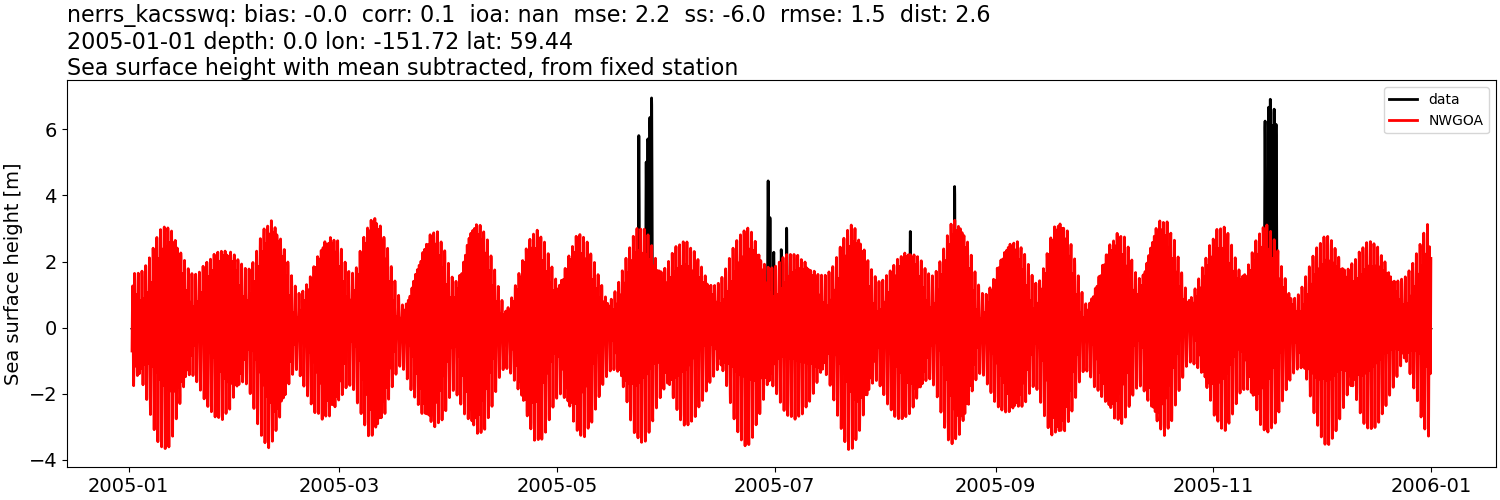
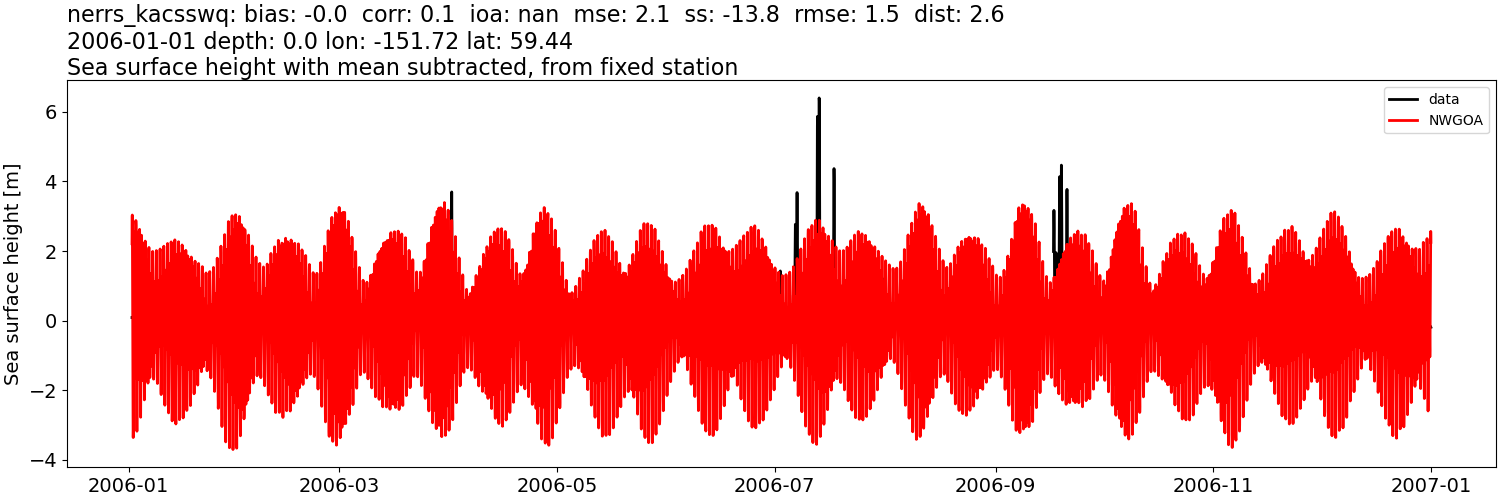
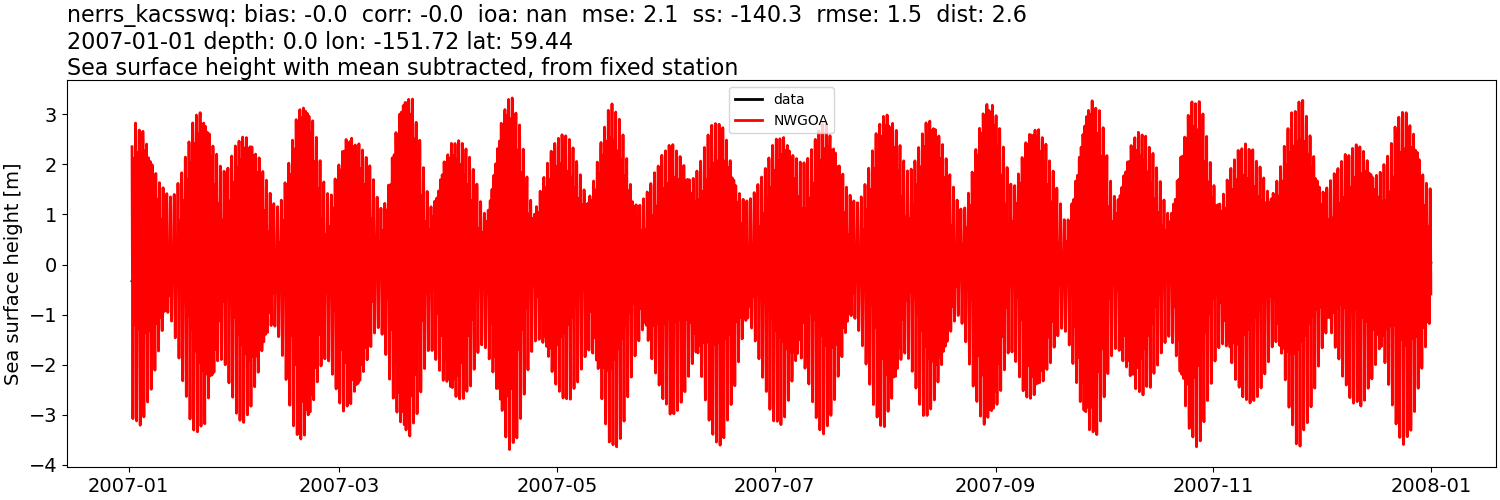
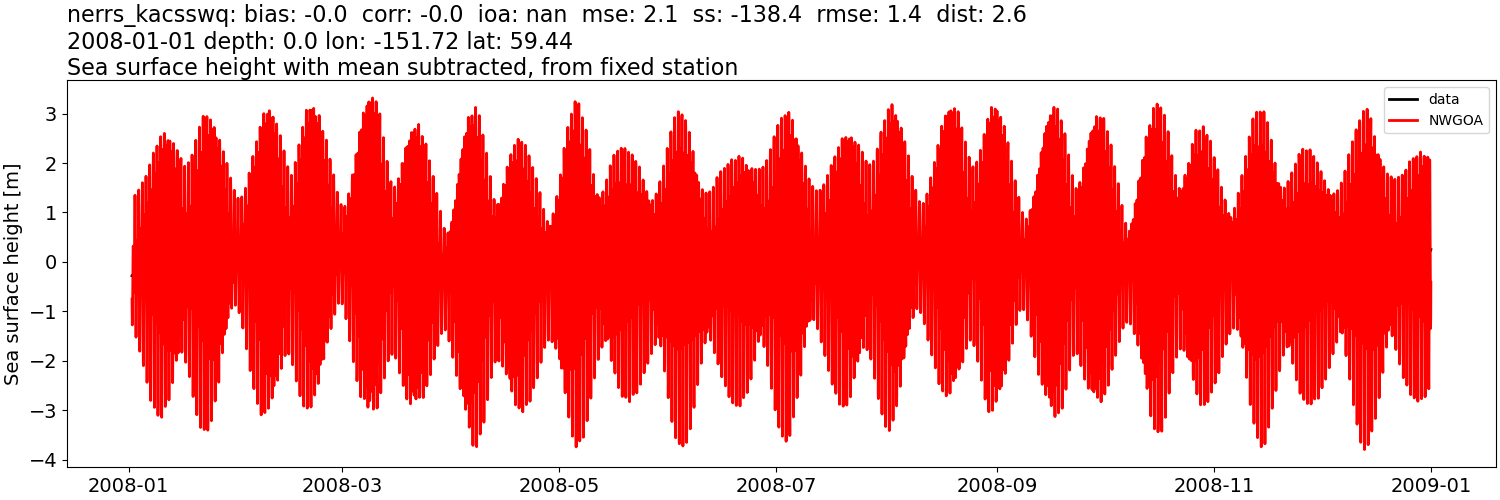
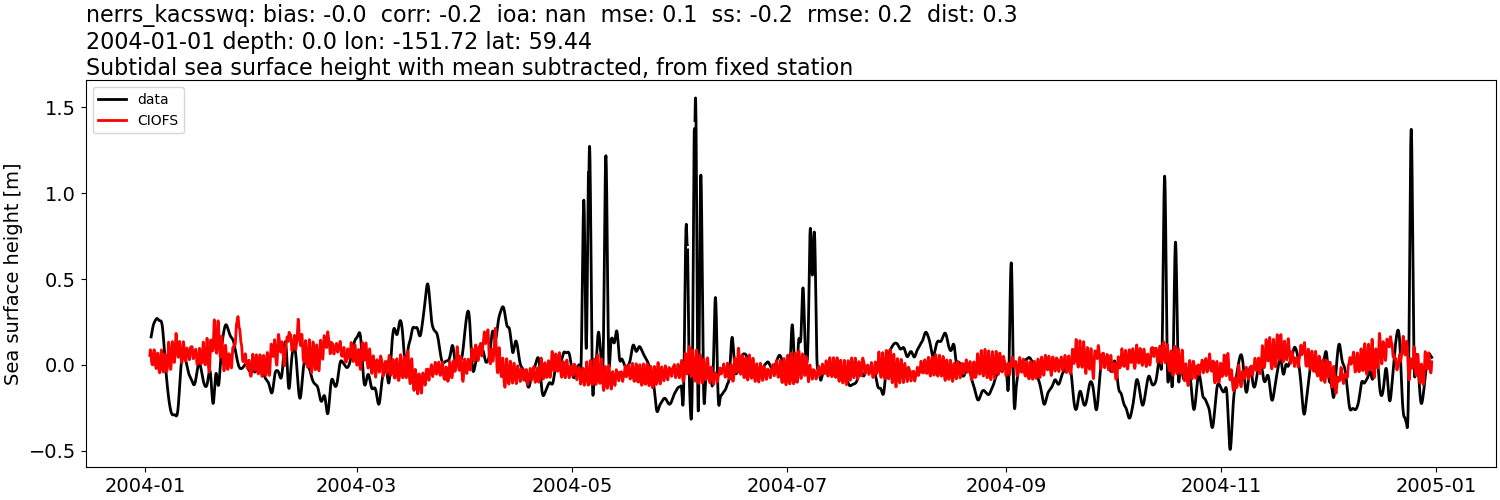
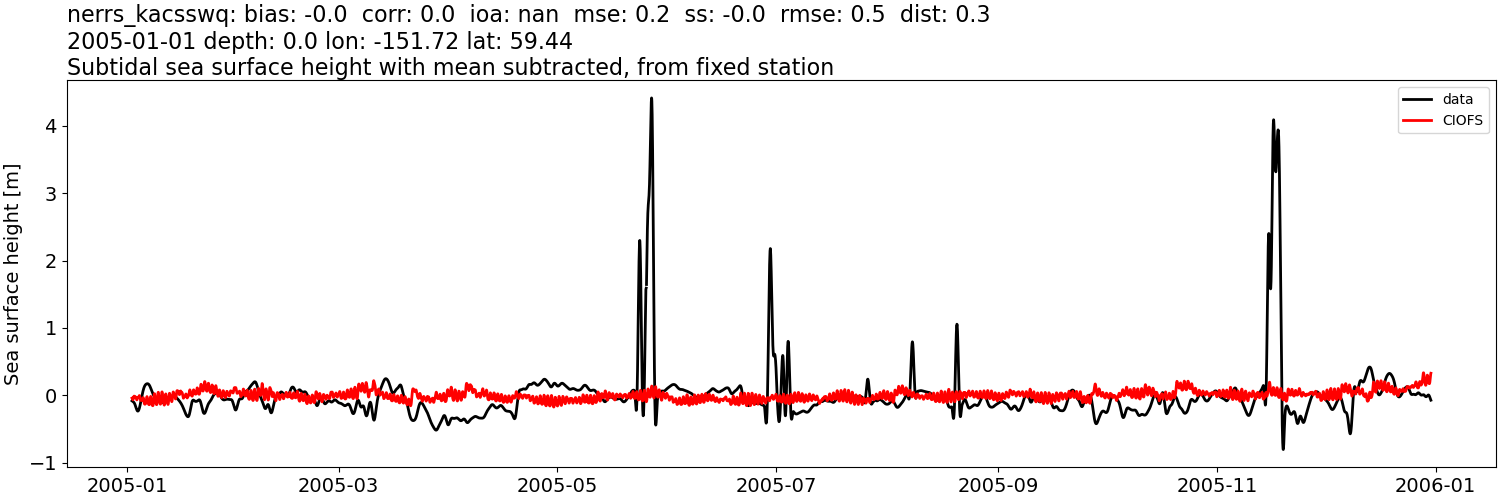
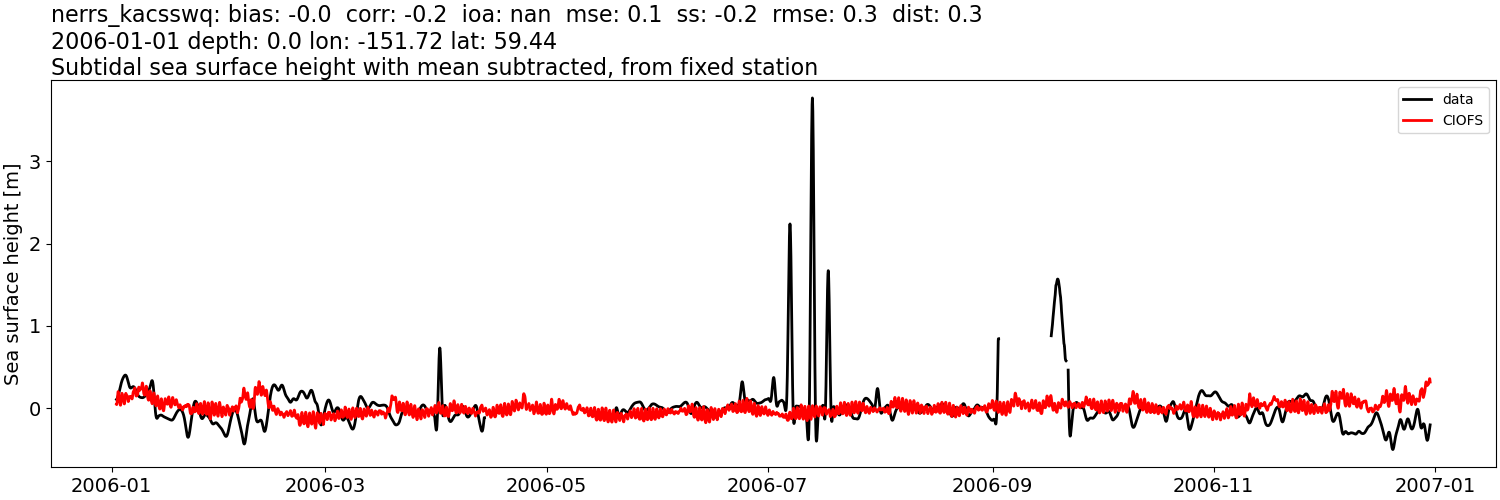
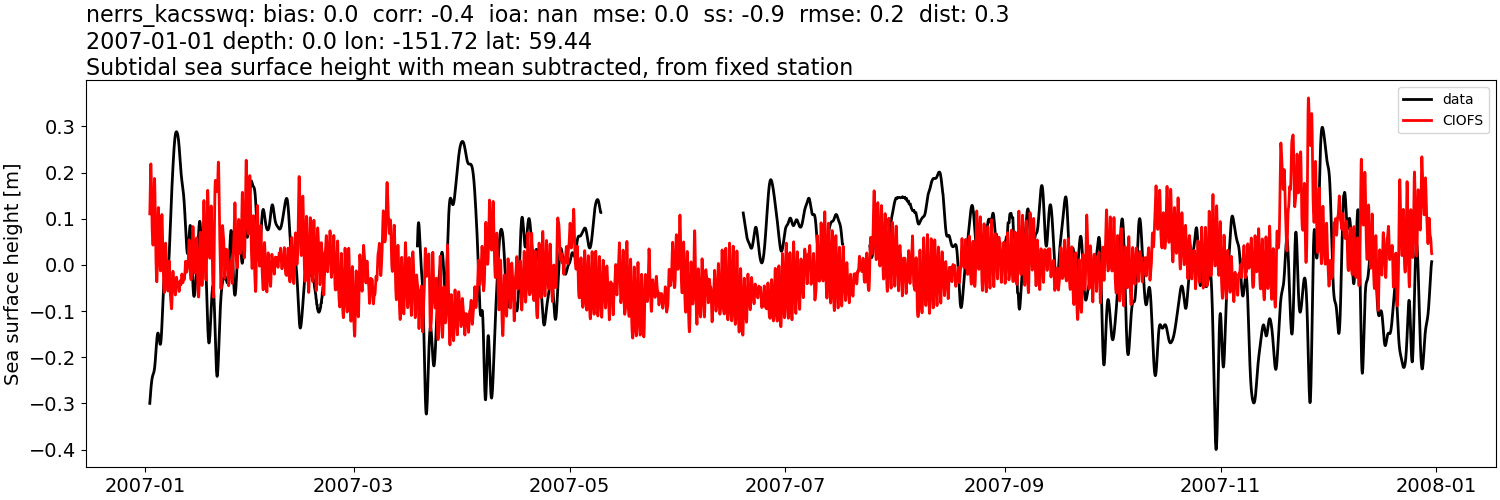
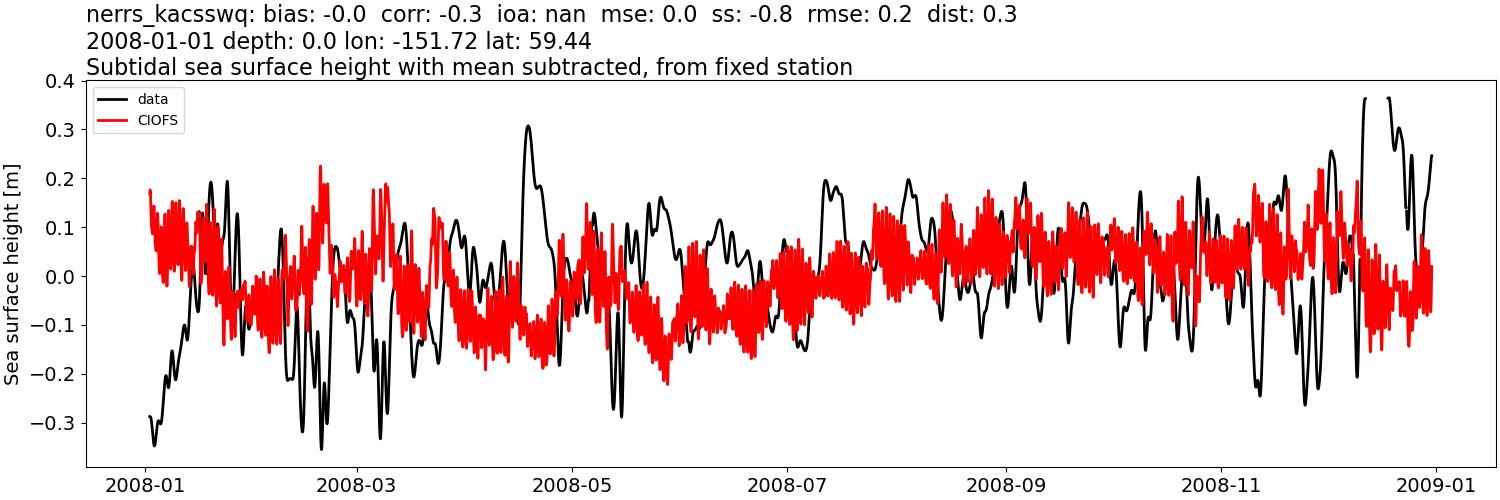
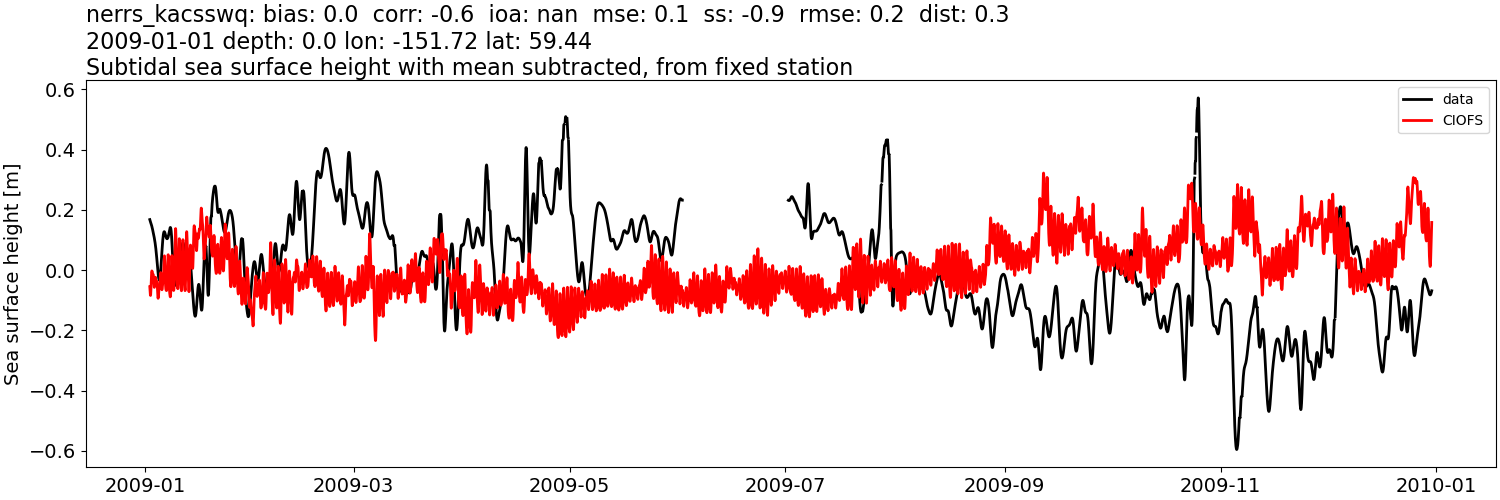
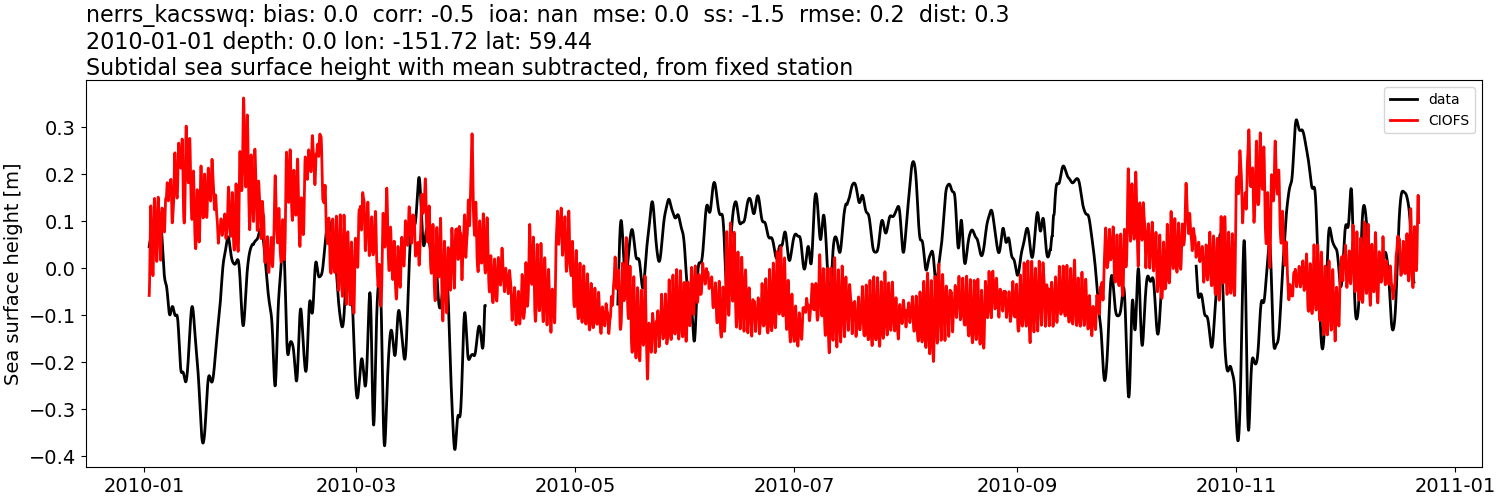
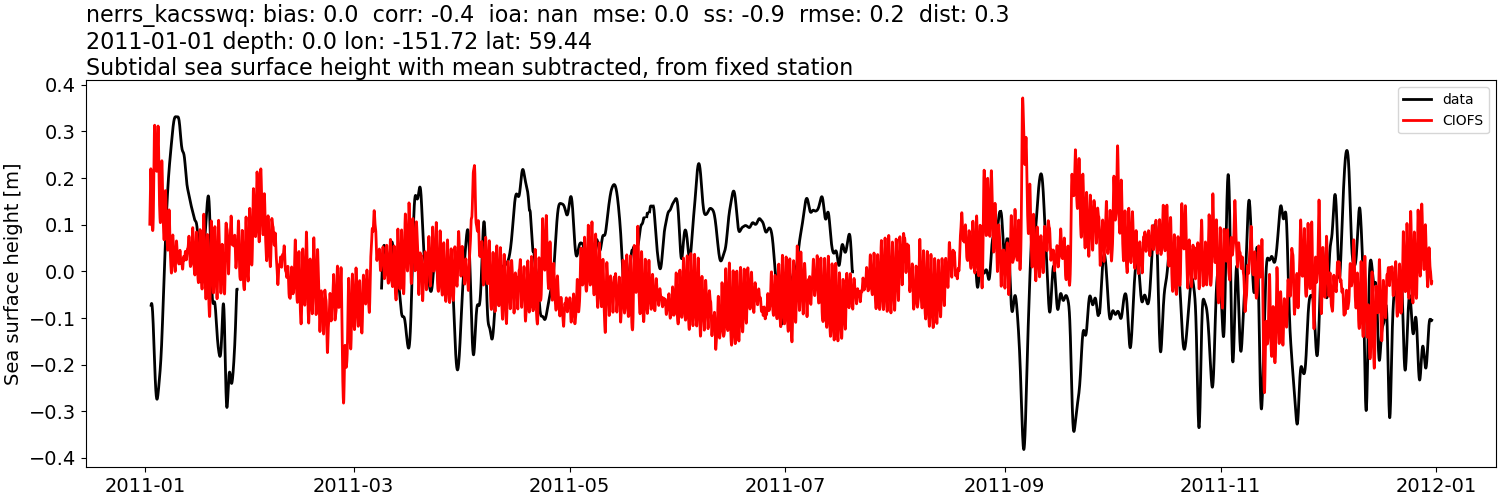
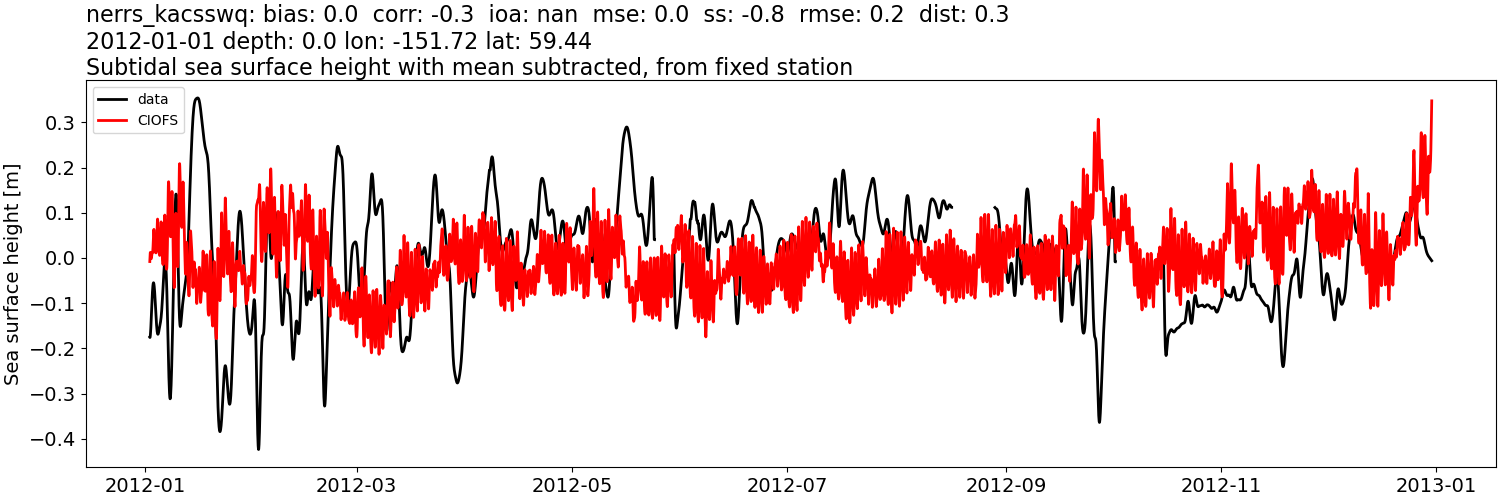
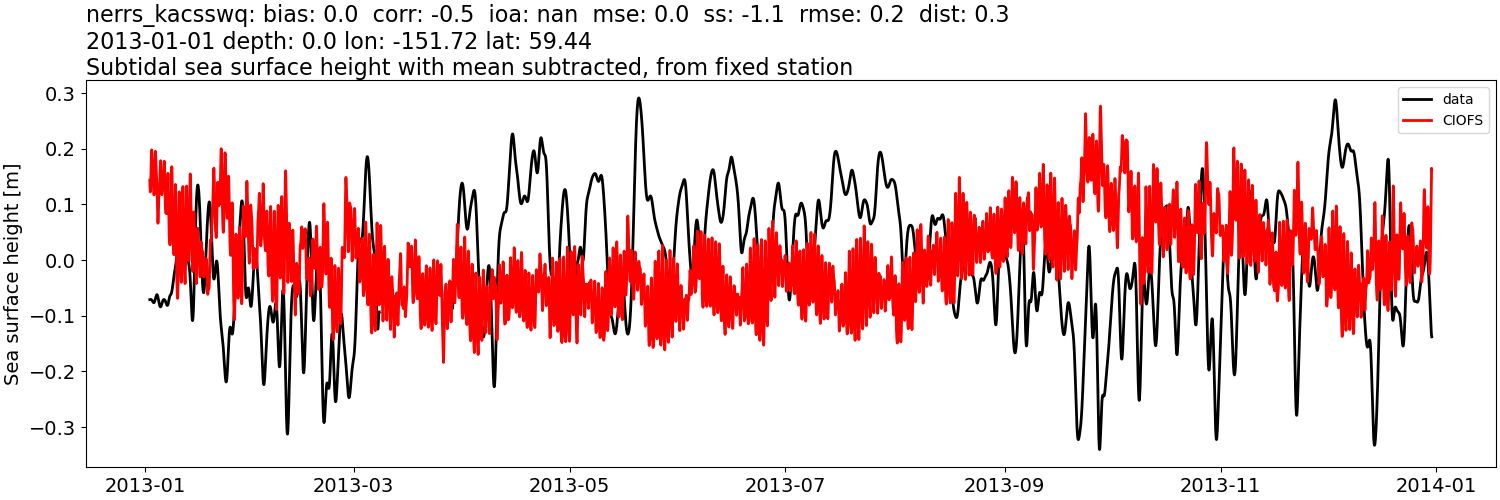
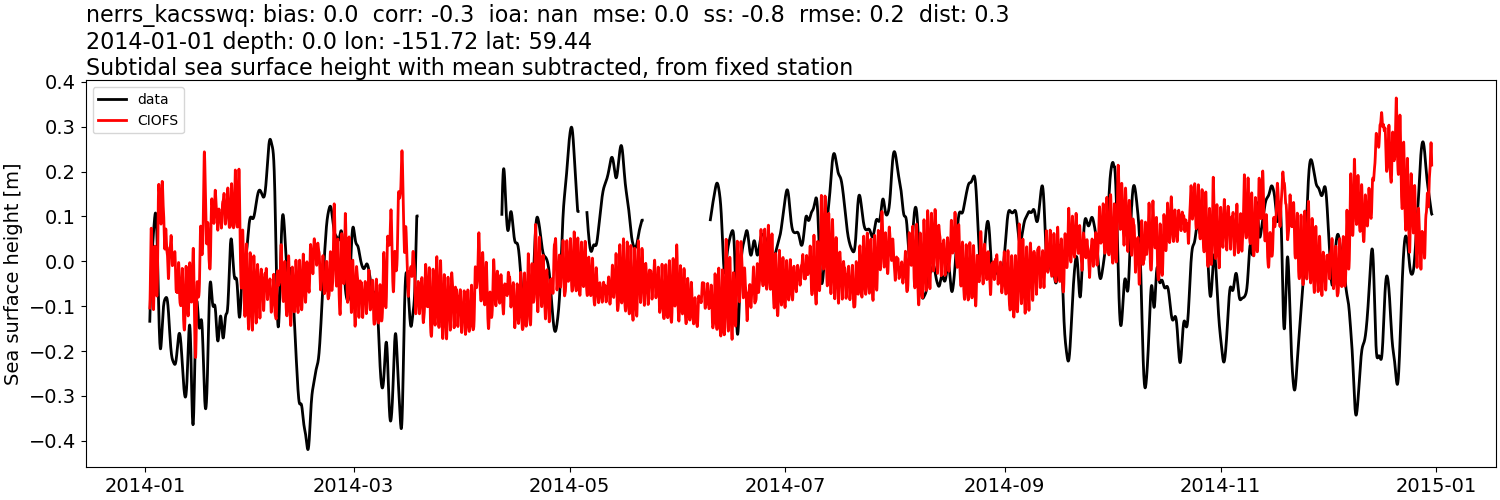
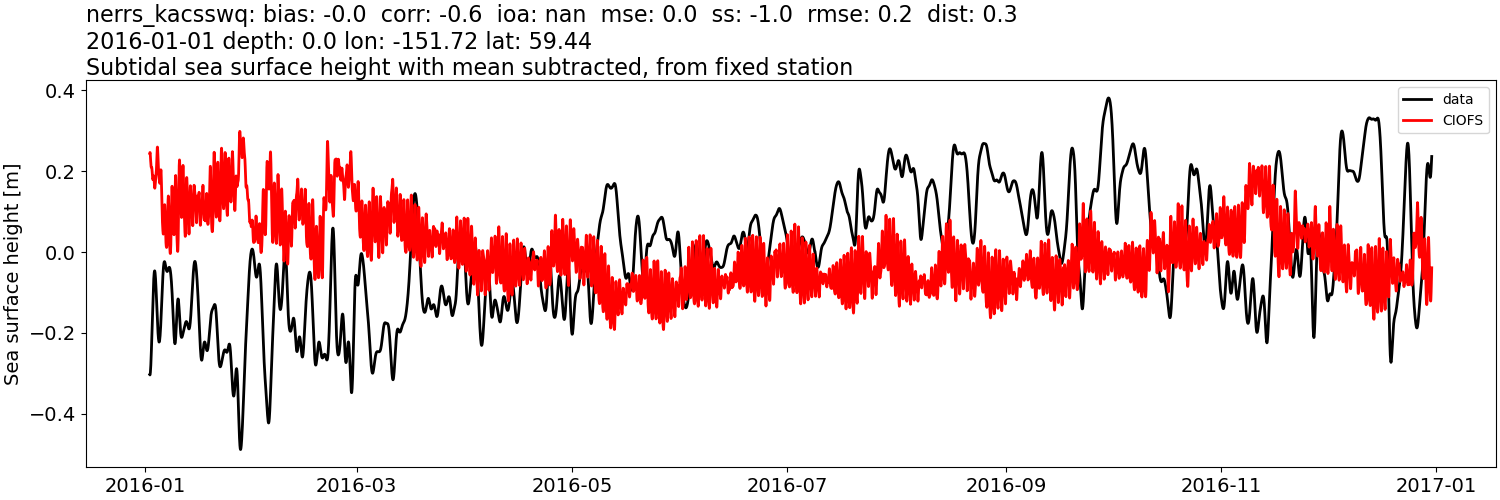
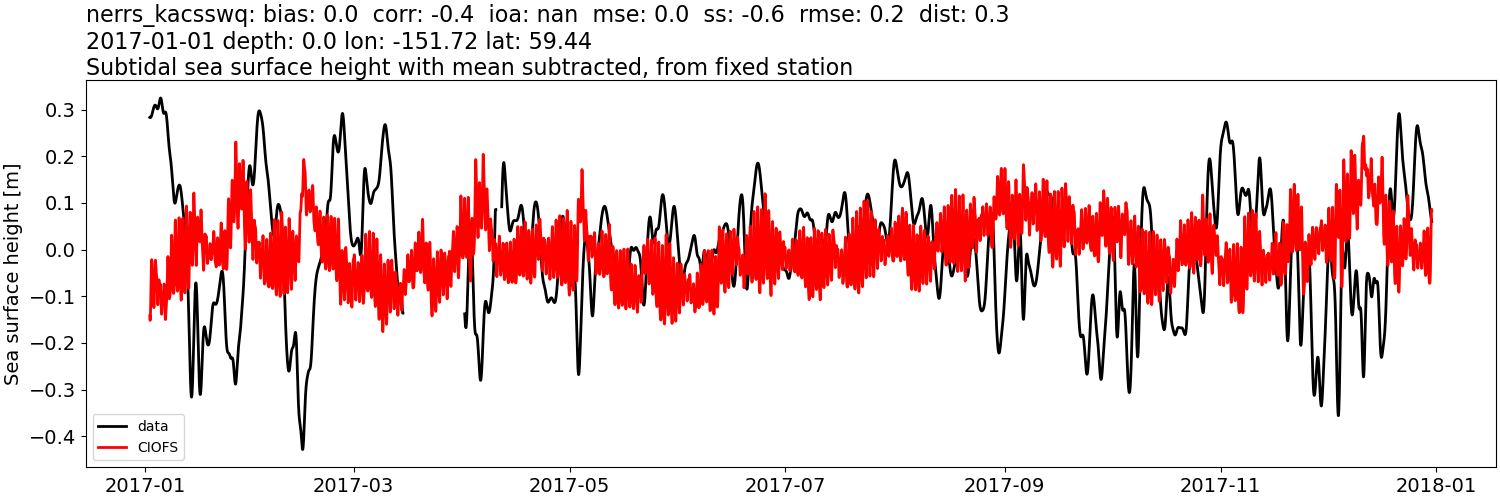
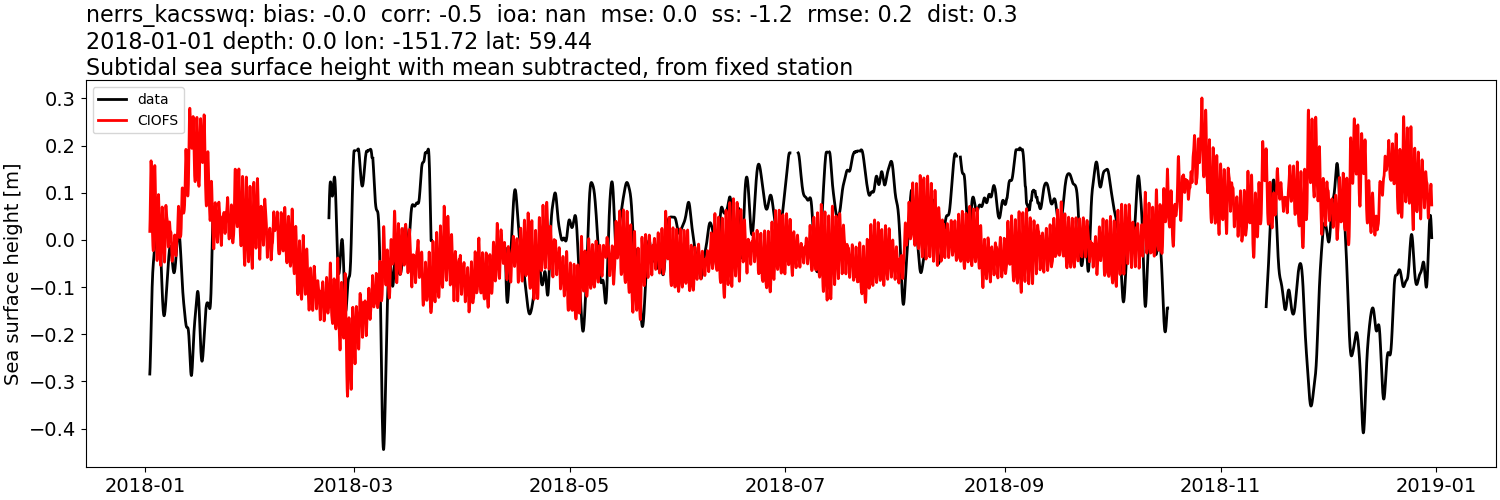
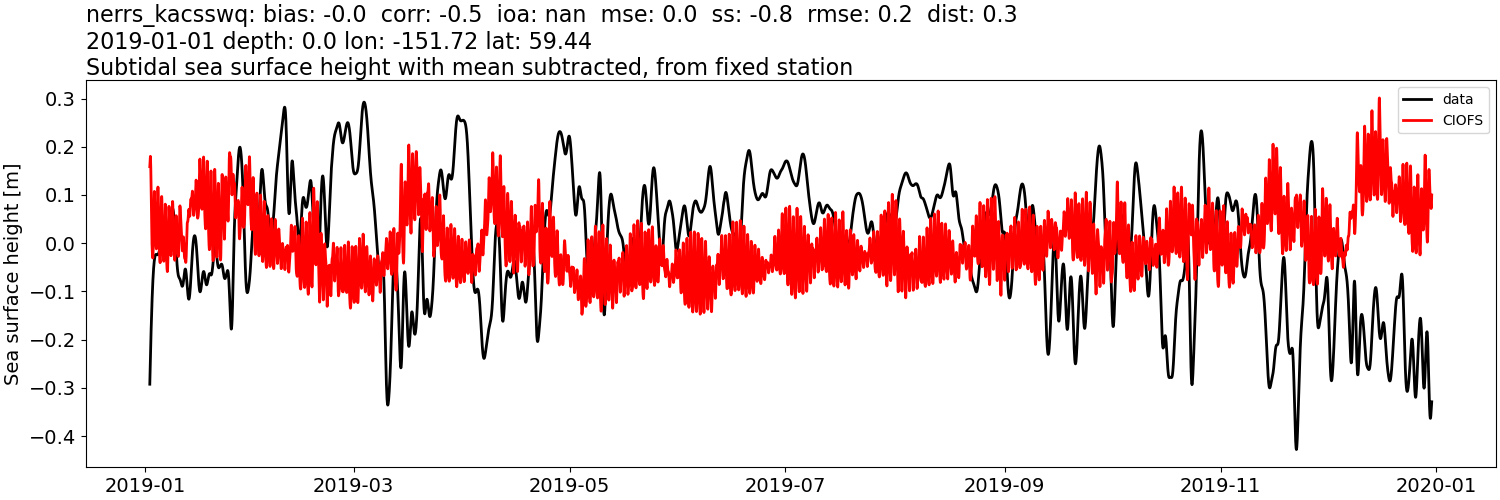
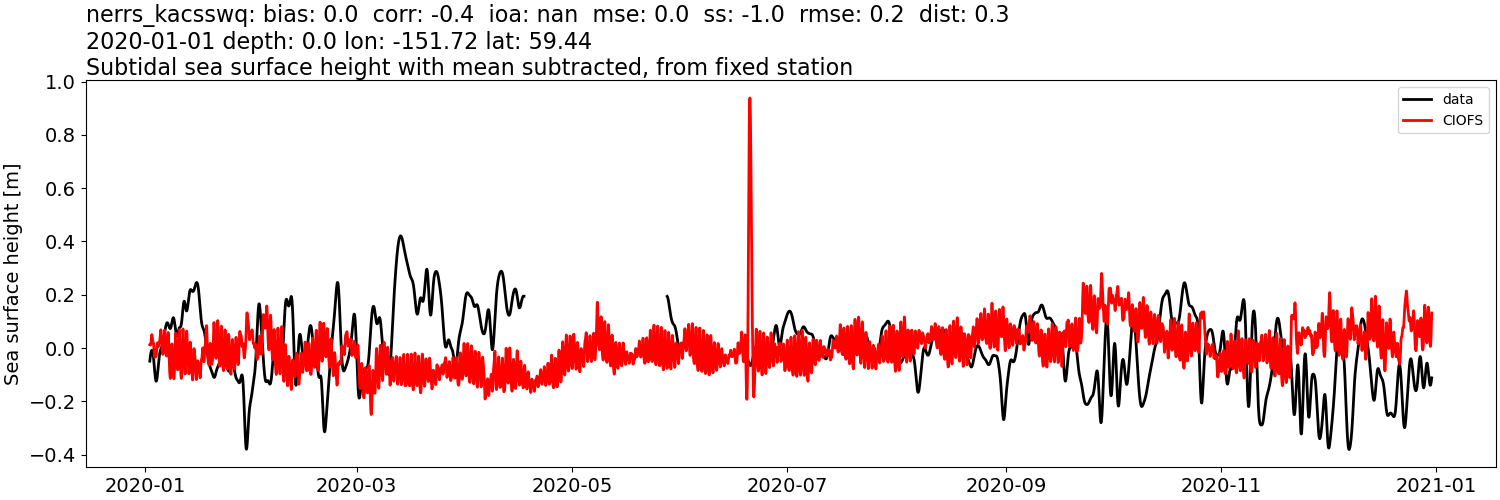
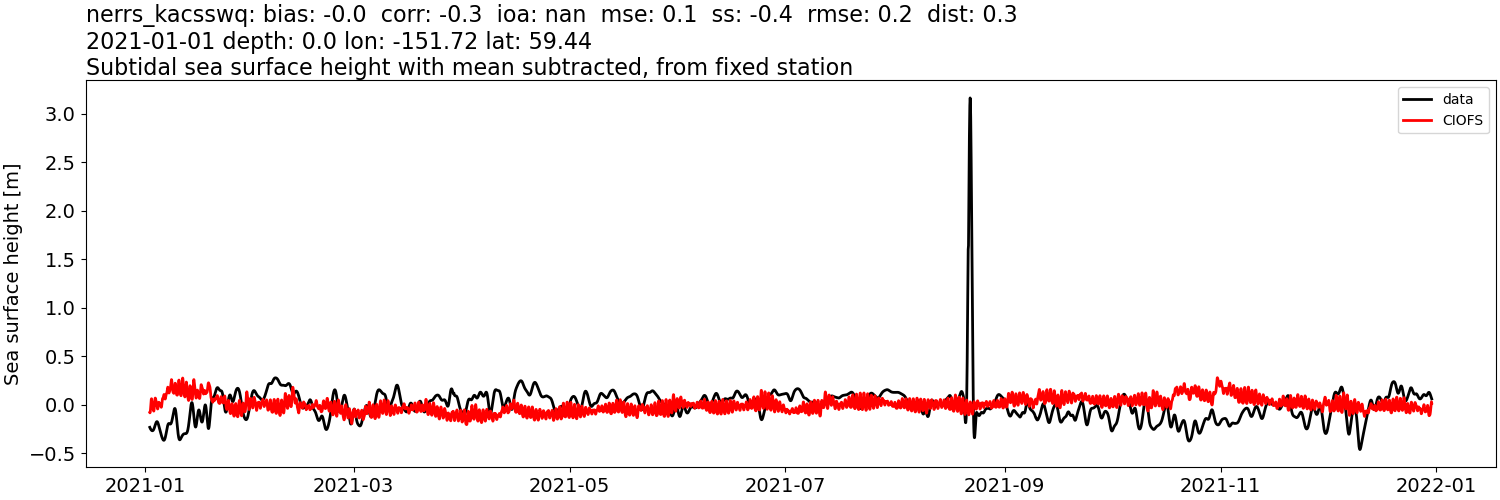
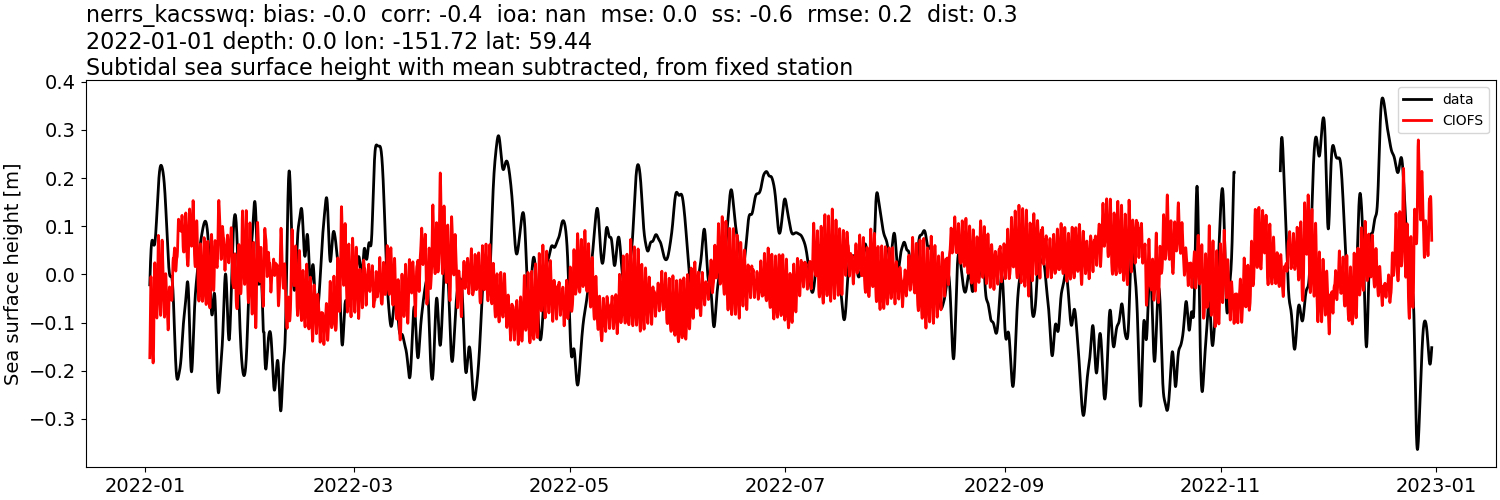
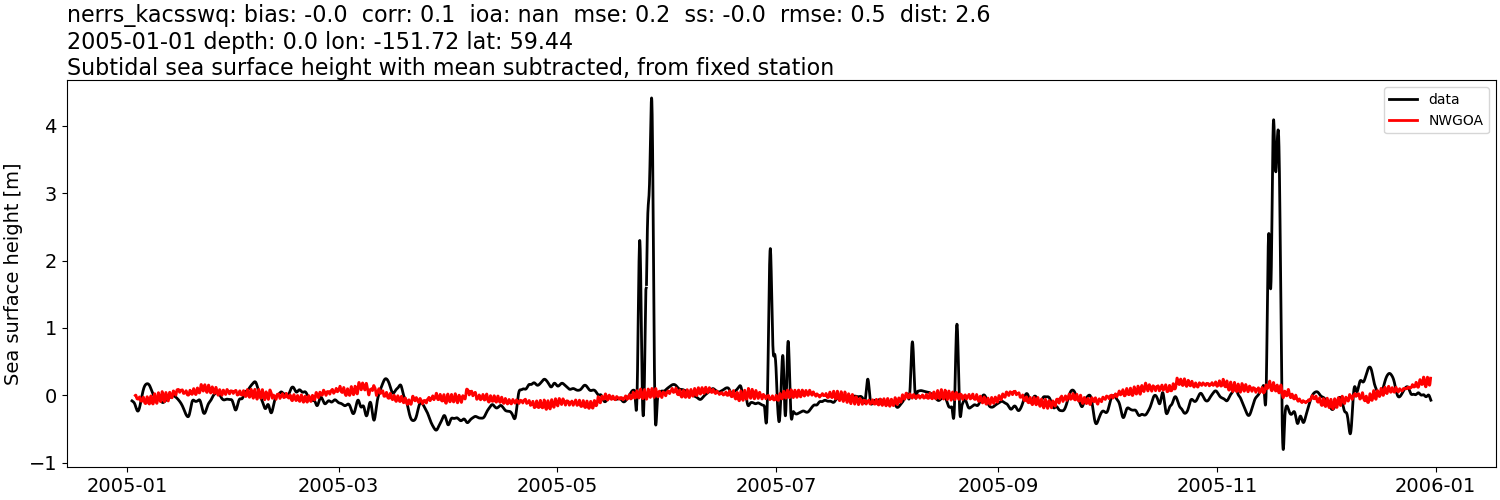
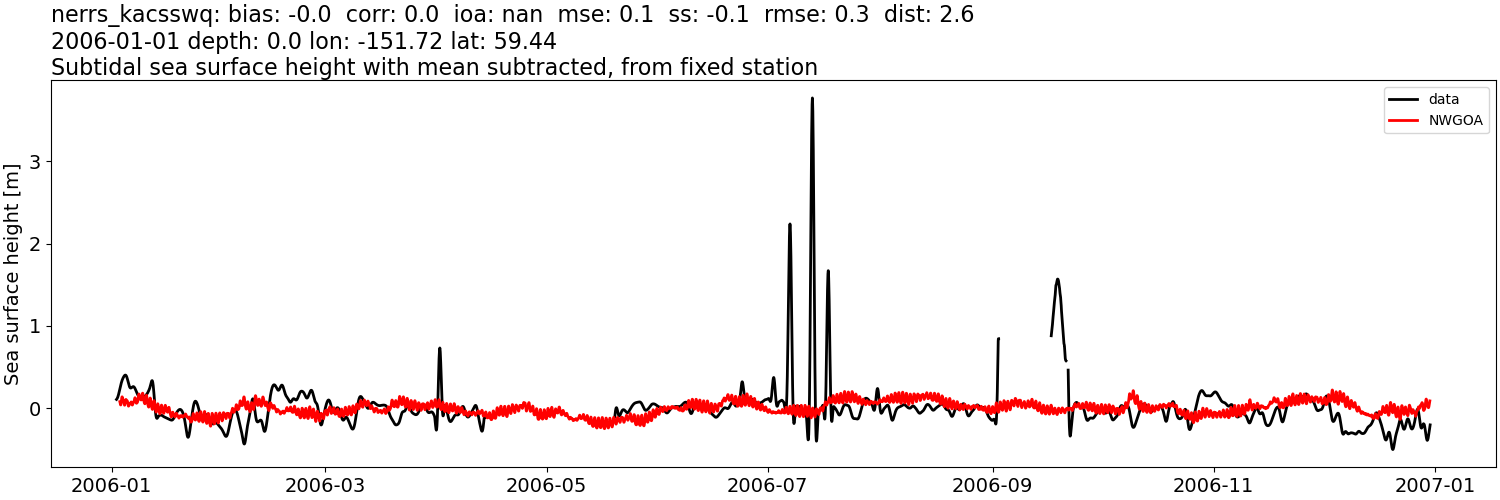
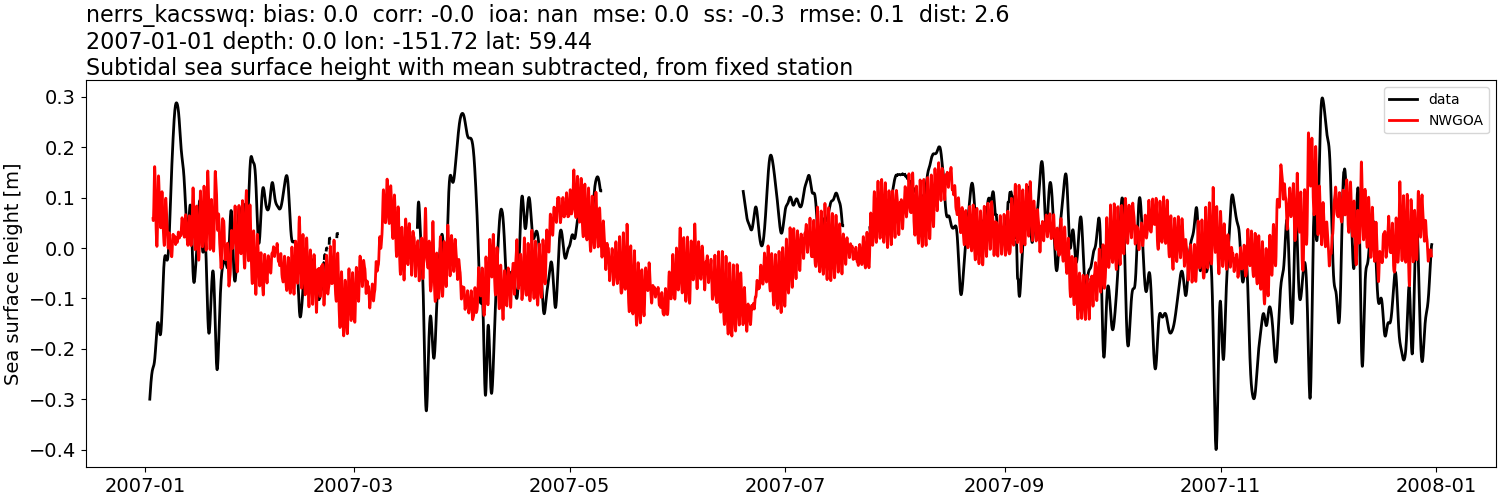
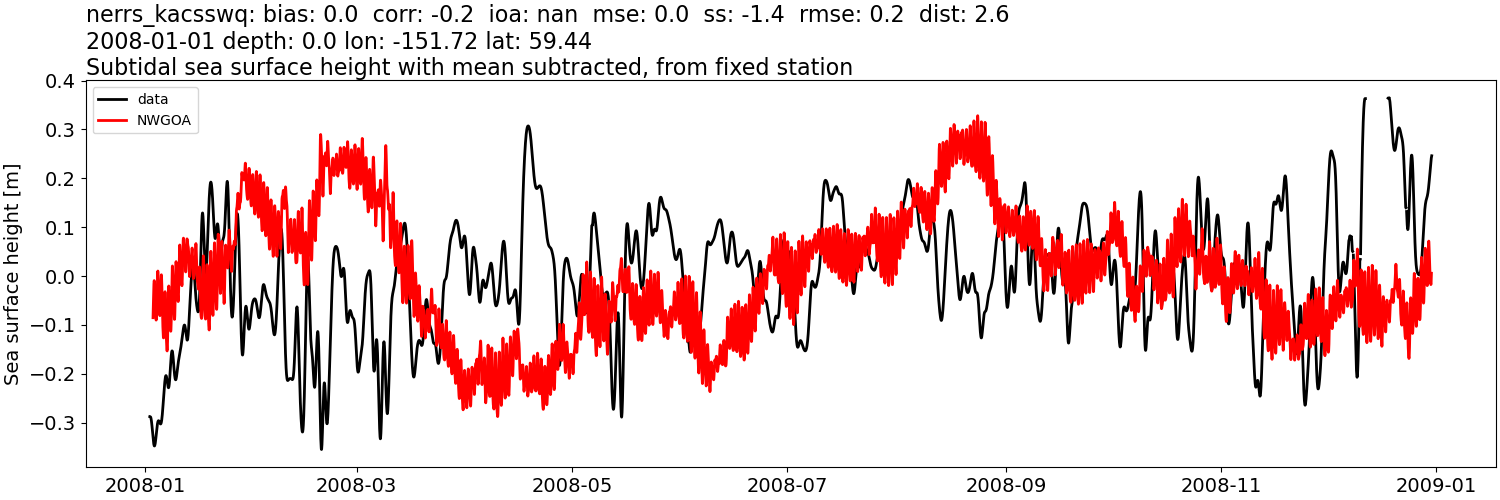
Sea surface height: mean subtracted#
CIOFS#
Comparison plots by year
2004
2005
2006
2007
2008
2009
2010
2011

2012
2013
2014
2015

2016
2017
2018
2019
2020
2021
2022

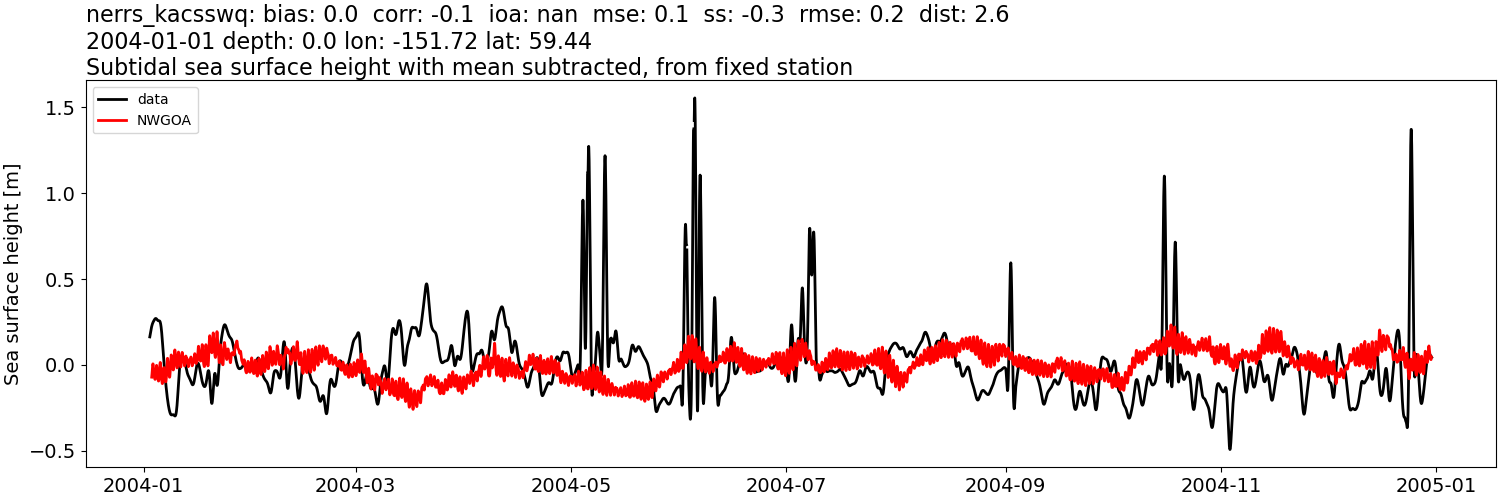
NWGOA#
Comparison plots by year
2004
2005
2006
2007
2008
Sea surface height: mean subtracted, then tidally-filtered#
CIOFS#
Comparison plots by year
2004
2005
2006
2007
2008
2009
2010
2011
2012
2013
2014
2015

2016
2017
2018
2019
2020
2021
2022
NWGOA#
Comparison plots by year
2004
2005
2006
2007
2008
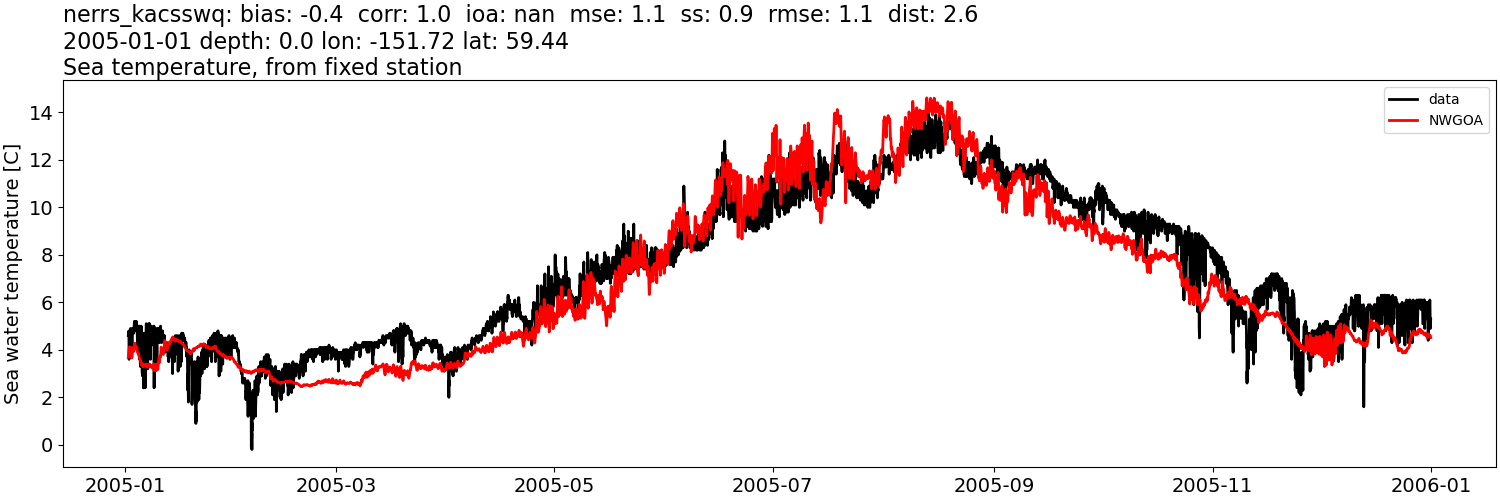
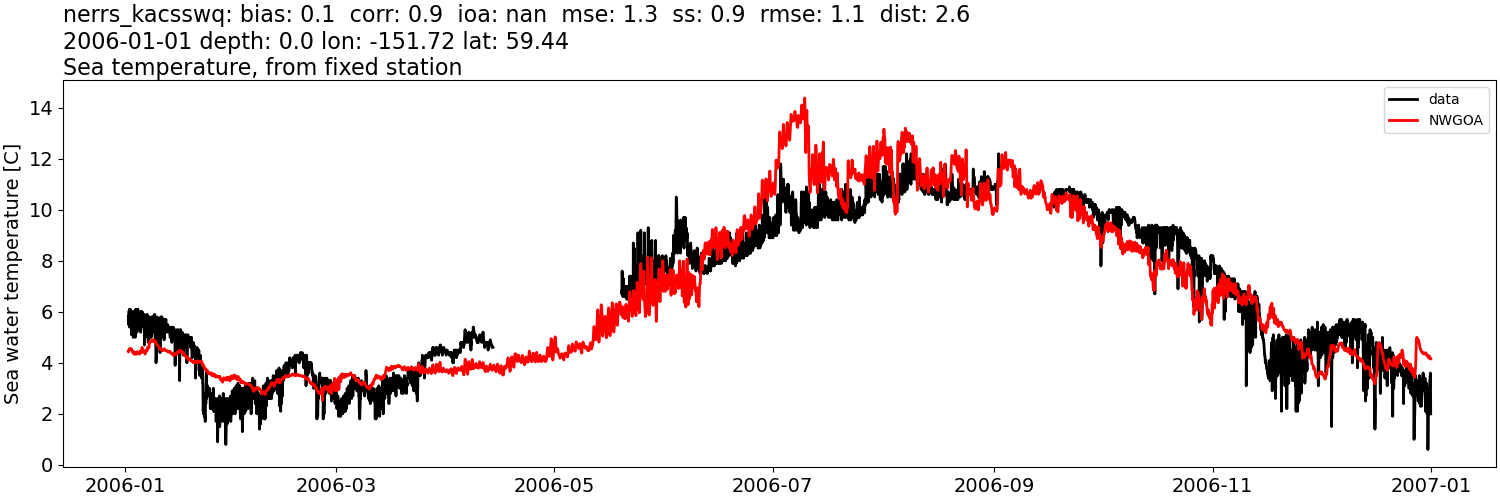
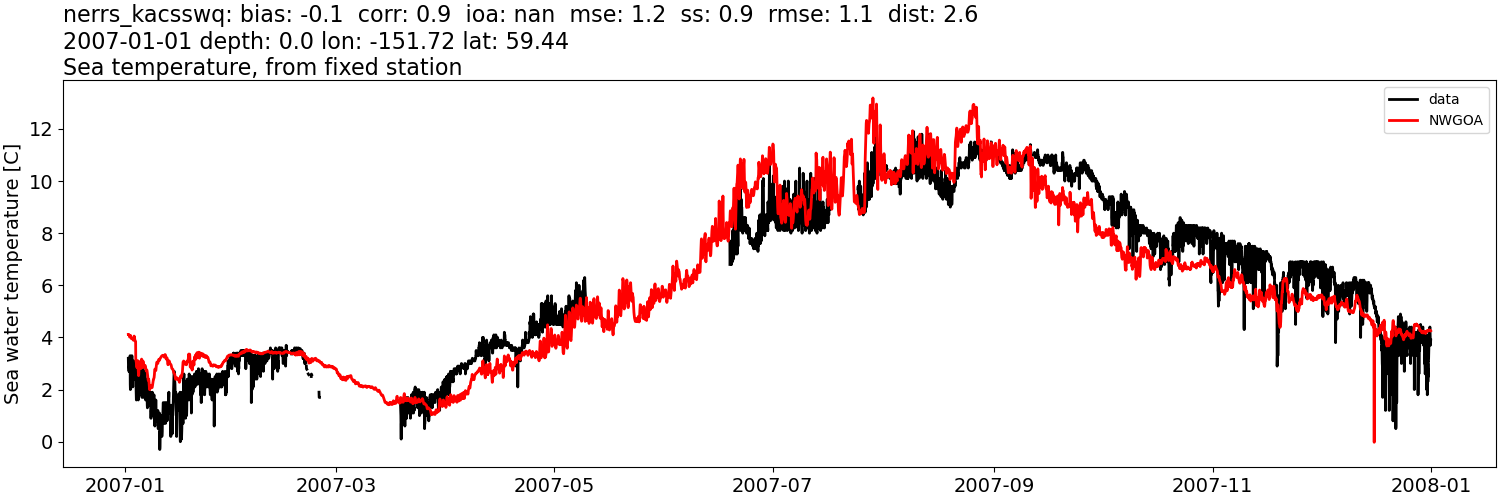
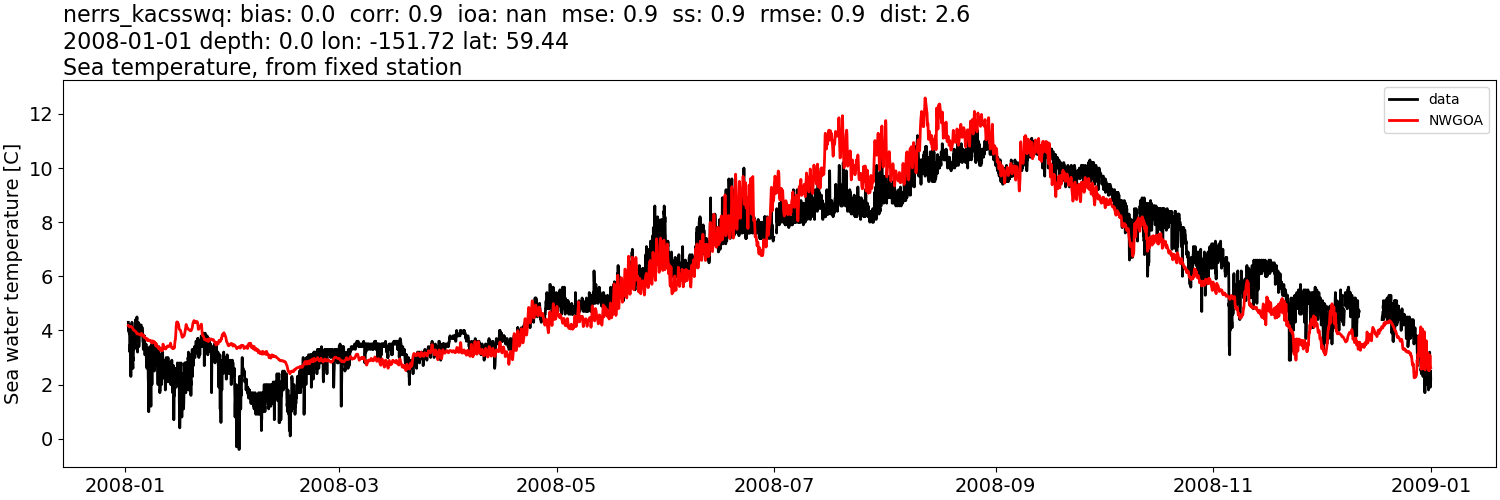
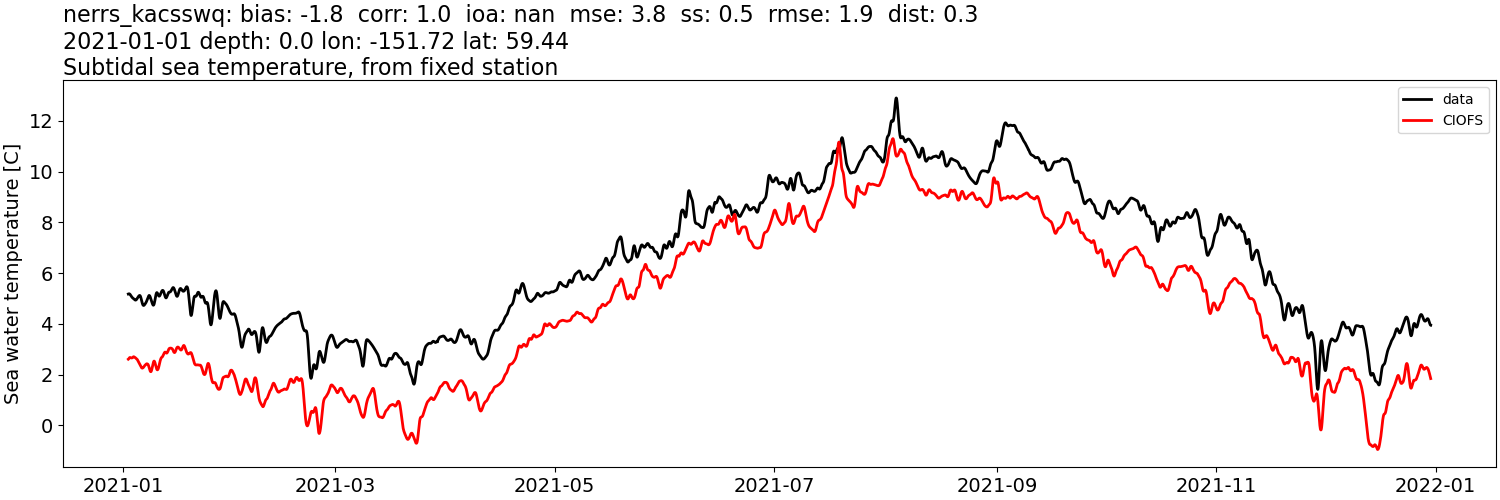
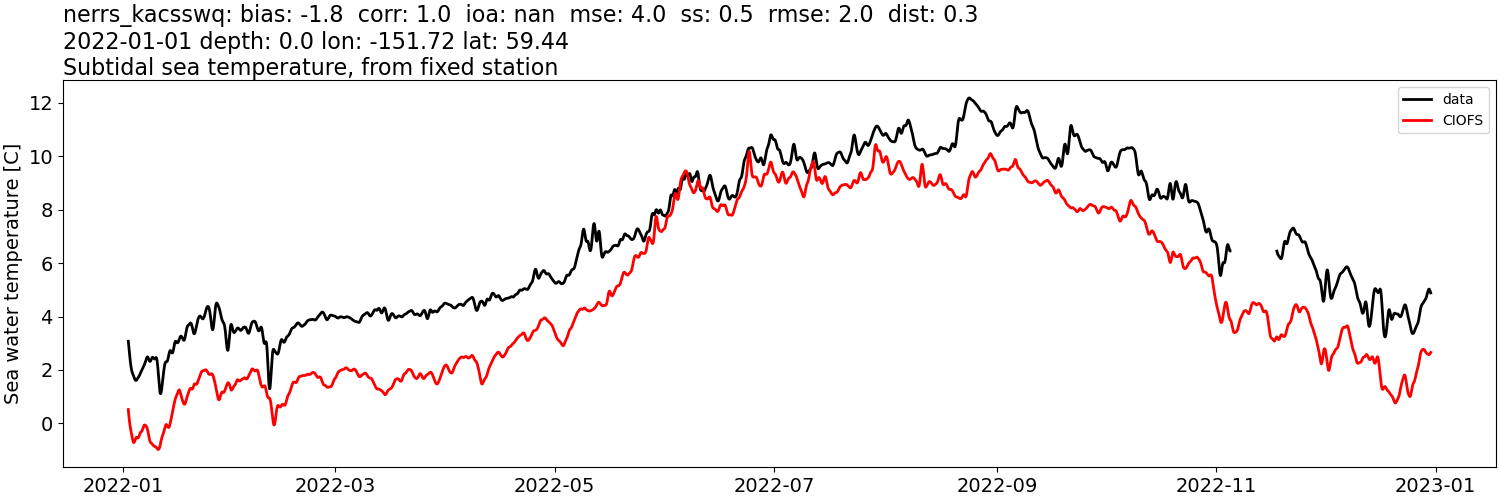
Sea water temperature:#
CIOFS#
Comparison plots by year
2004
2005
2006
2007
2008
2009
2010
2011
2012
2013
2014
2015
2016
2017
2018
2019
2020
2021
2022
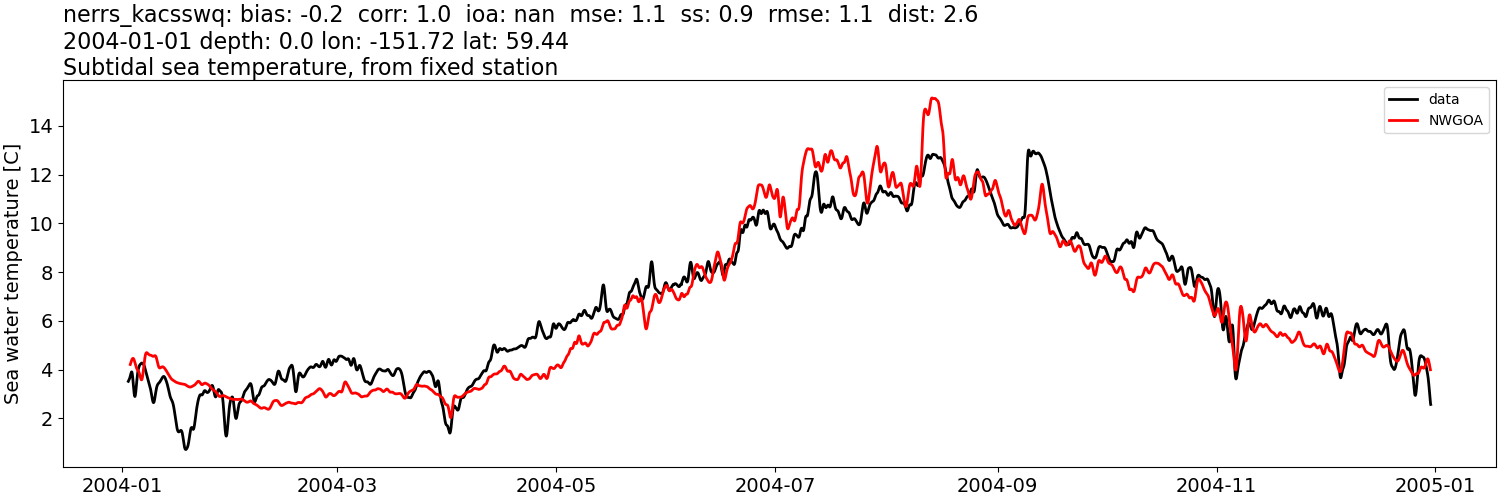
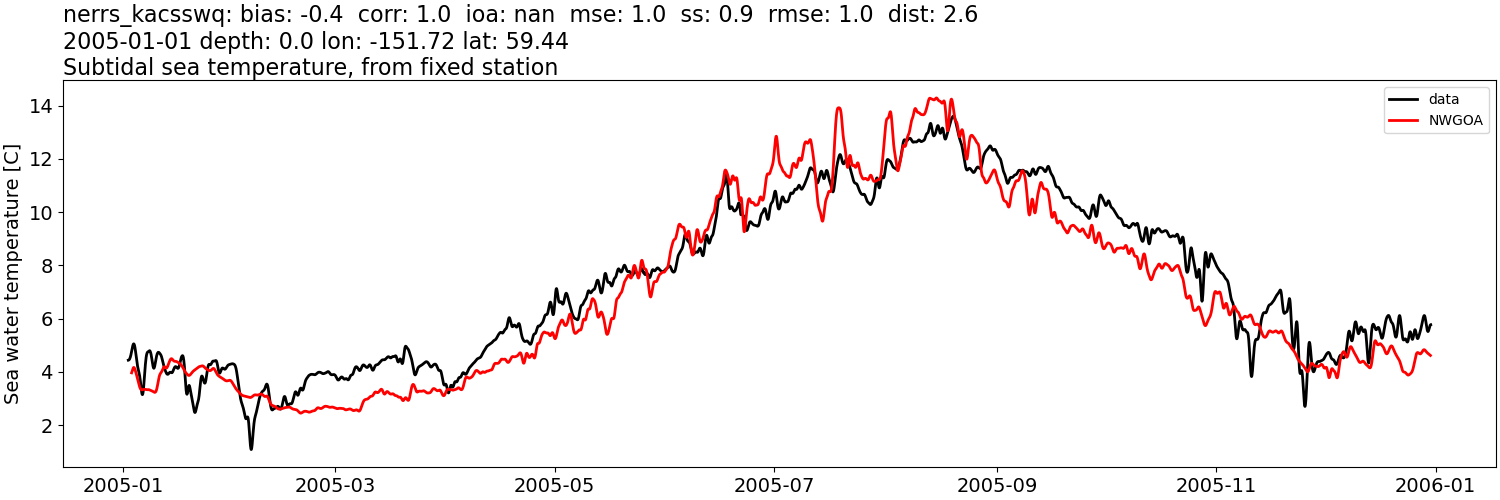
NWGOA#
Comparison plots by year
2004
2005
2006
2007
2008
Sea water temperature: tidally-filtered#
CIOFS#
Comparison plots by year
2004
2005

2006
2007
2008
2009
2010
2011
2012
2013
2014
2015
2016
2017
2018
2019
2020
2021
2022
NWGOA#
Comparison plots by year
2004
2005
2006
2007
2008

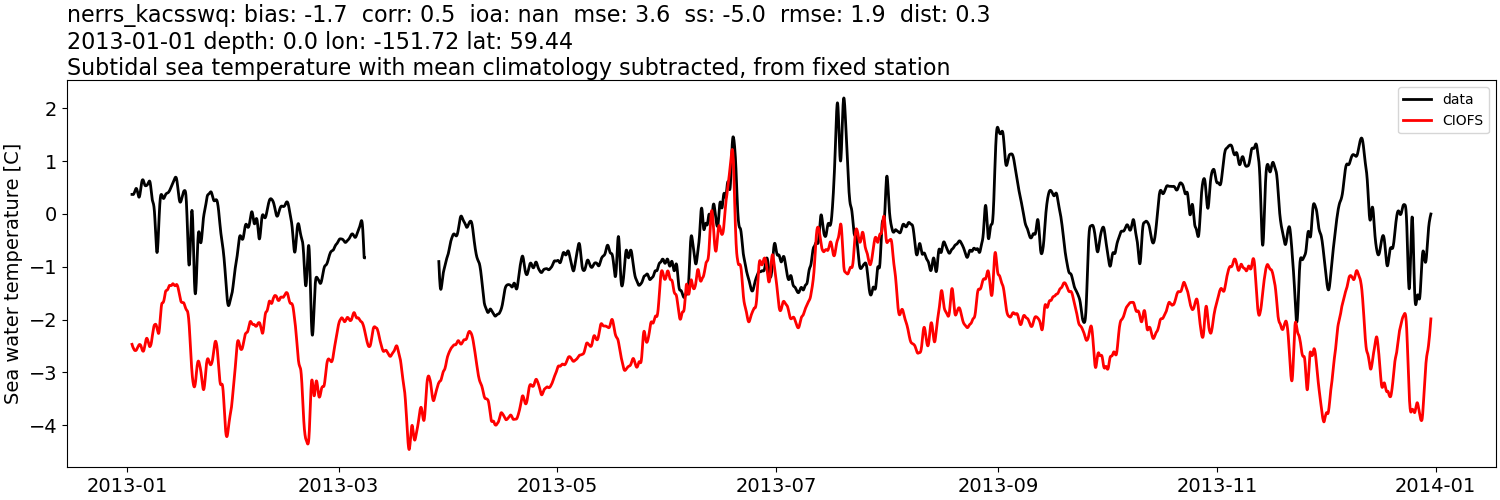
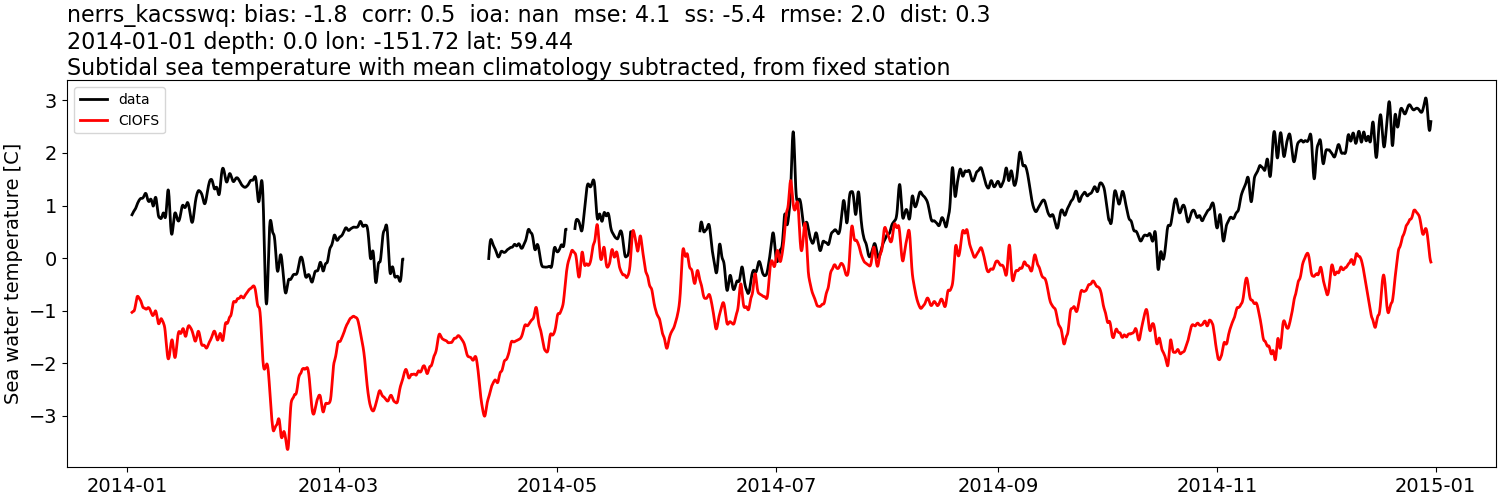
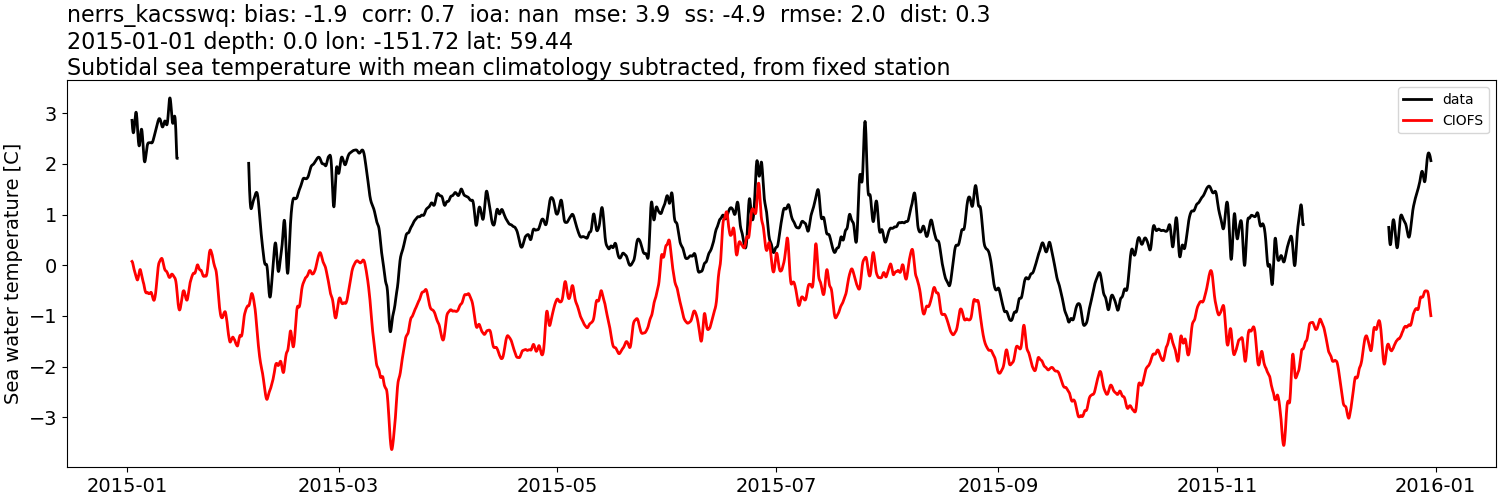
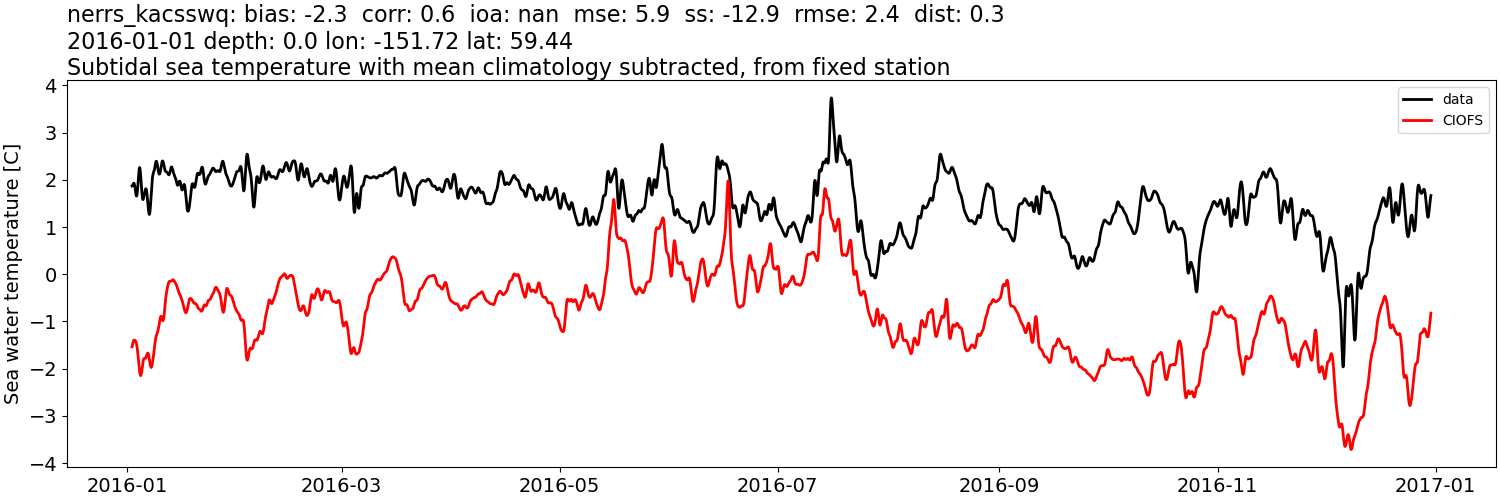
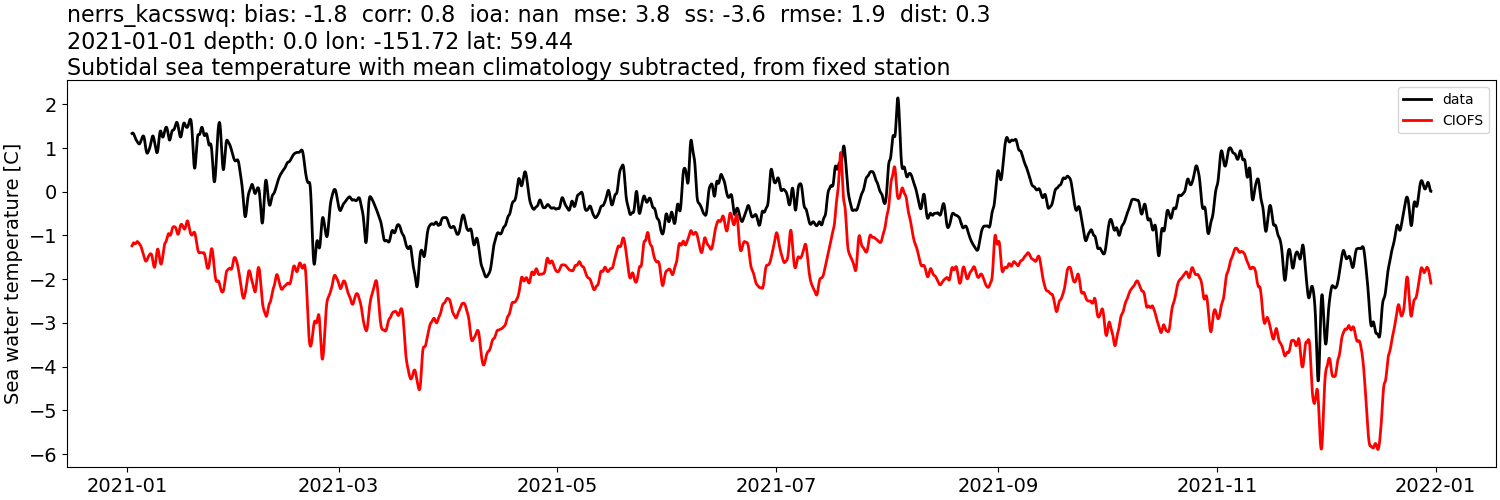
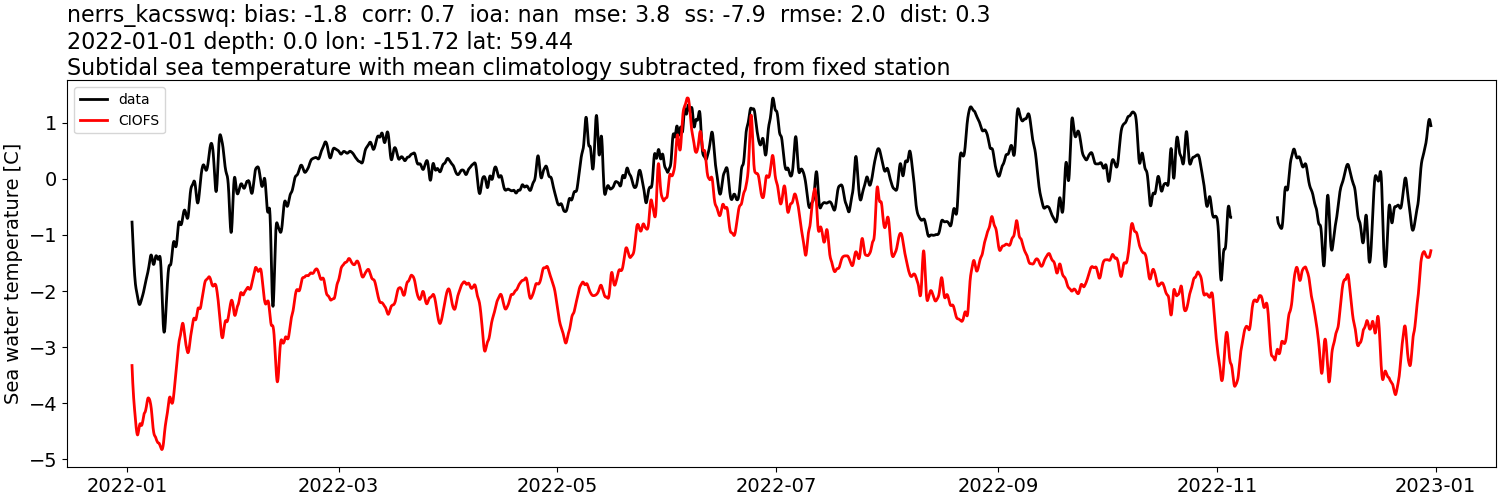
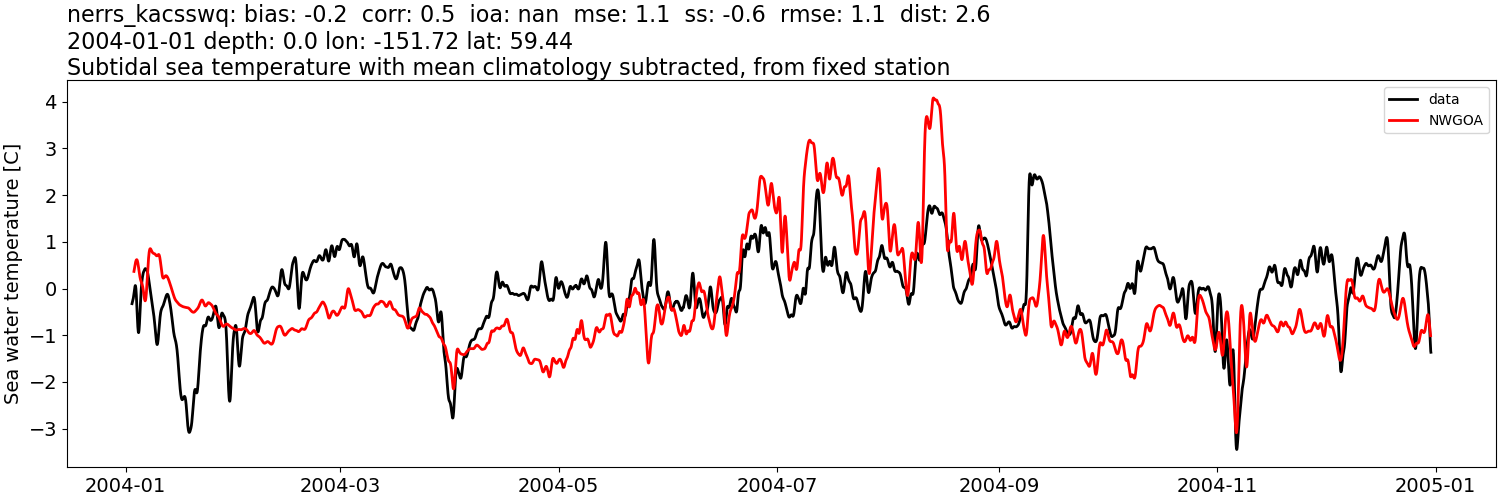
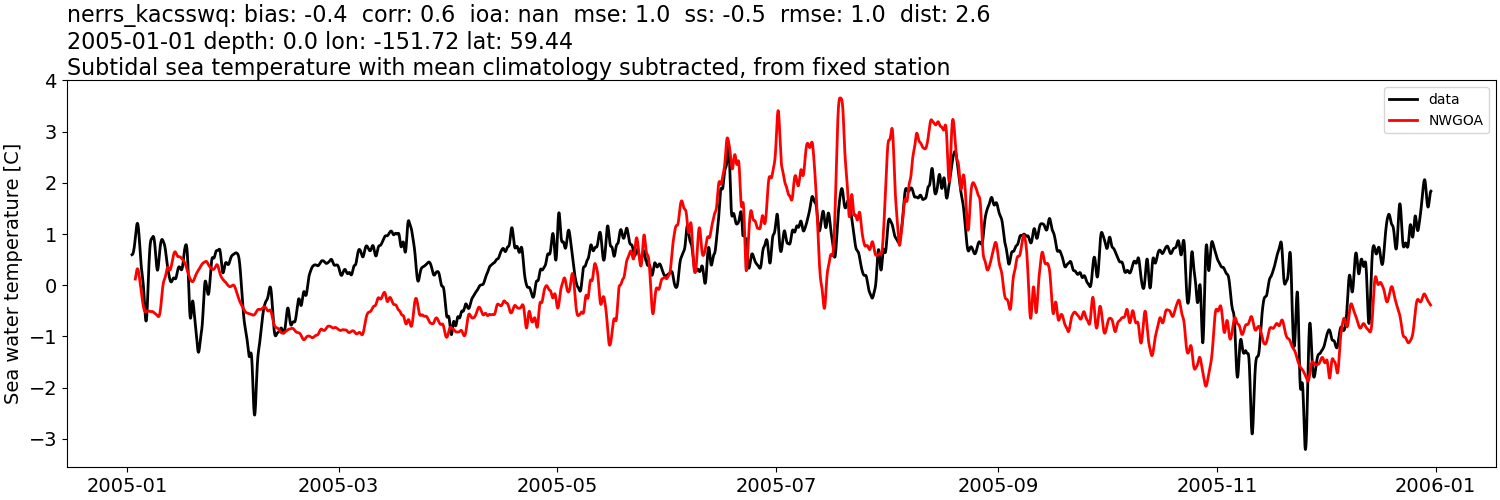
Sea water temperature: tidally-filtered, then monthly mean from data subtracted#
CIOFS#
Comparison plots by year
2004
2005
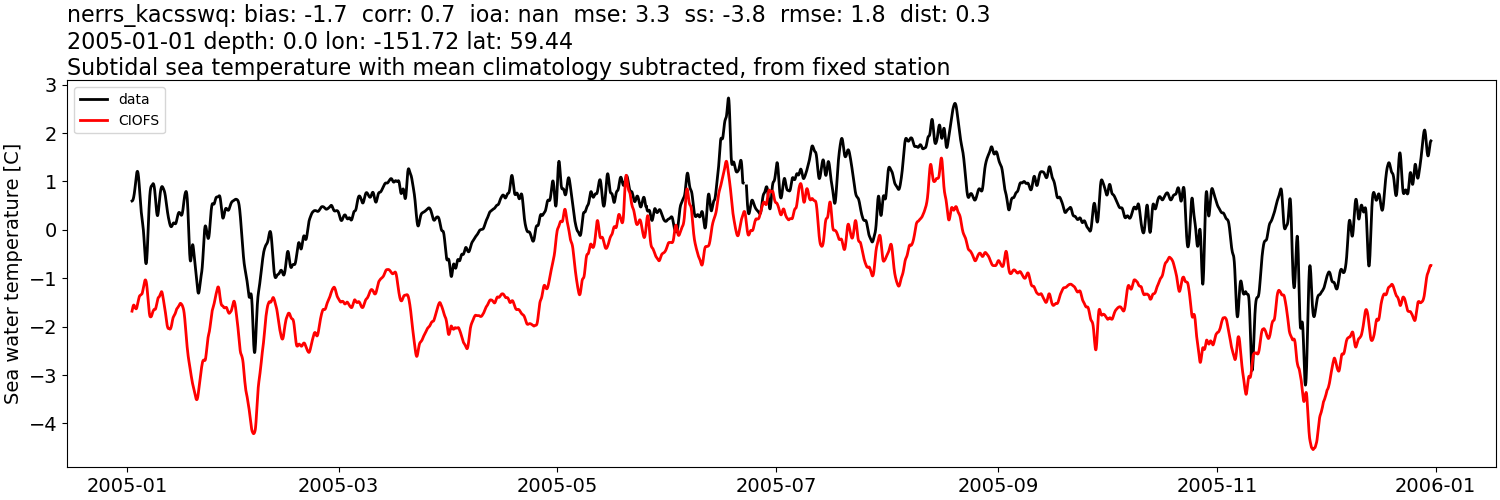
2006
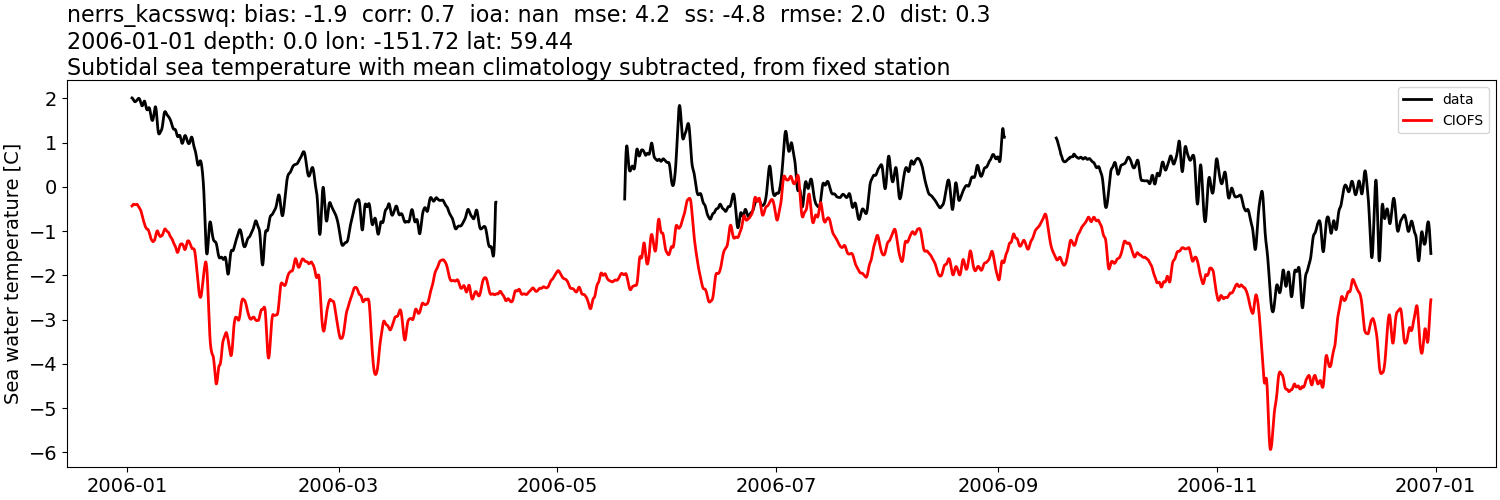
2007
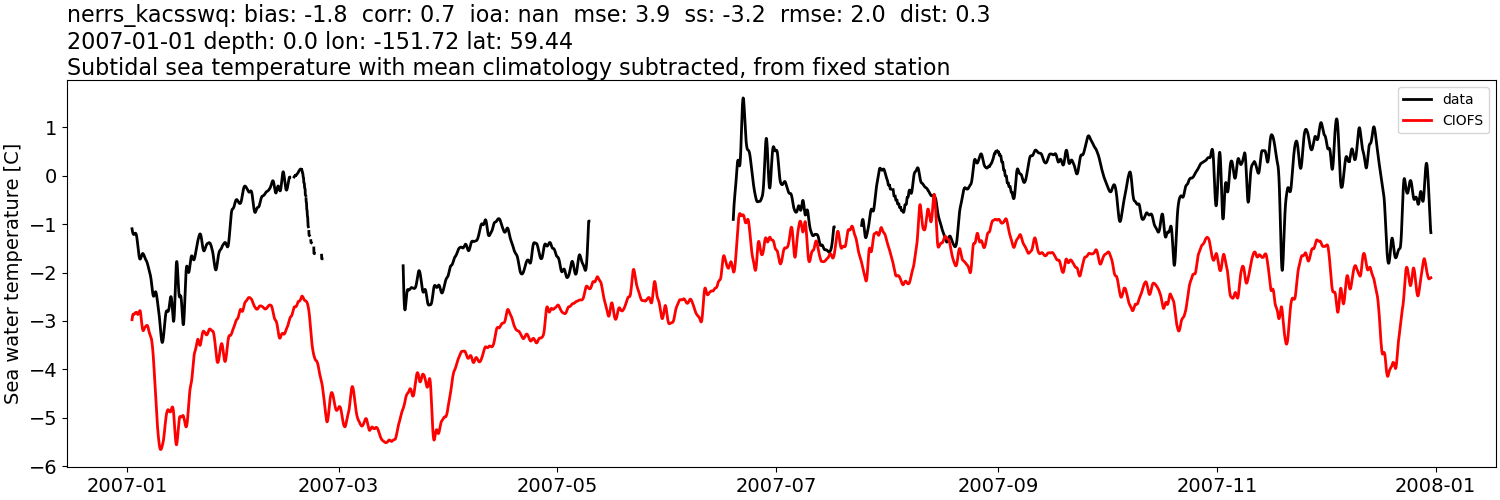
2008
2009
2010
2011
2012
2013
2014
2015
2016
2017
2018
2019
2020
2021
2022
NWGOA#
Comparison plots by year
2004
2005
2006
2007
2008